Free VPD Chart Templates (PDF)
DataTemplates
FAQ
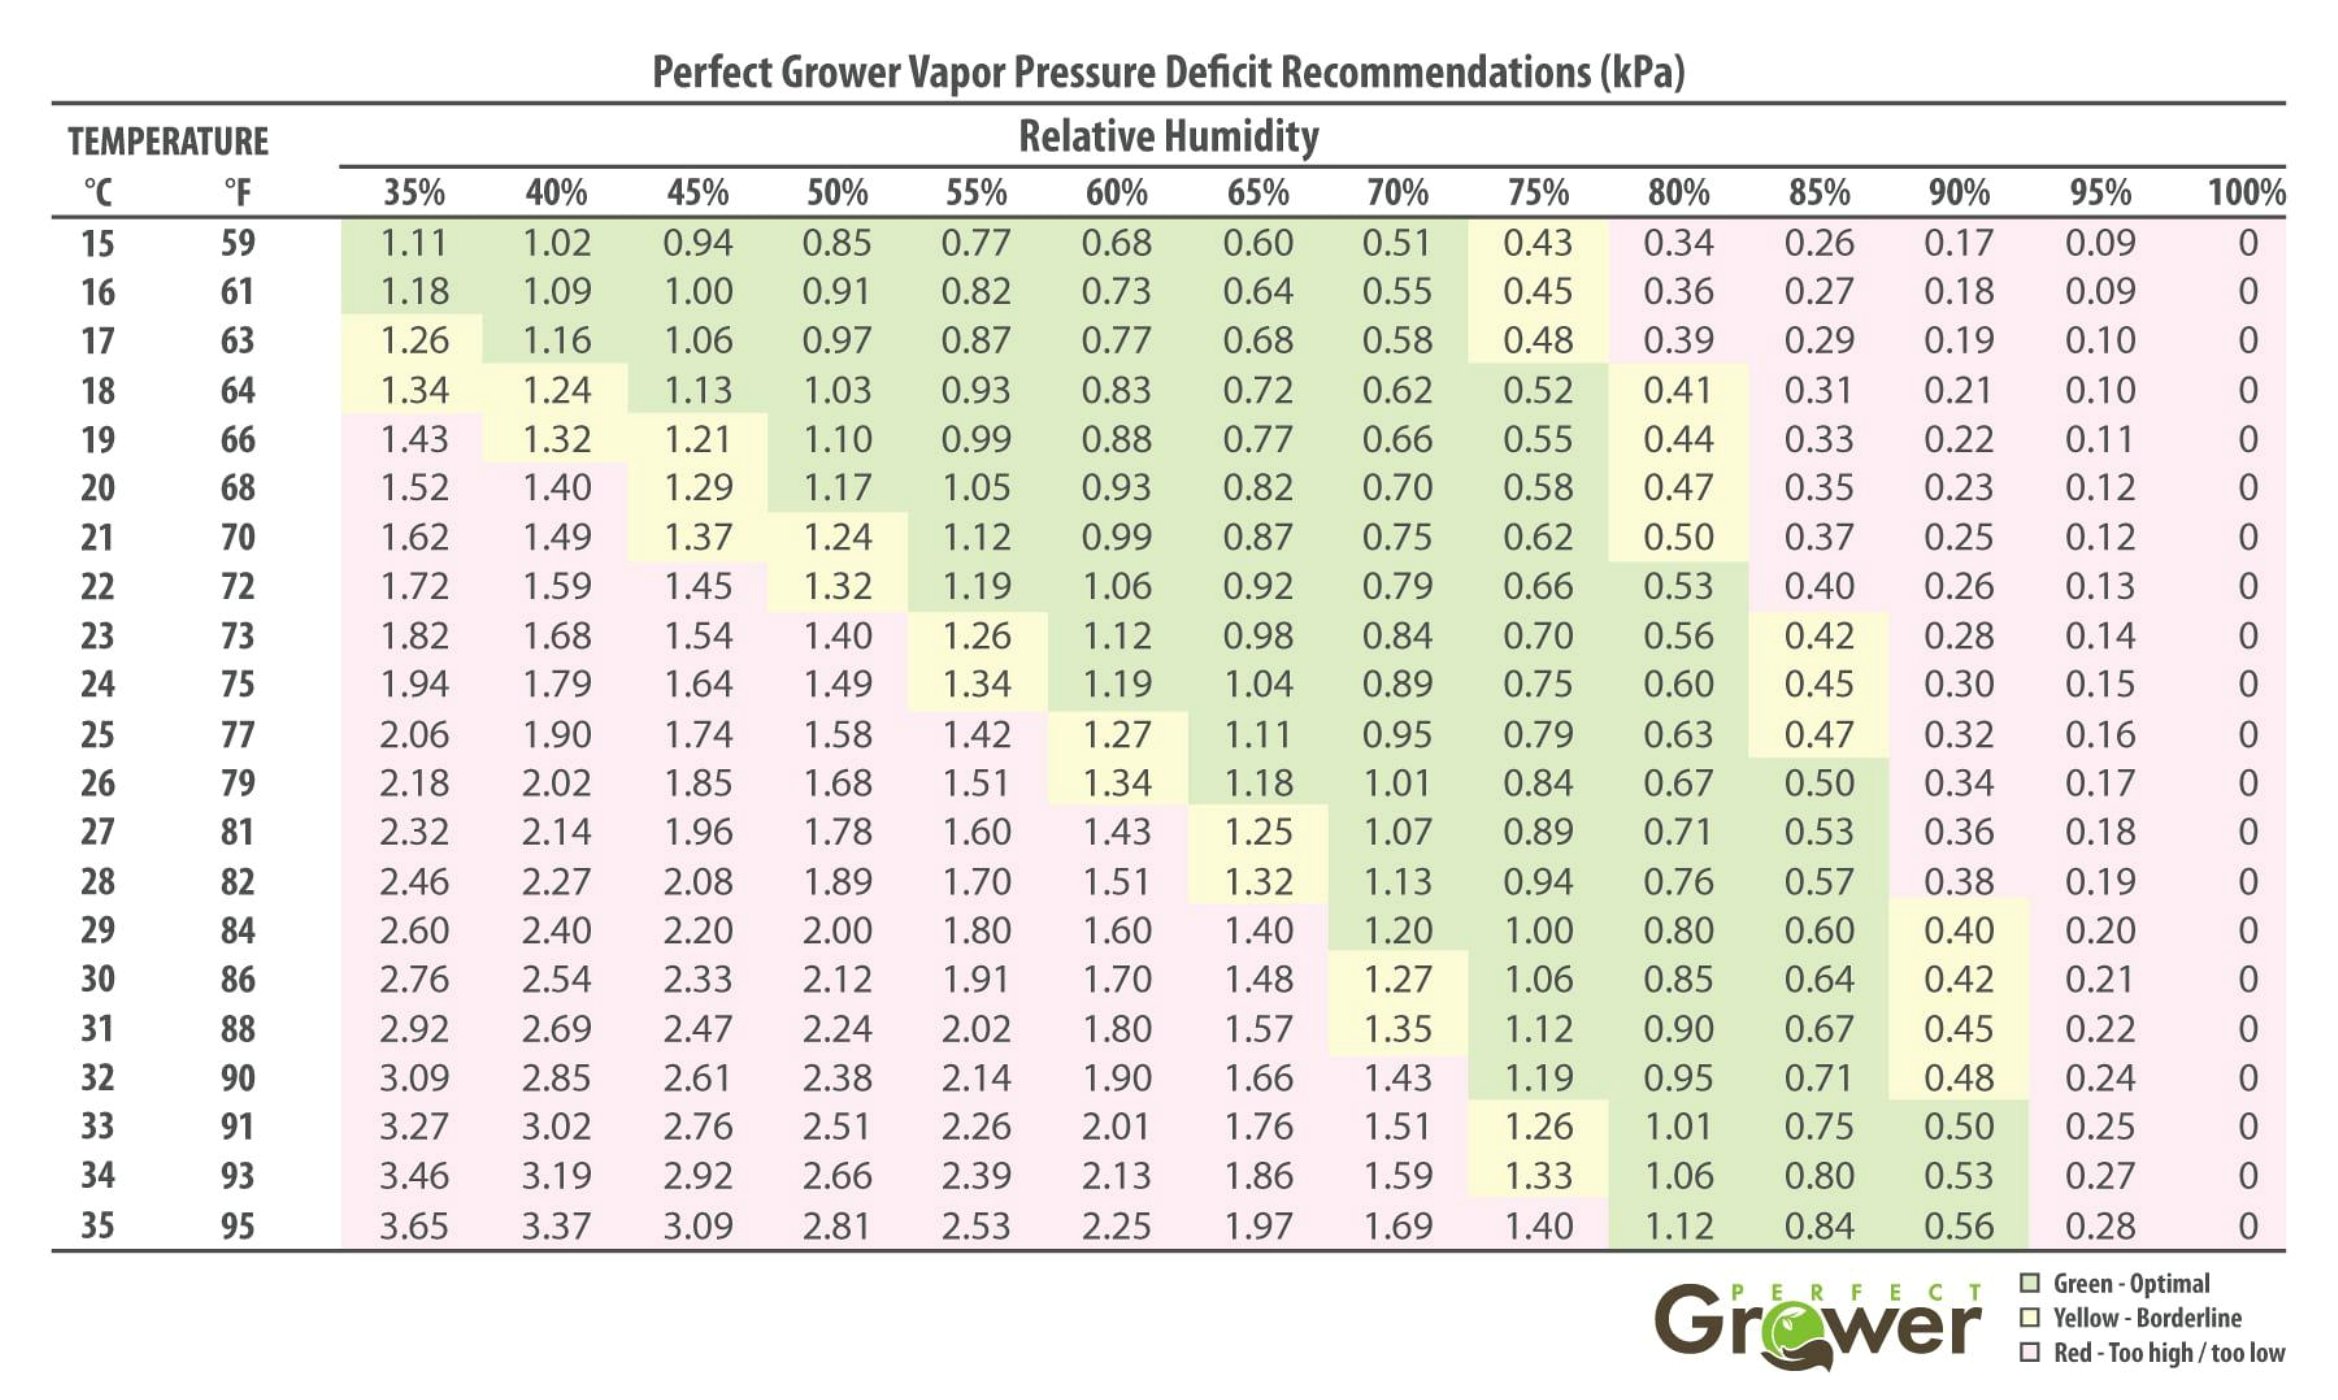
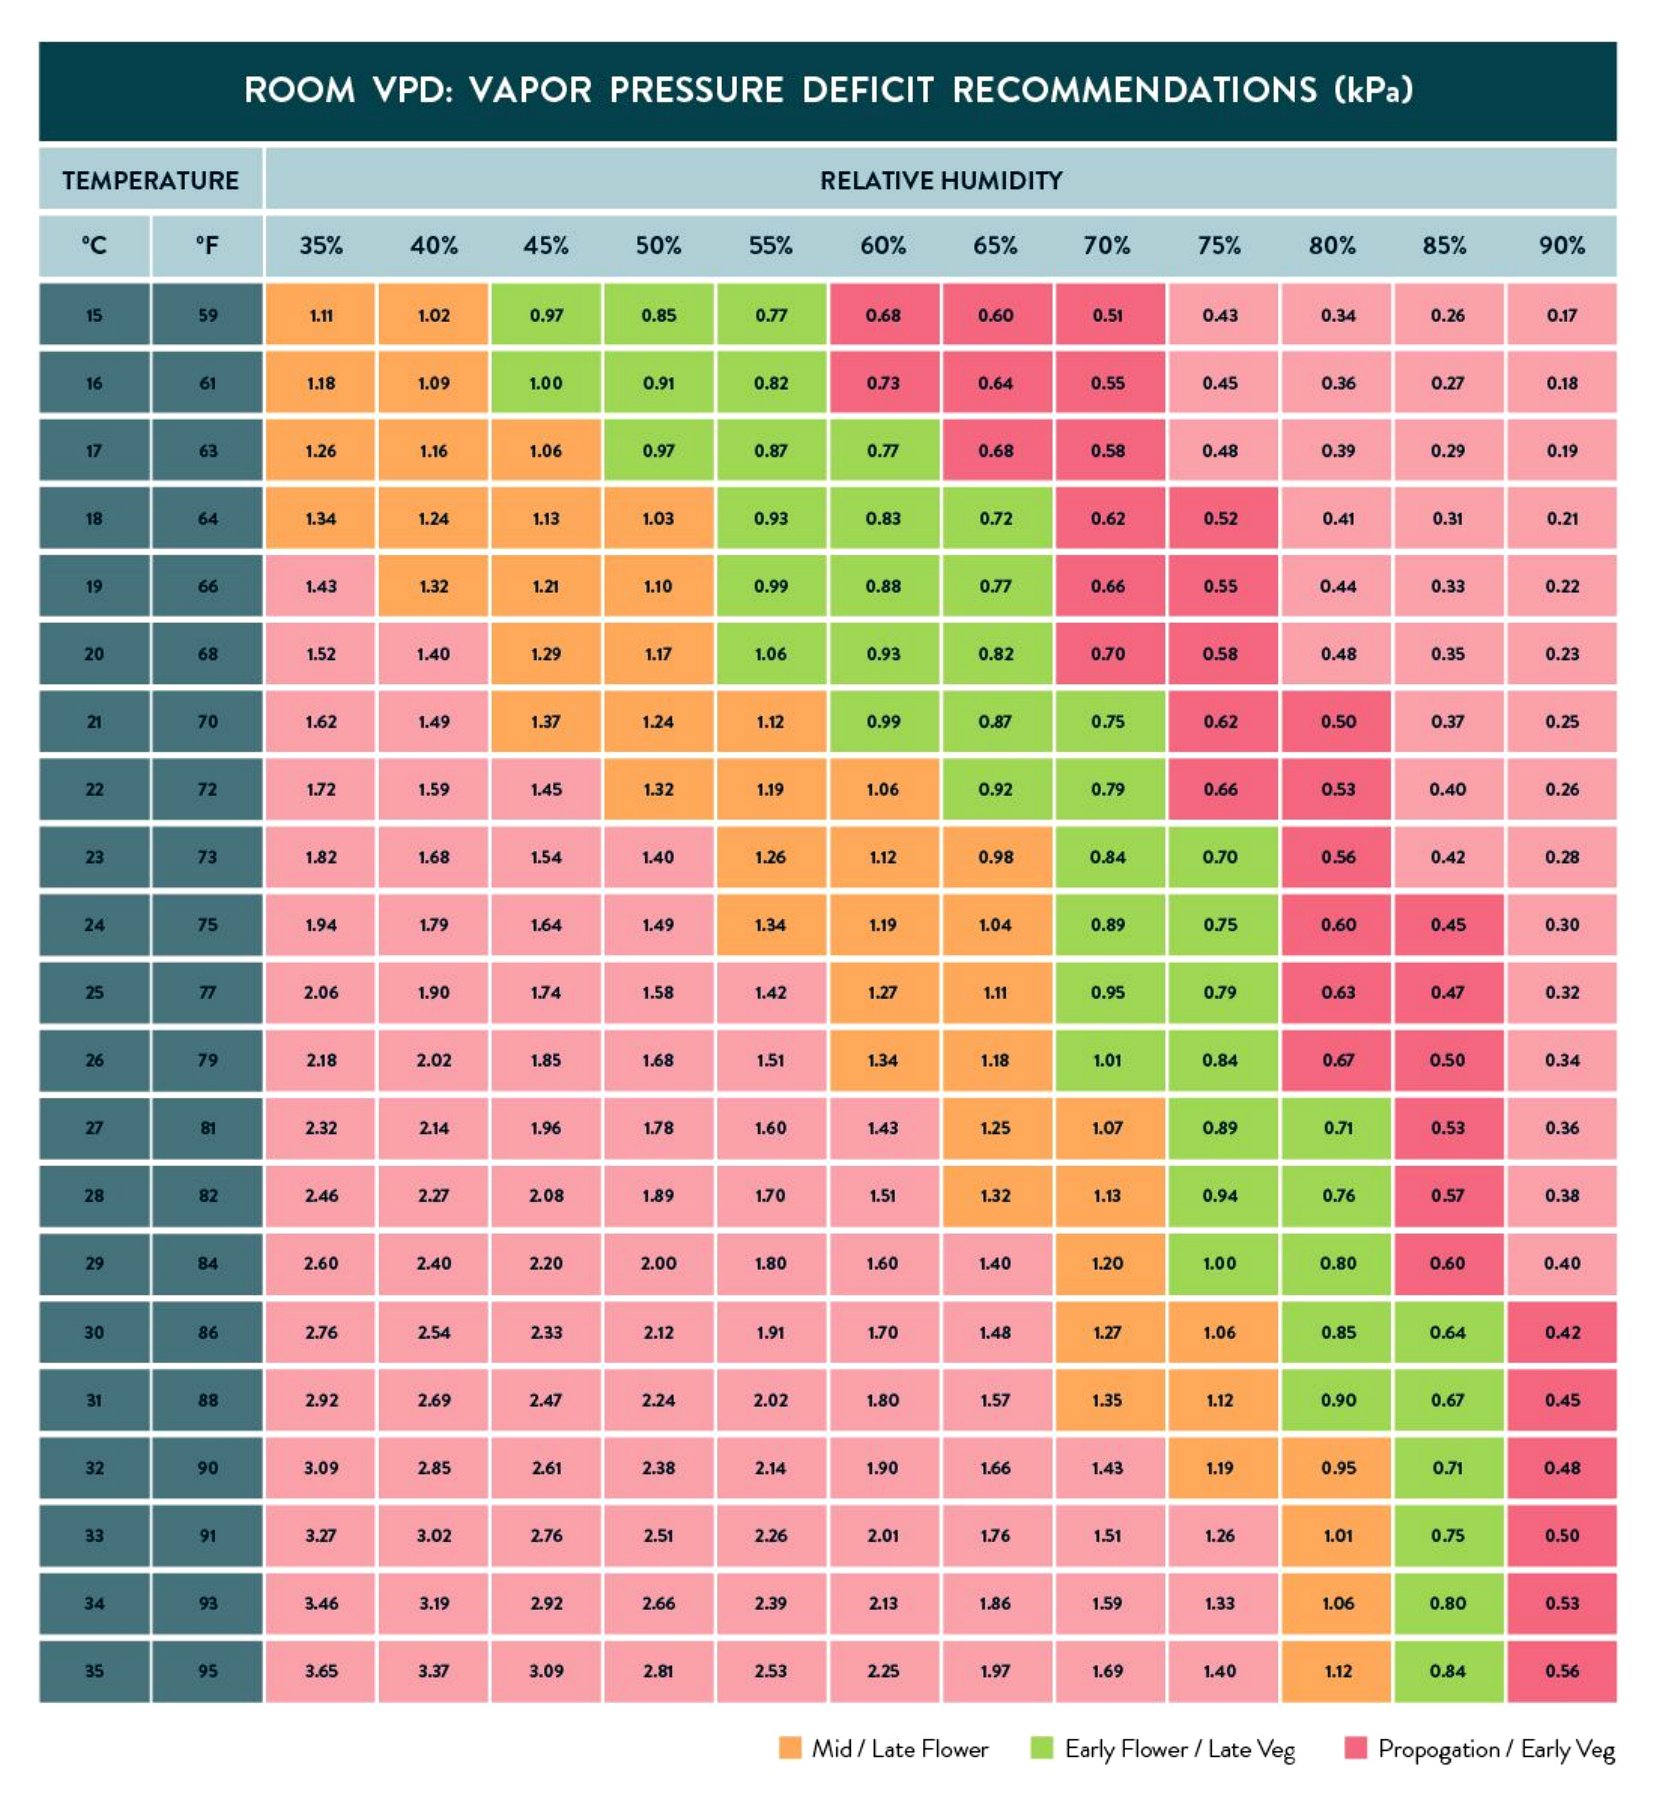
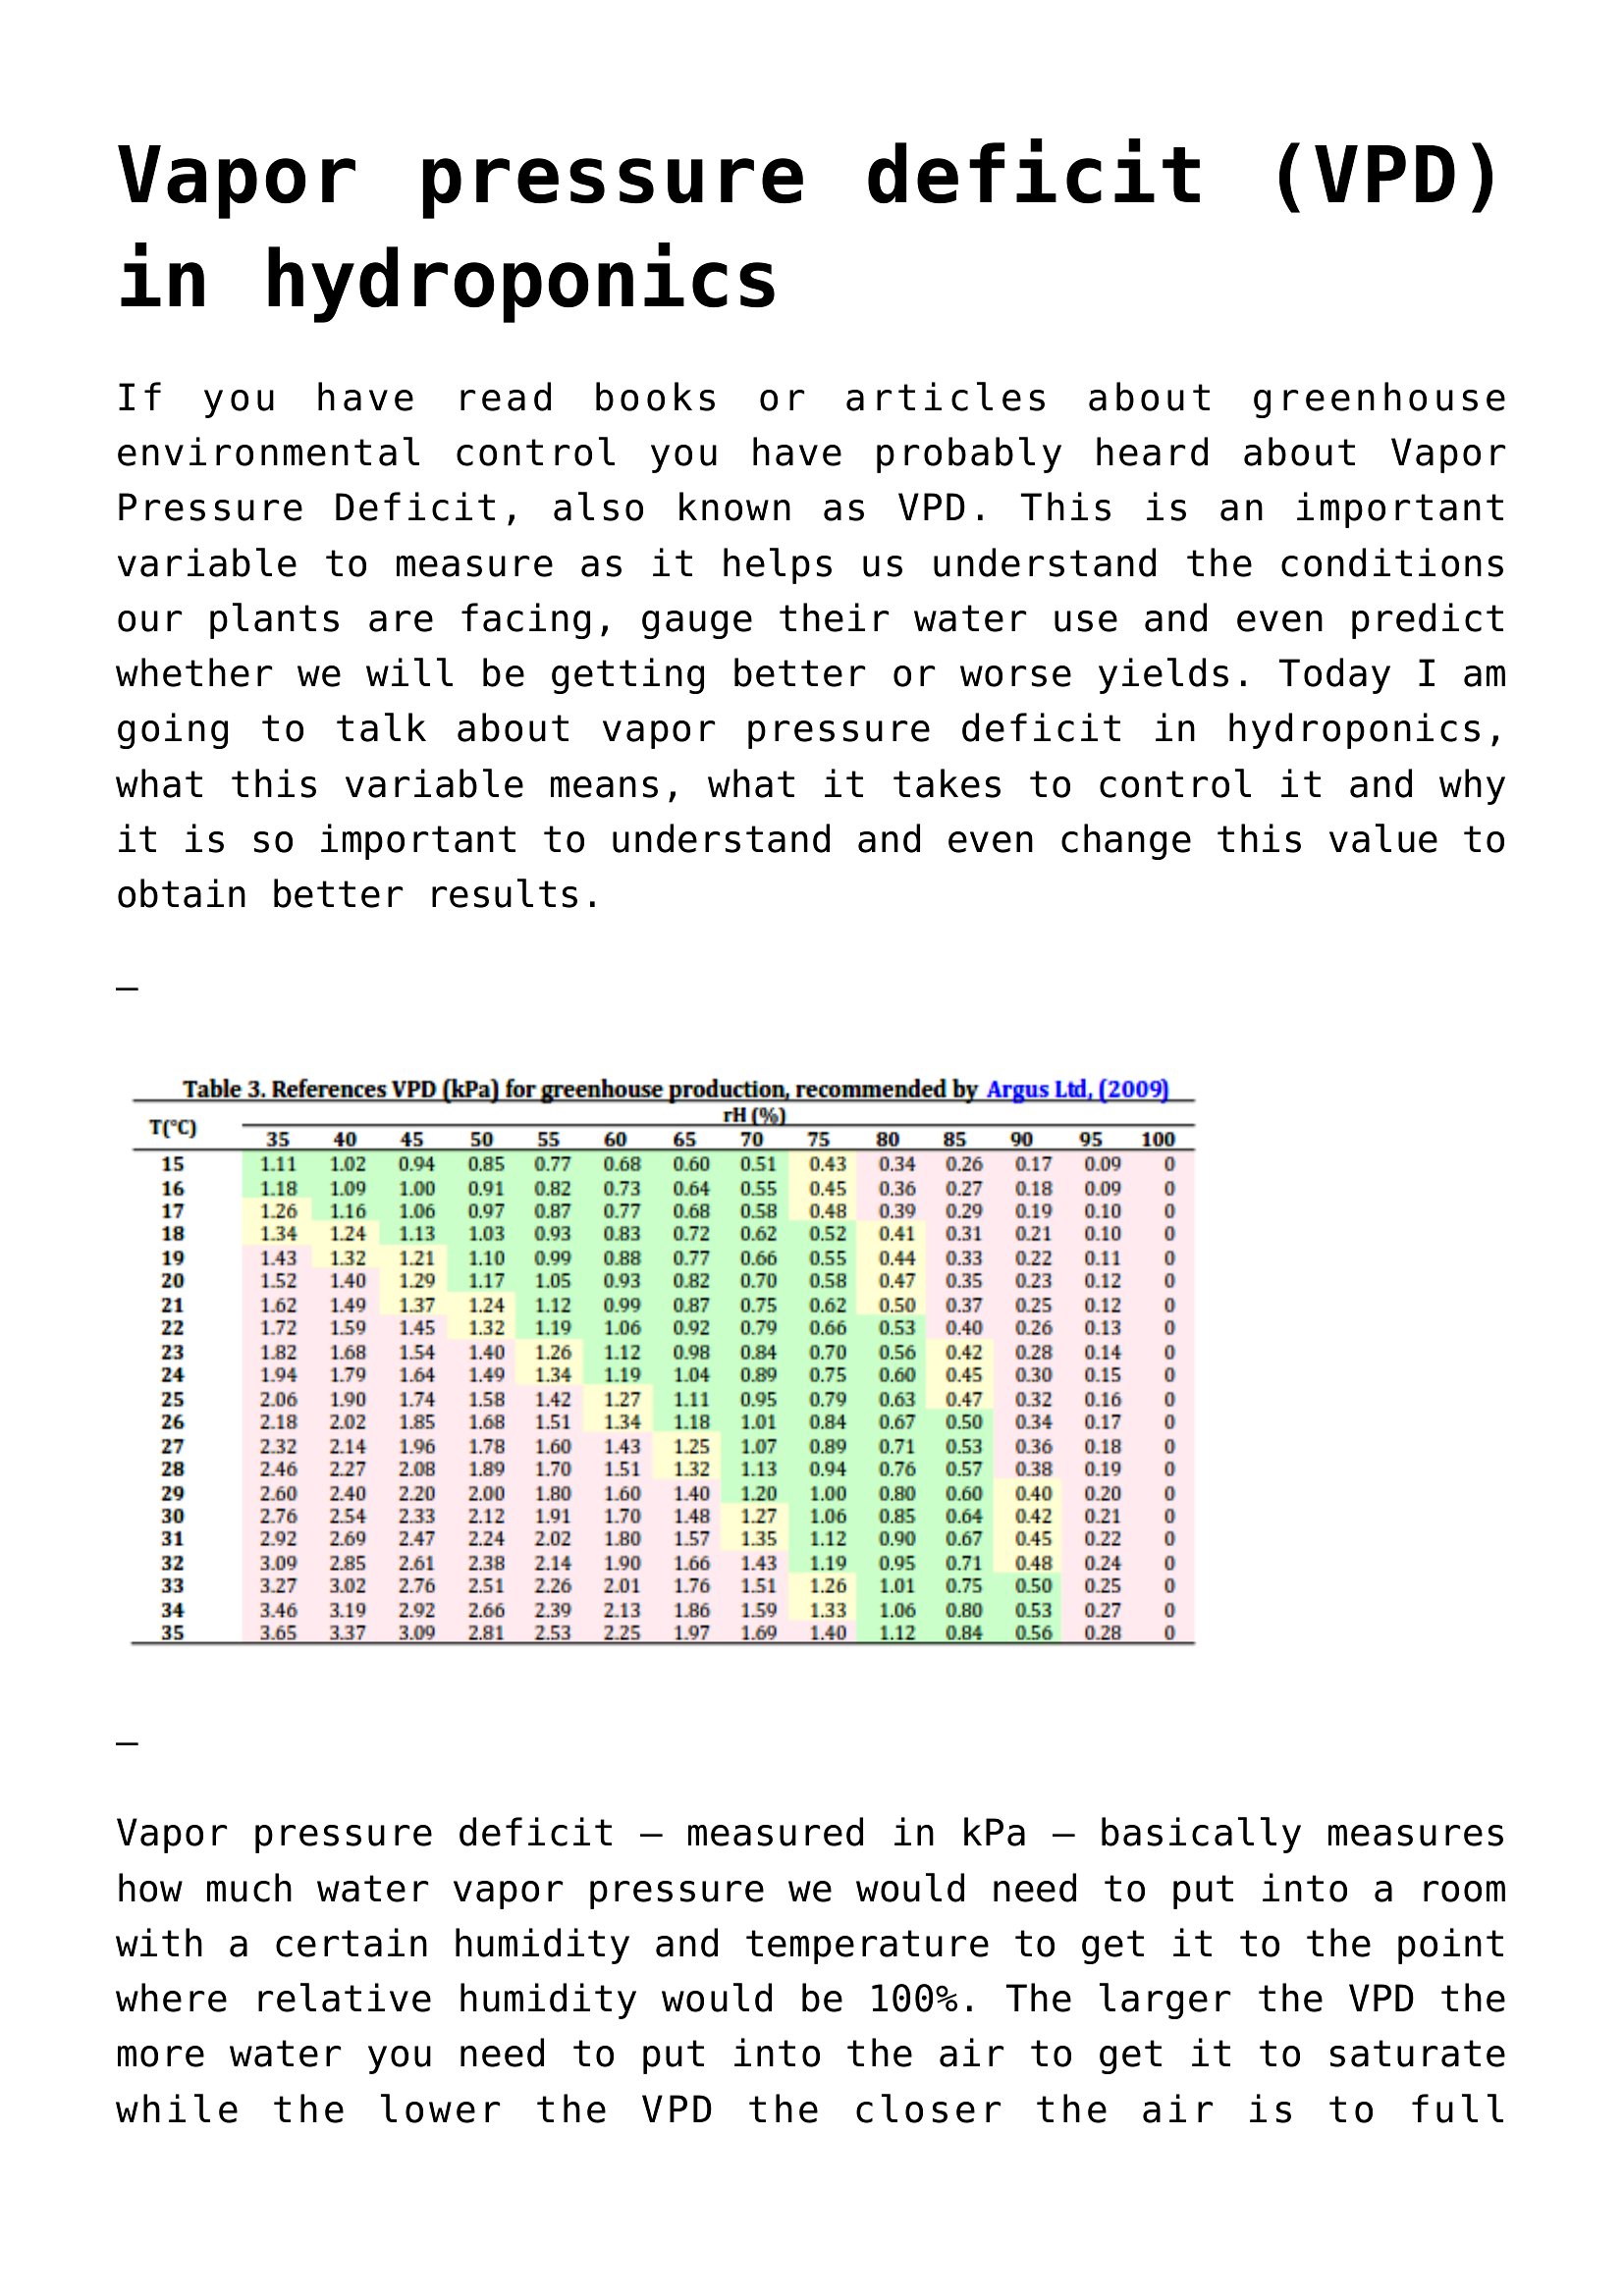
Can these charts help me decide when to open or close vents automatically?
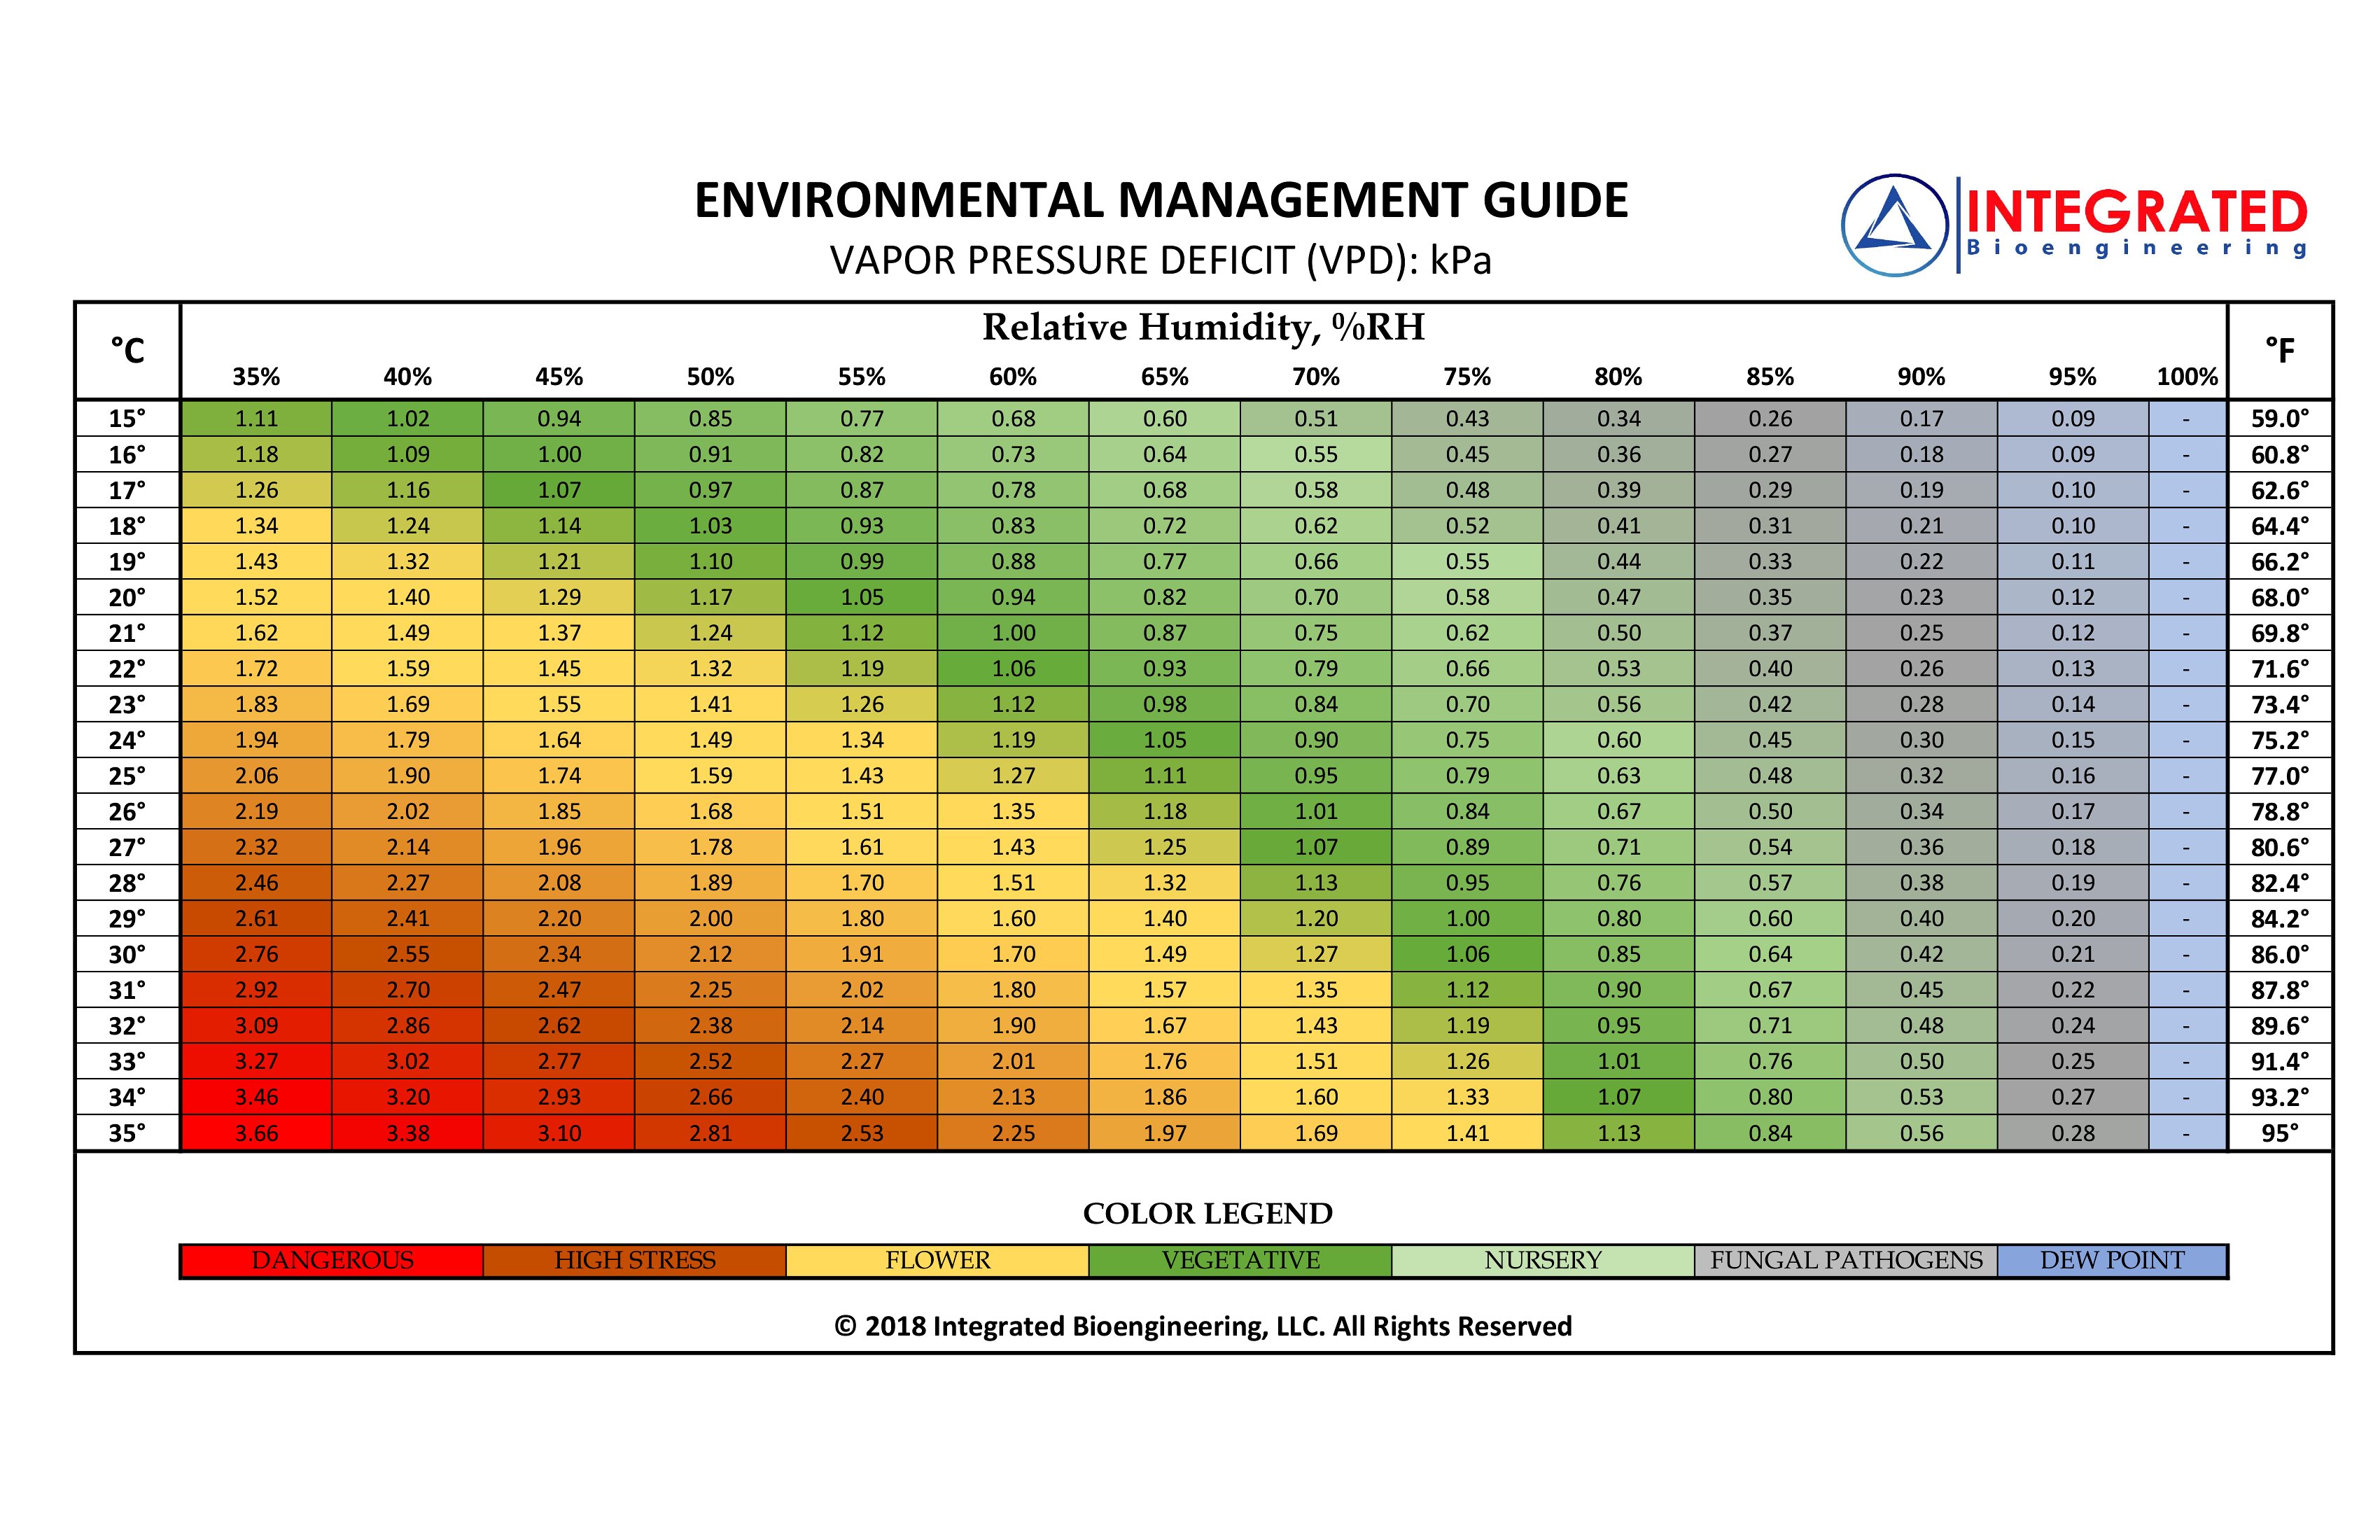
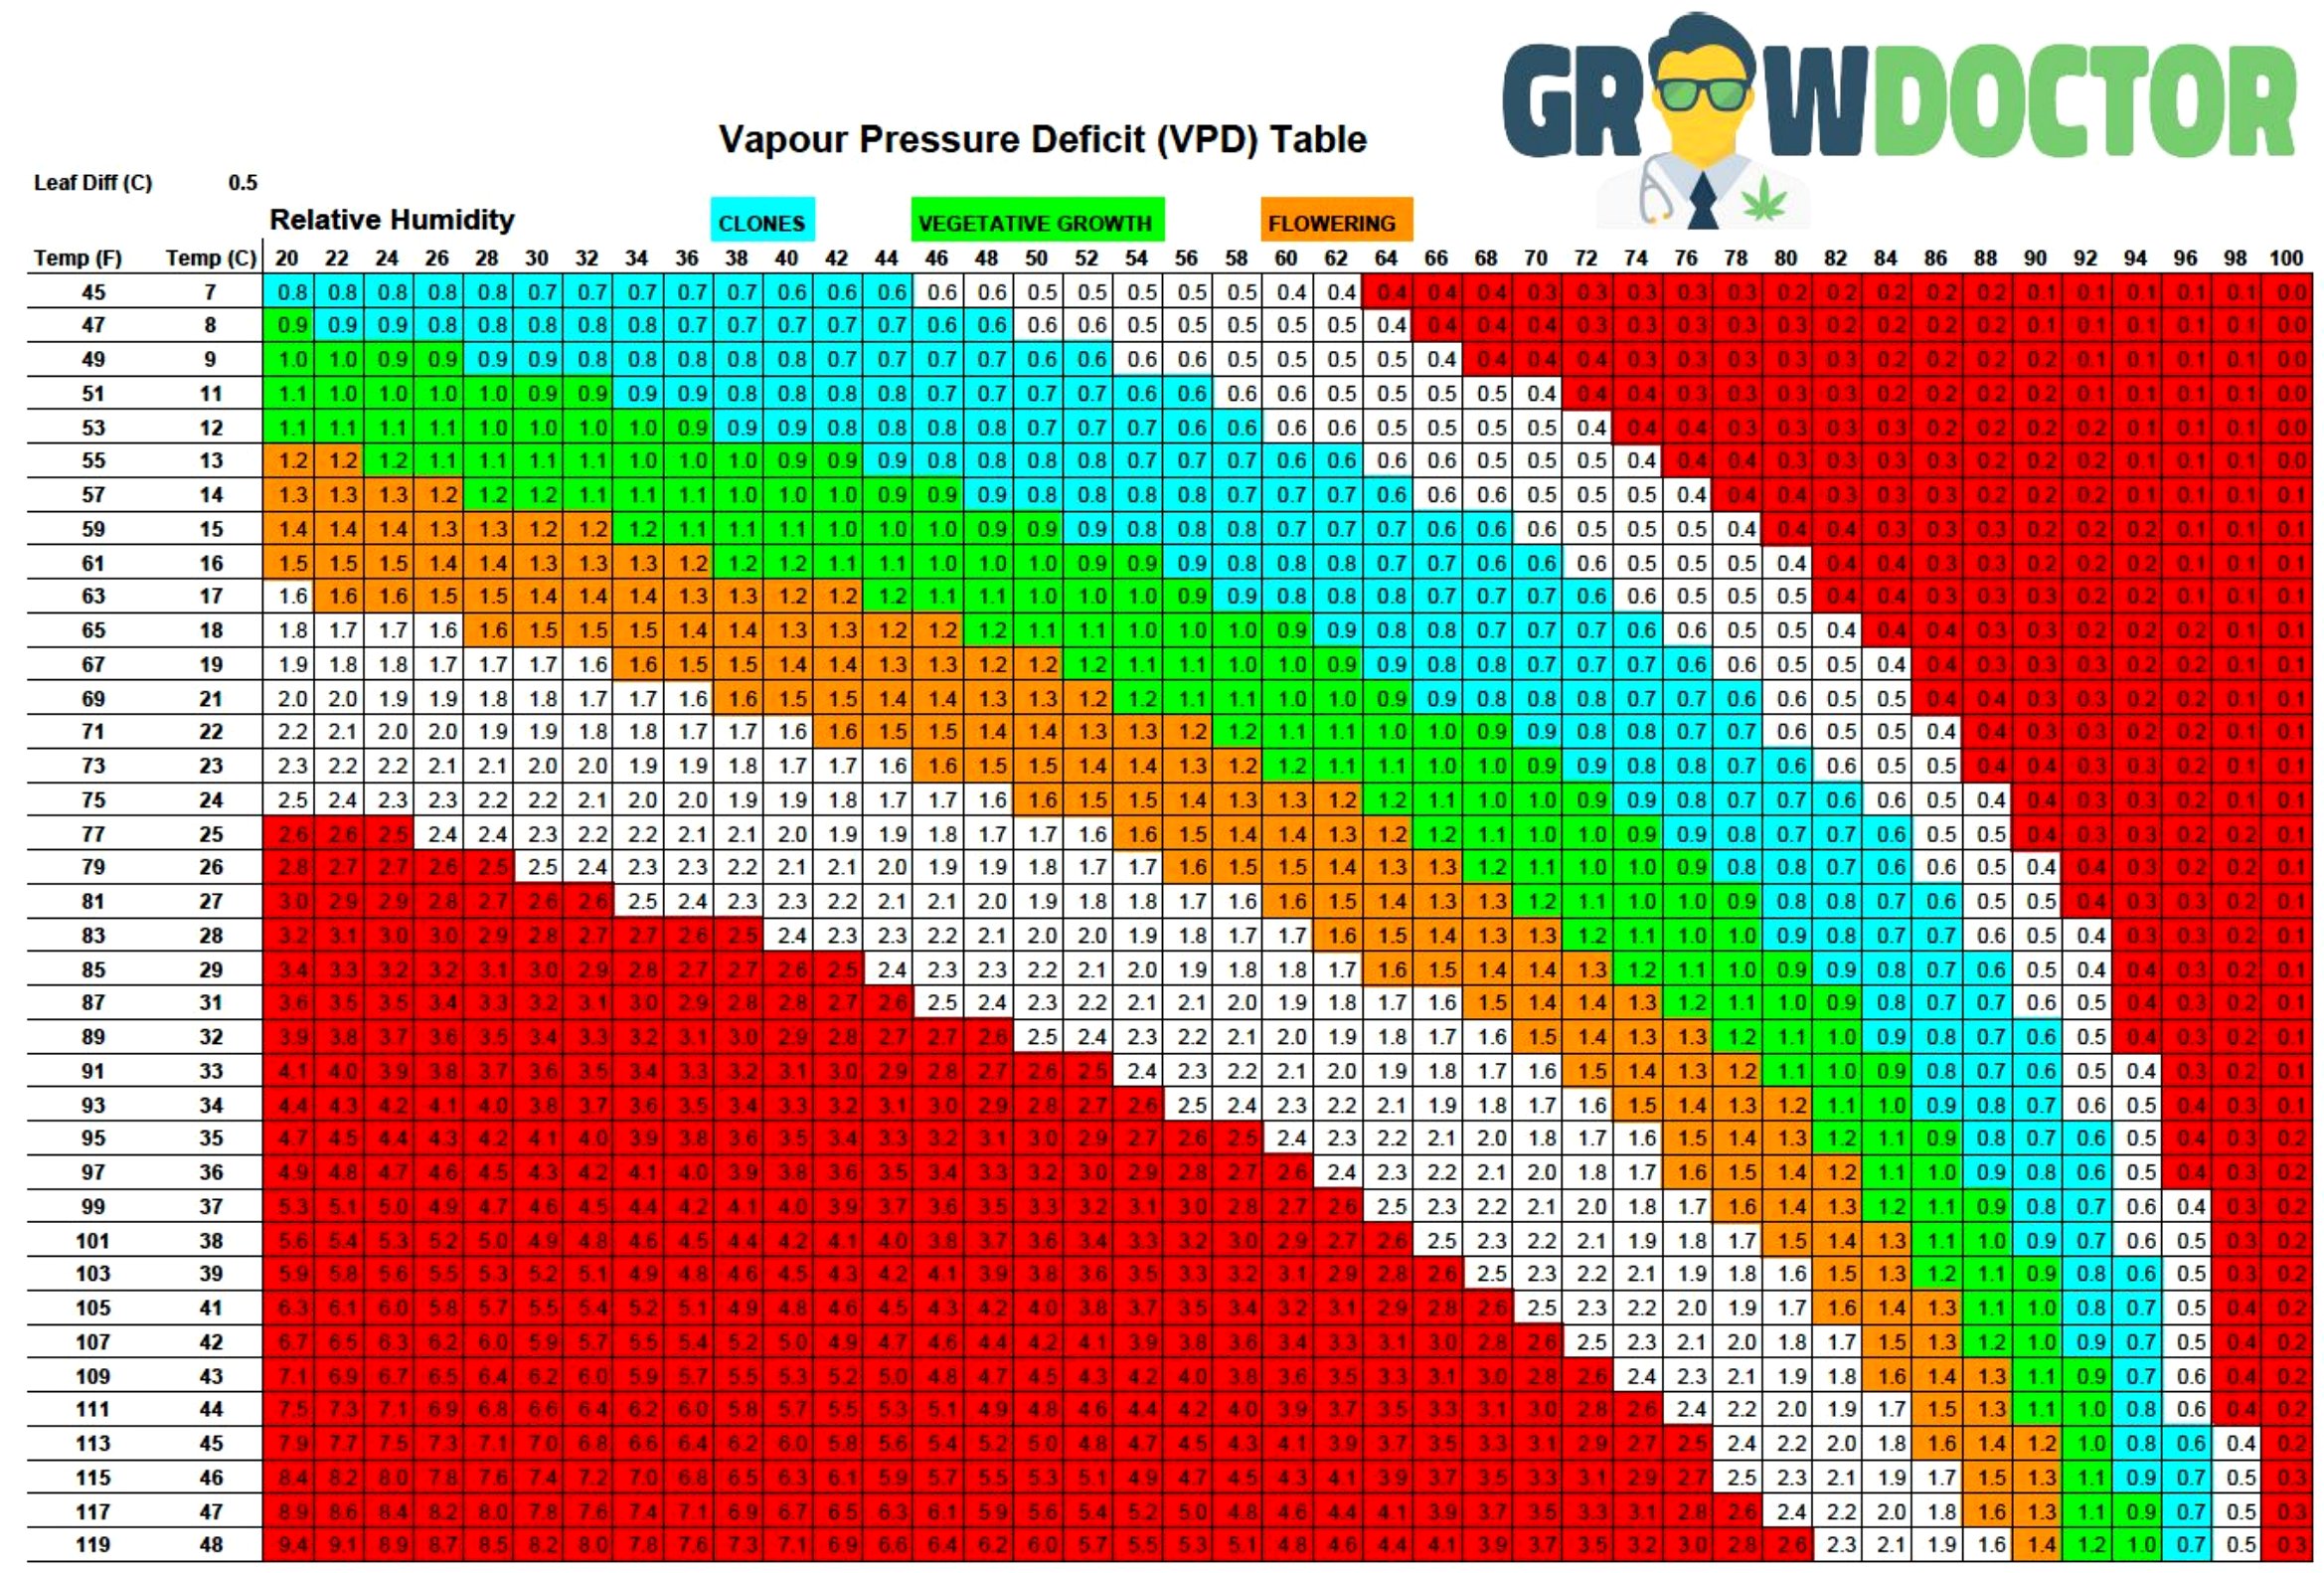
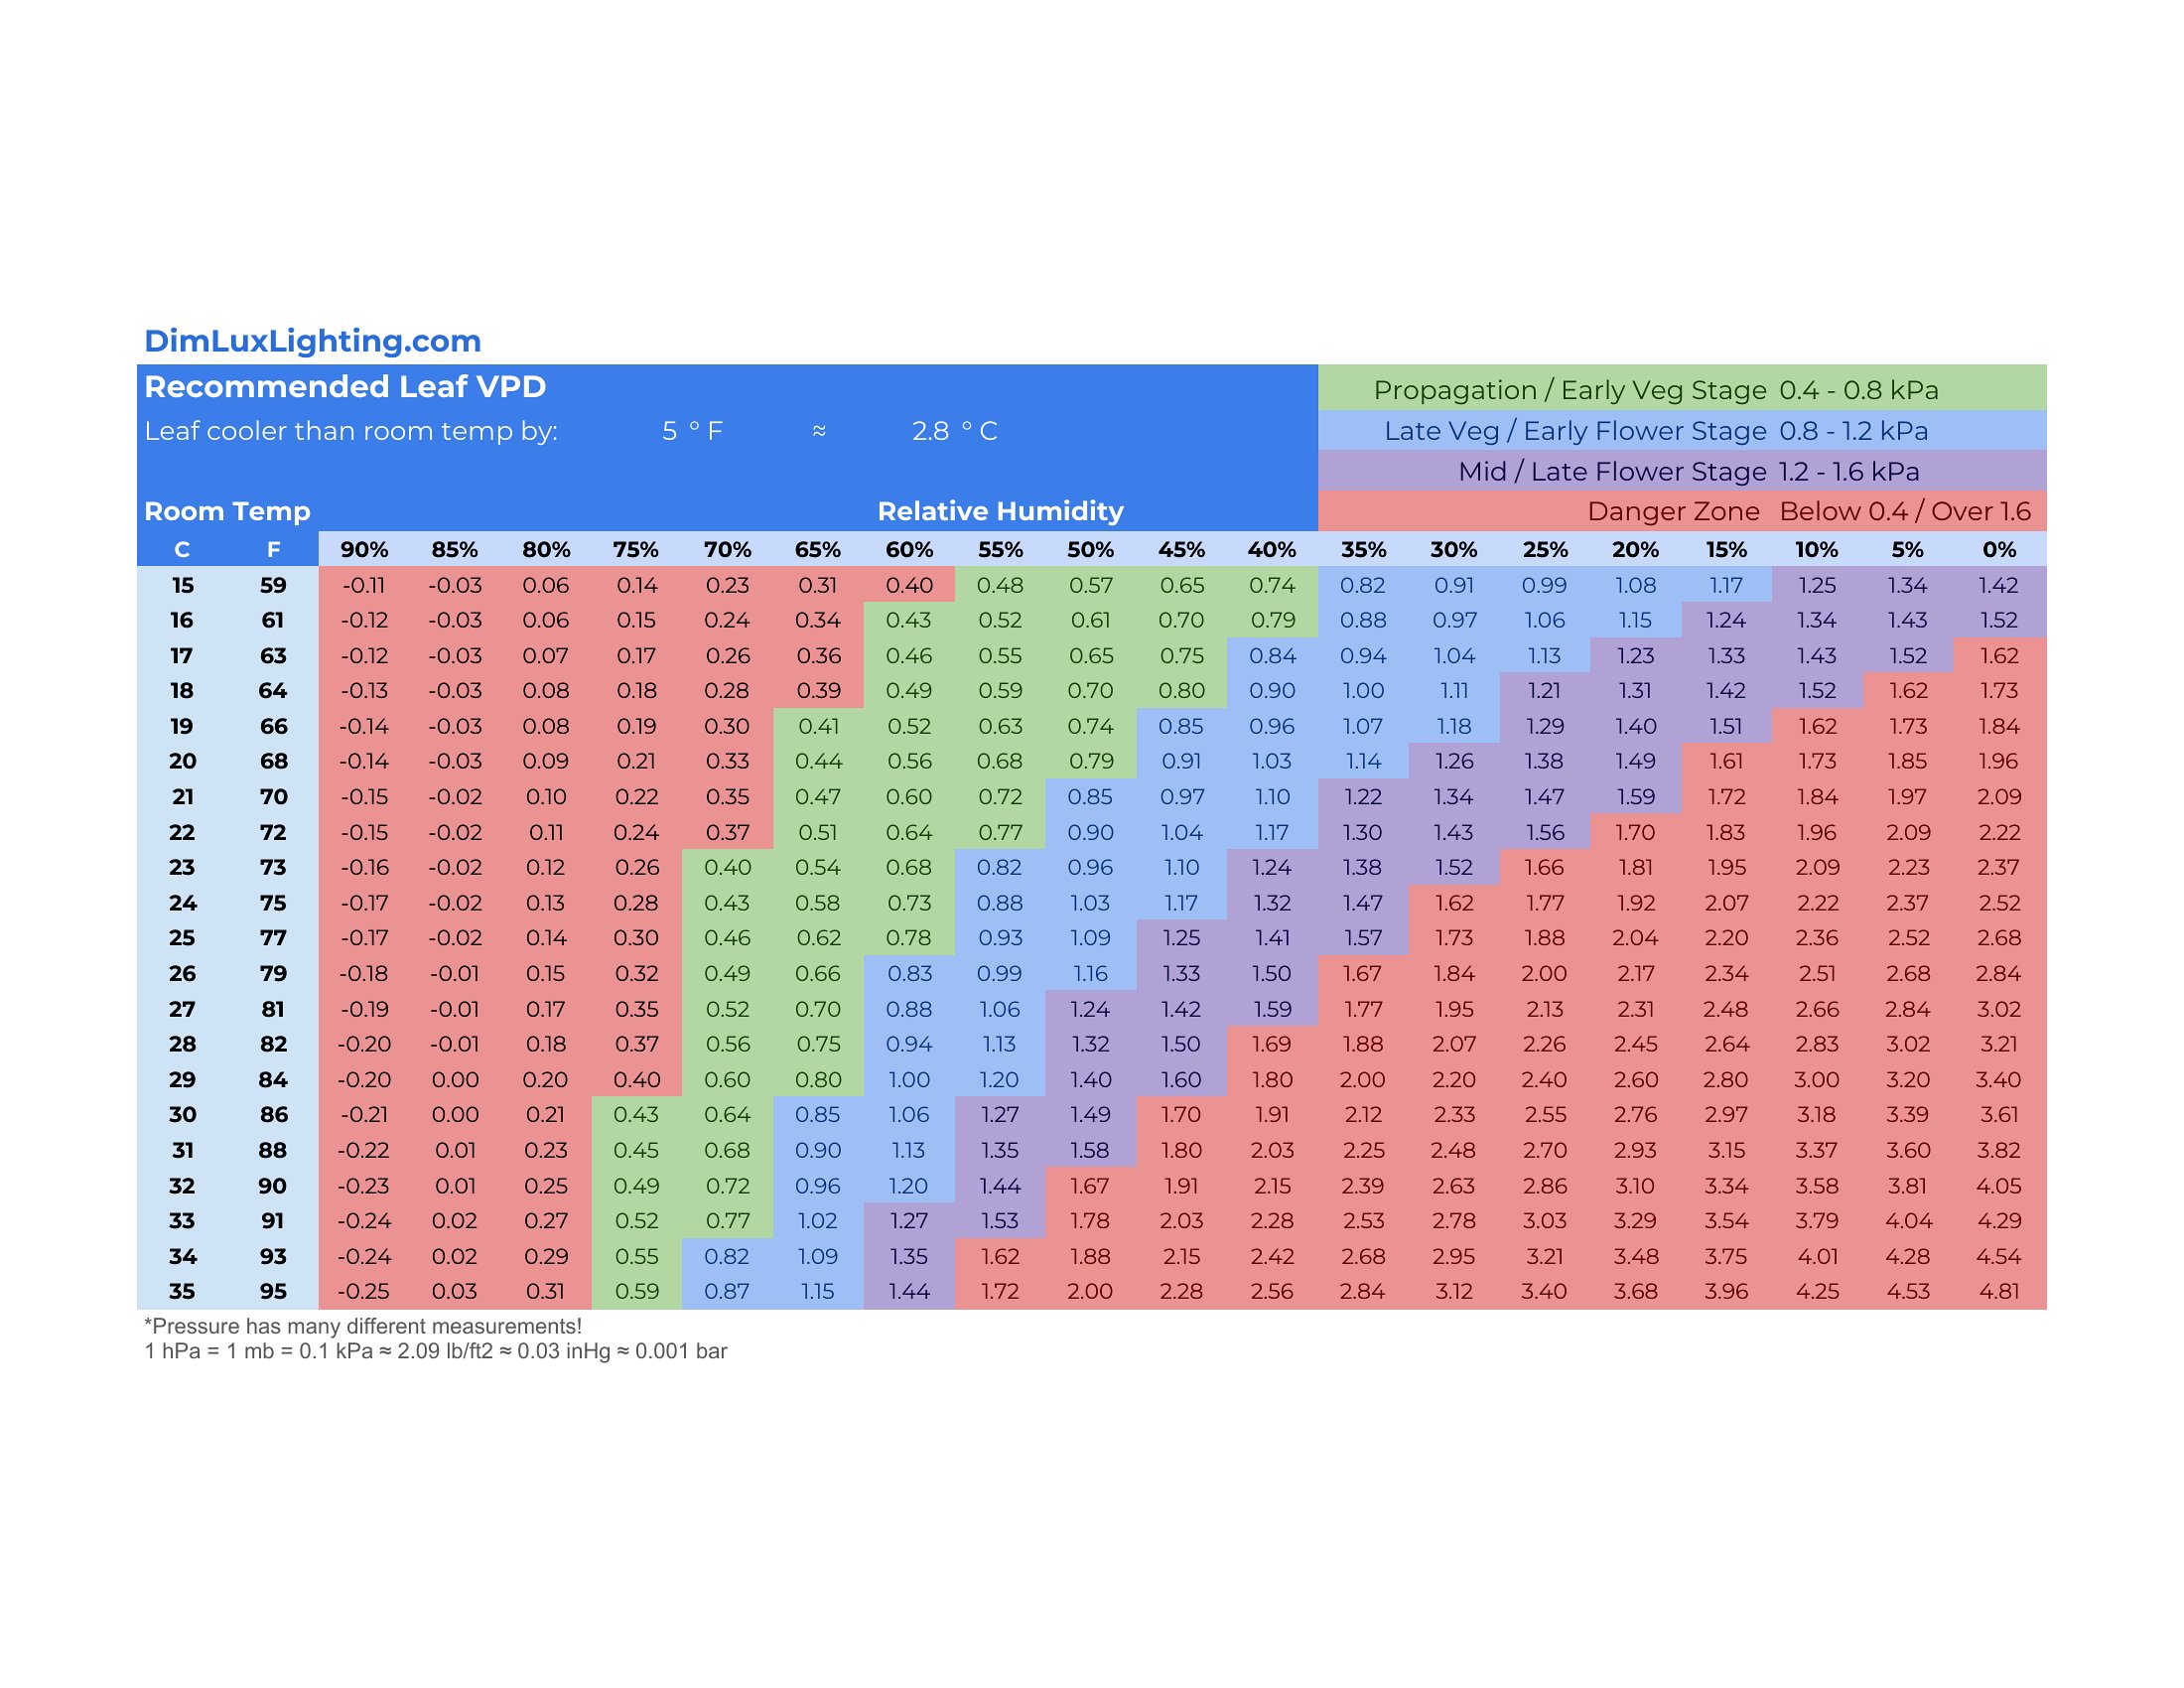
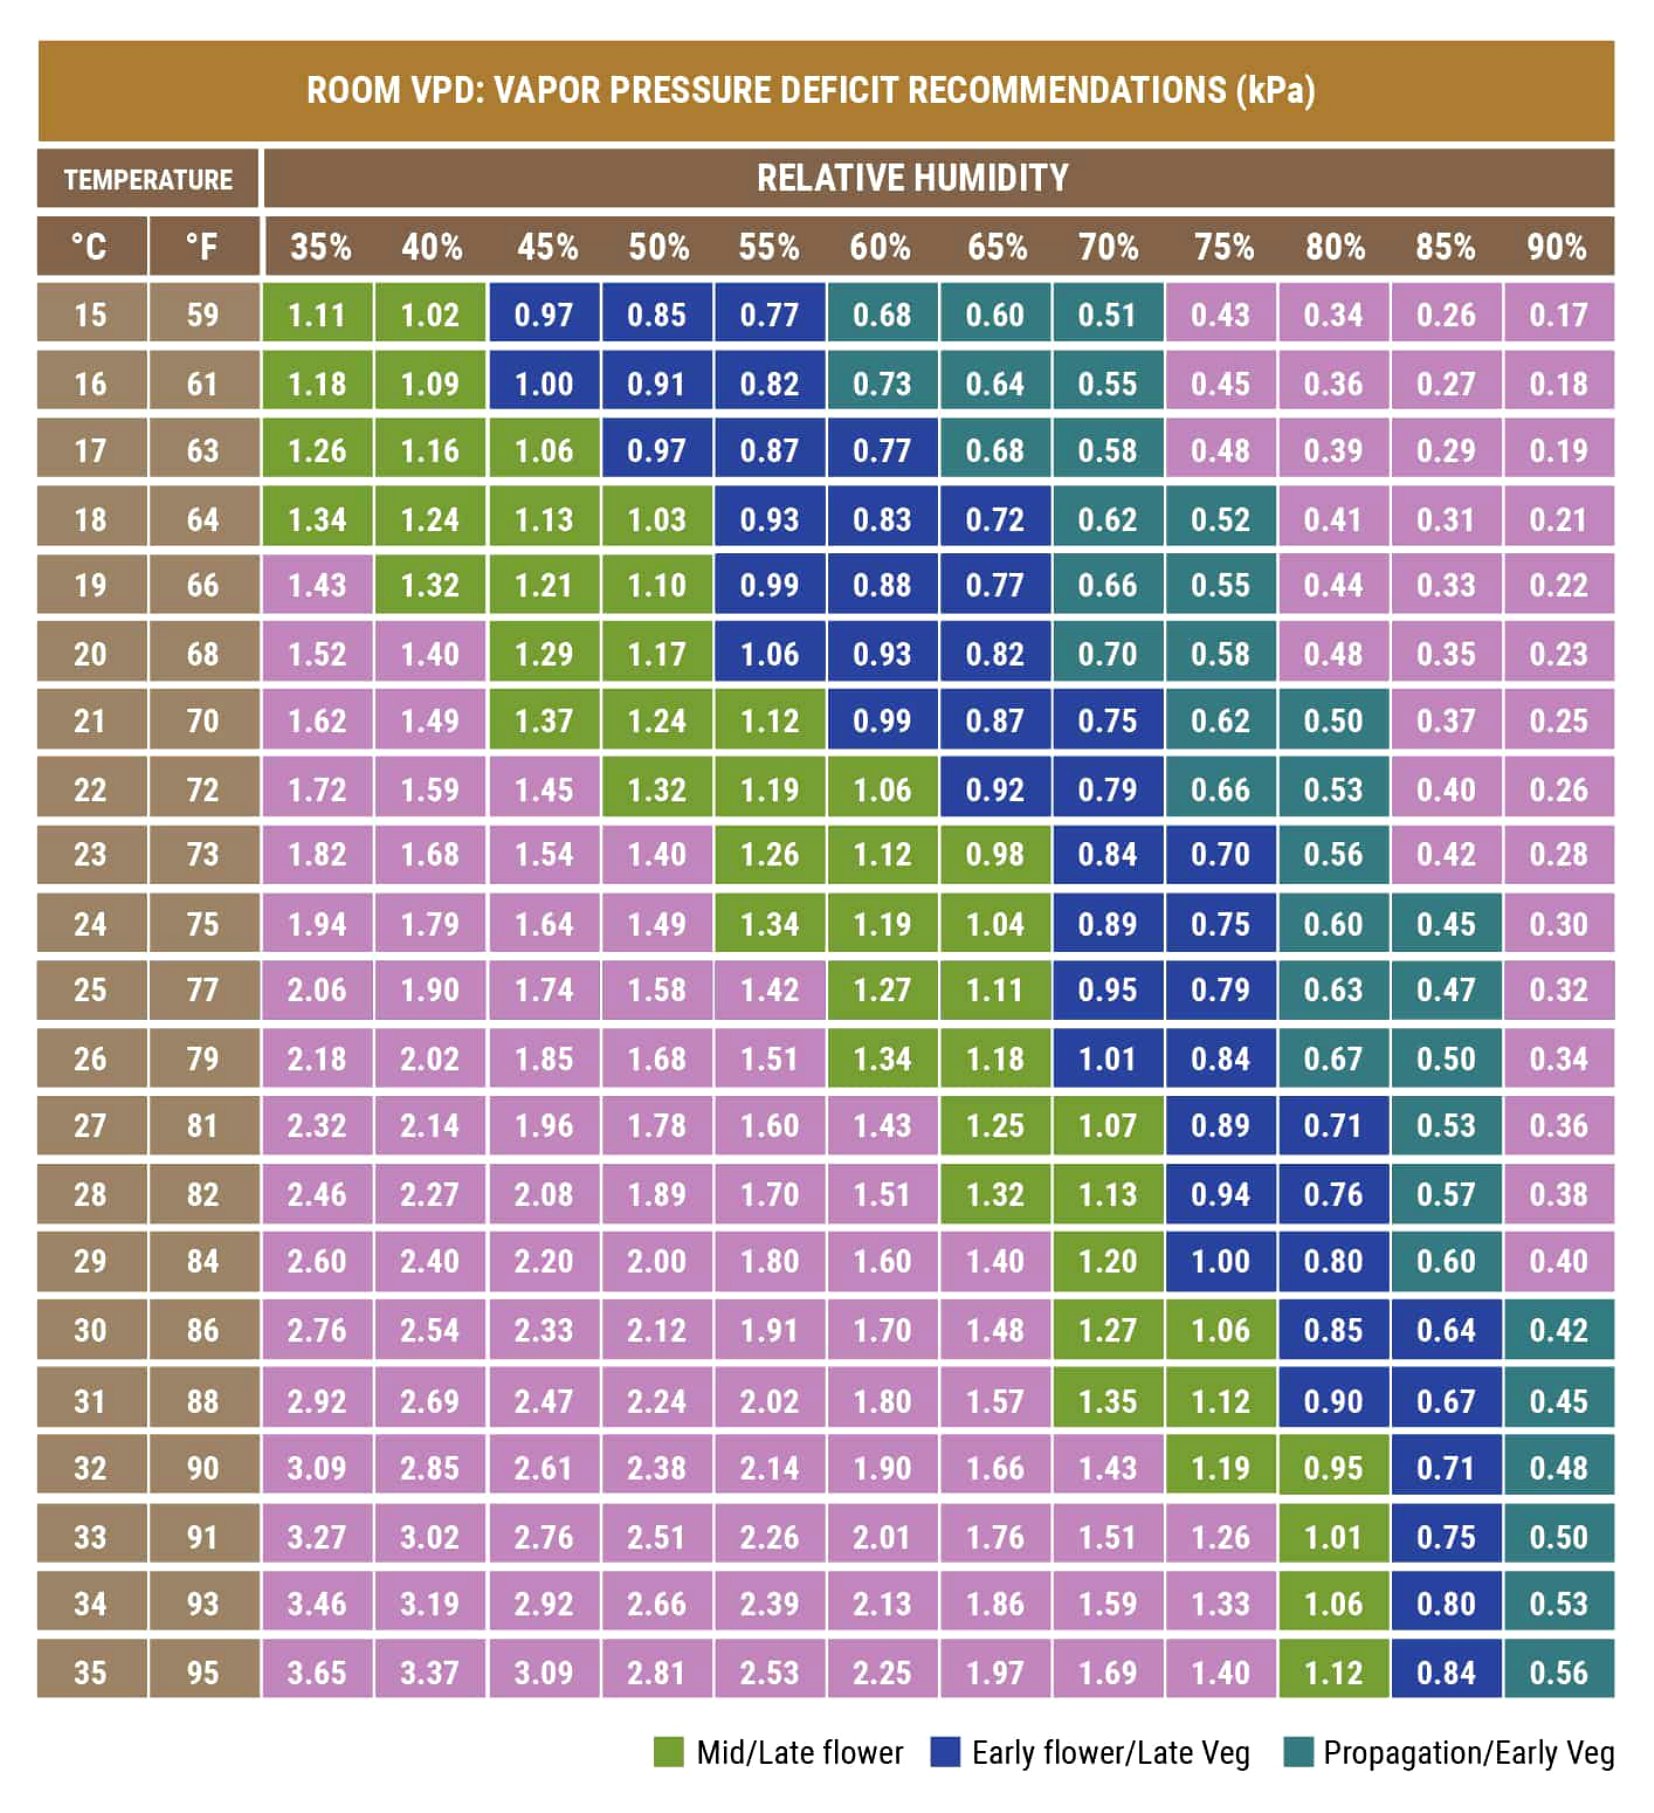
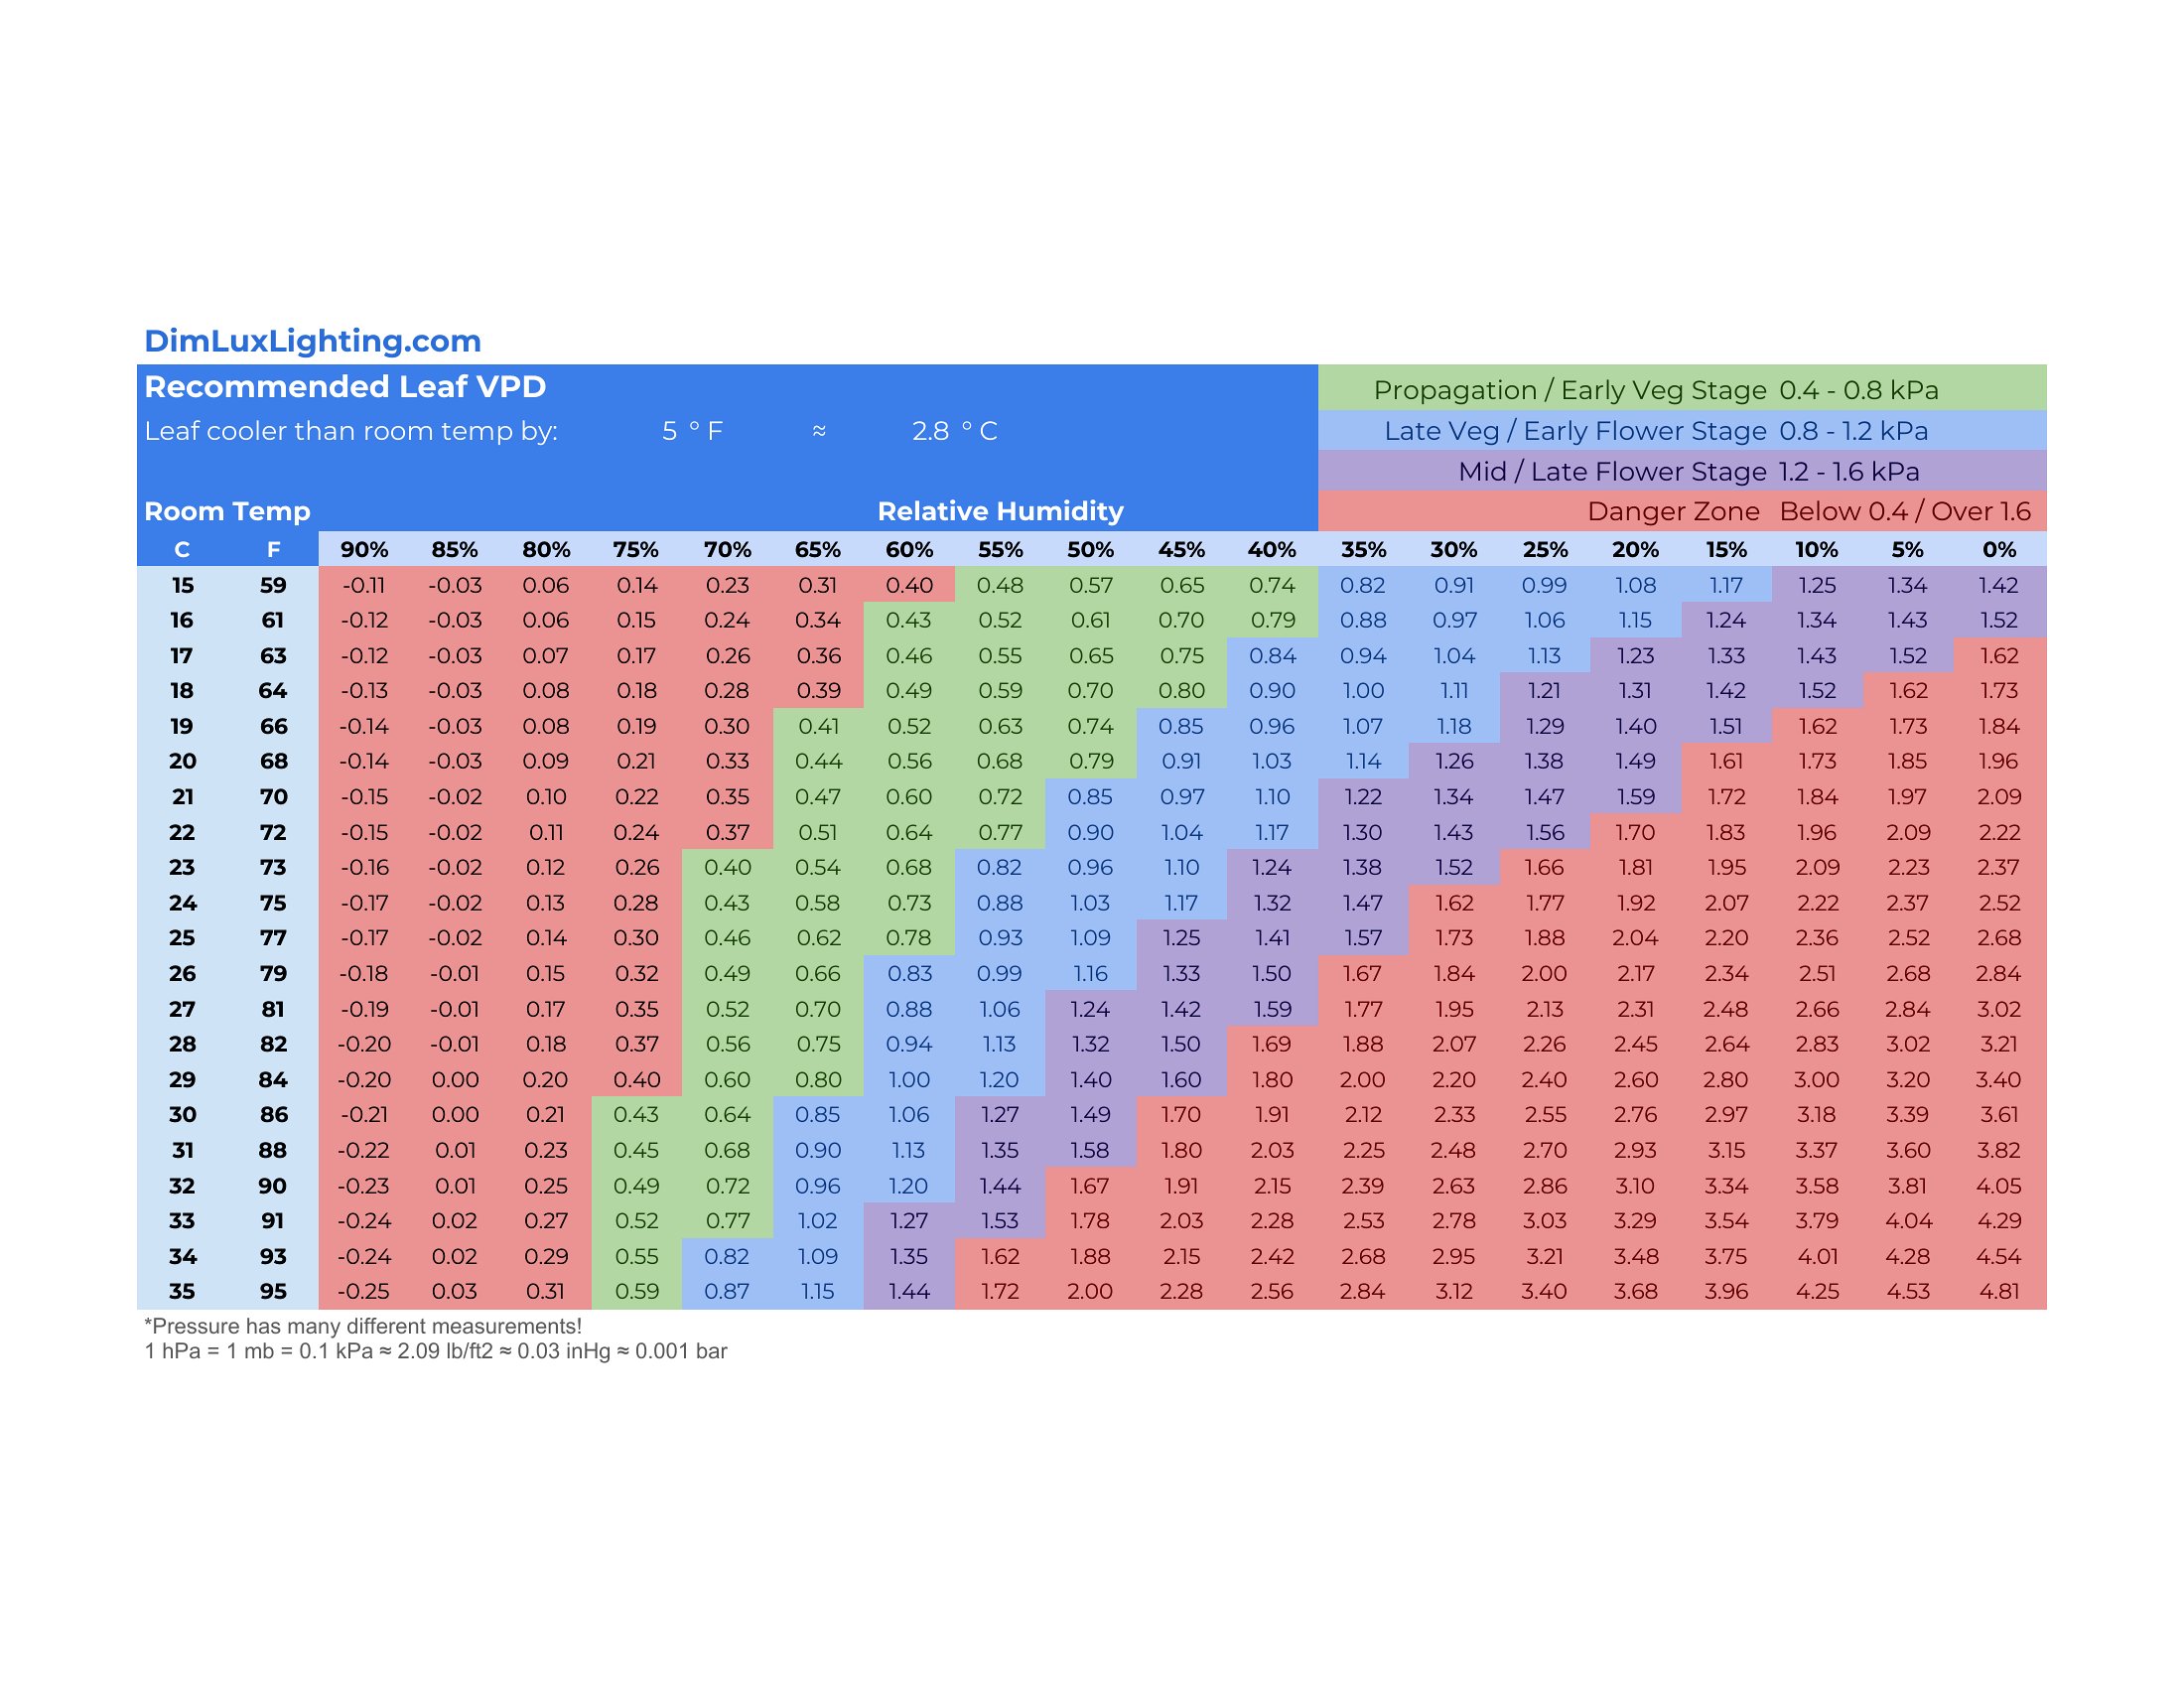
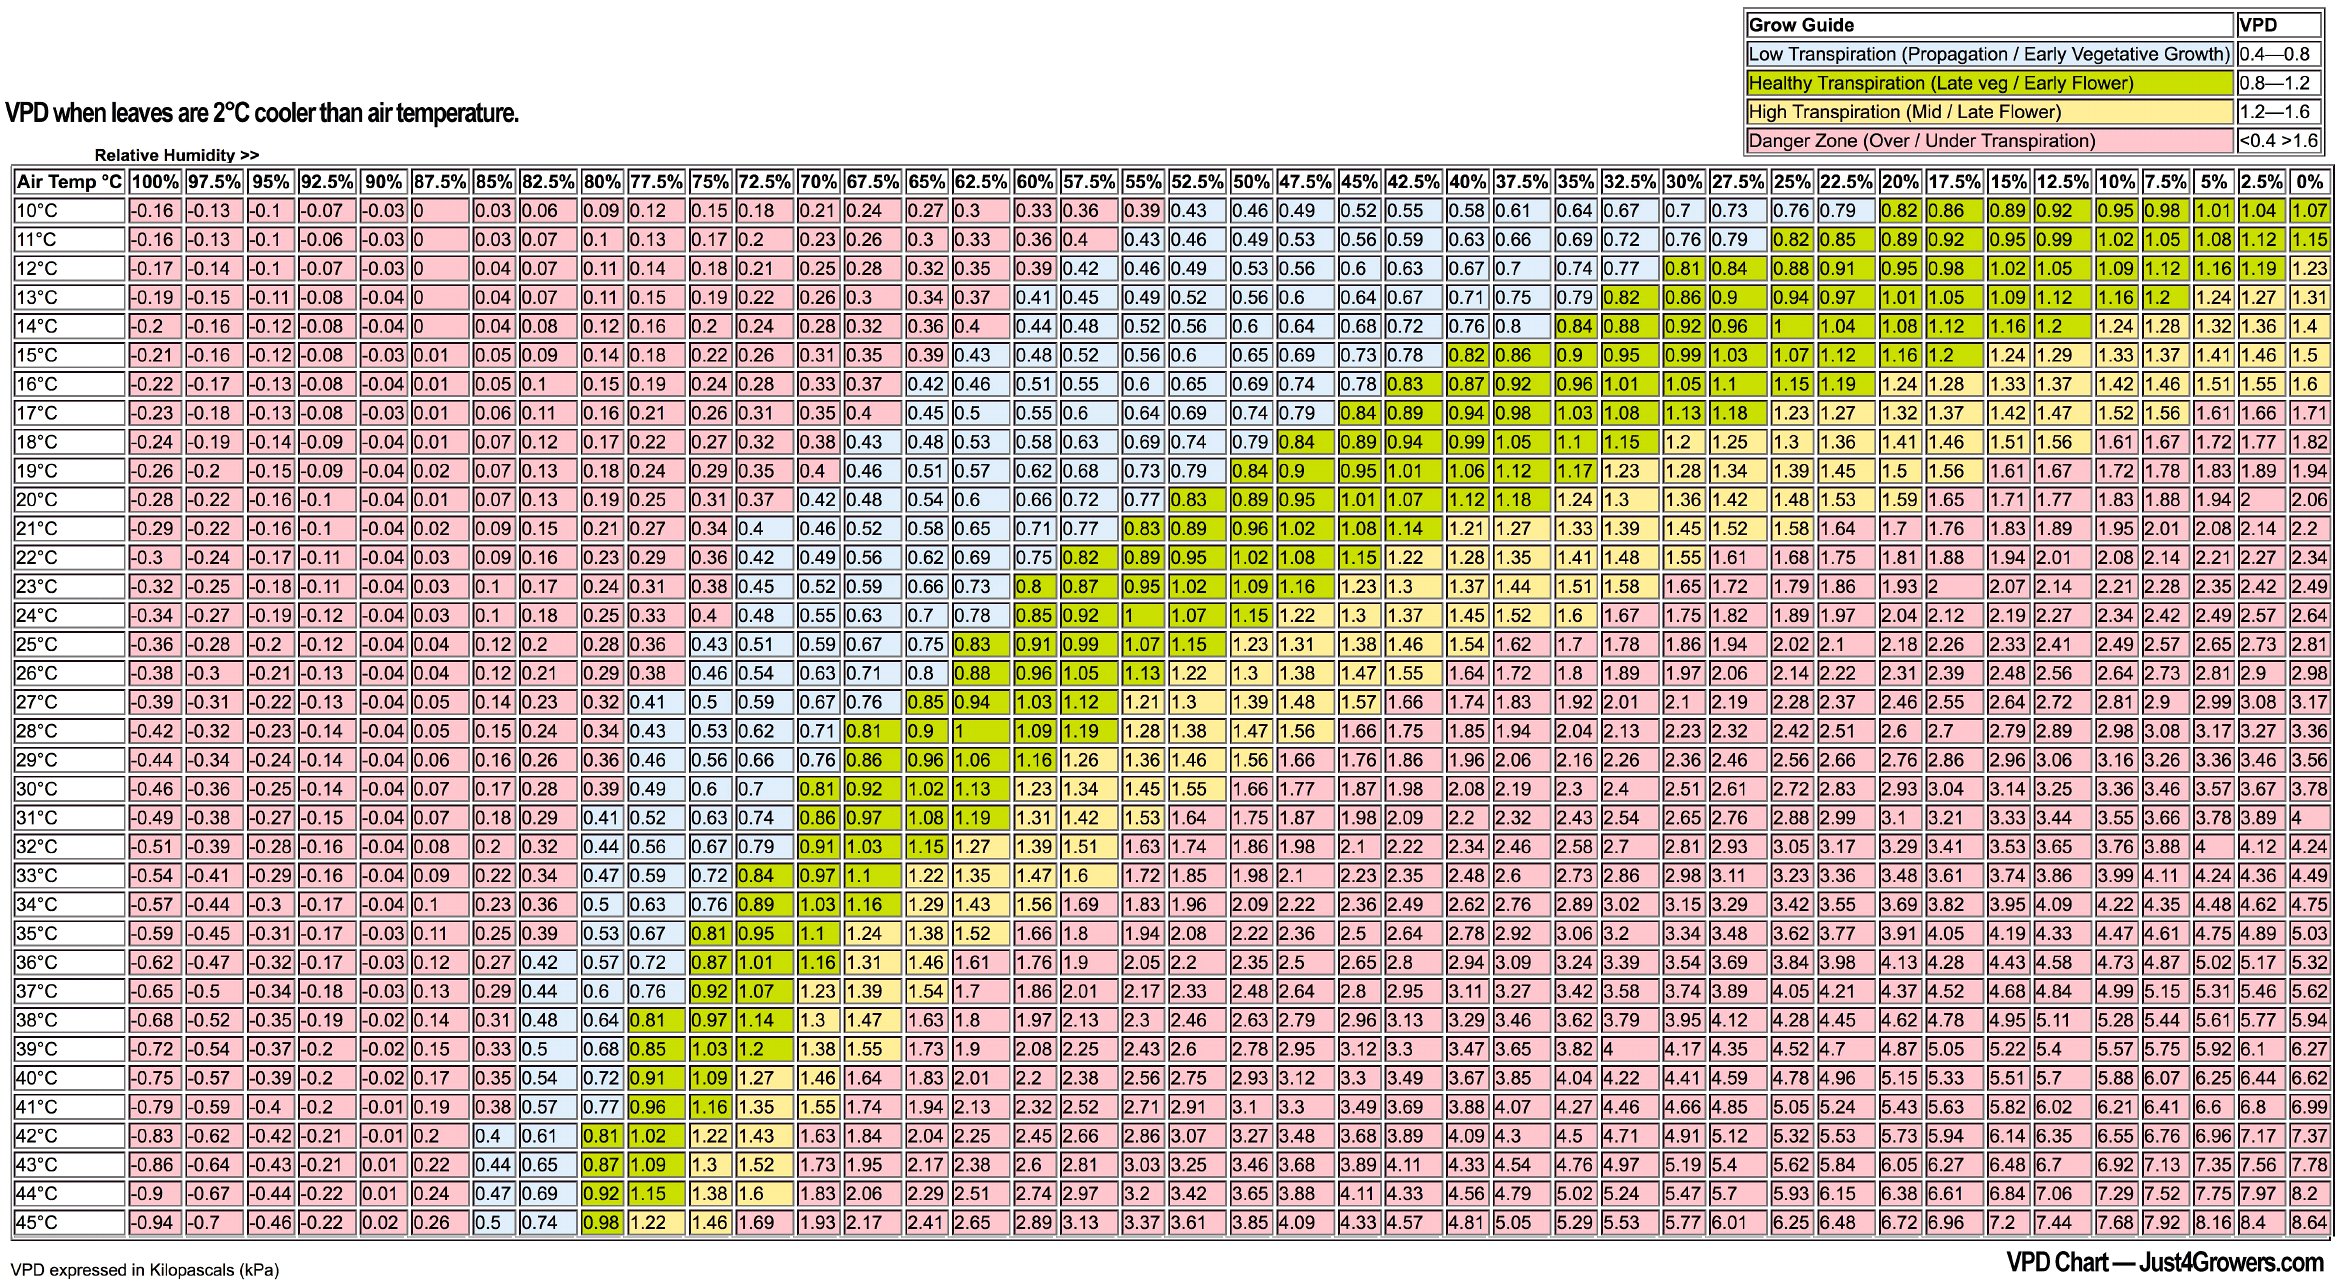
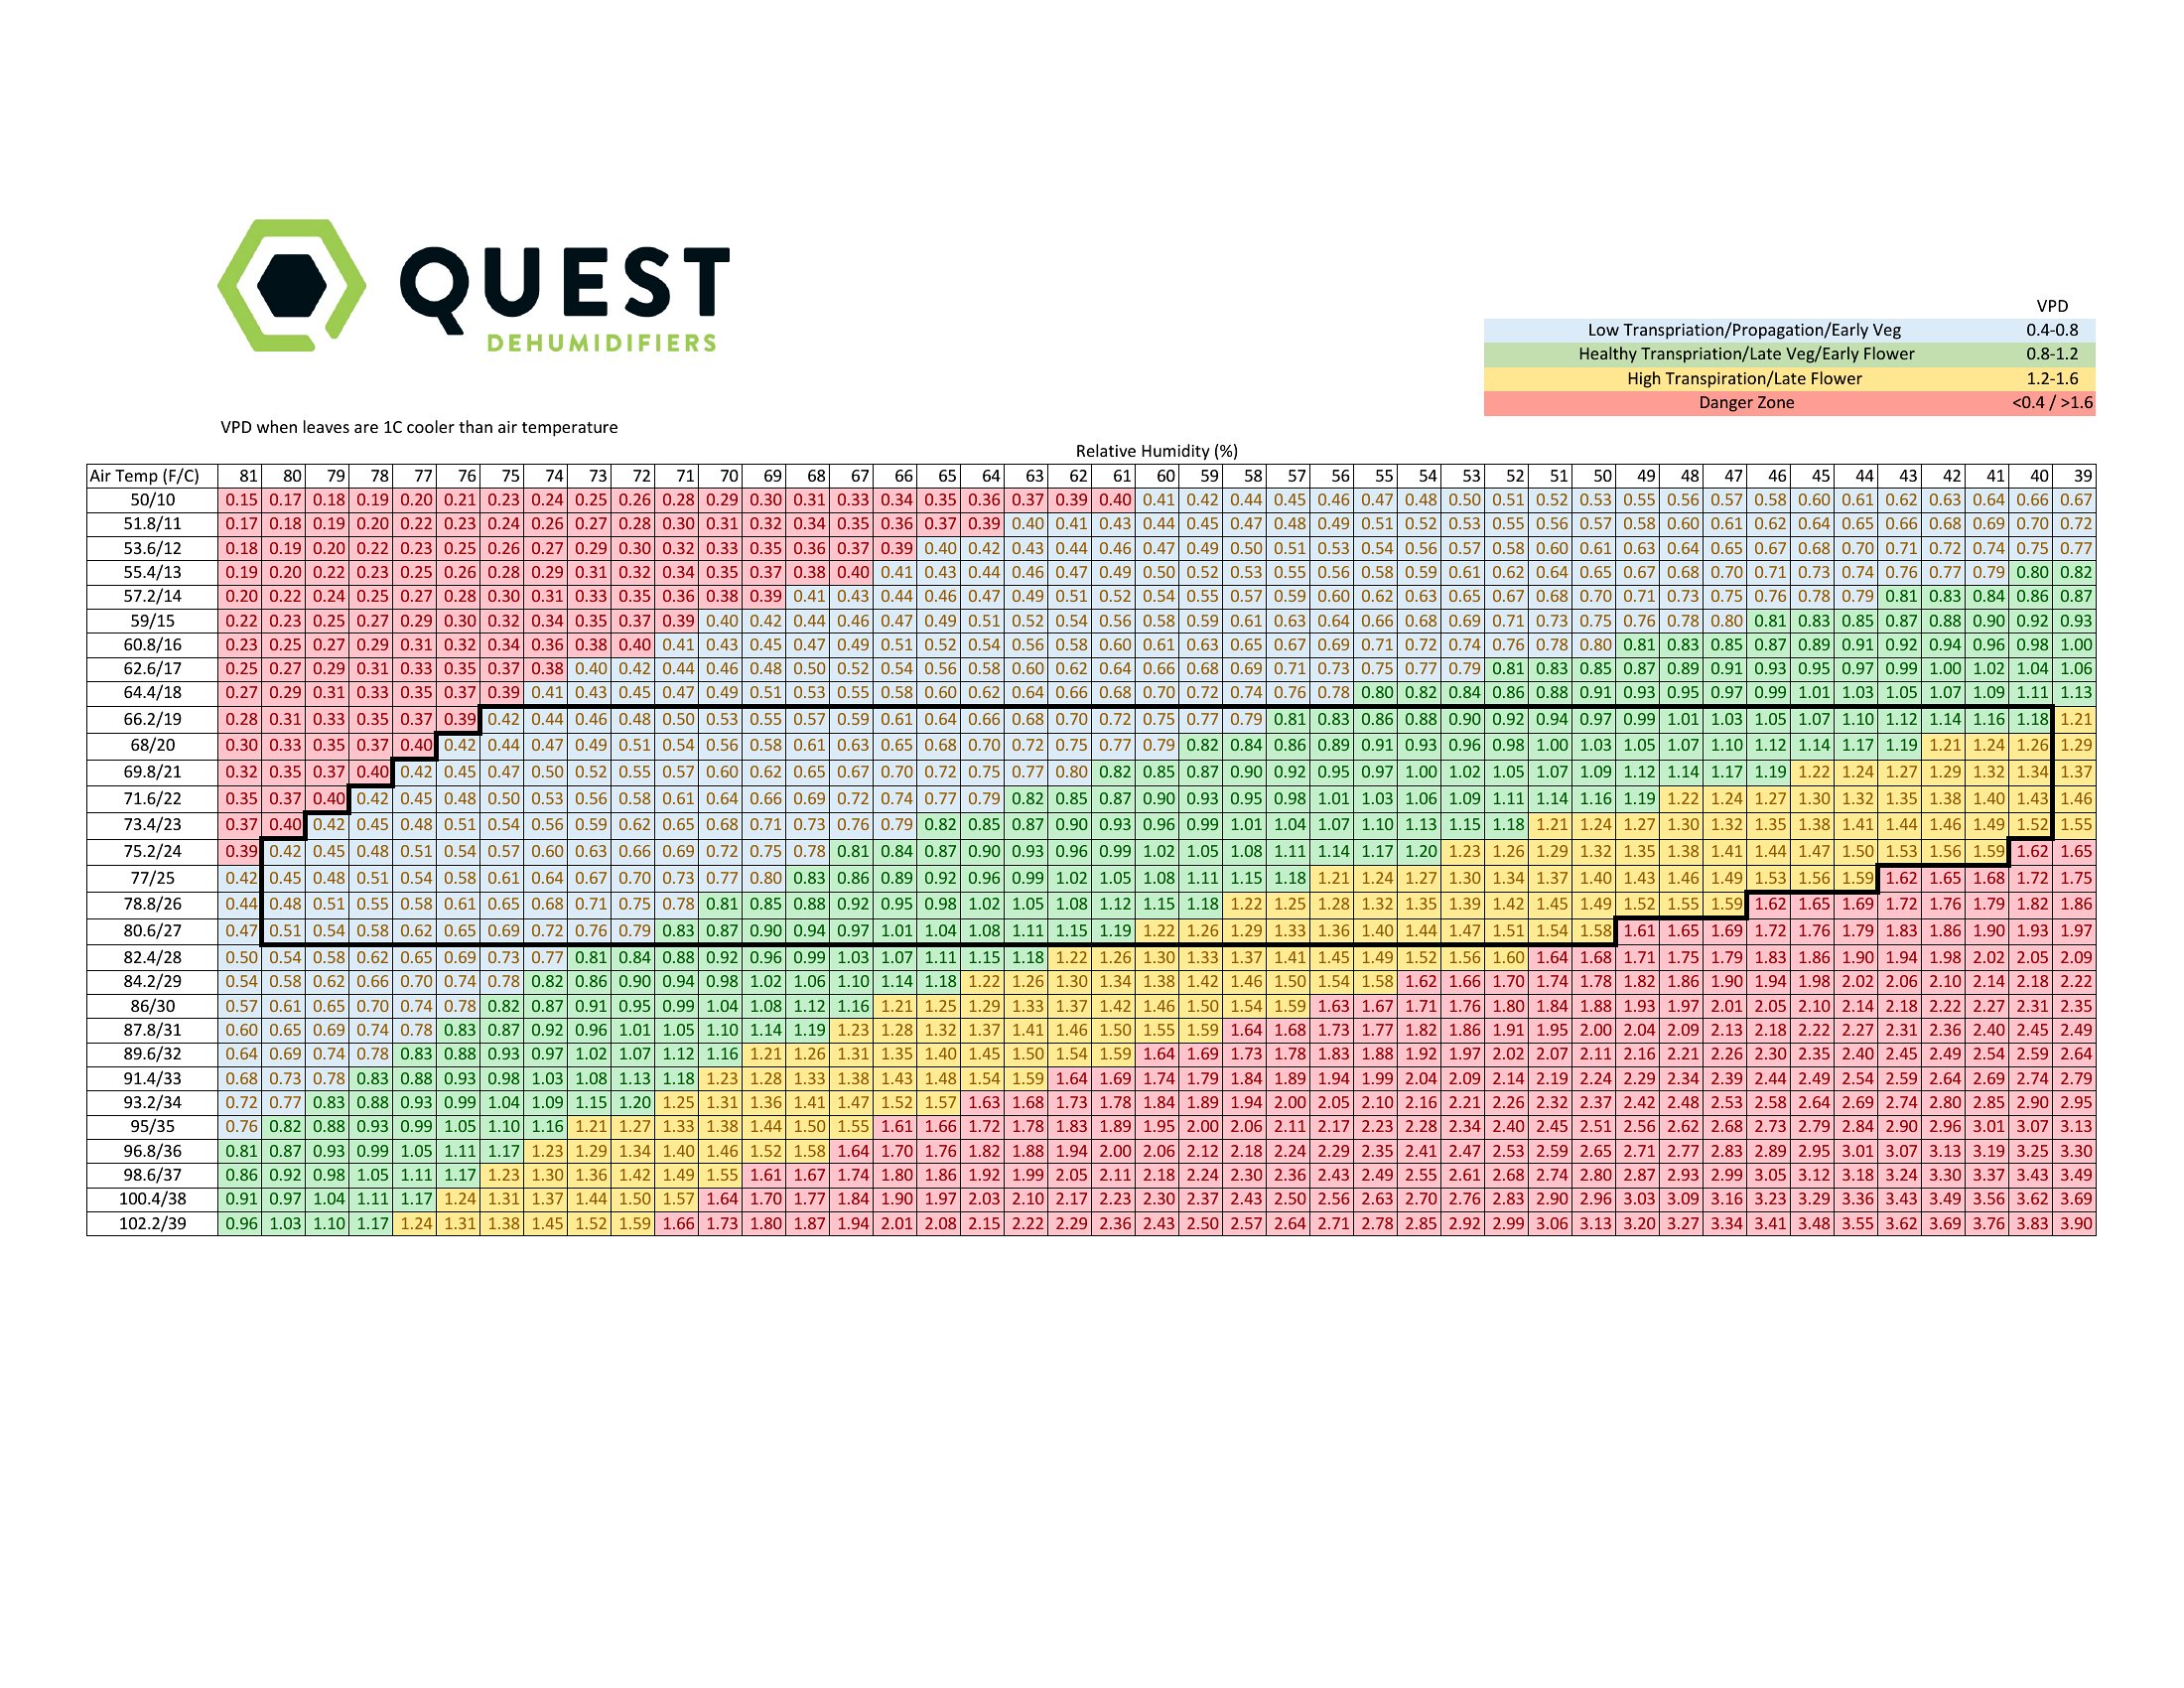
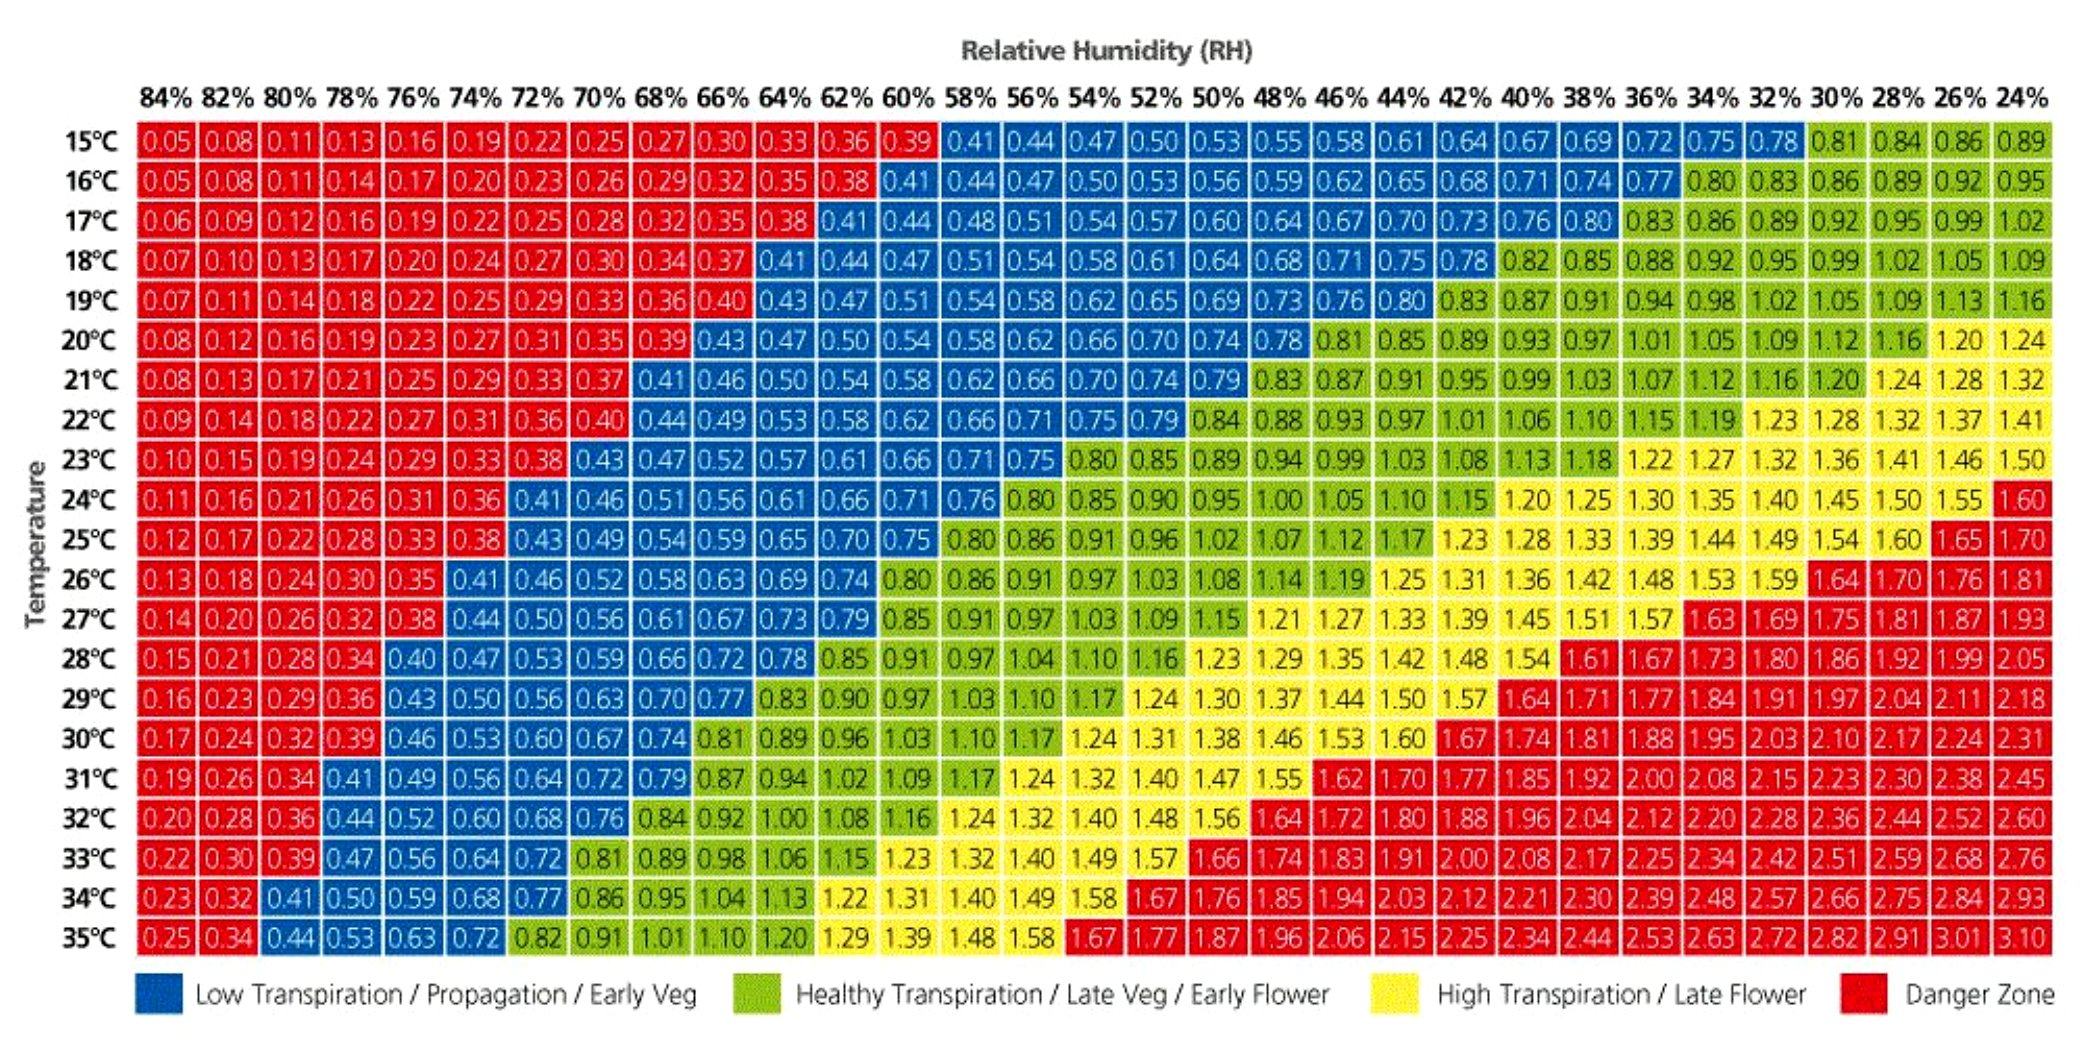
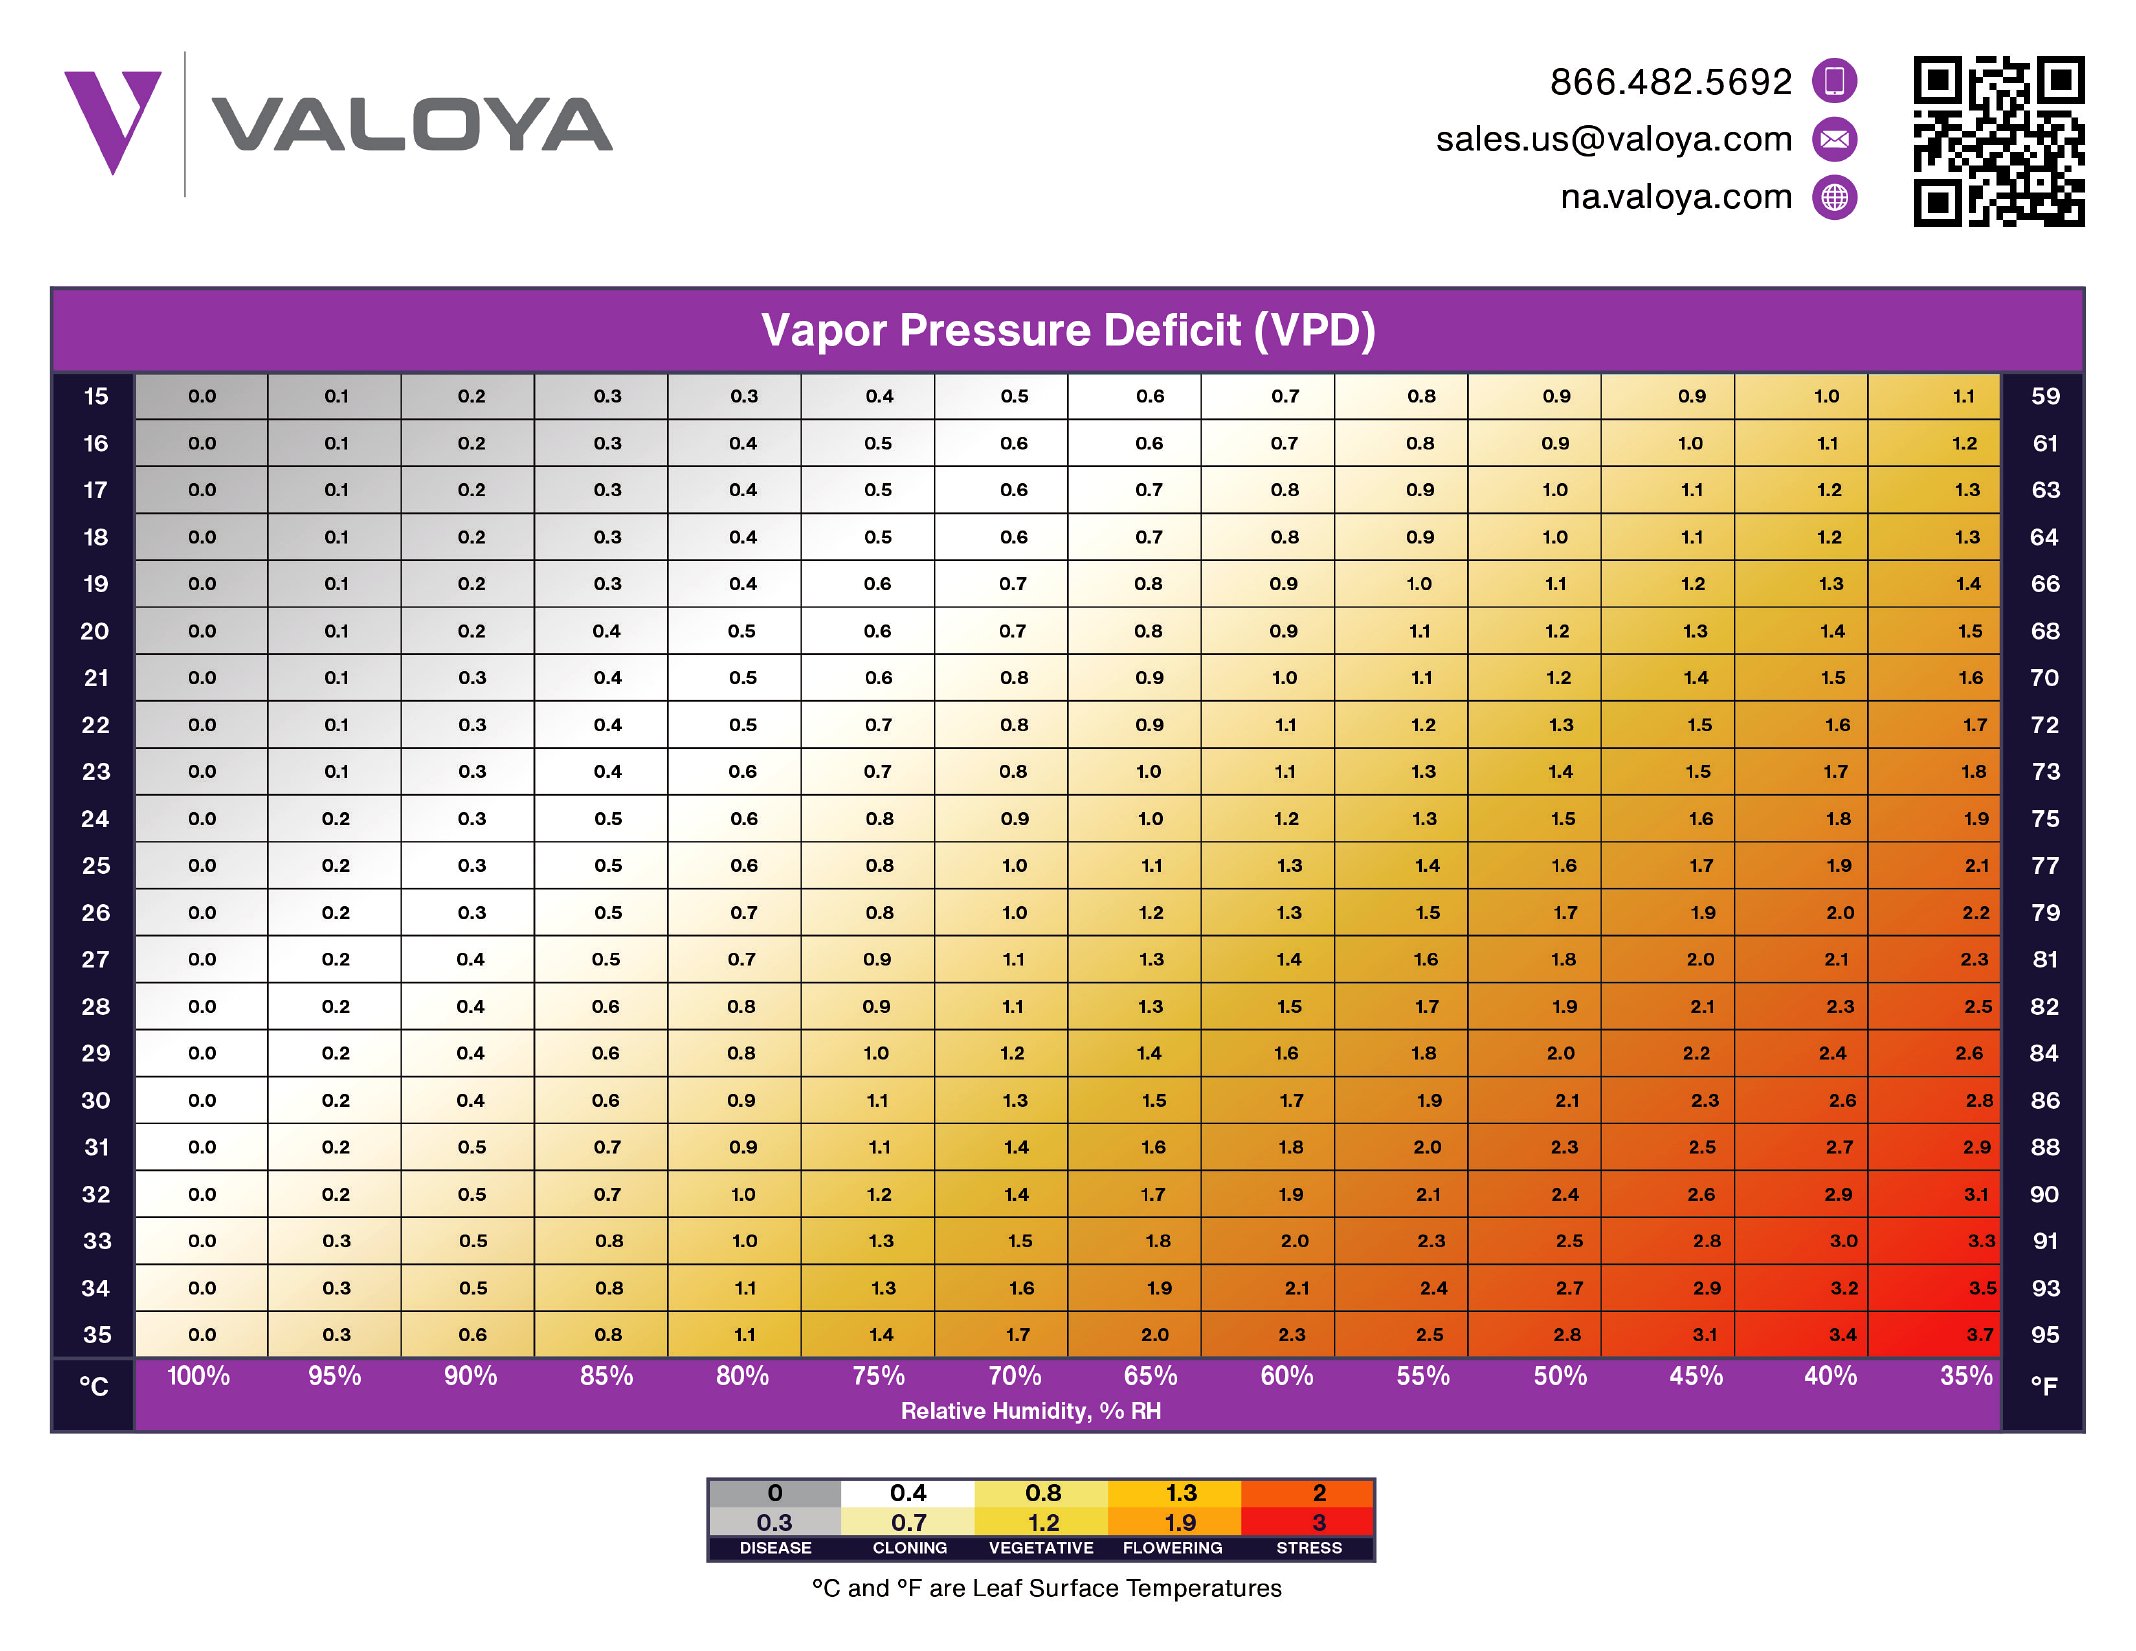
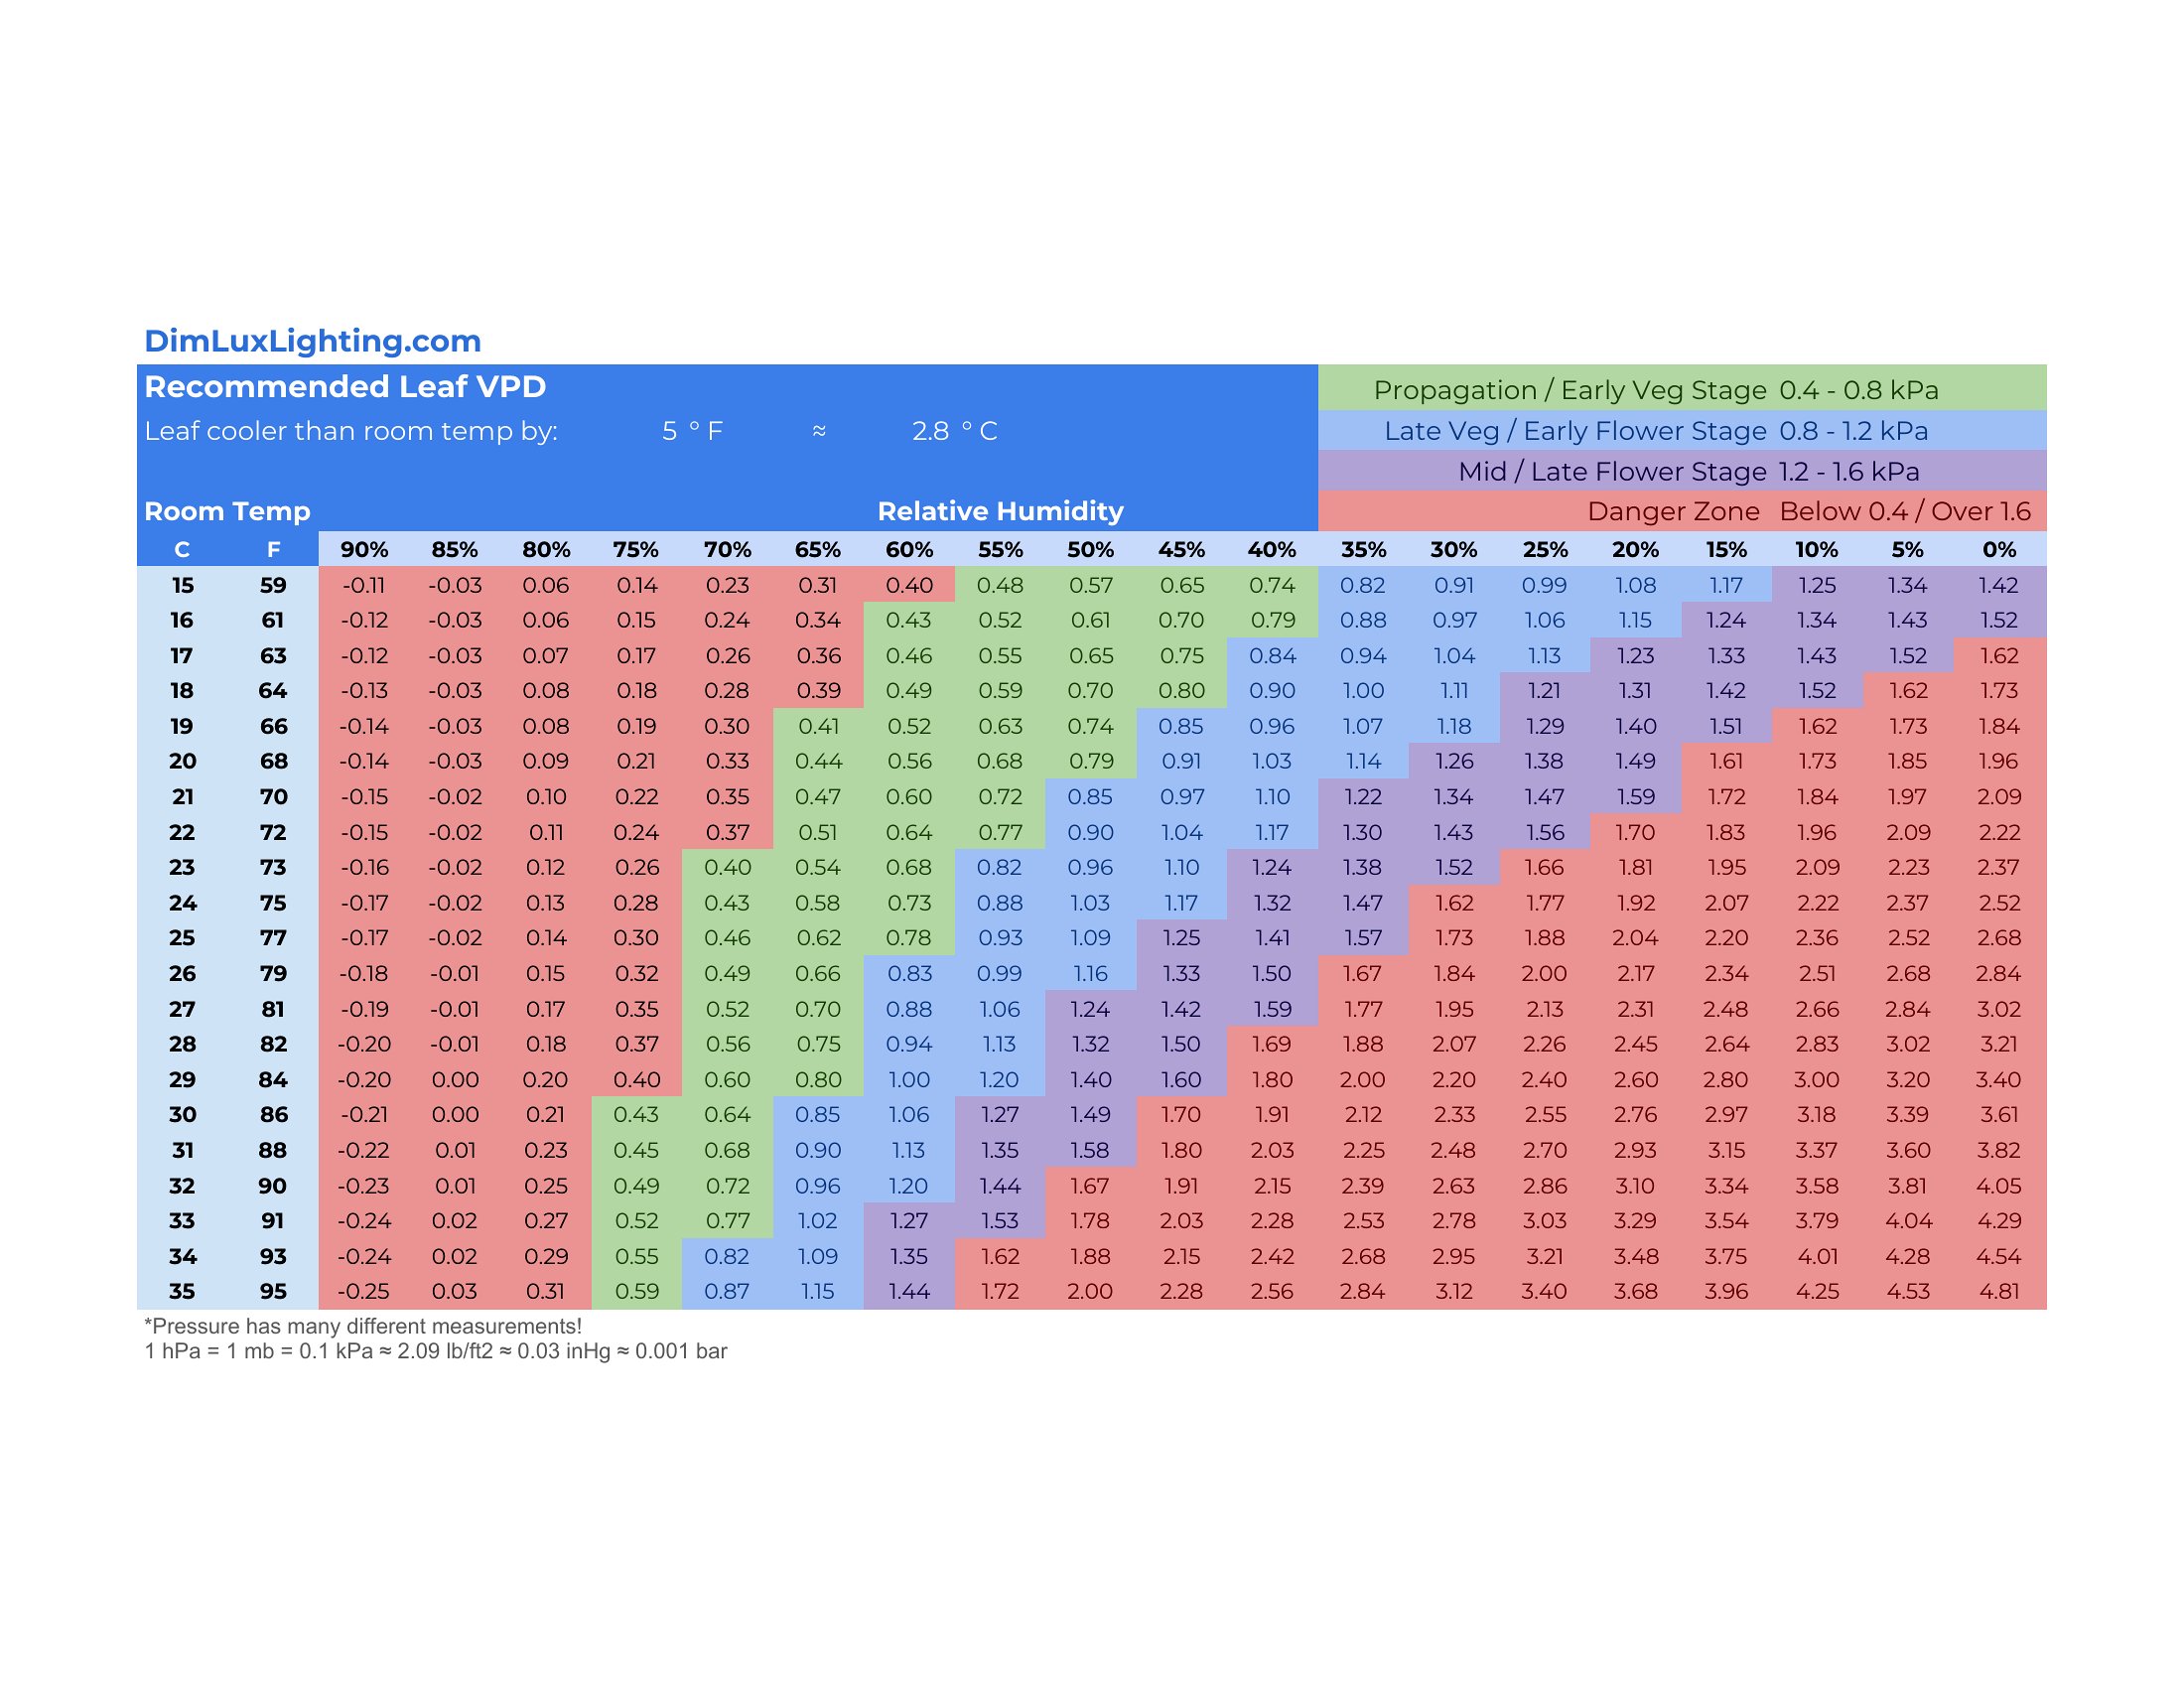
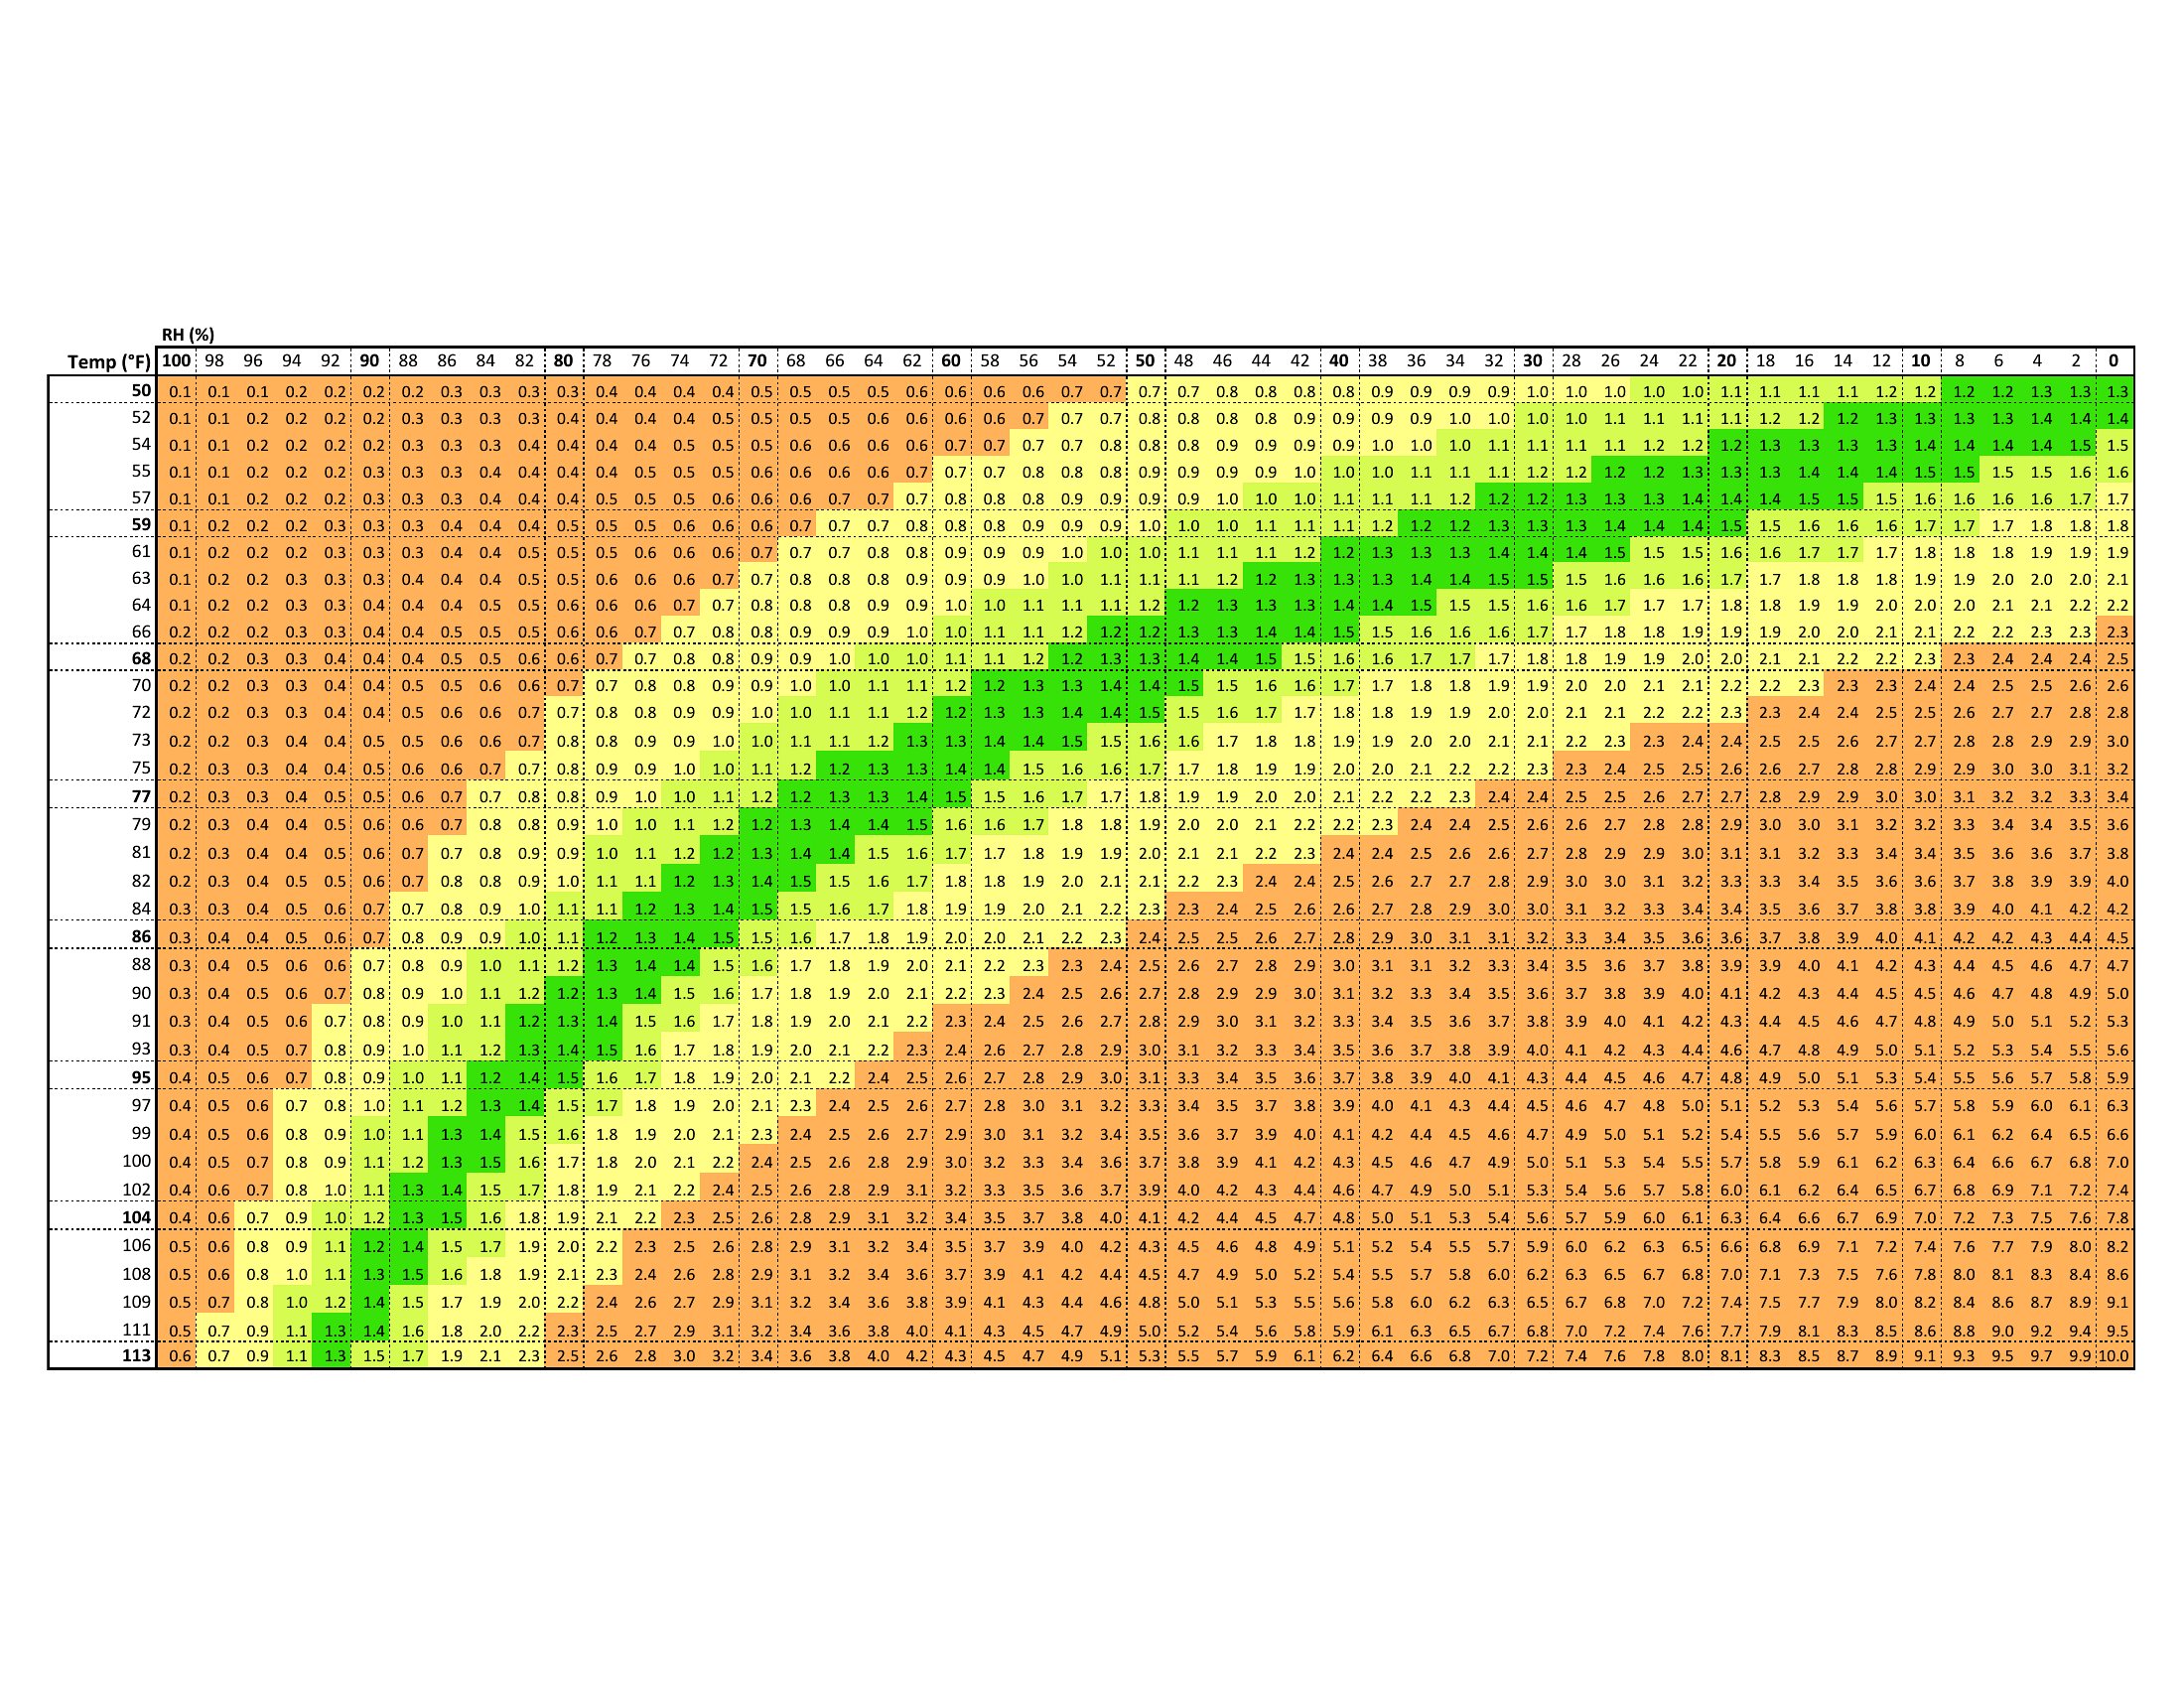
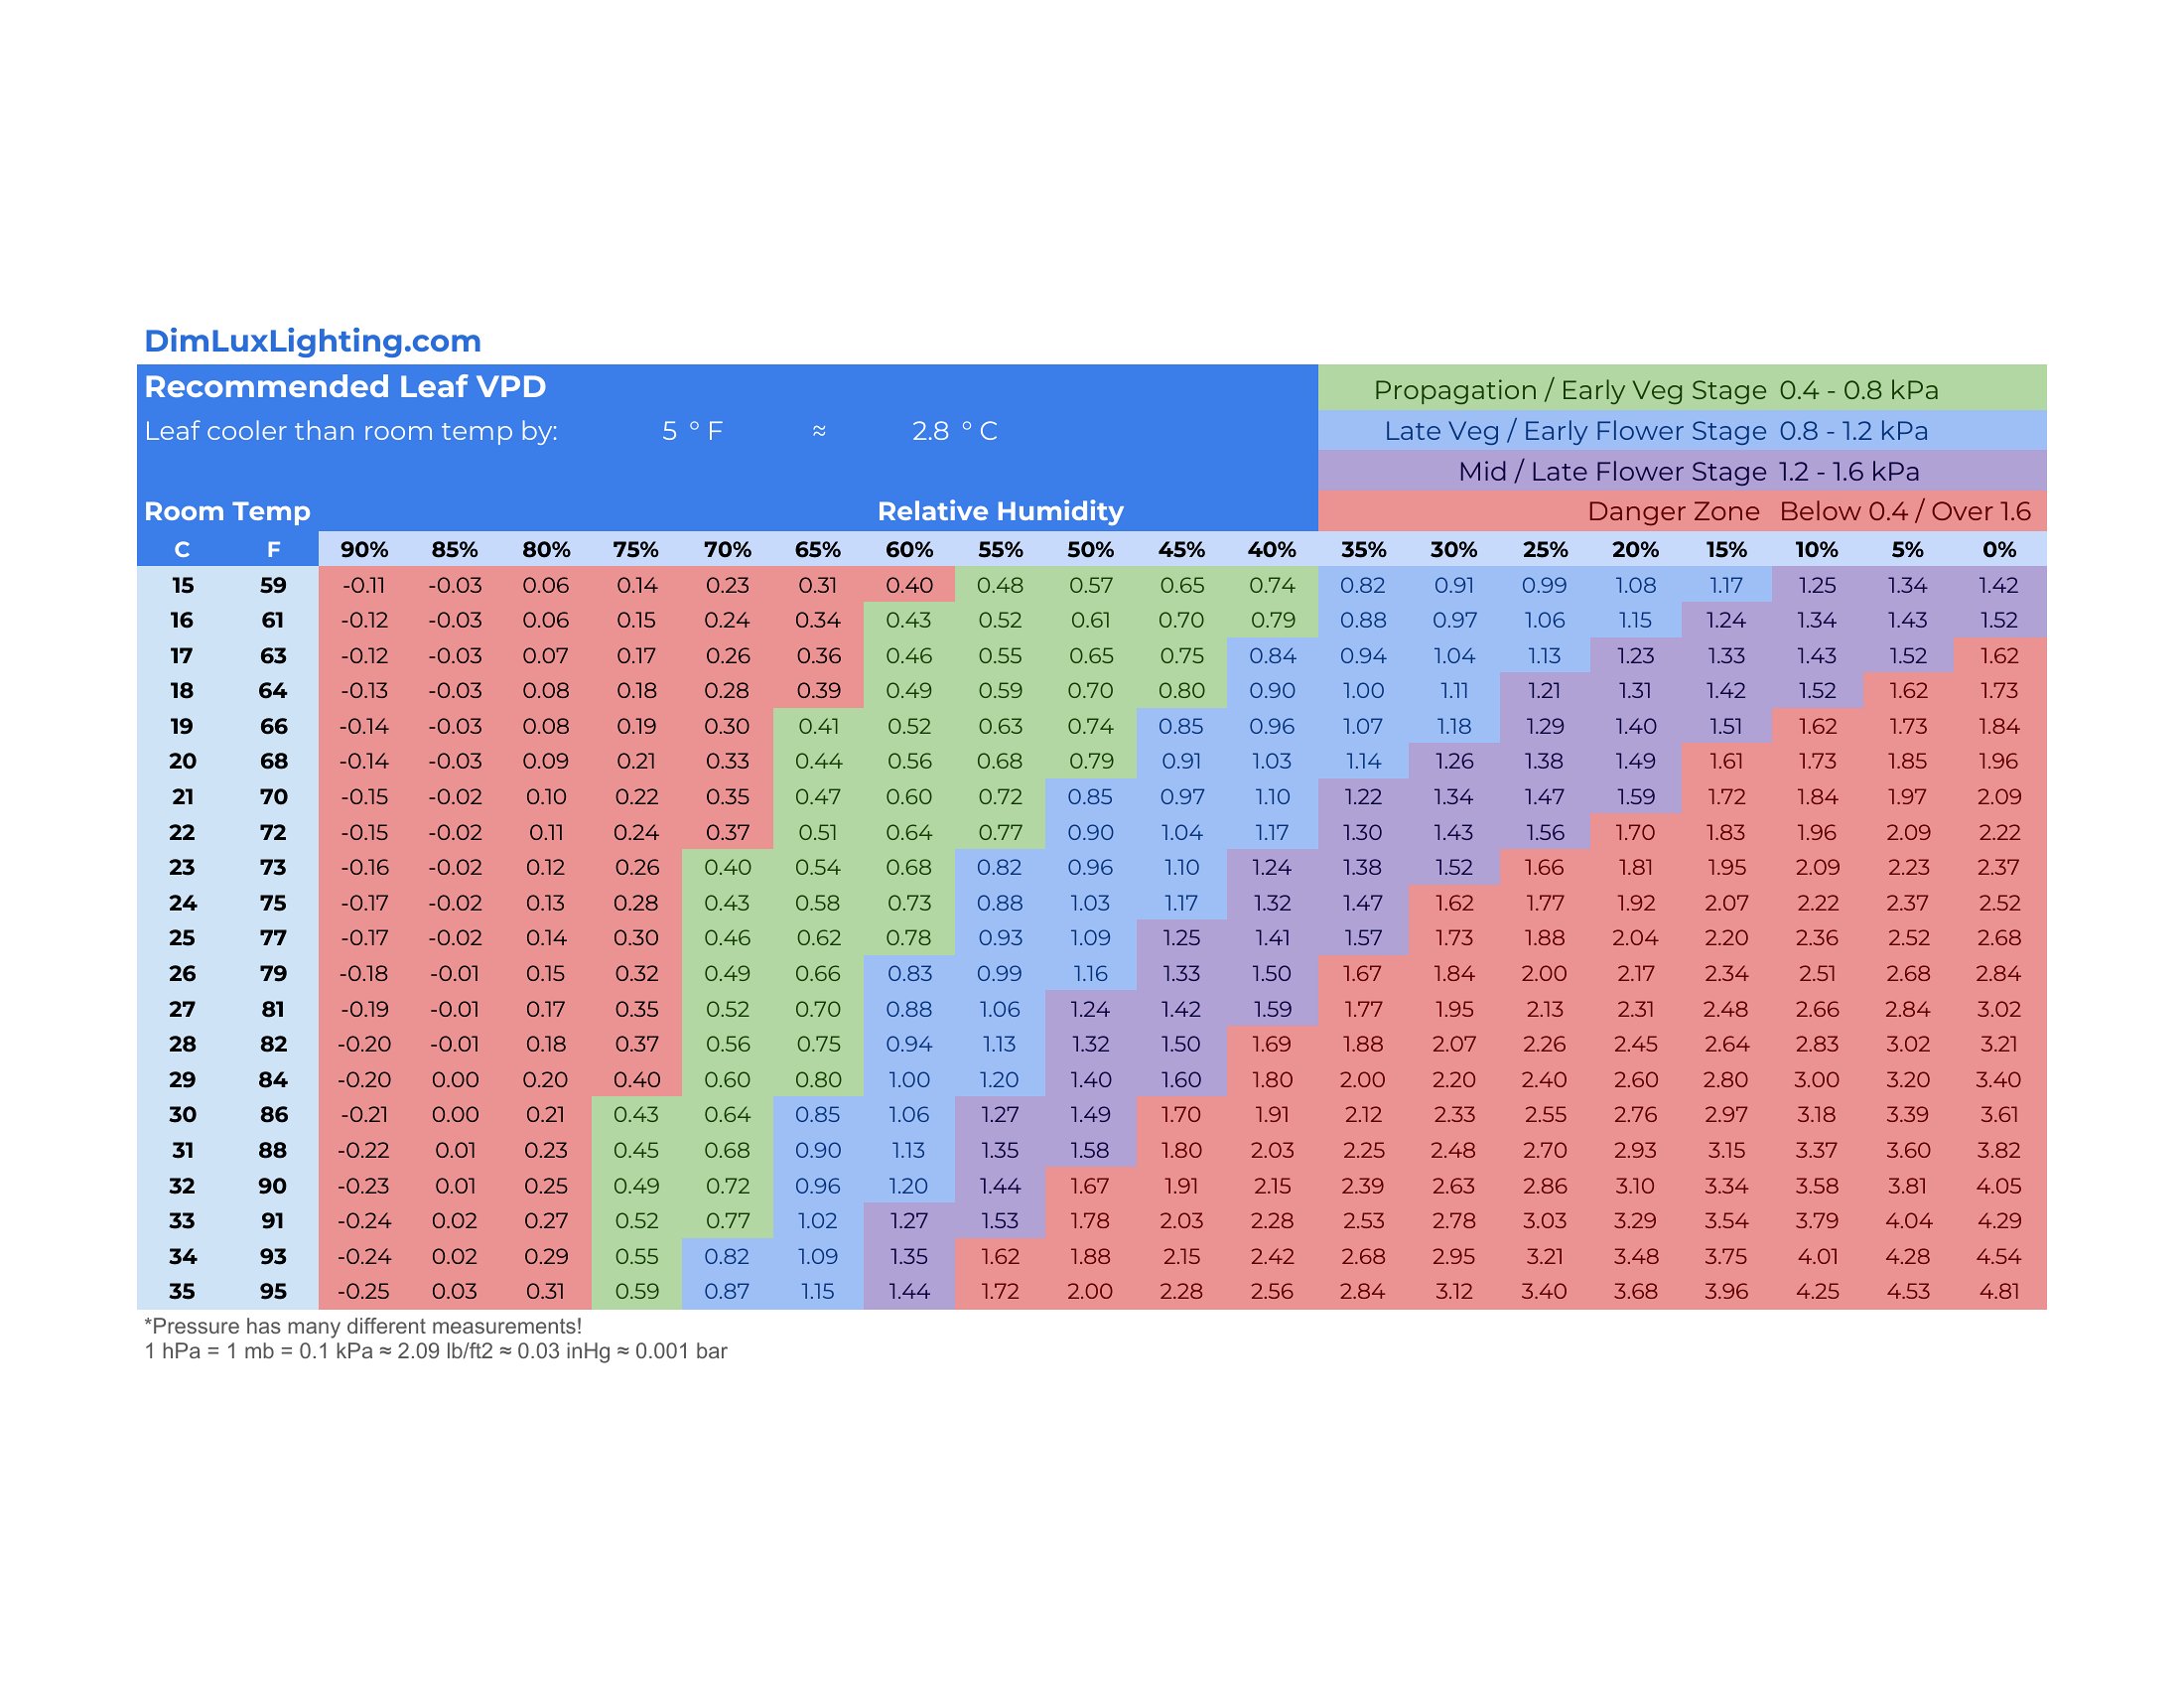
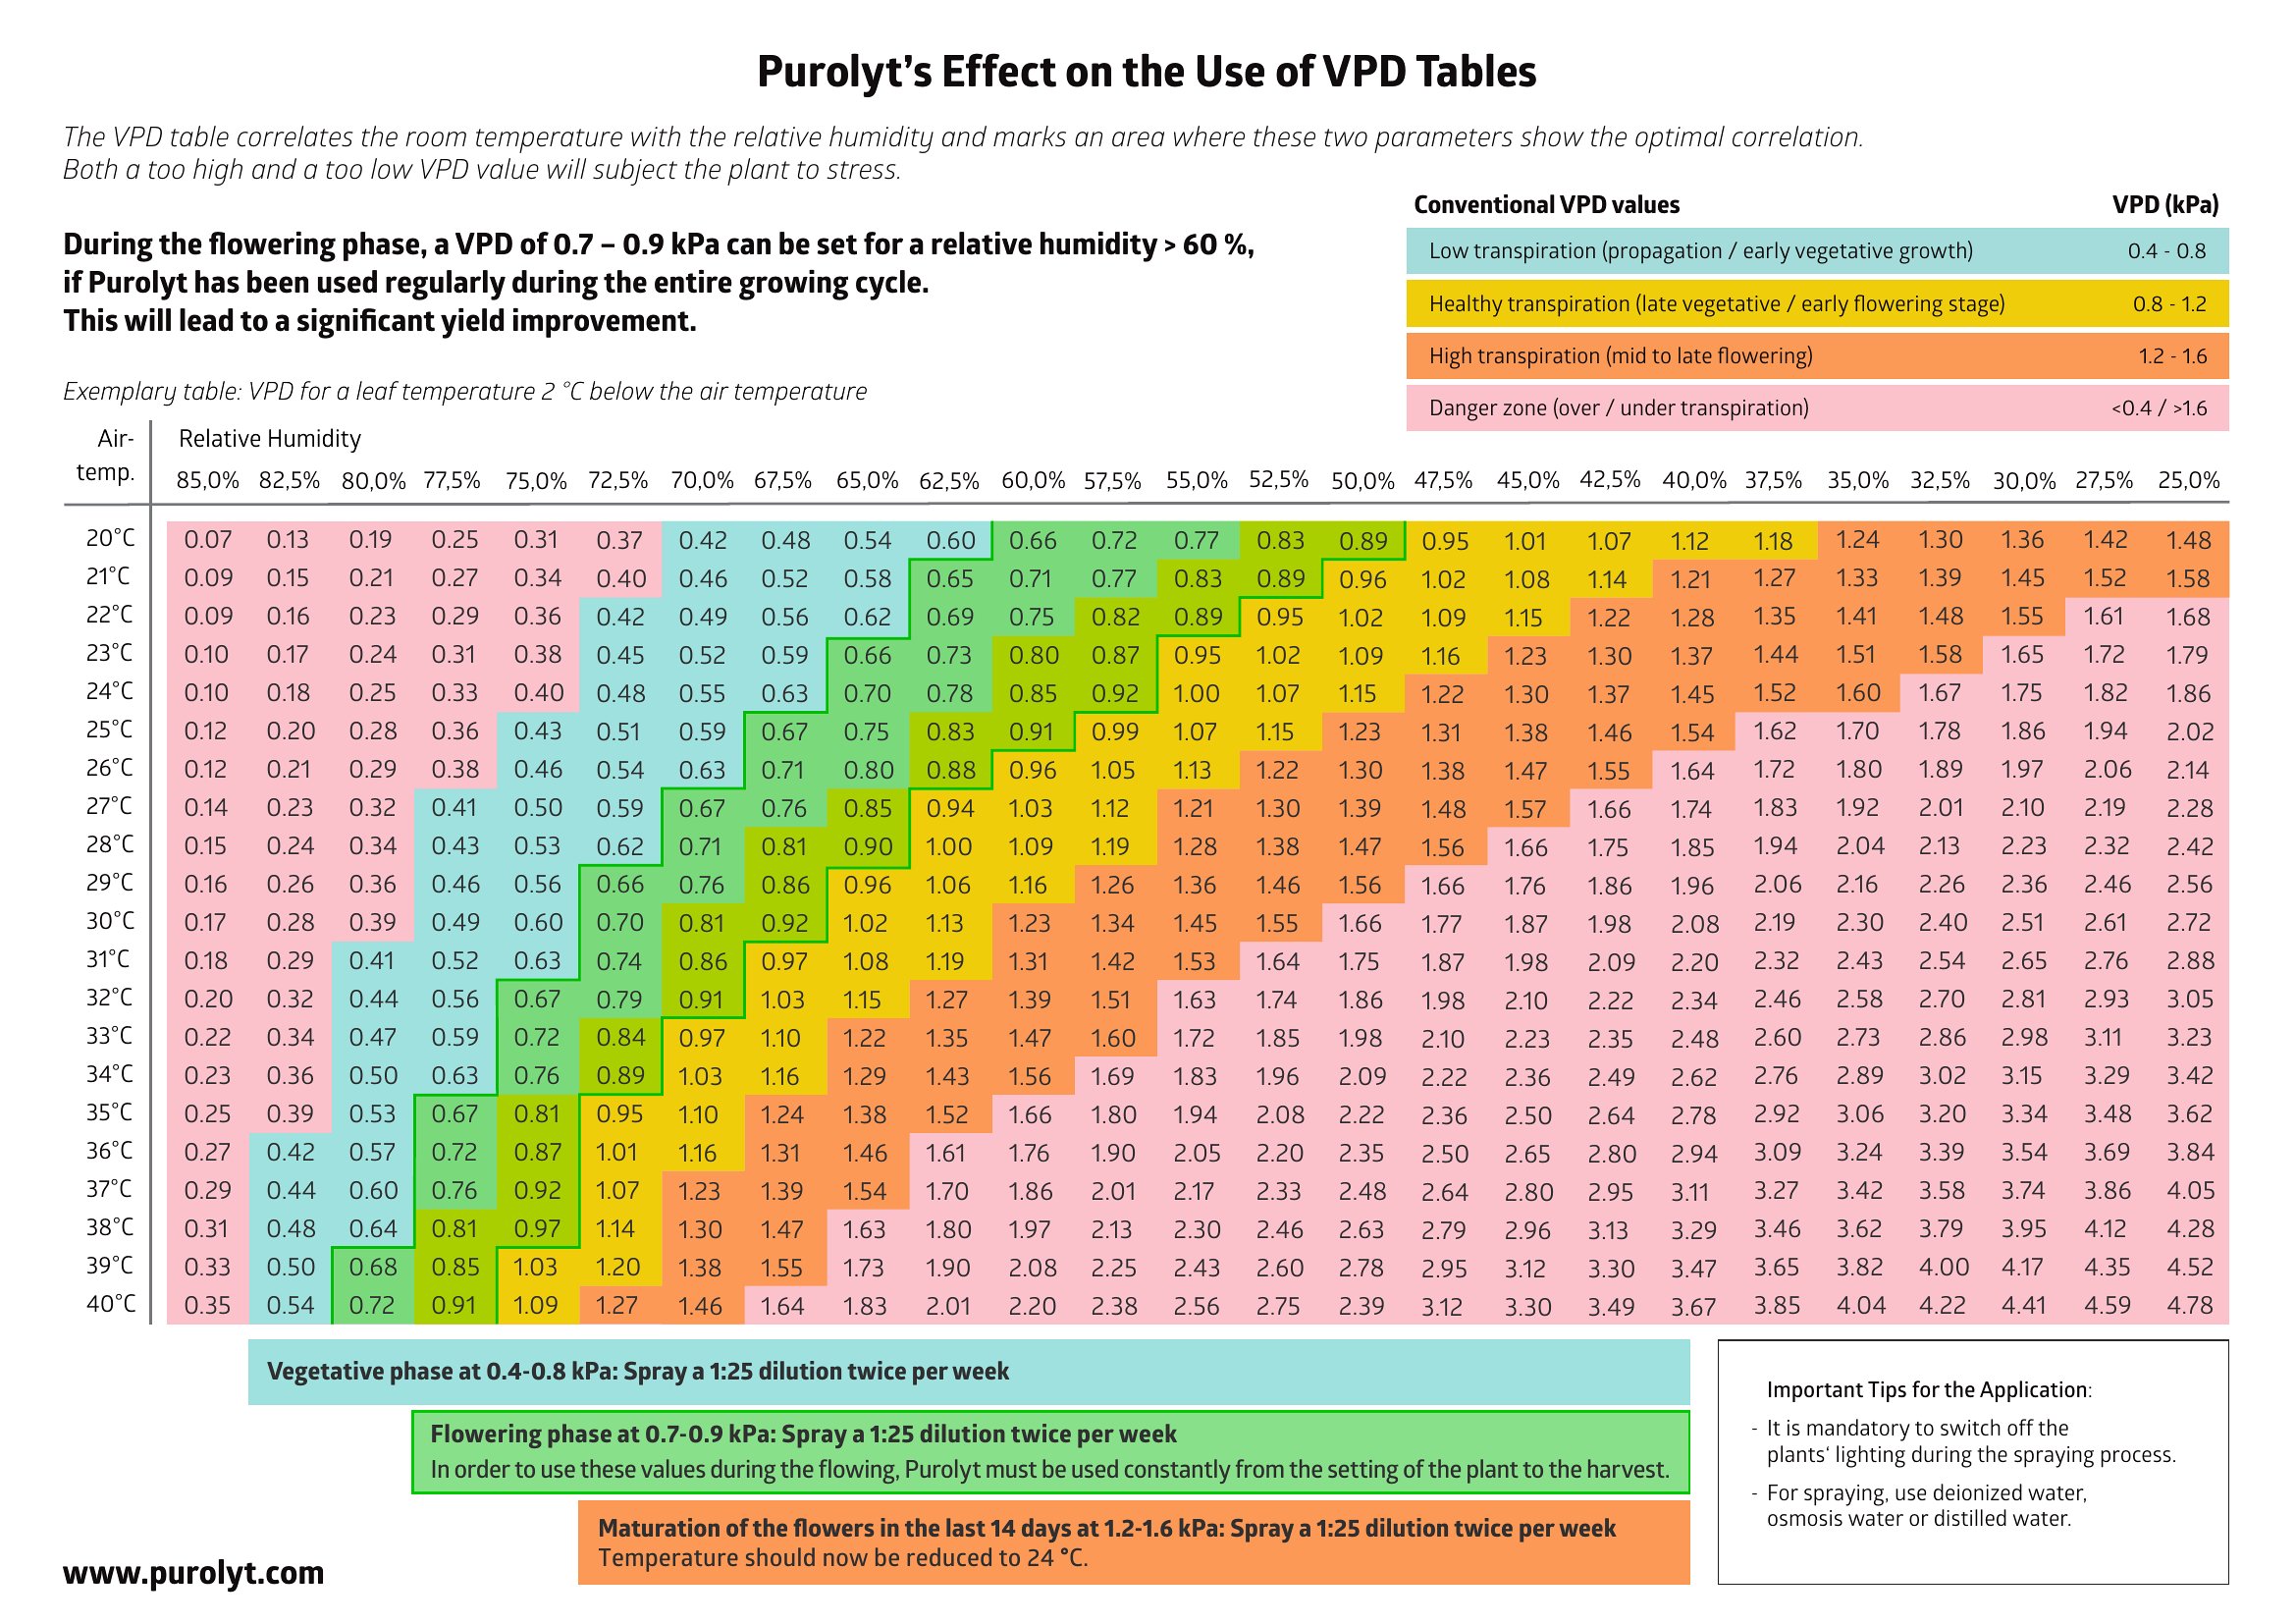
These VPD charts show target zones for different growth stages, but they’re not automated control instructions. Use them to cross-check your current readings—like from a hygrometer—before adjusting vents manually or programming a smart controller. Always pair charts with real-time data for safety, especially with high-value crops or limited airflow options.
What should I do if my current conditions fall outside the ‘sweet spot’ for my plant’s stage?
Start with small adjustments—like increasing airflow or reducing heat output—to nudge your VPD into the target range. If you’re in a locked environment (e.g., a tent), prioritize humidity control first, as it’s easier to fine-tune than temperature. Monitor changes over 24 hours, as plants often stabilize after a single shift. For stubborn issues, revisit irrigation schedules or CO2 levels, which can influence transpiration.
Are these charts specific to certain crops, or can I use them for ornamental plants too?
While these charts are designed for common high-VPD-sensitive crops like cannabis, tomatoes, and mushrooms, they can serve as a general guide for ornamentals with similar needs—such as ferns or peppers. For exact matches, compare your plant’s native humidity preferences to the chart’s ranges. Tropical ornamentals often align closely, but desert-adapted plants may require adjustments. When in doubt, err on the side of lower VPD to avoid stress.
Comments
Join the conversation
Sign in to share your thoughts and leave a comment on this resource.