





FAQ
How detailed are the visual cues in these charts for distinguishing bee species?
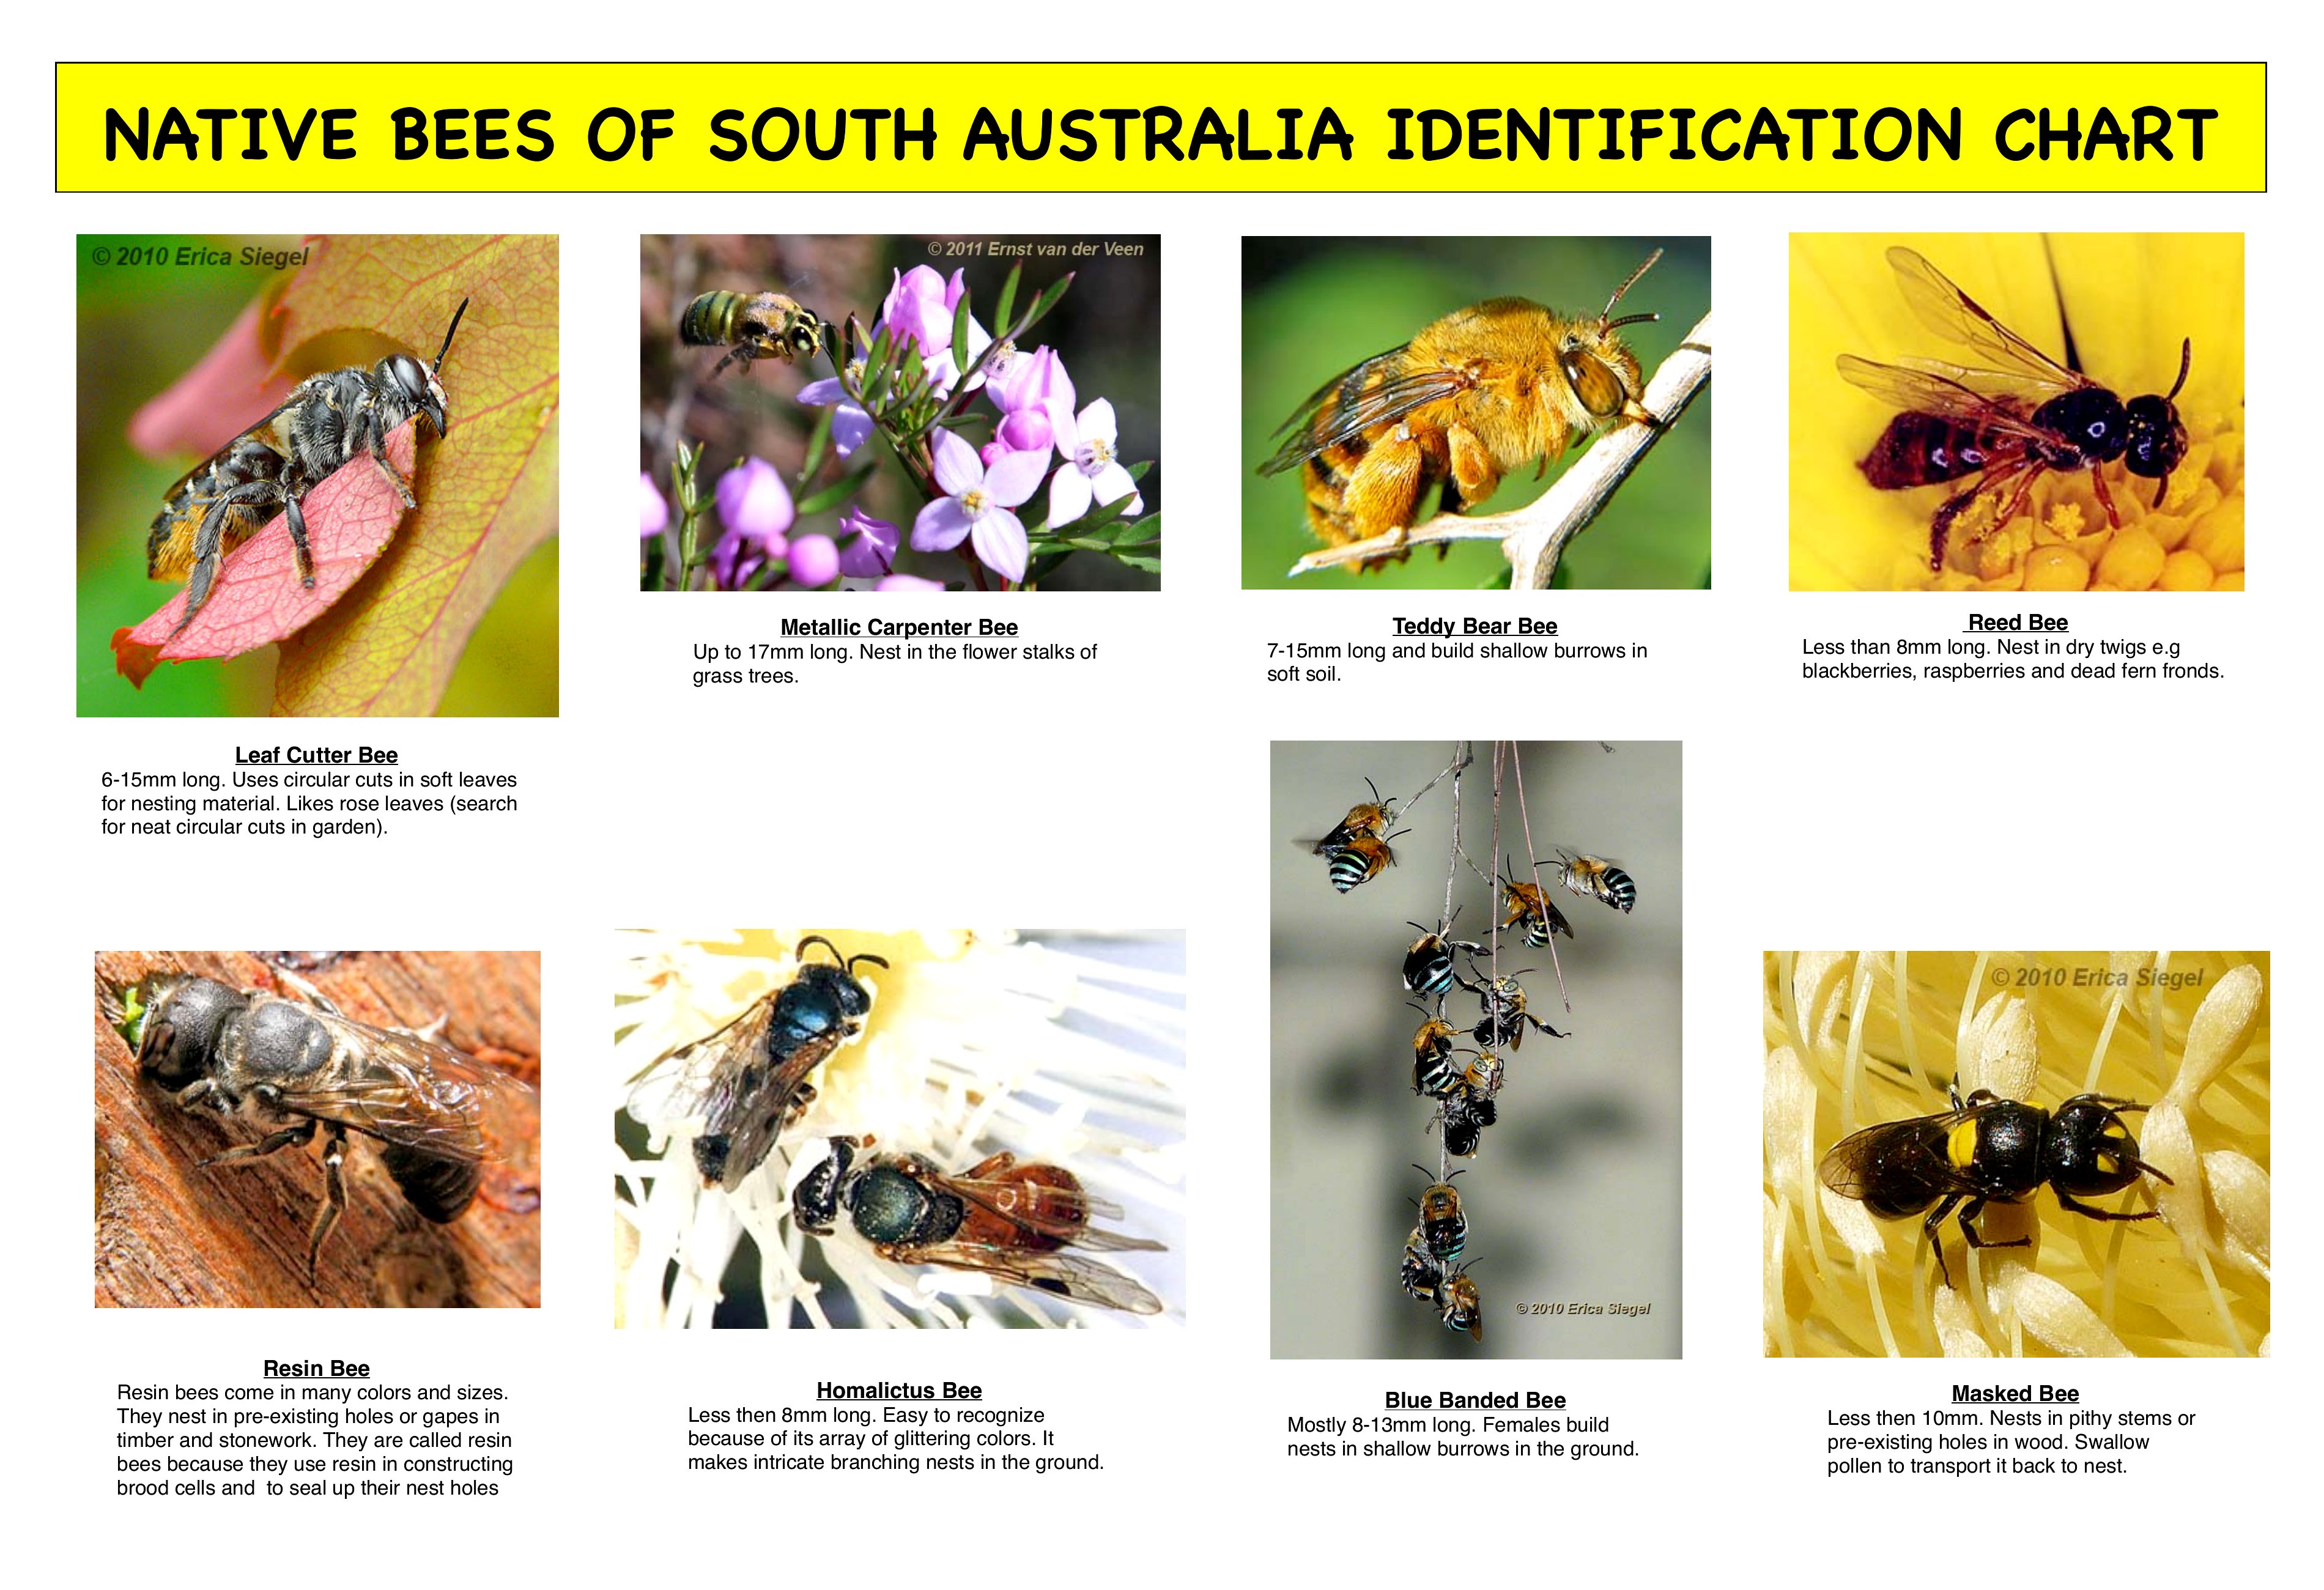
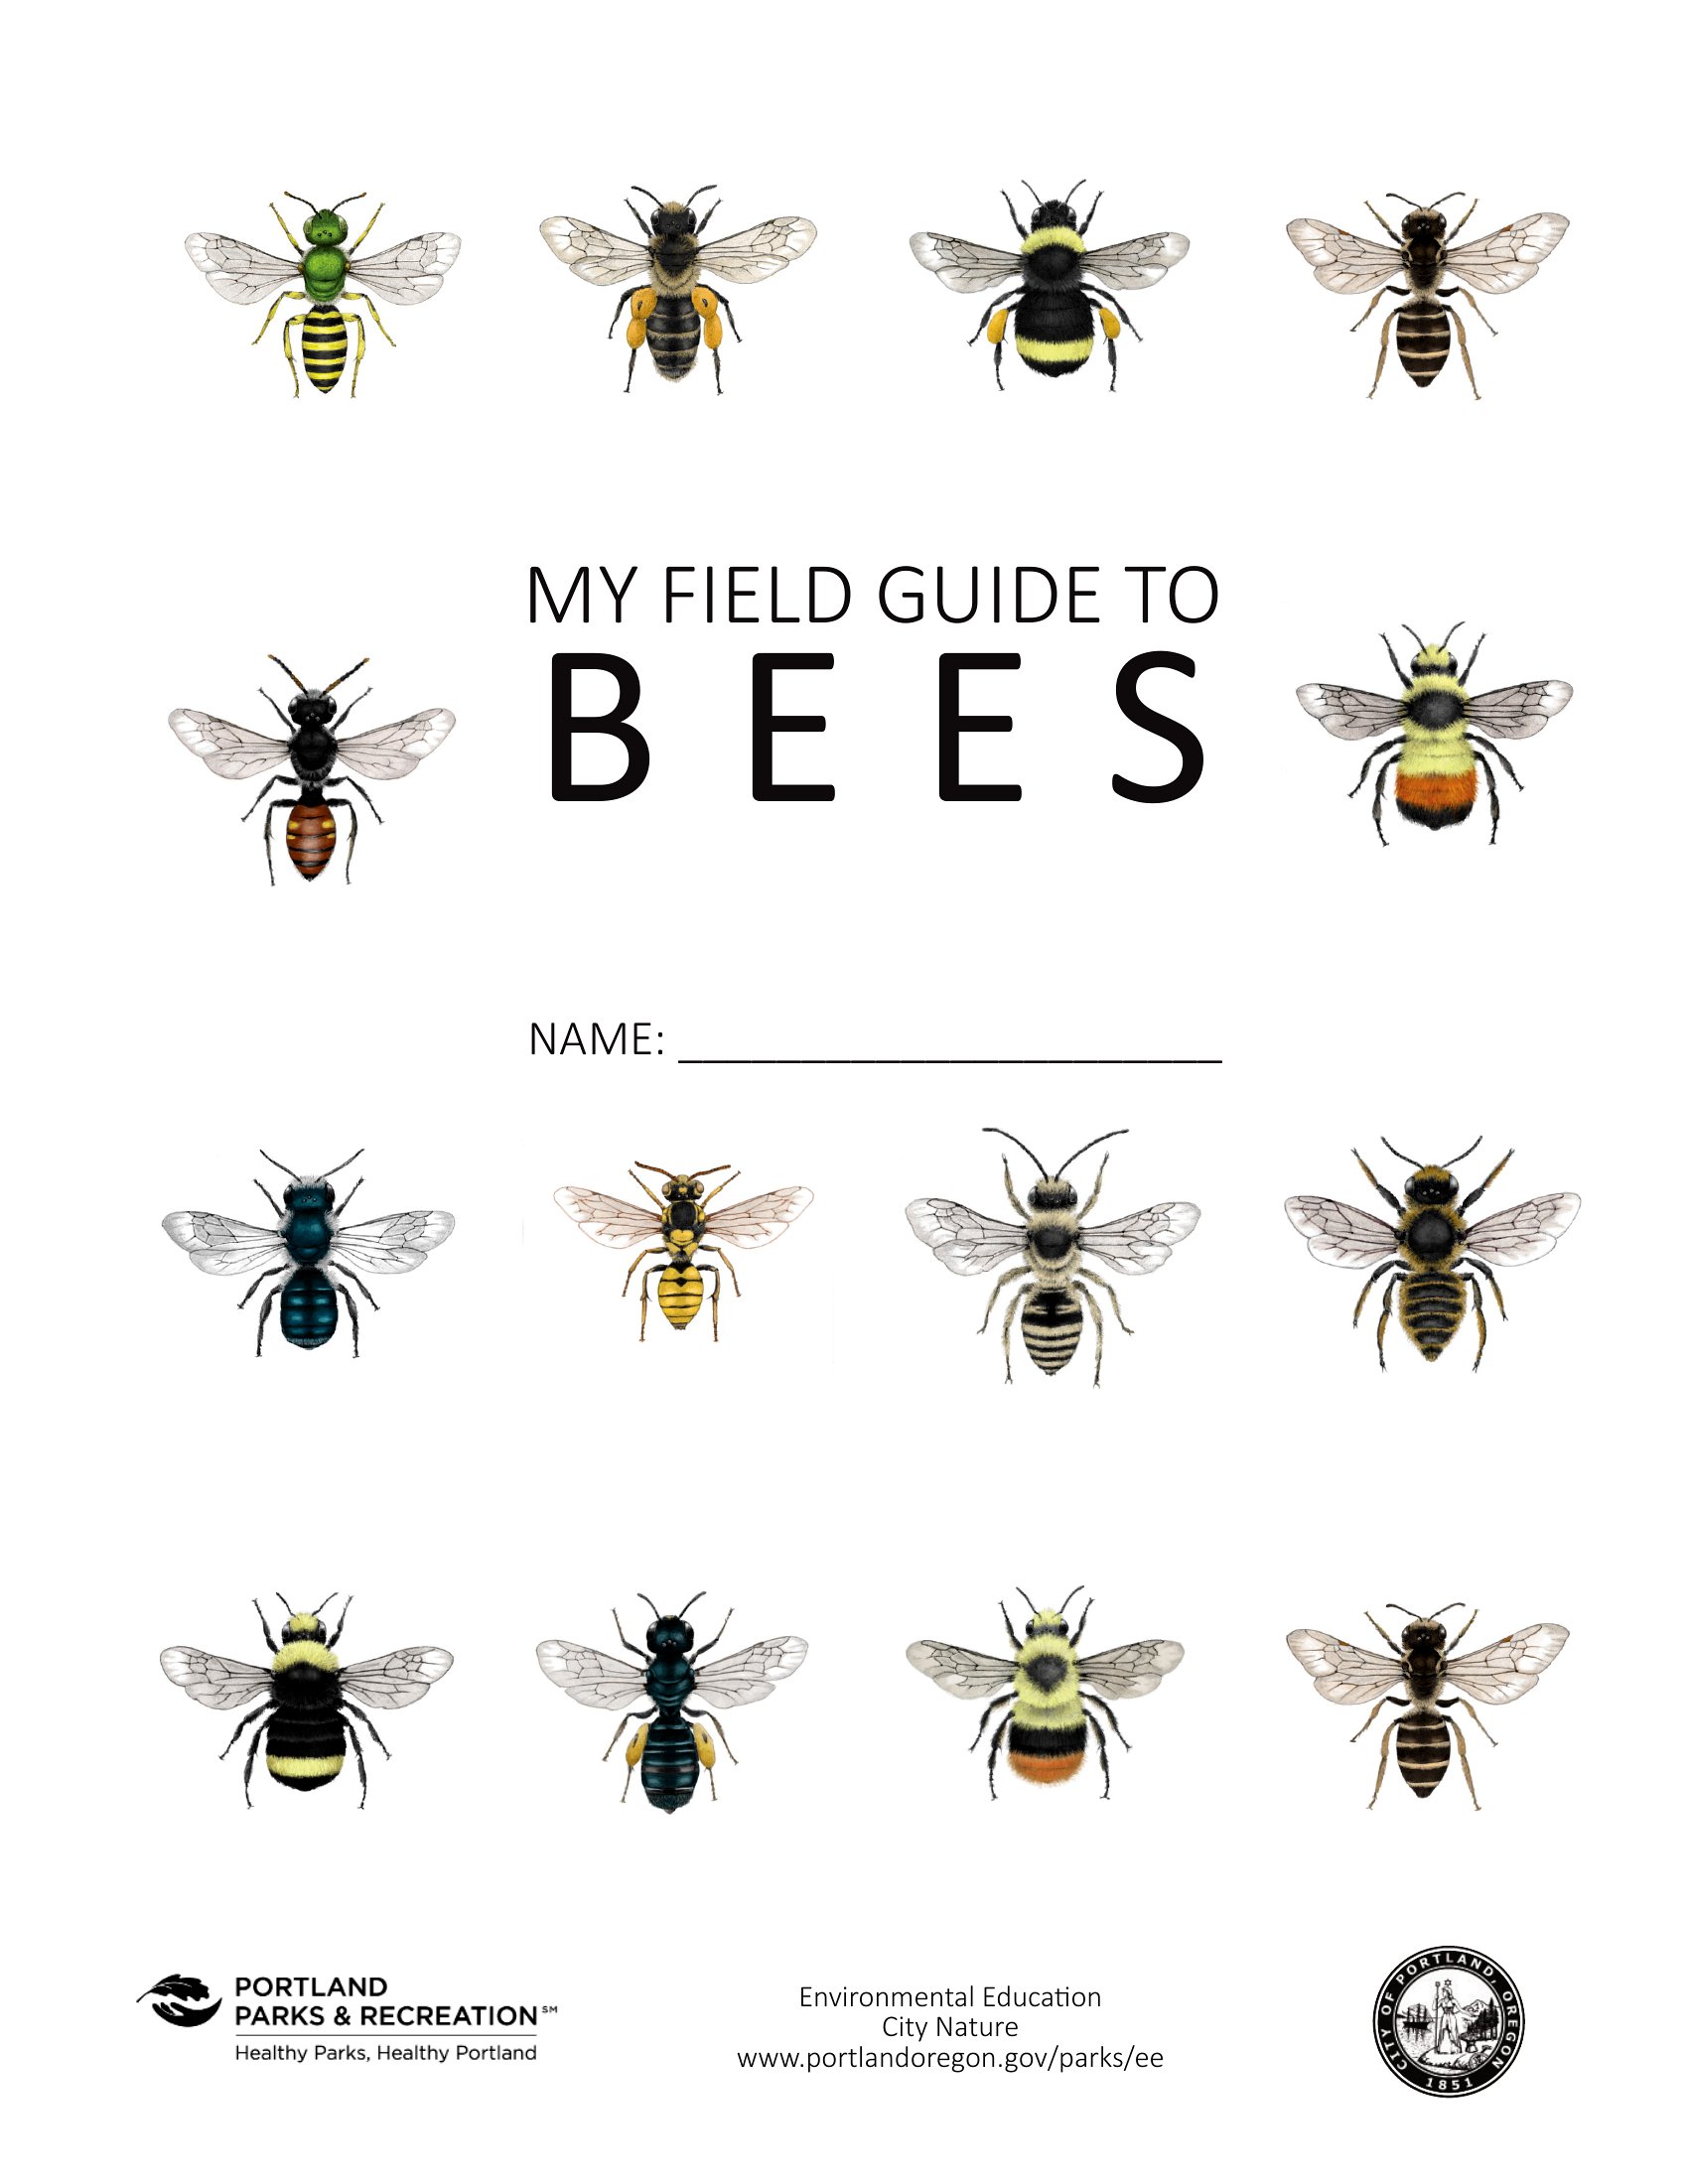
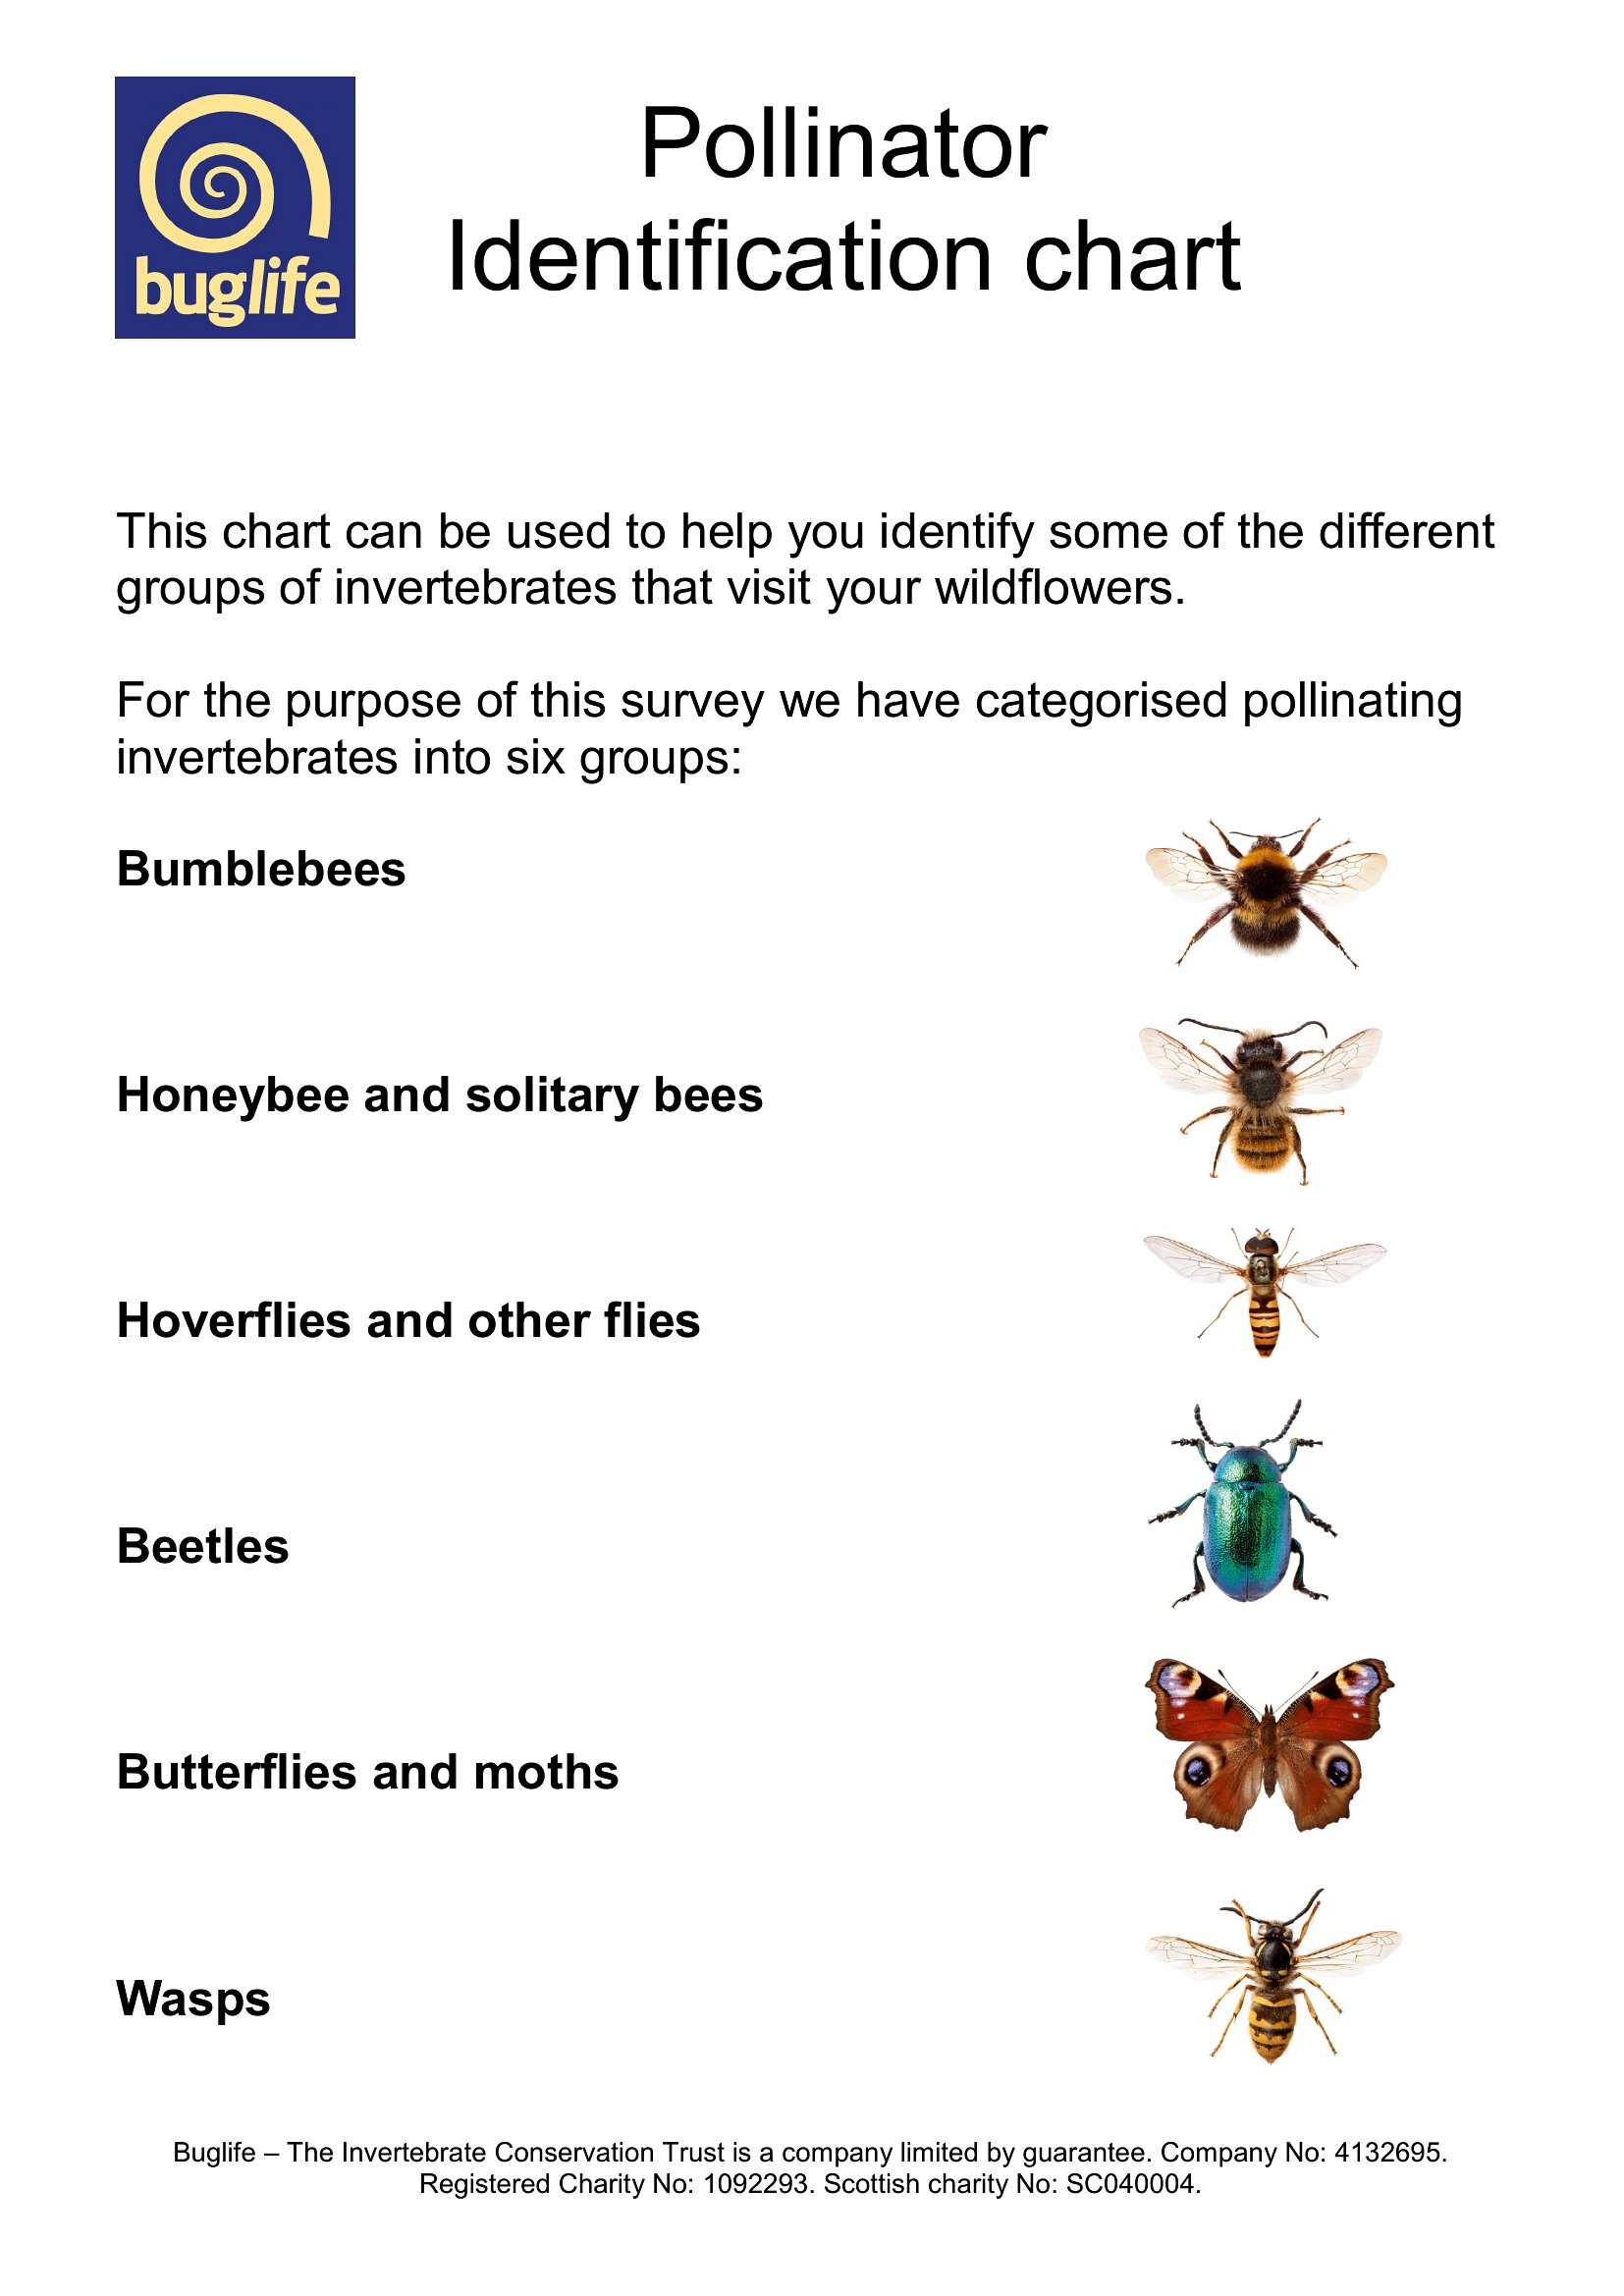
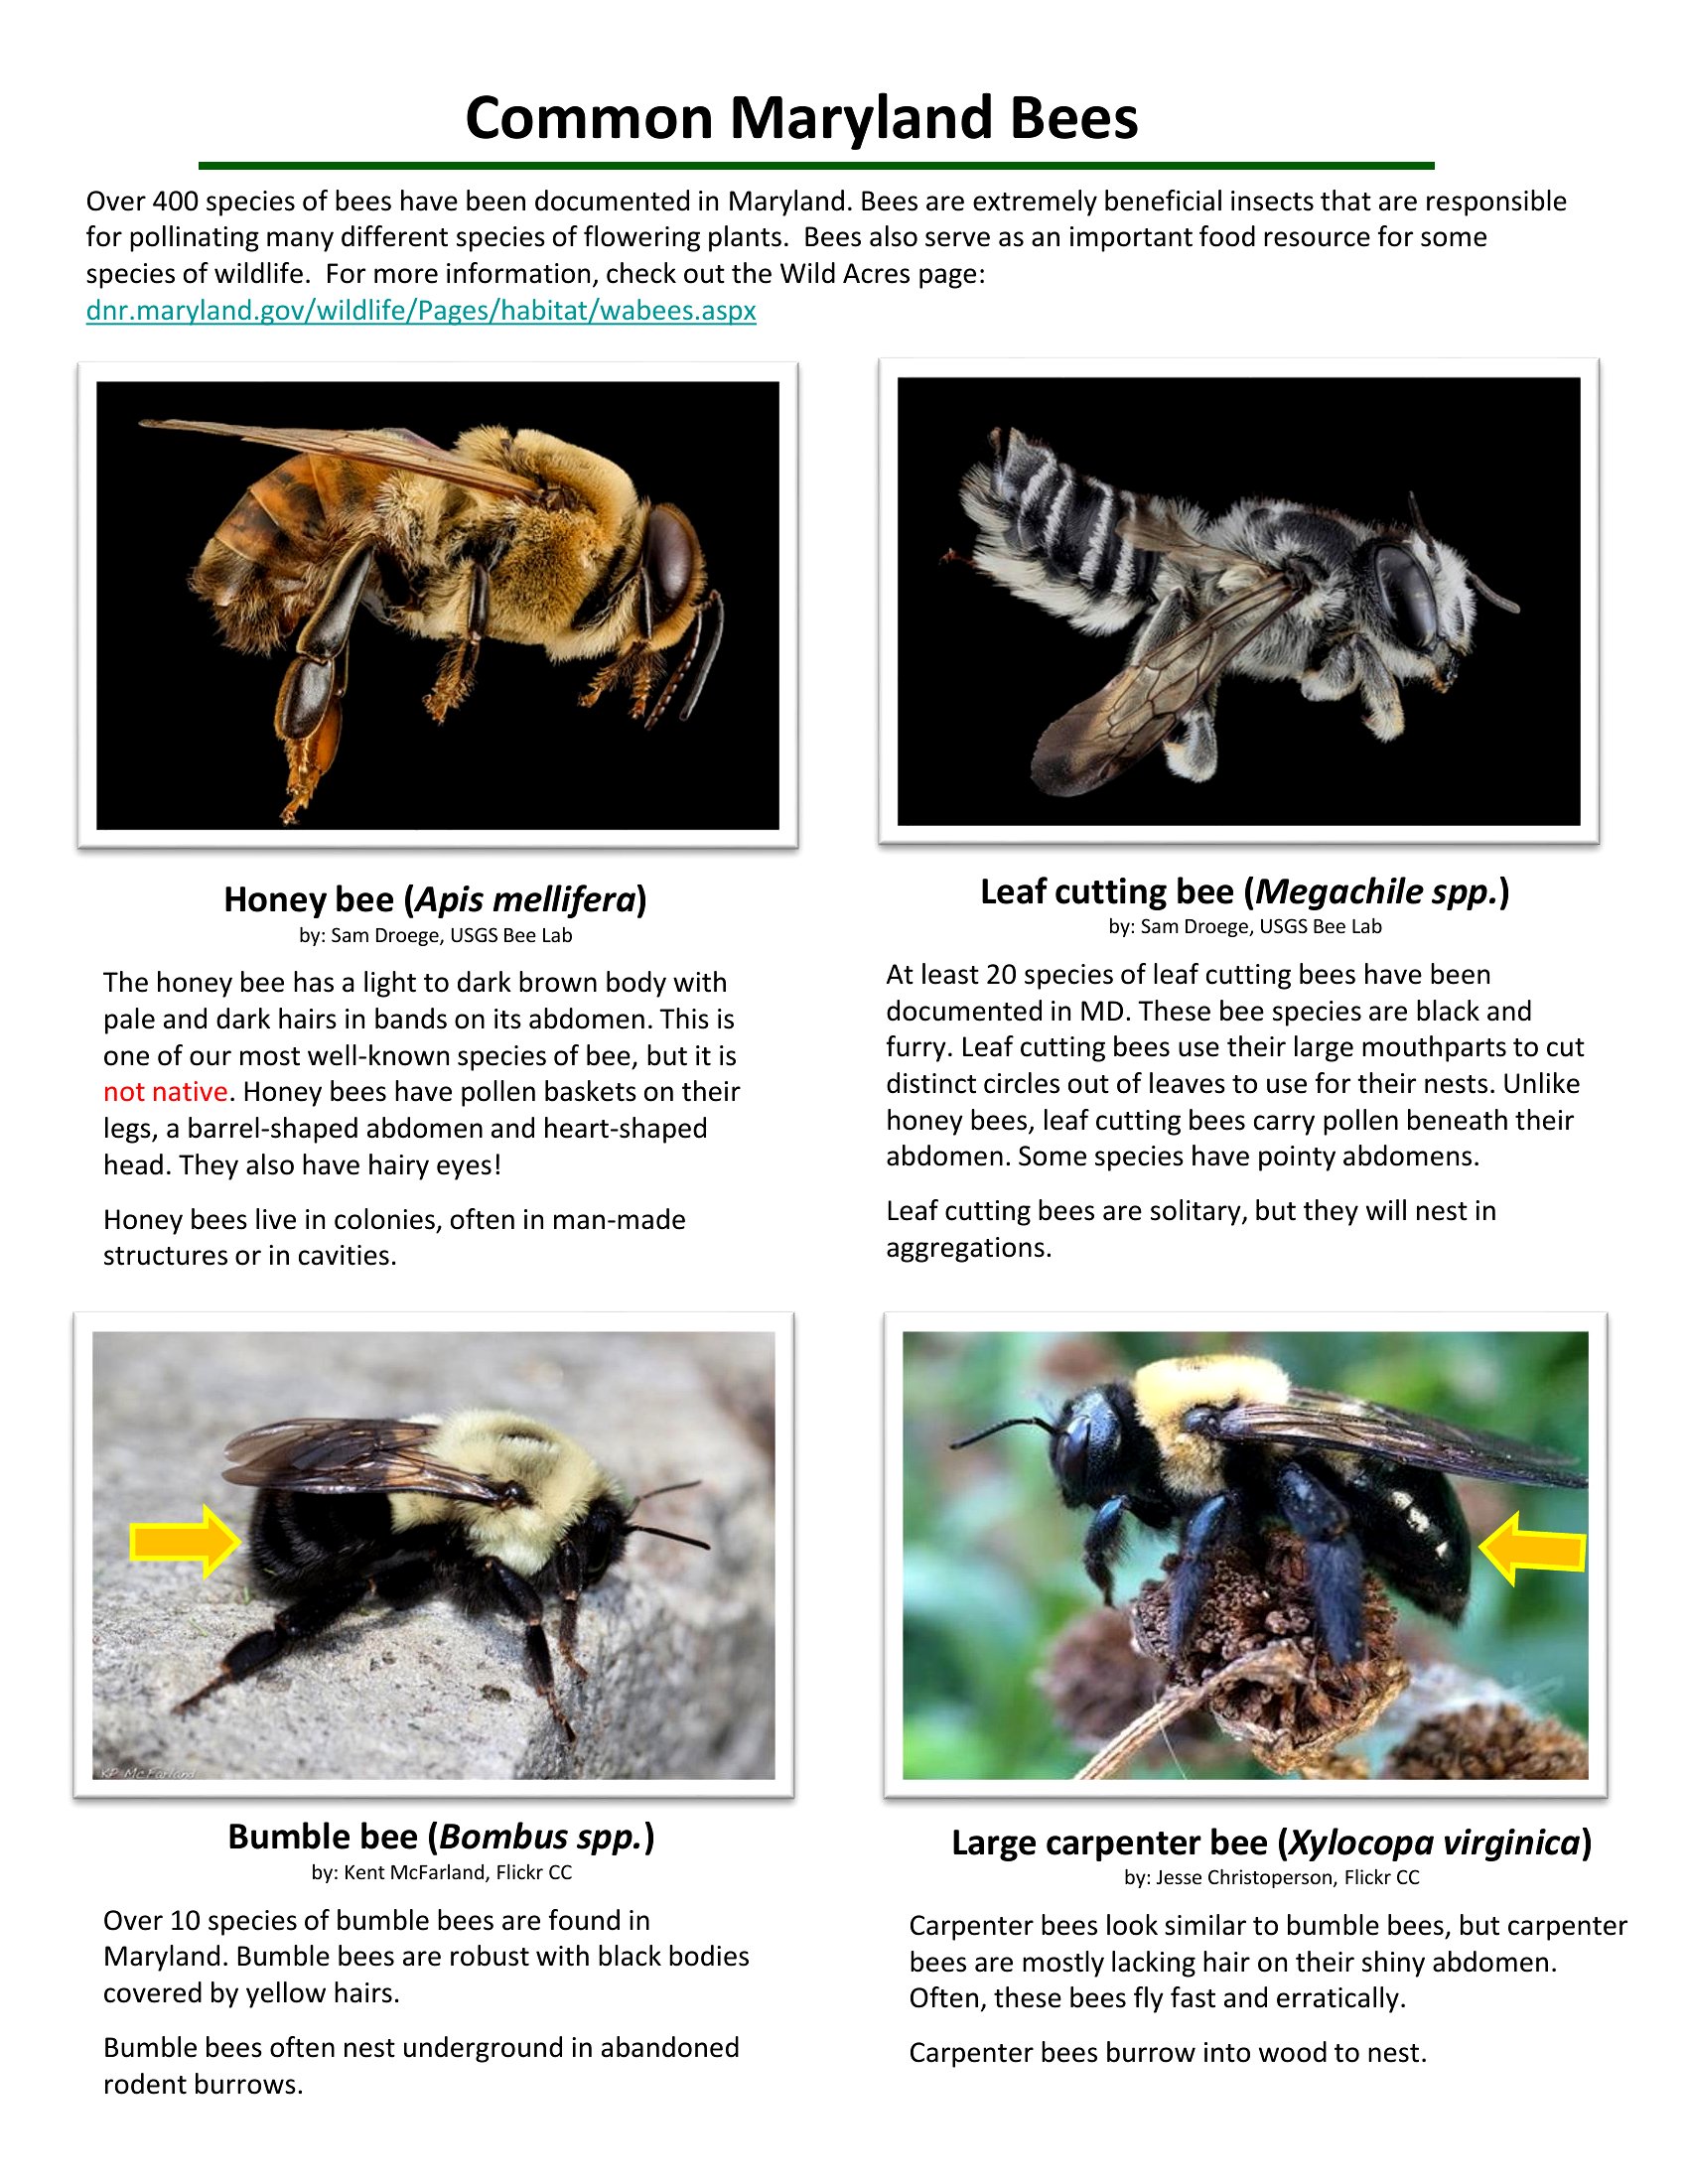
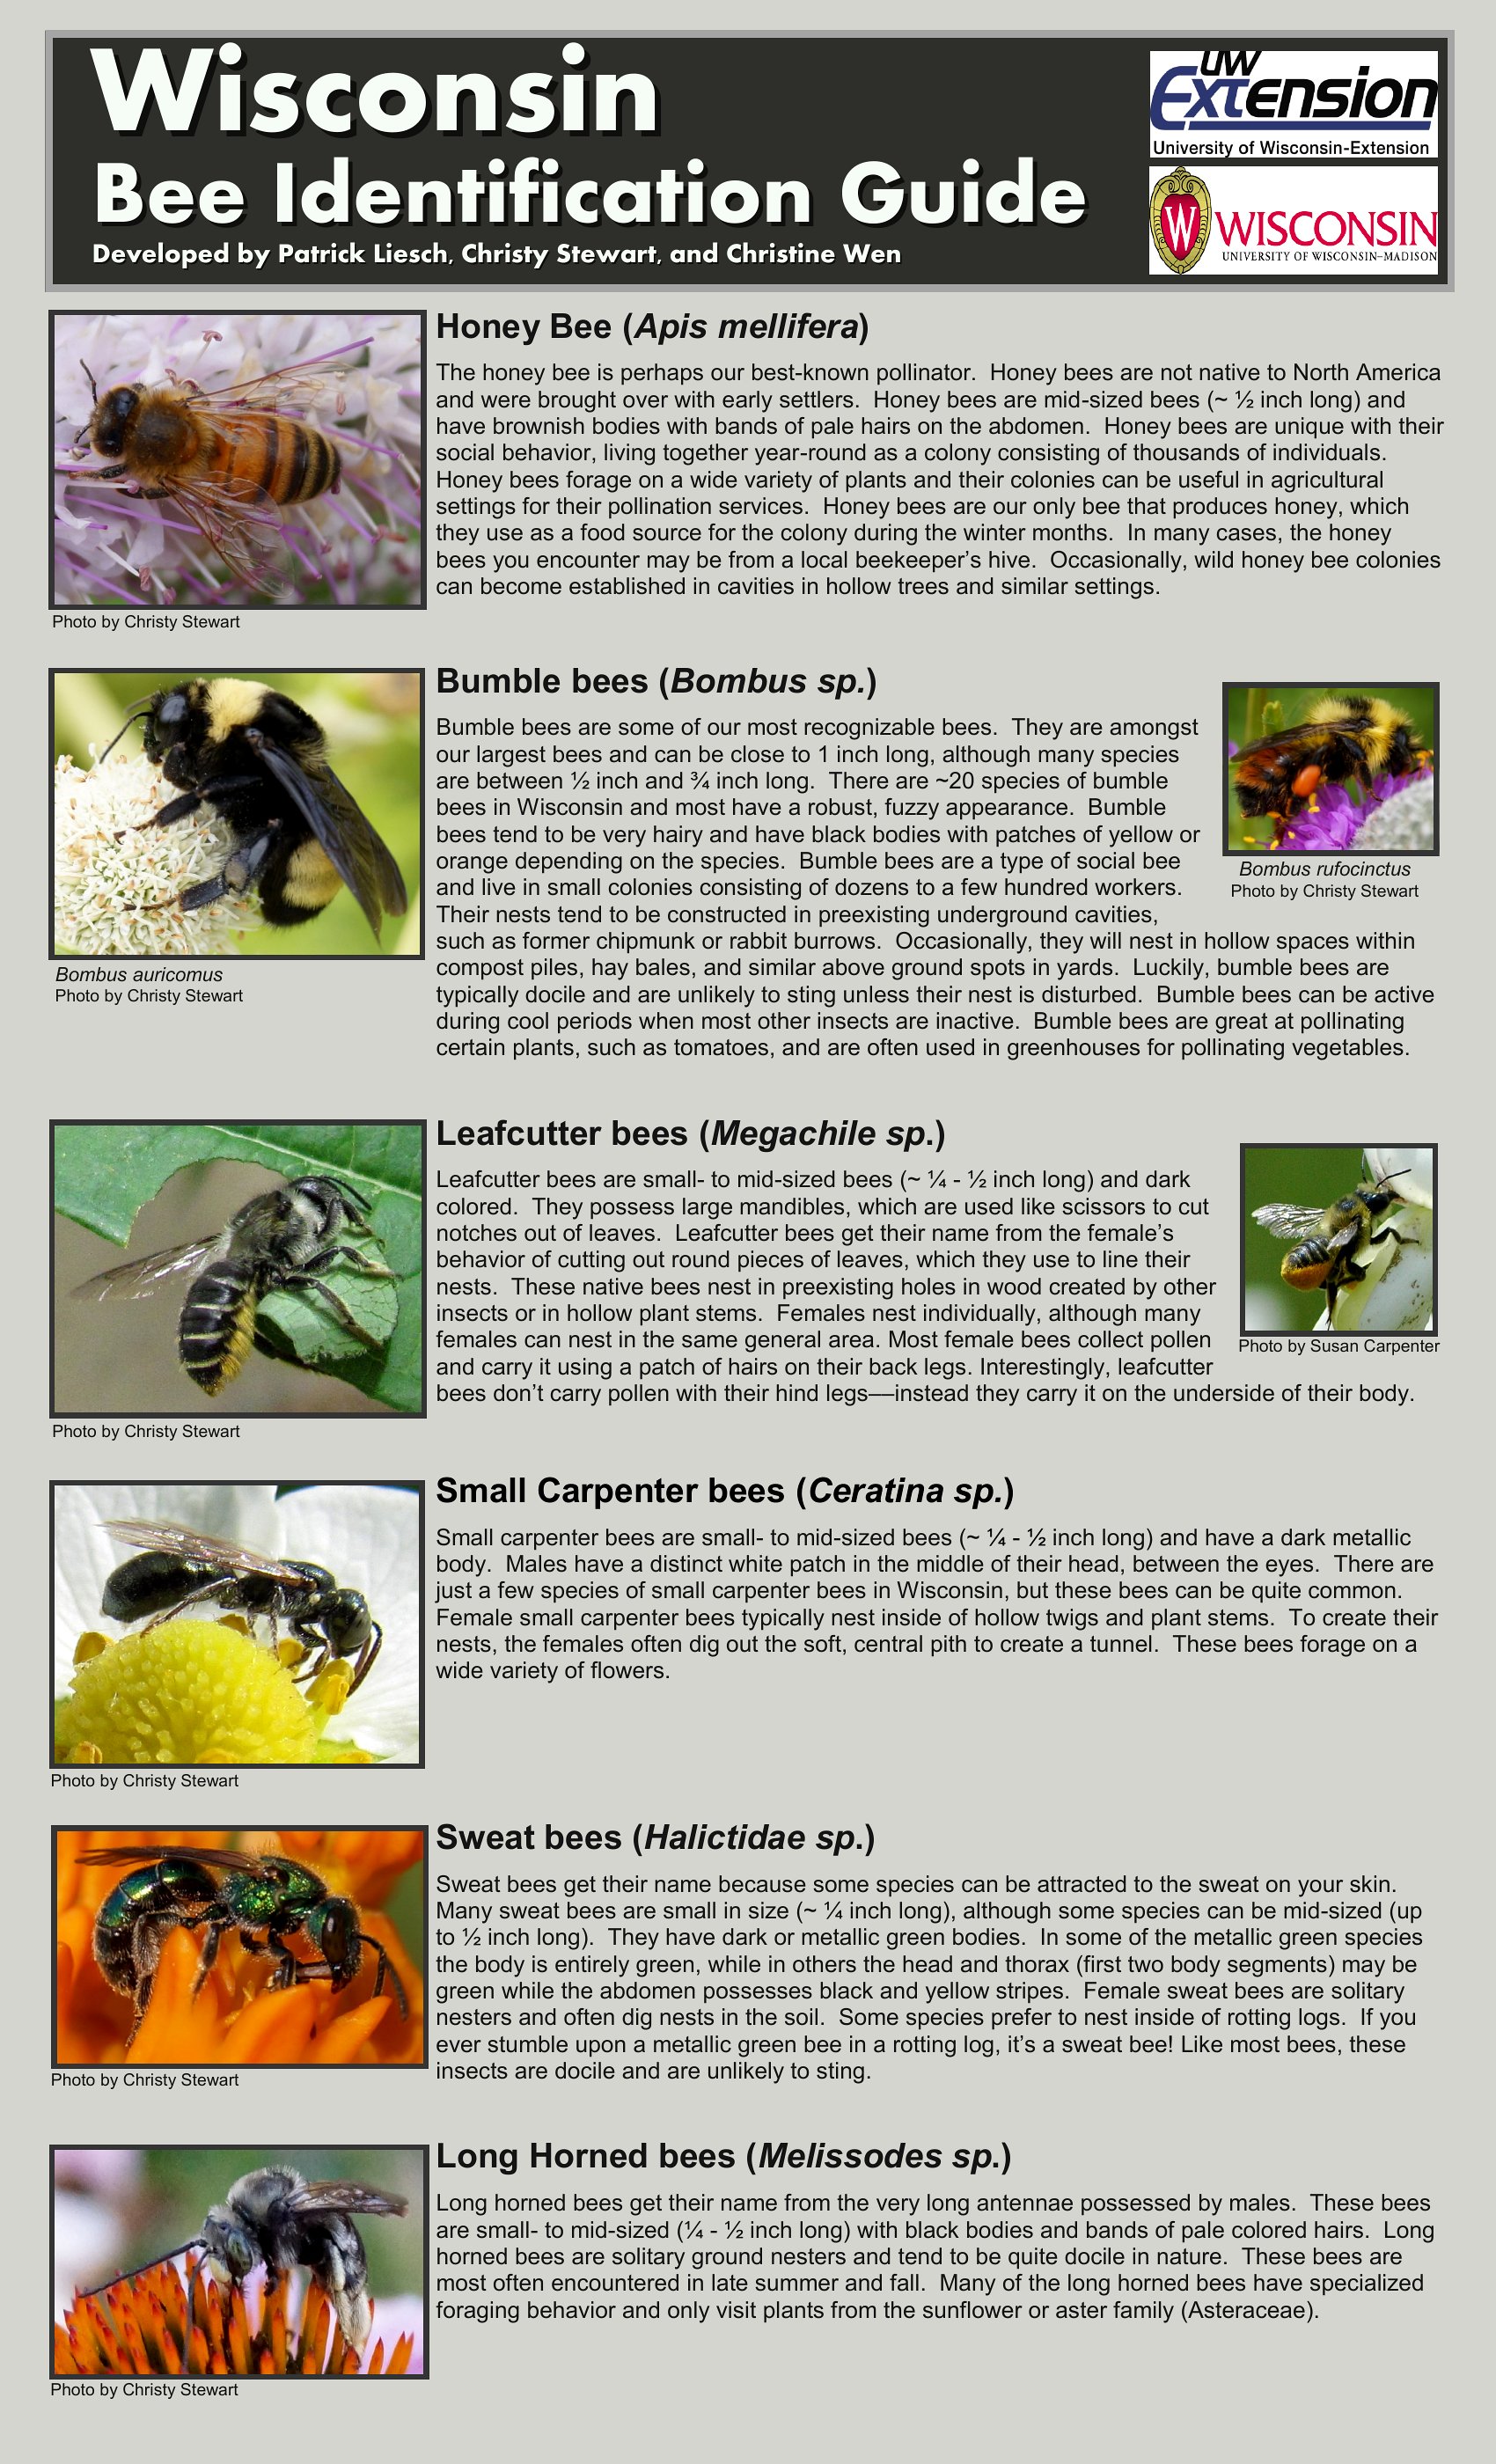
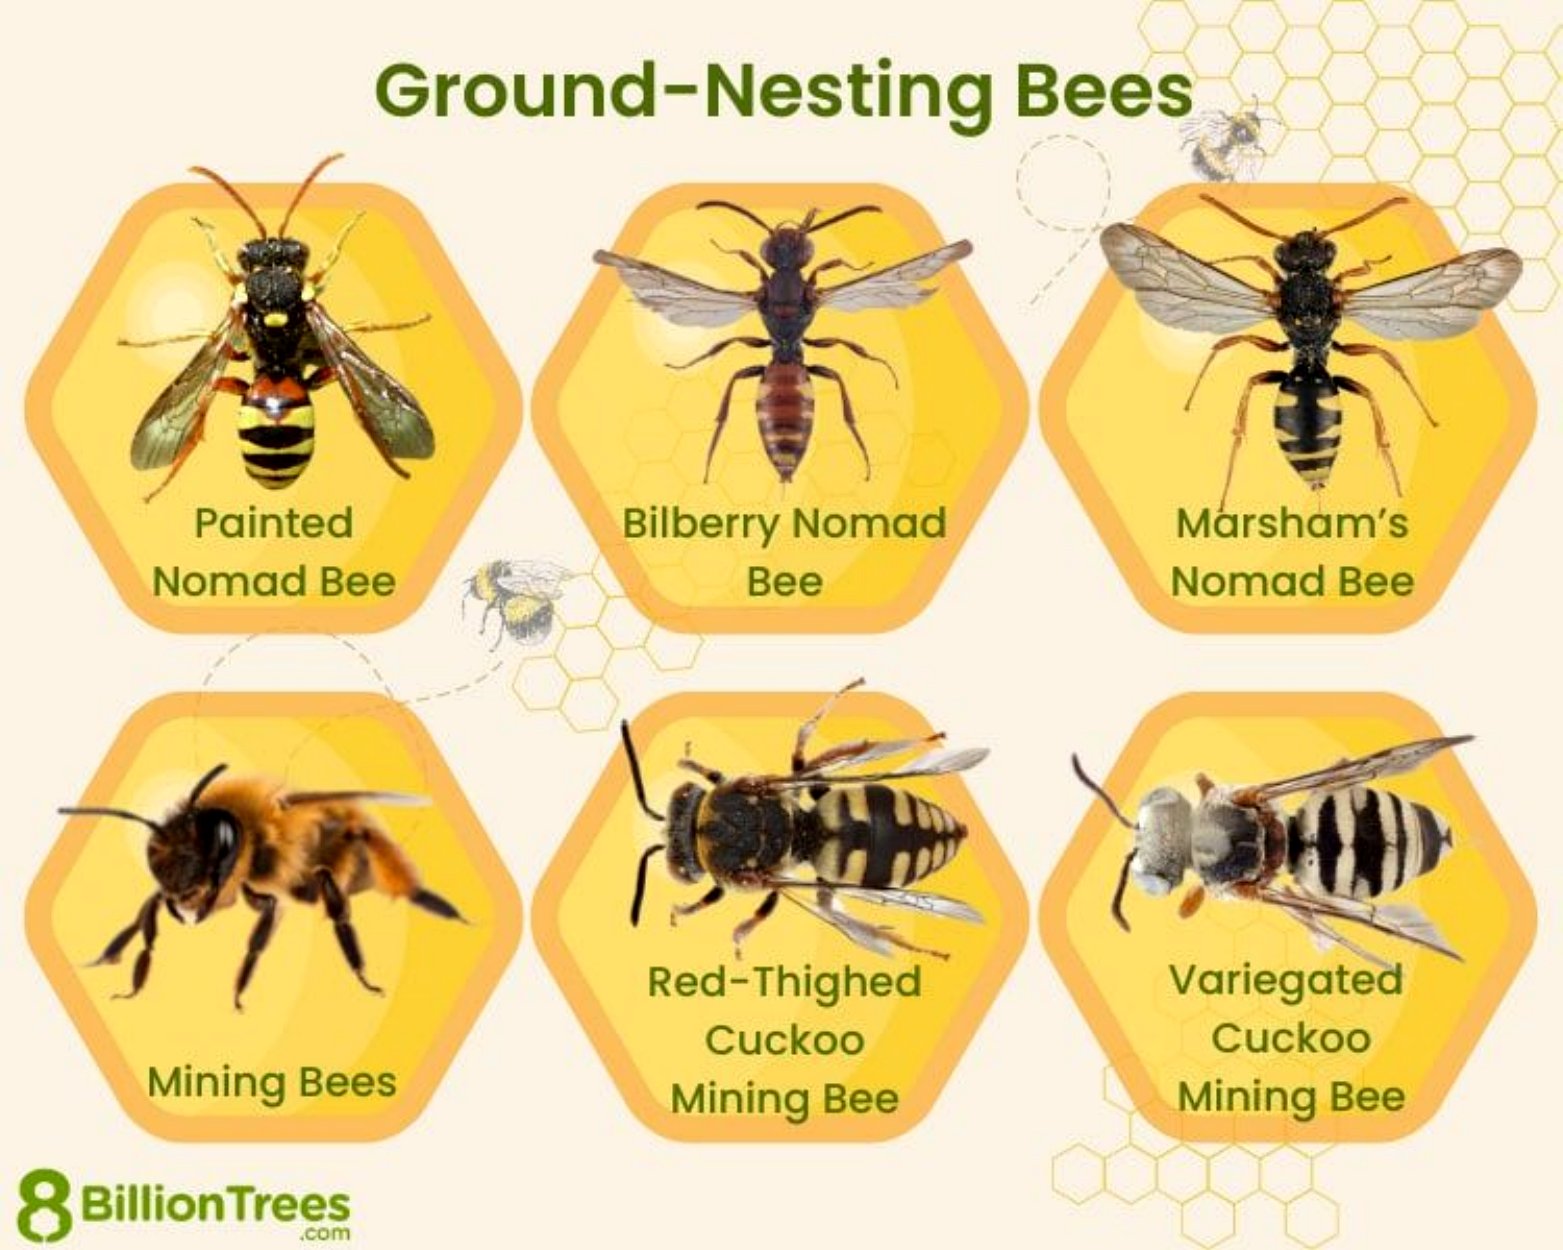
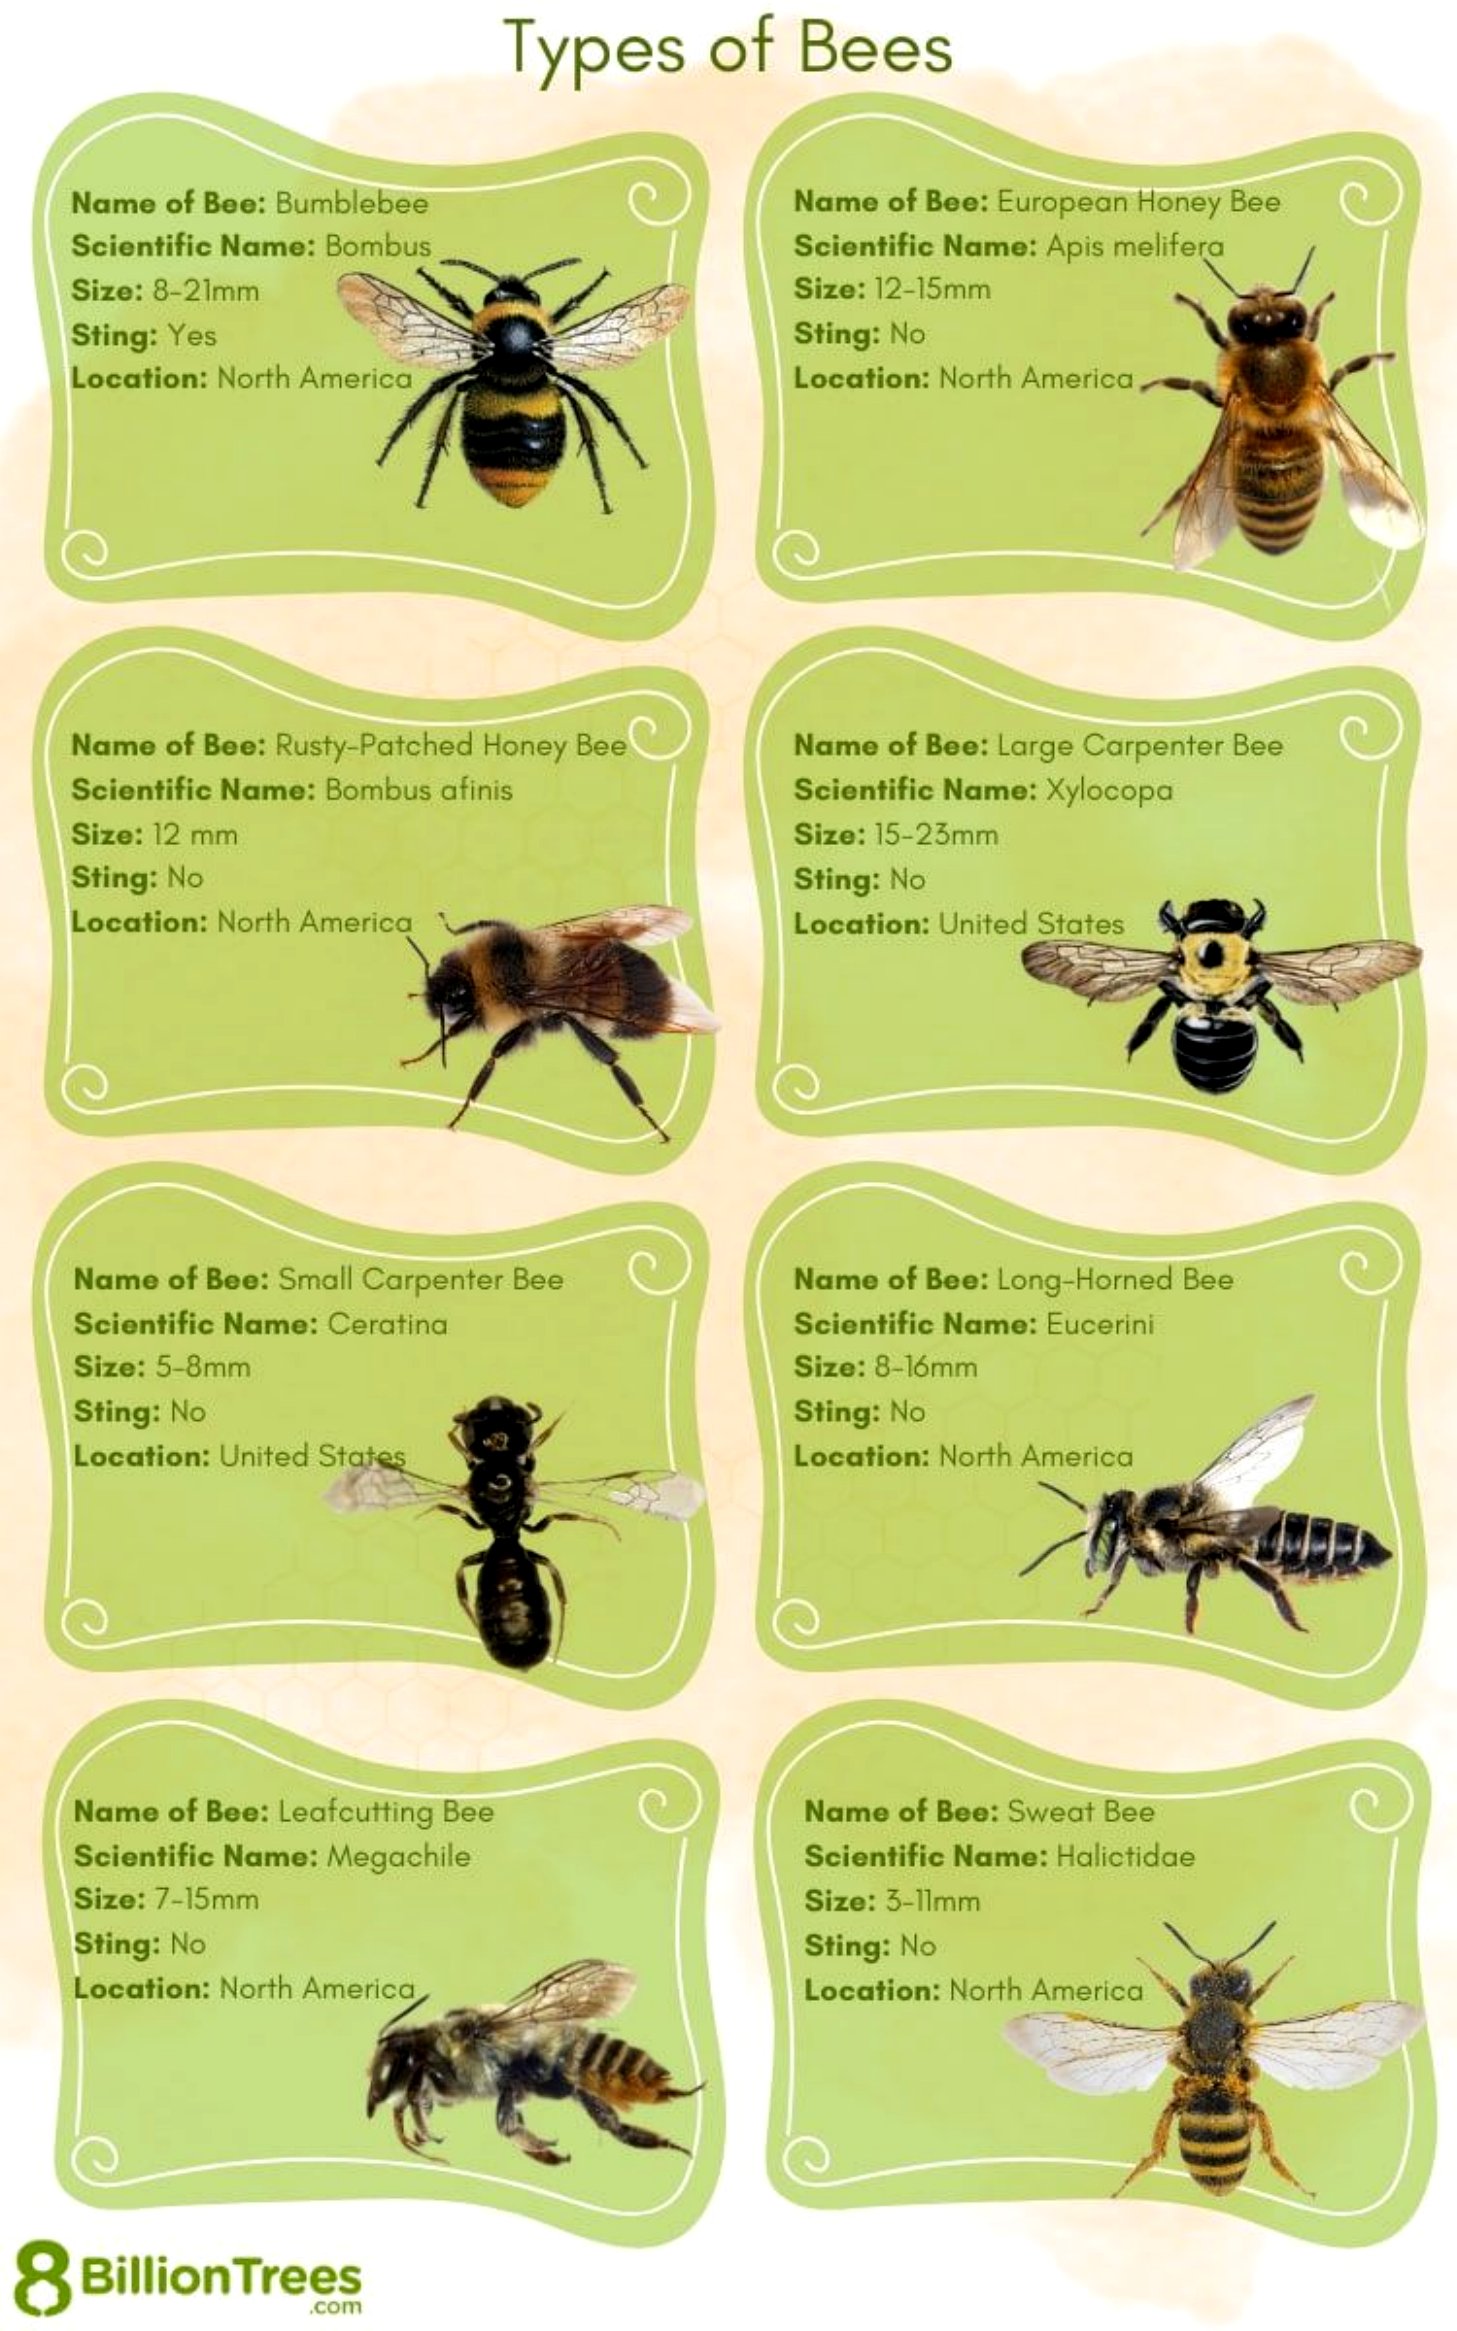
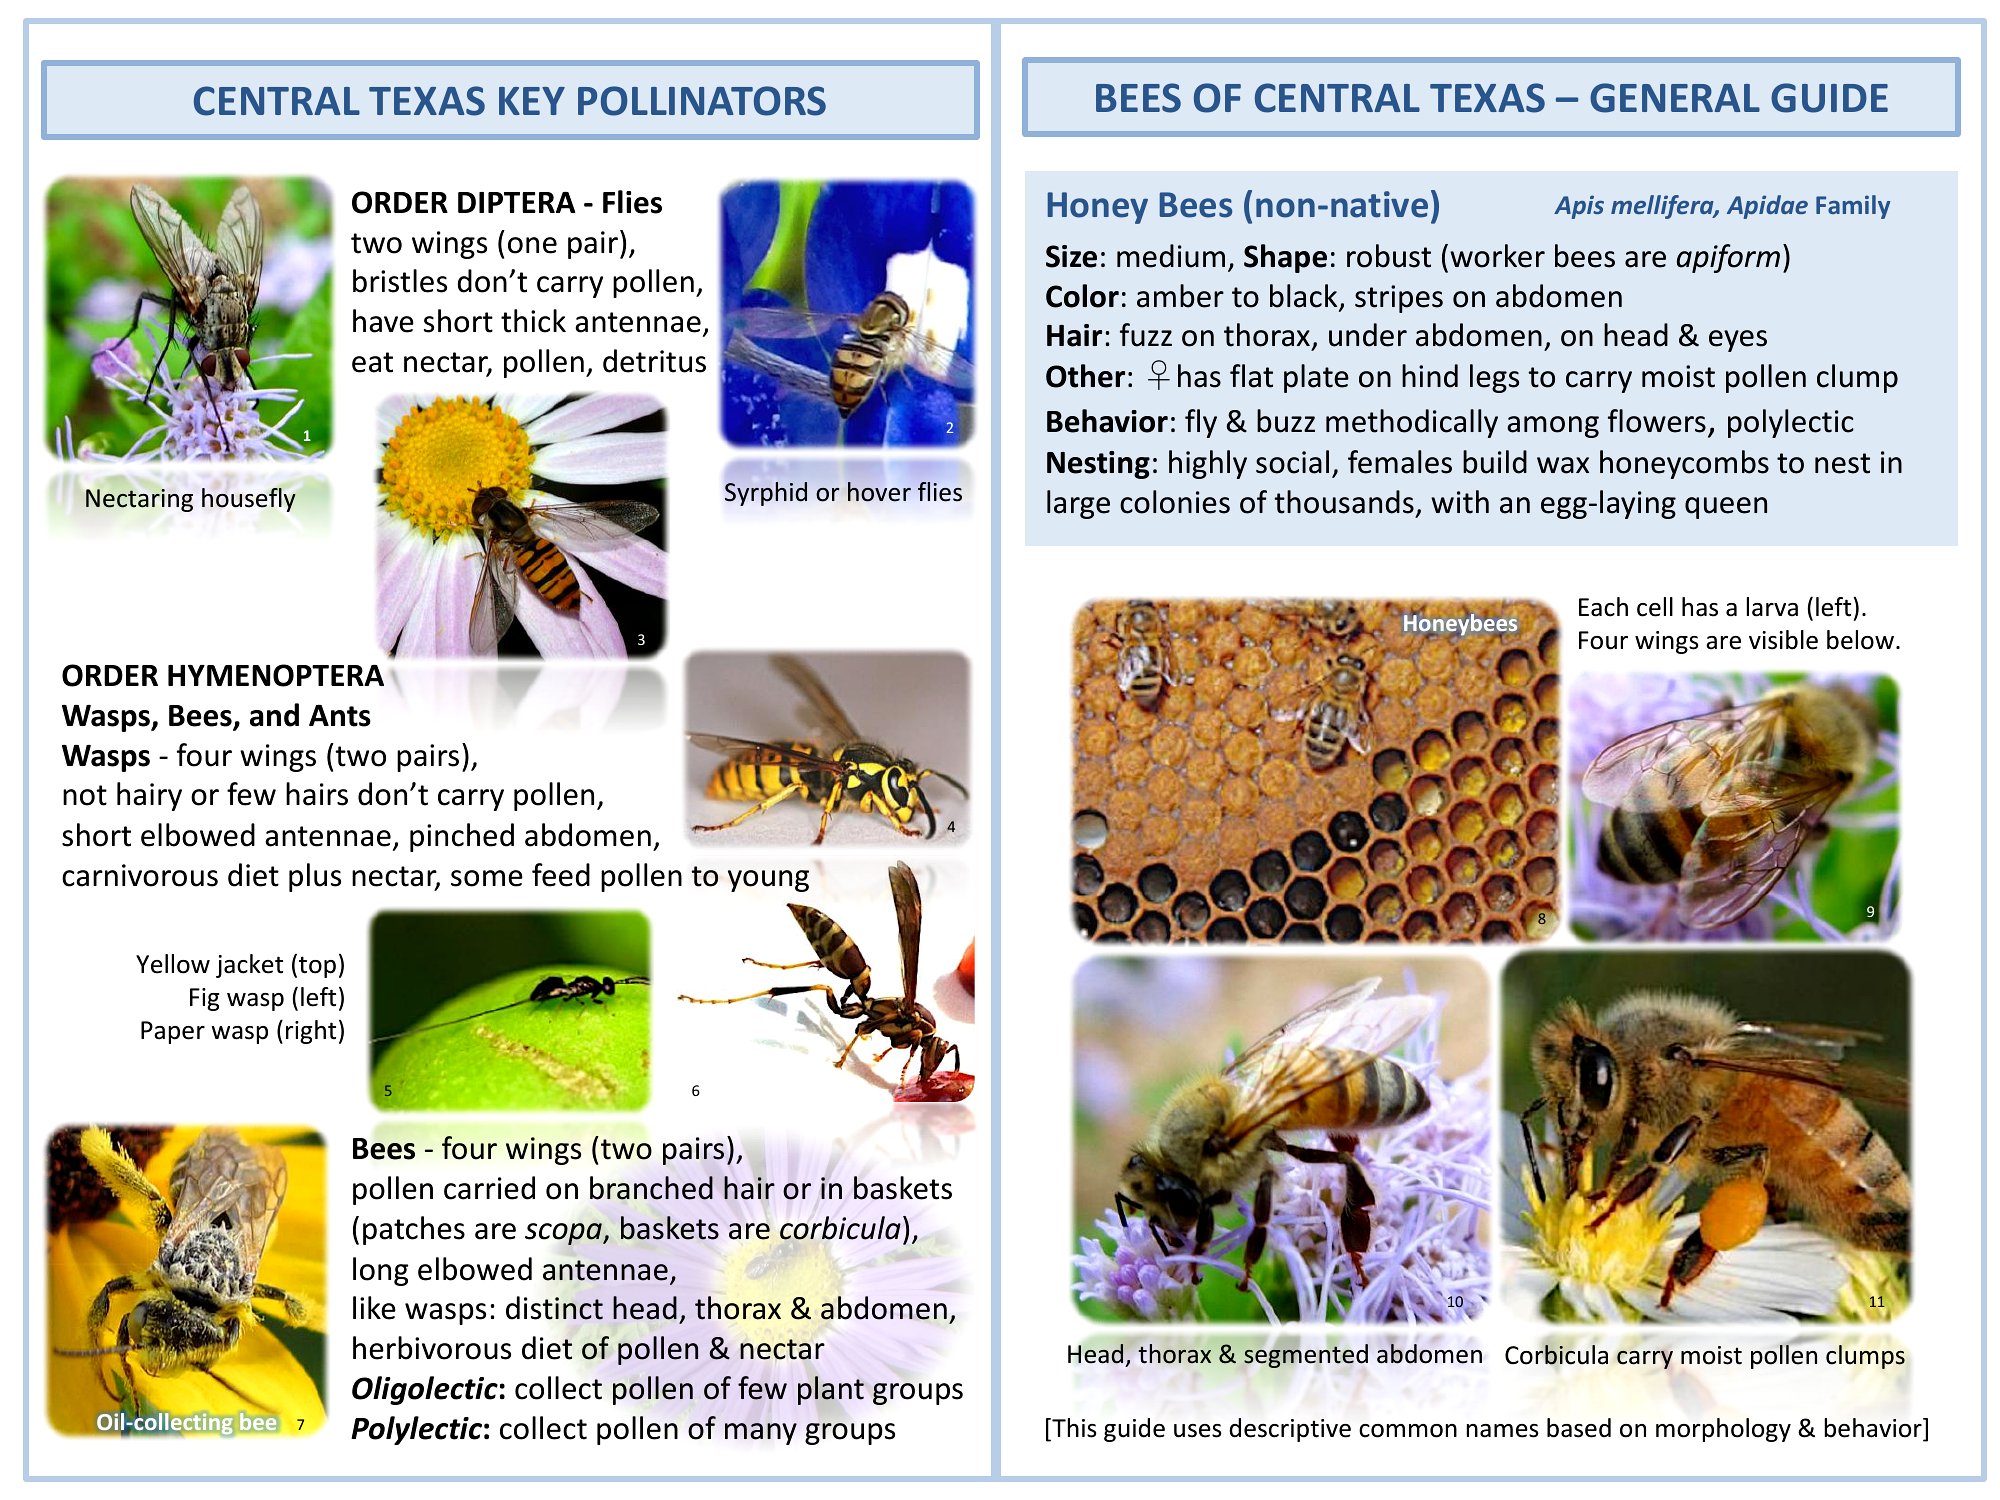
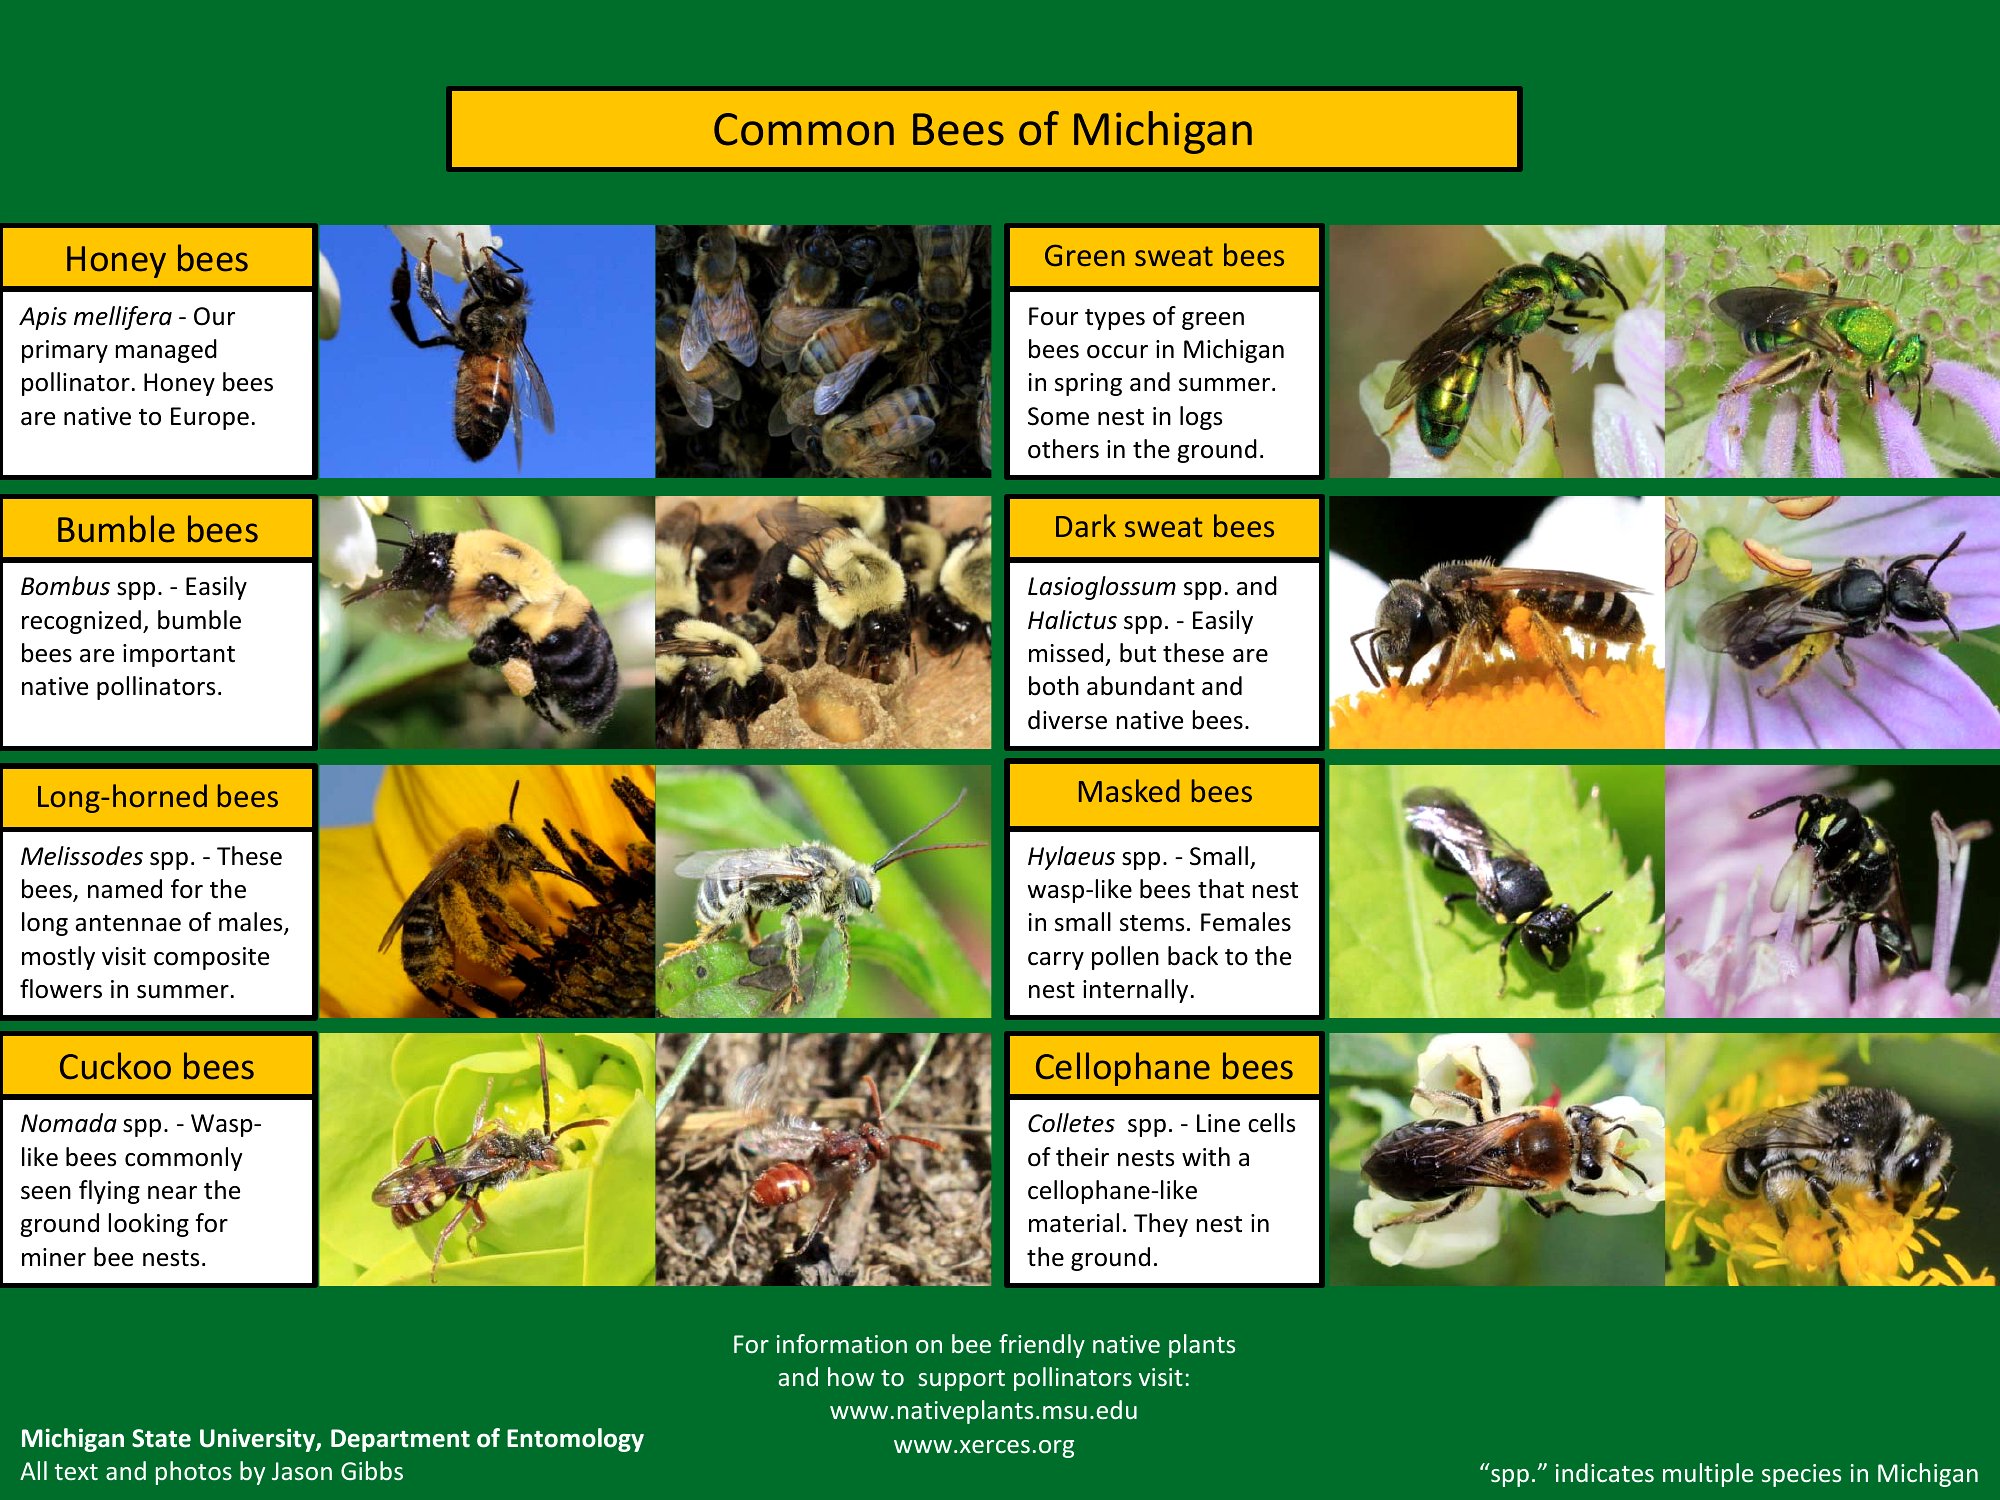
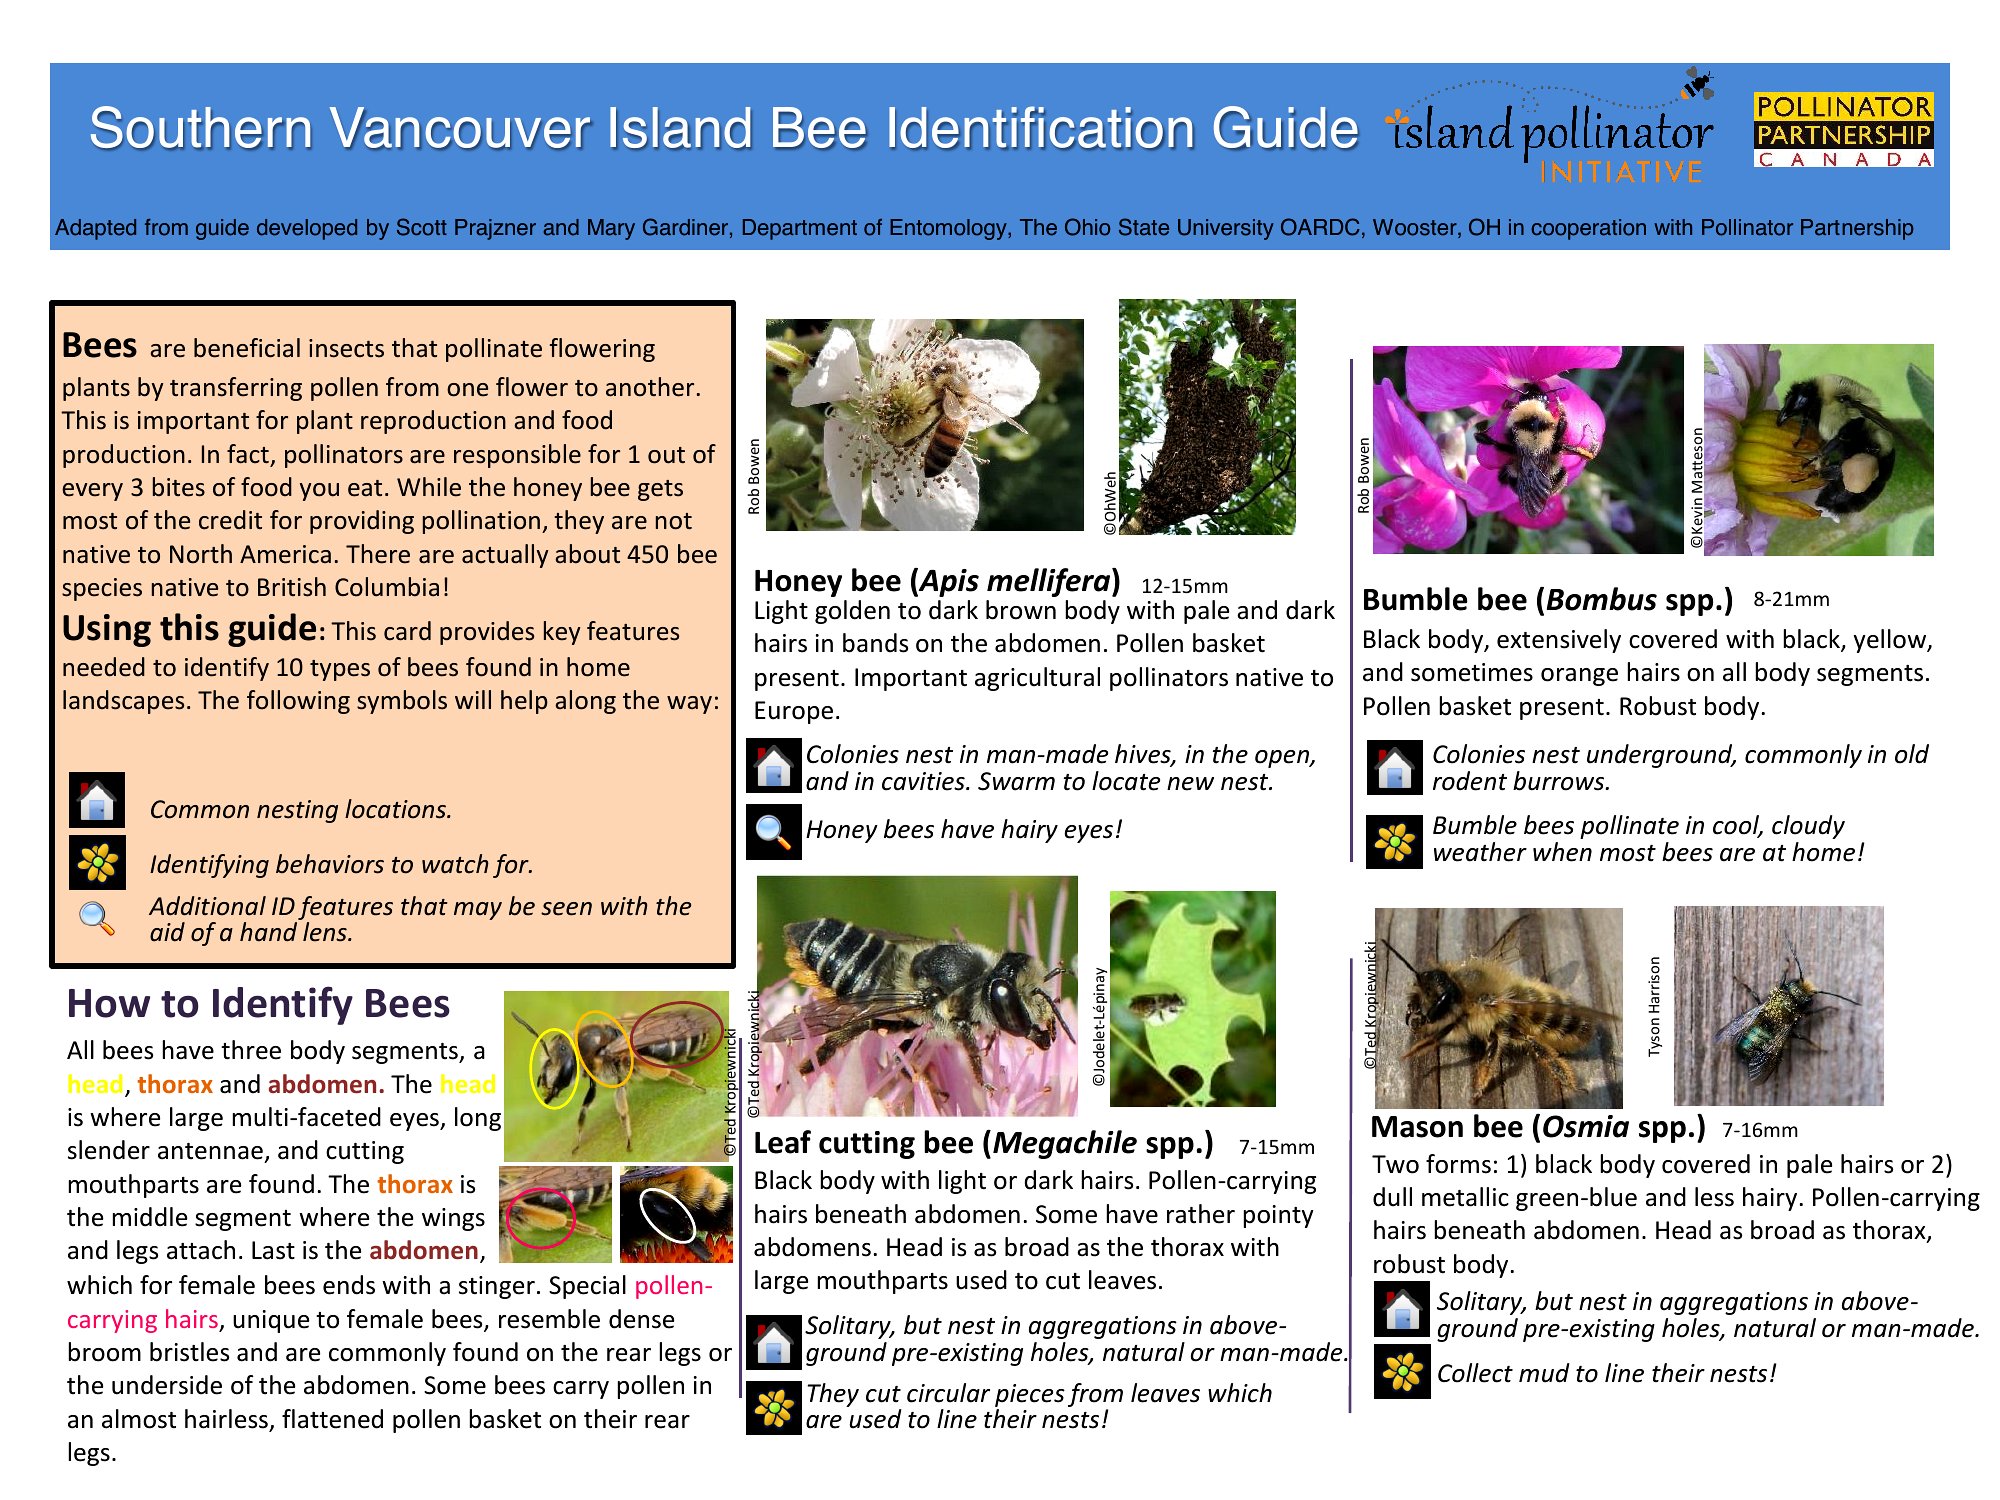
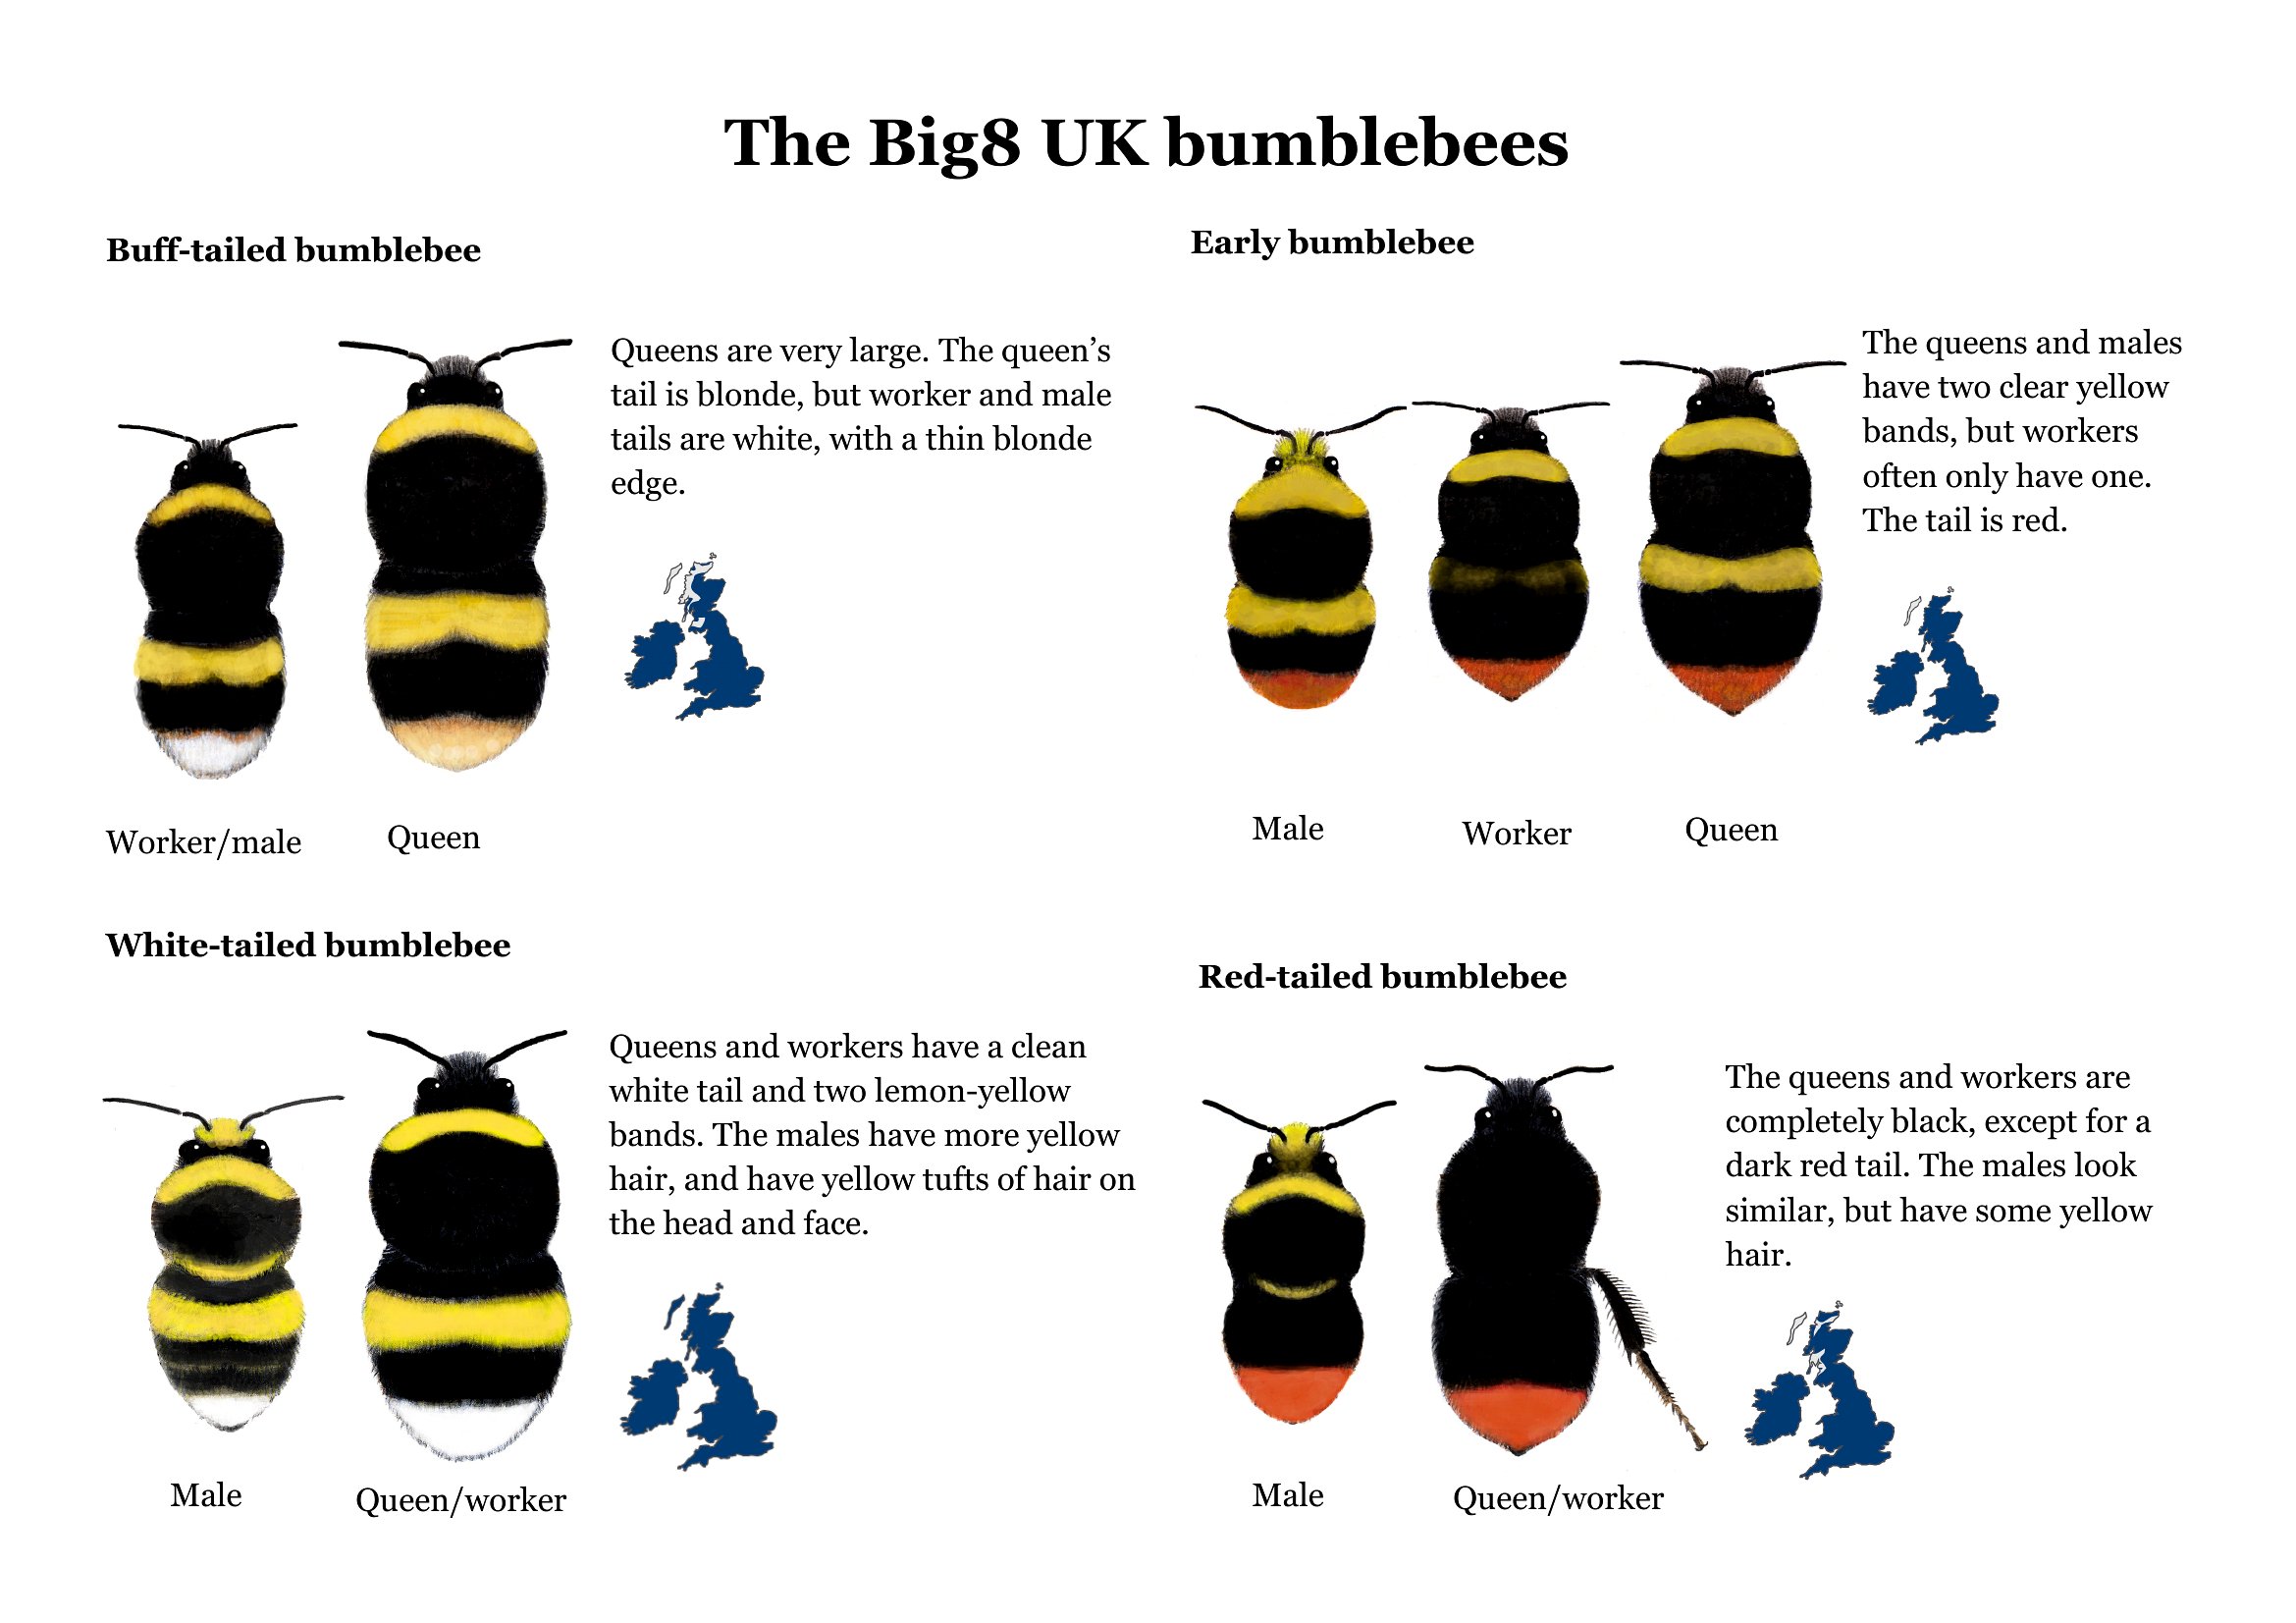
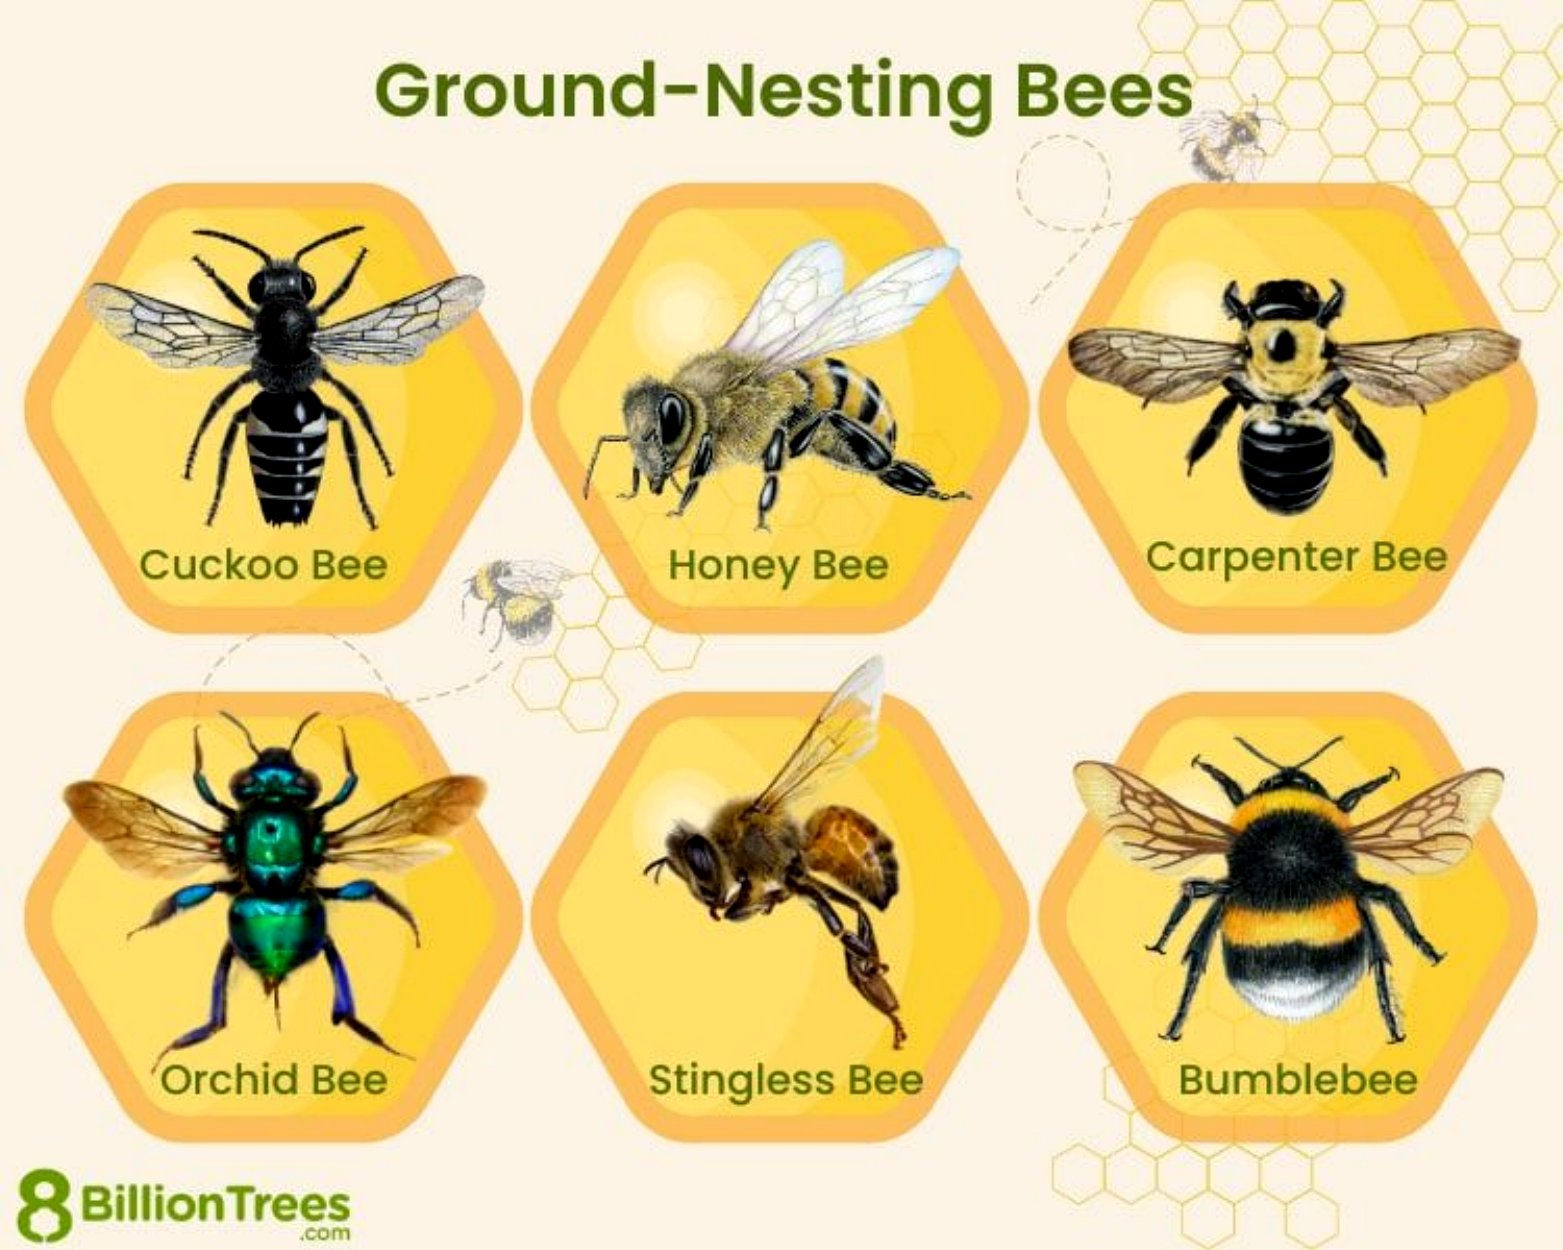
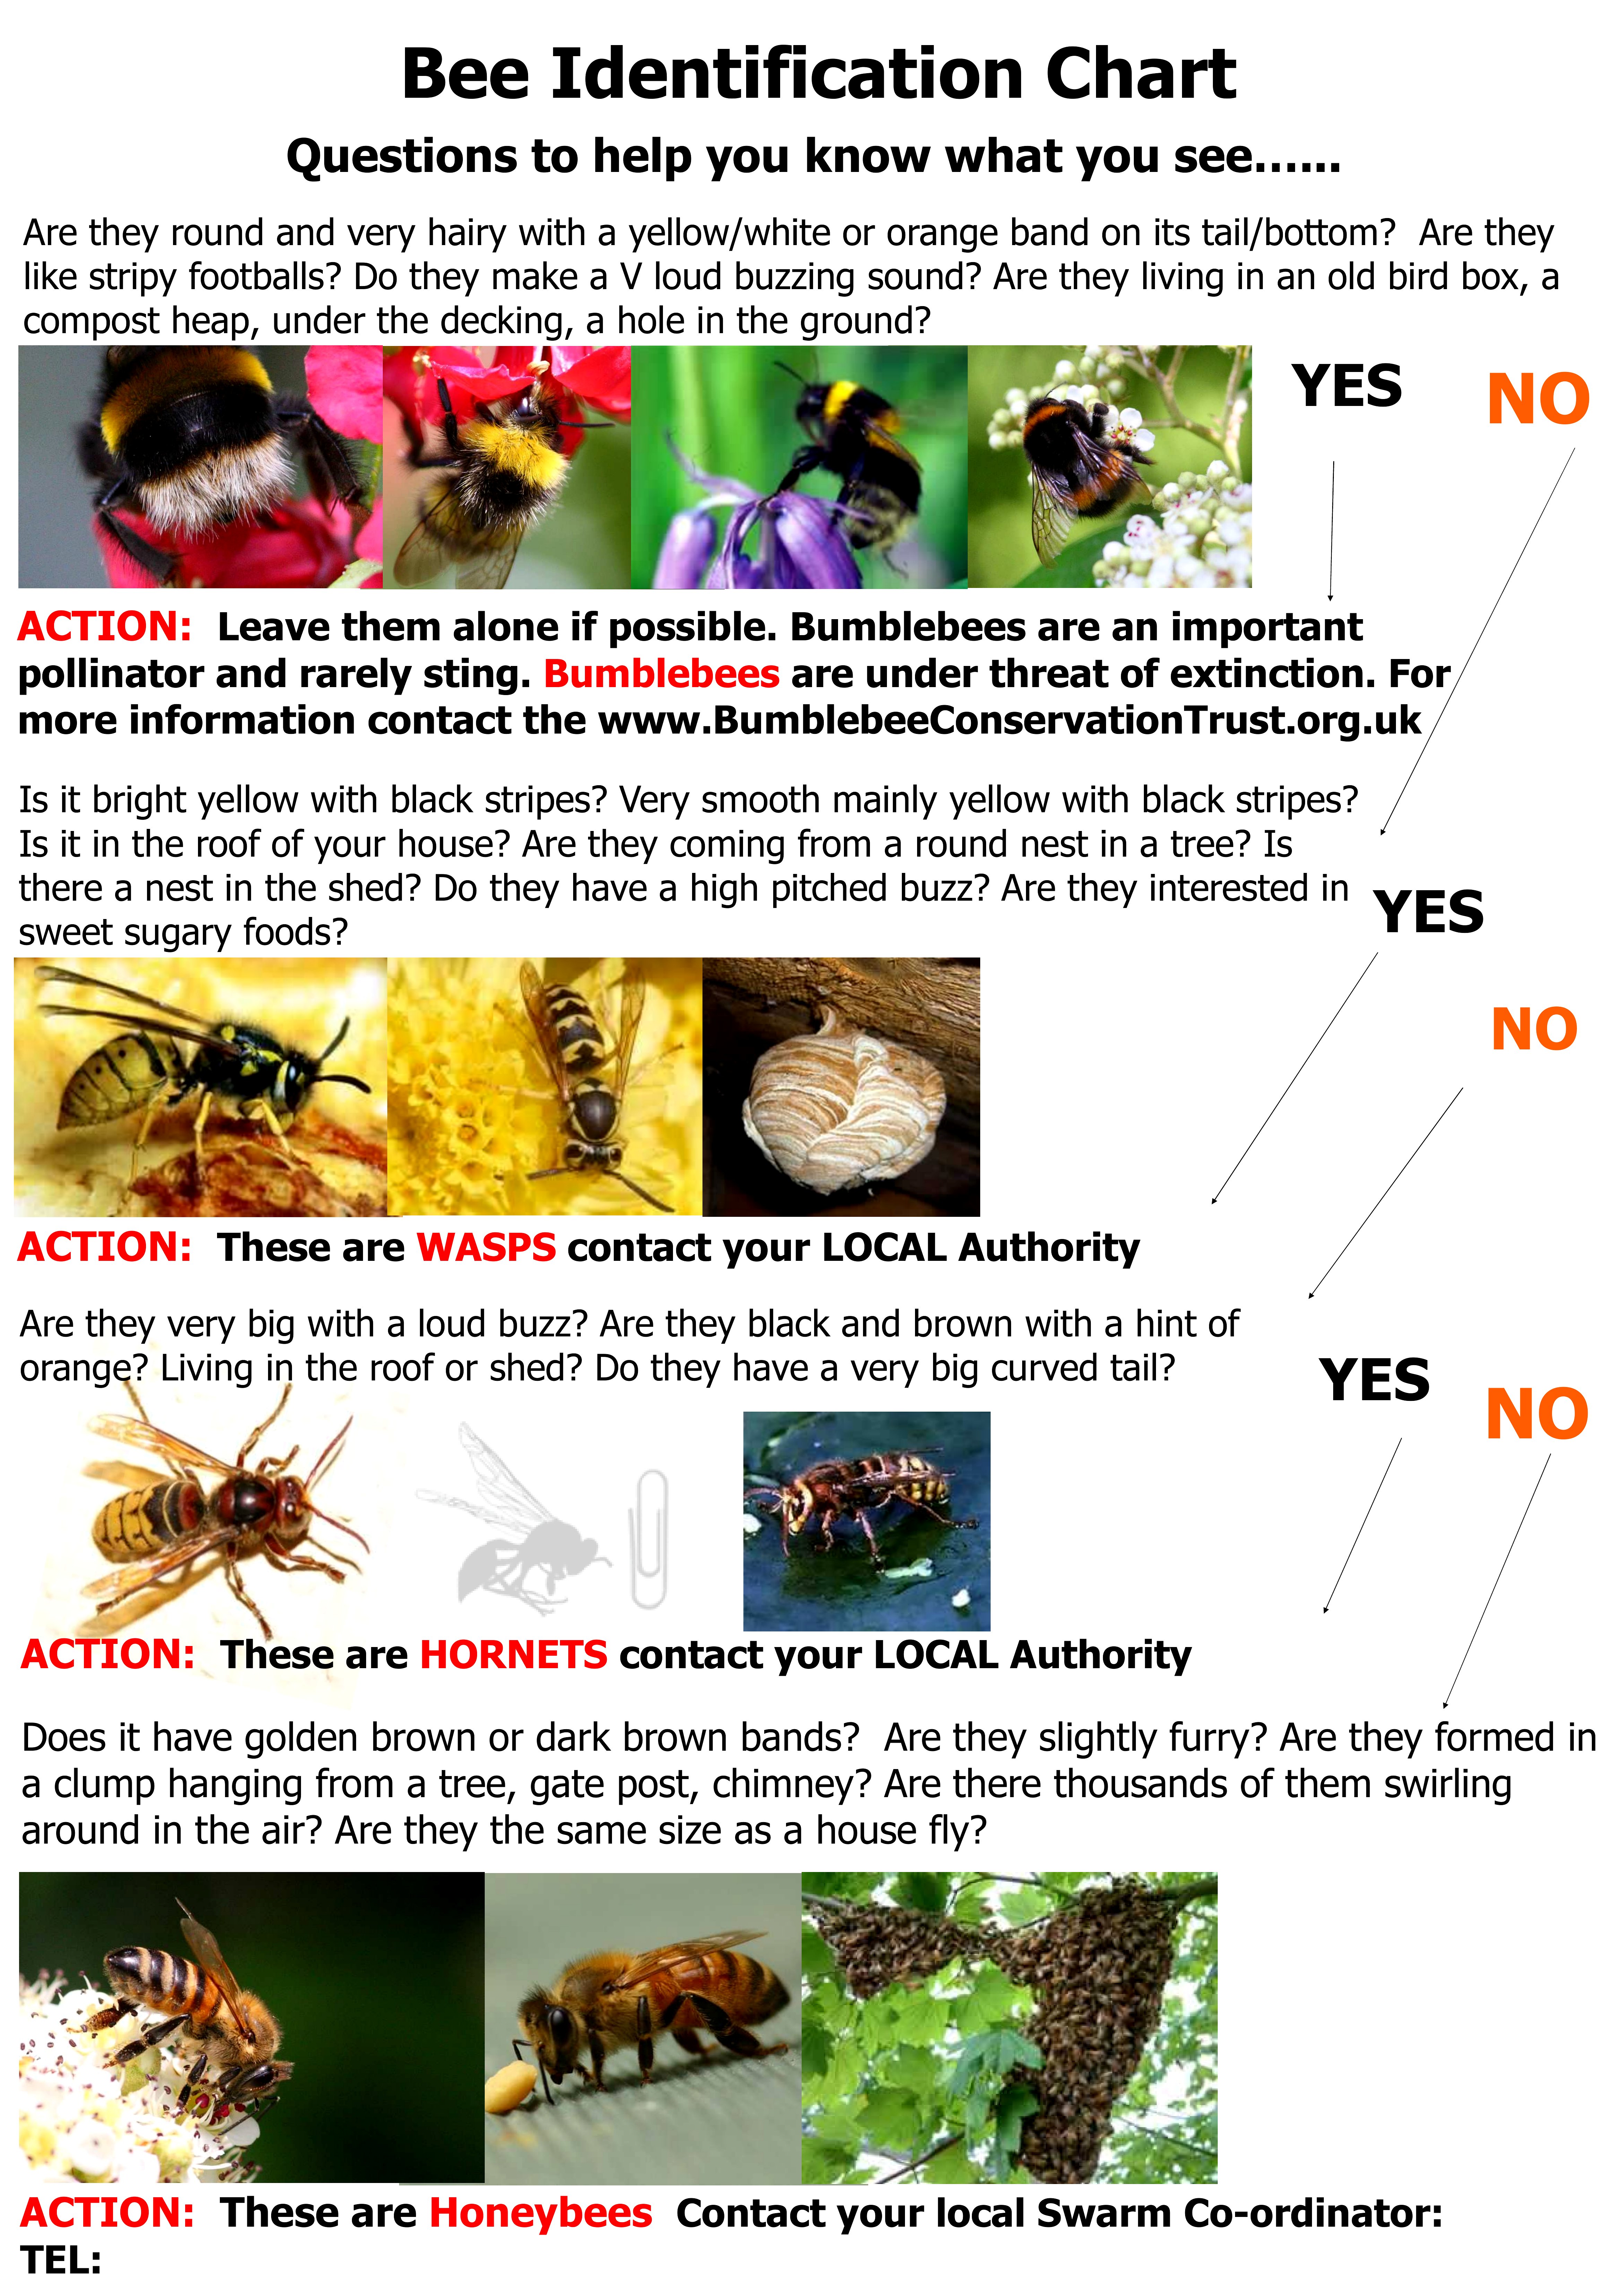
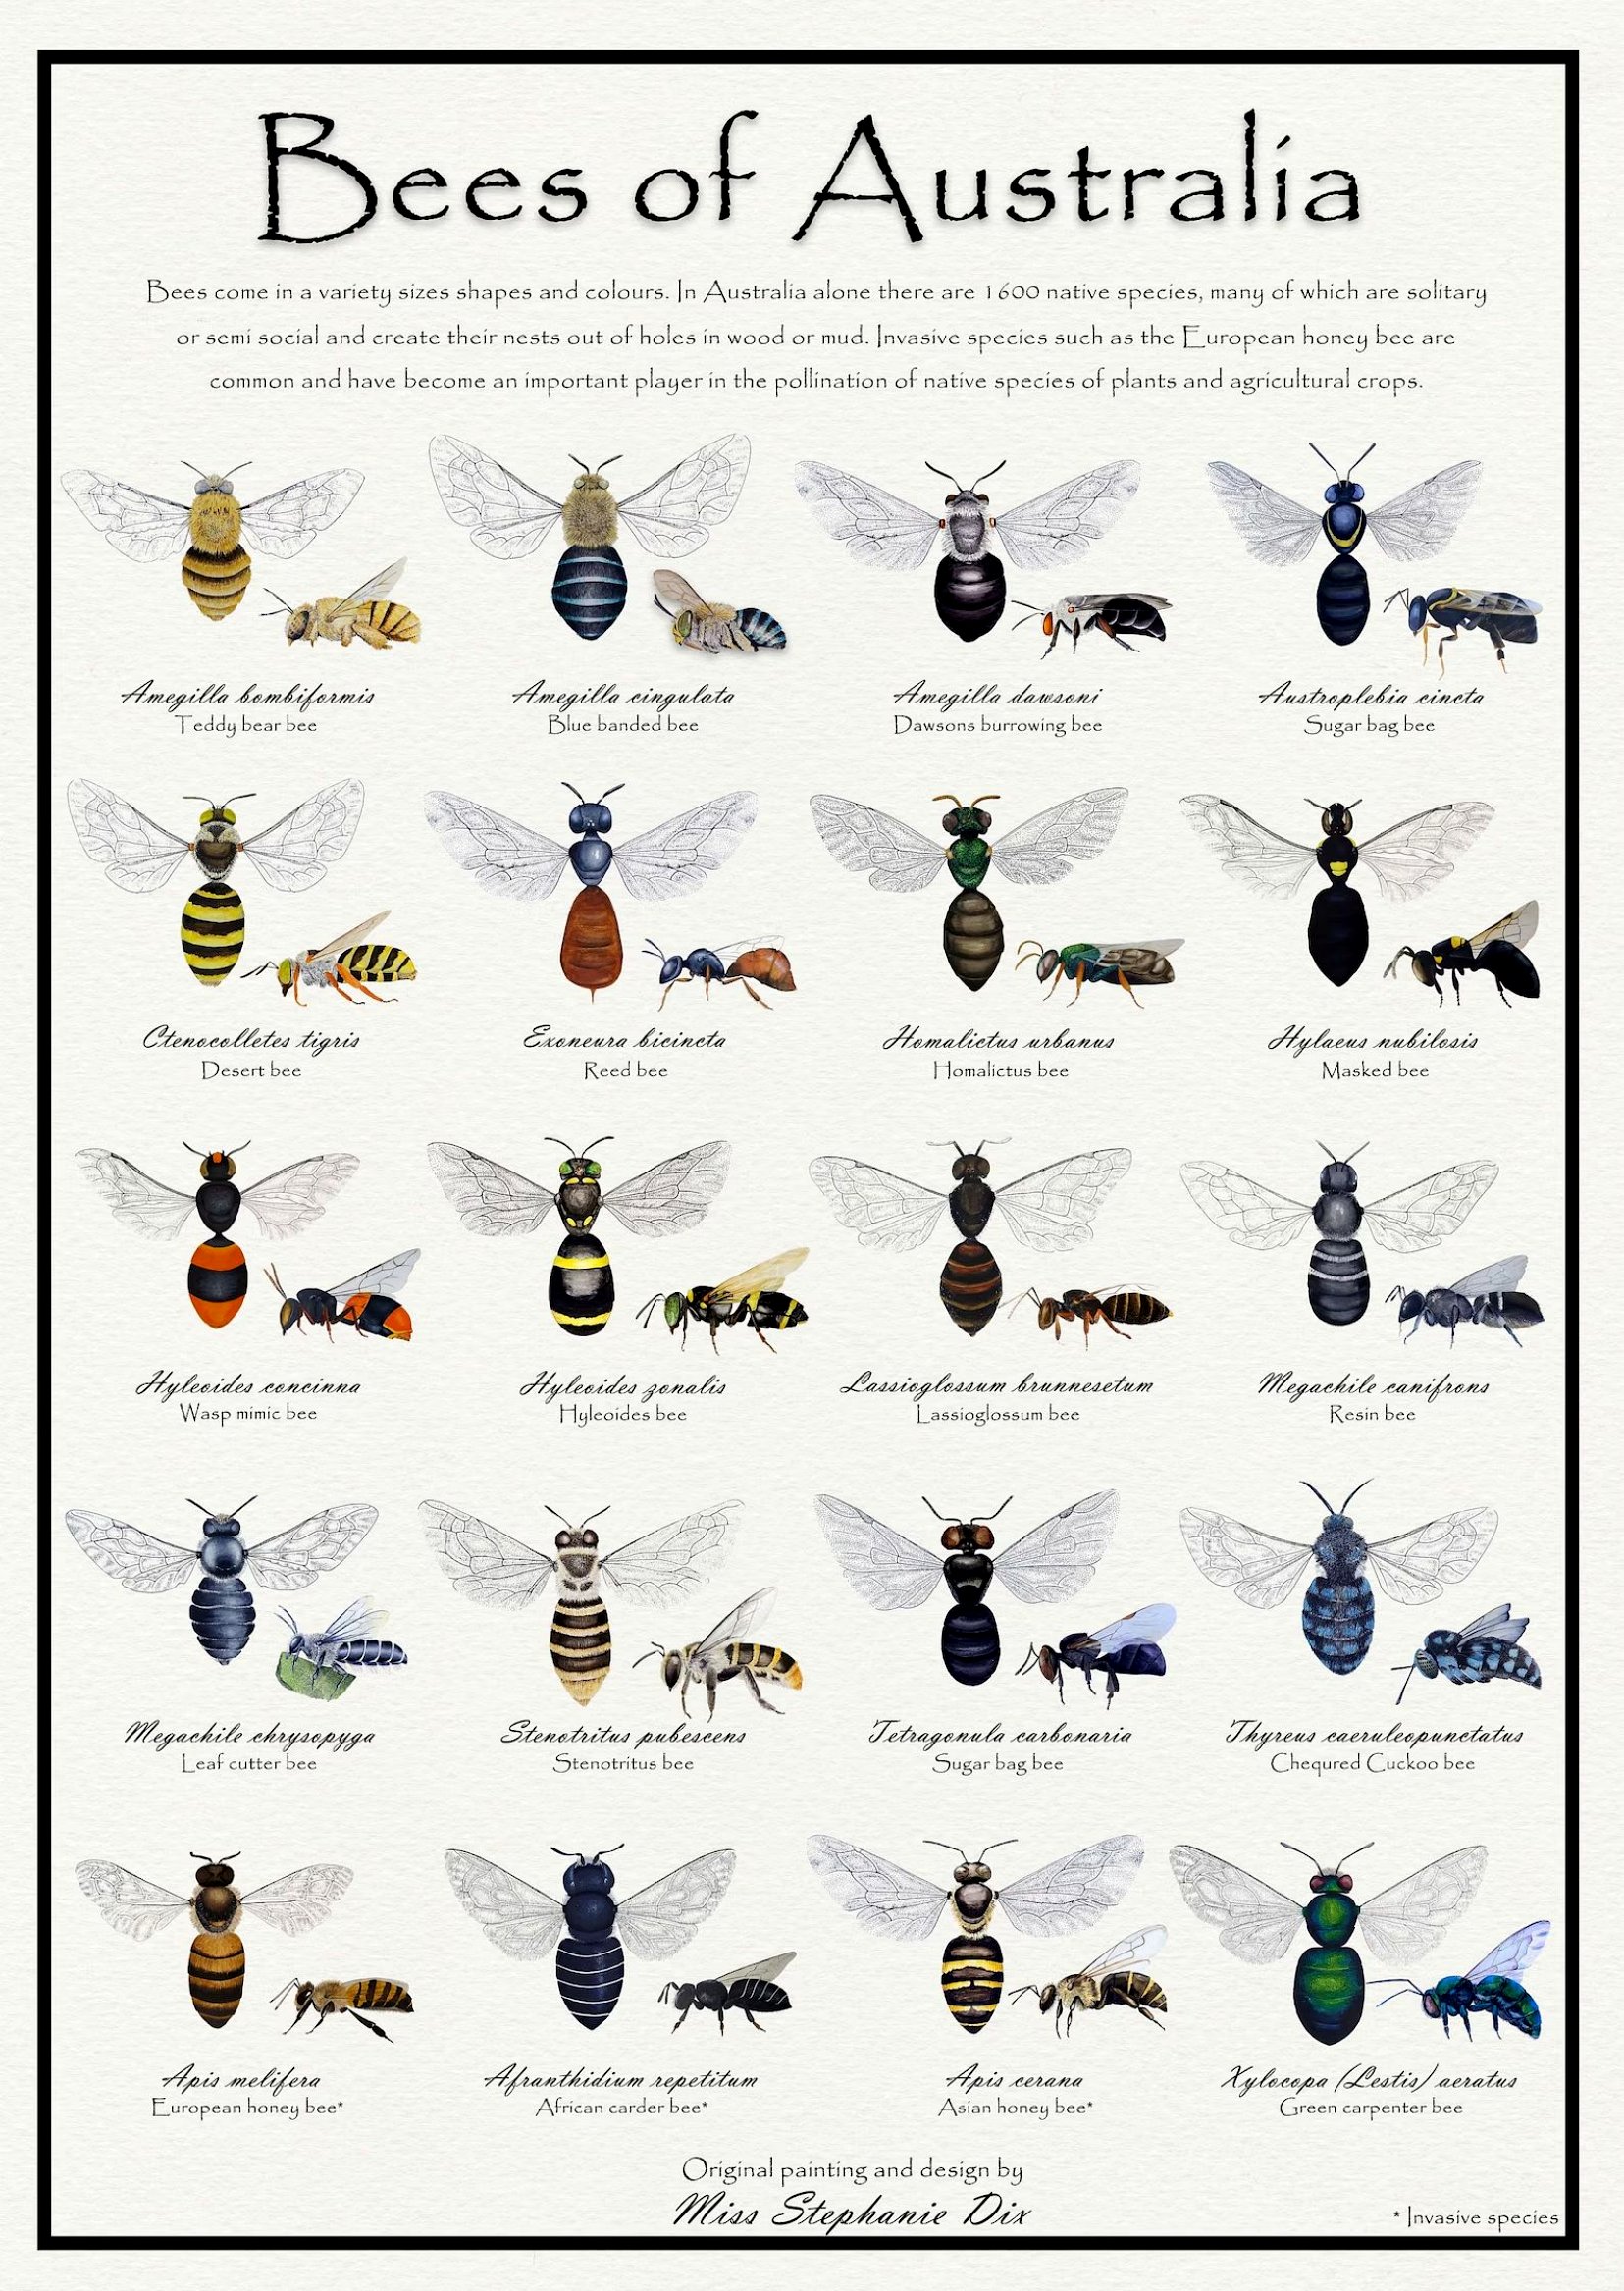
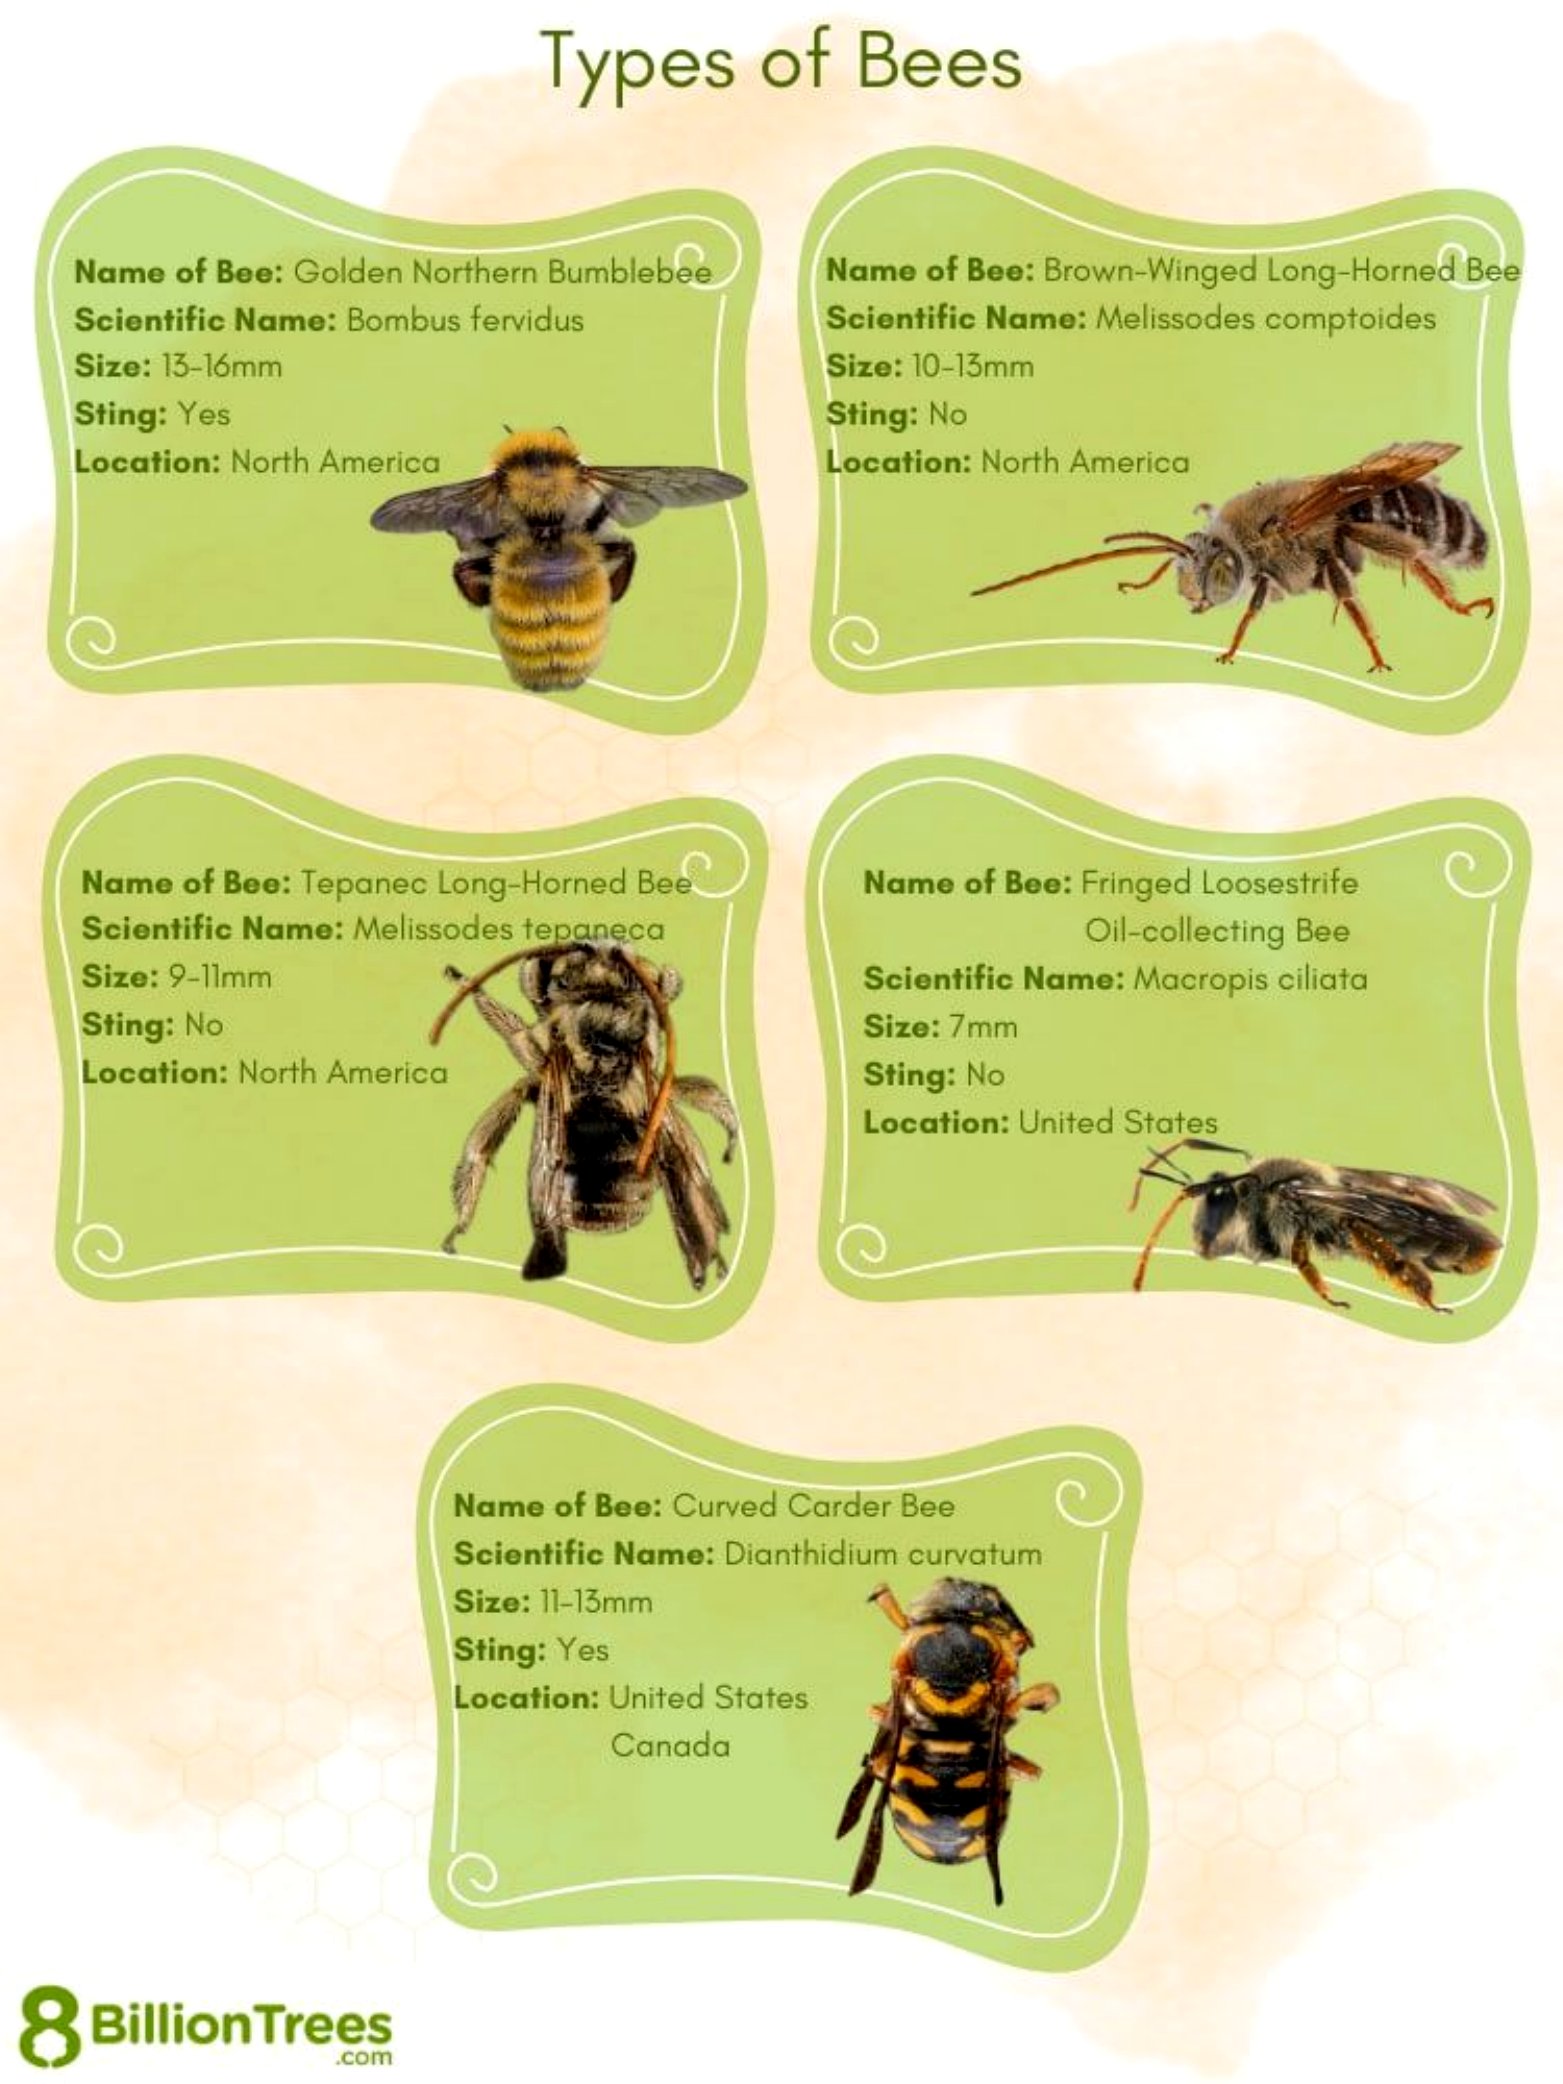
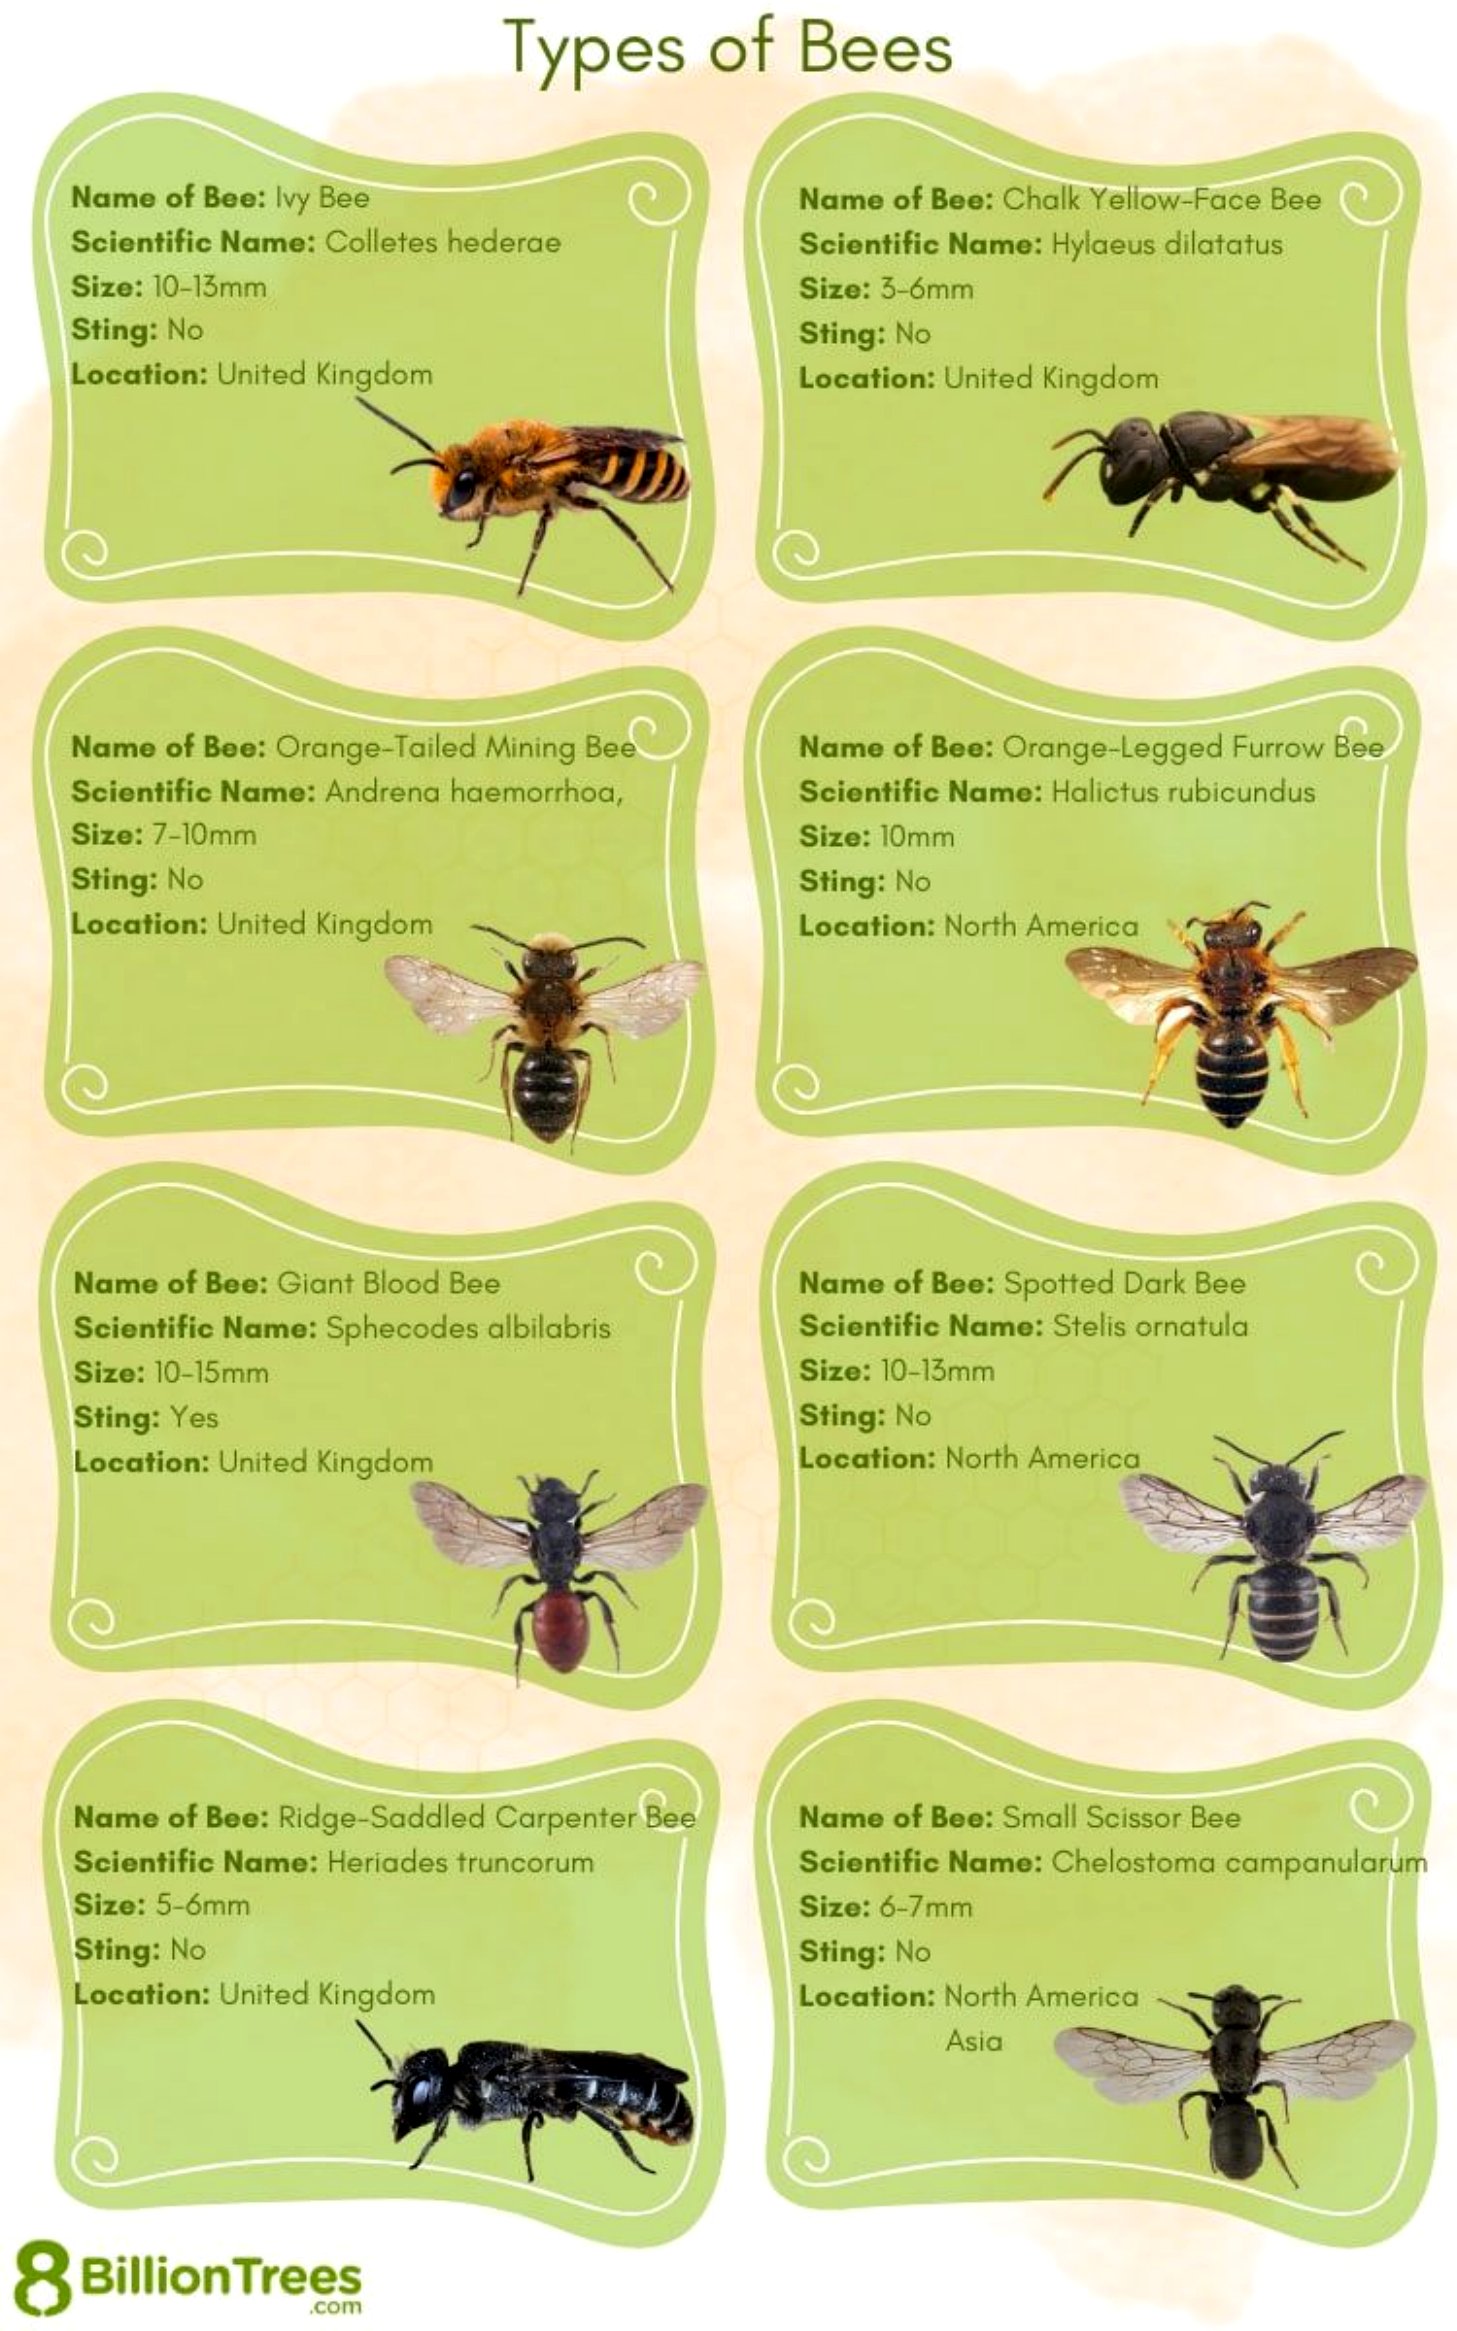
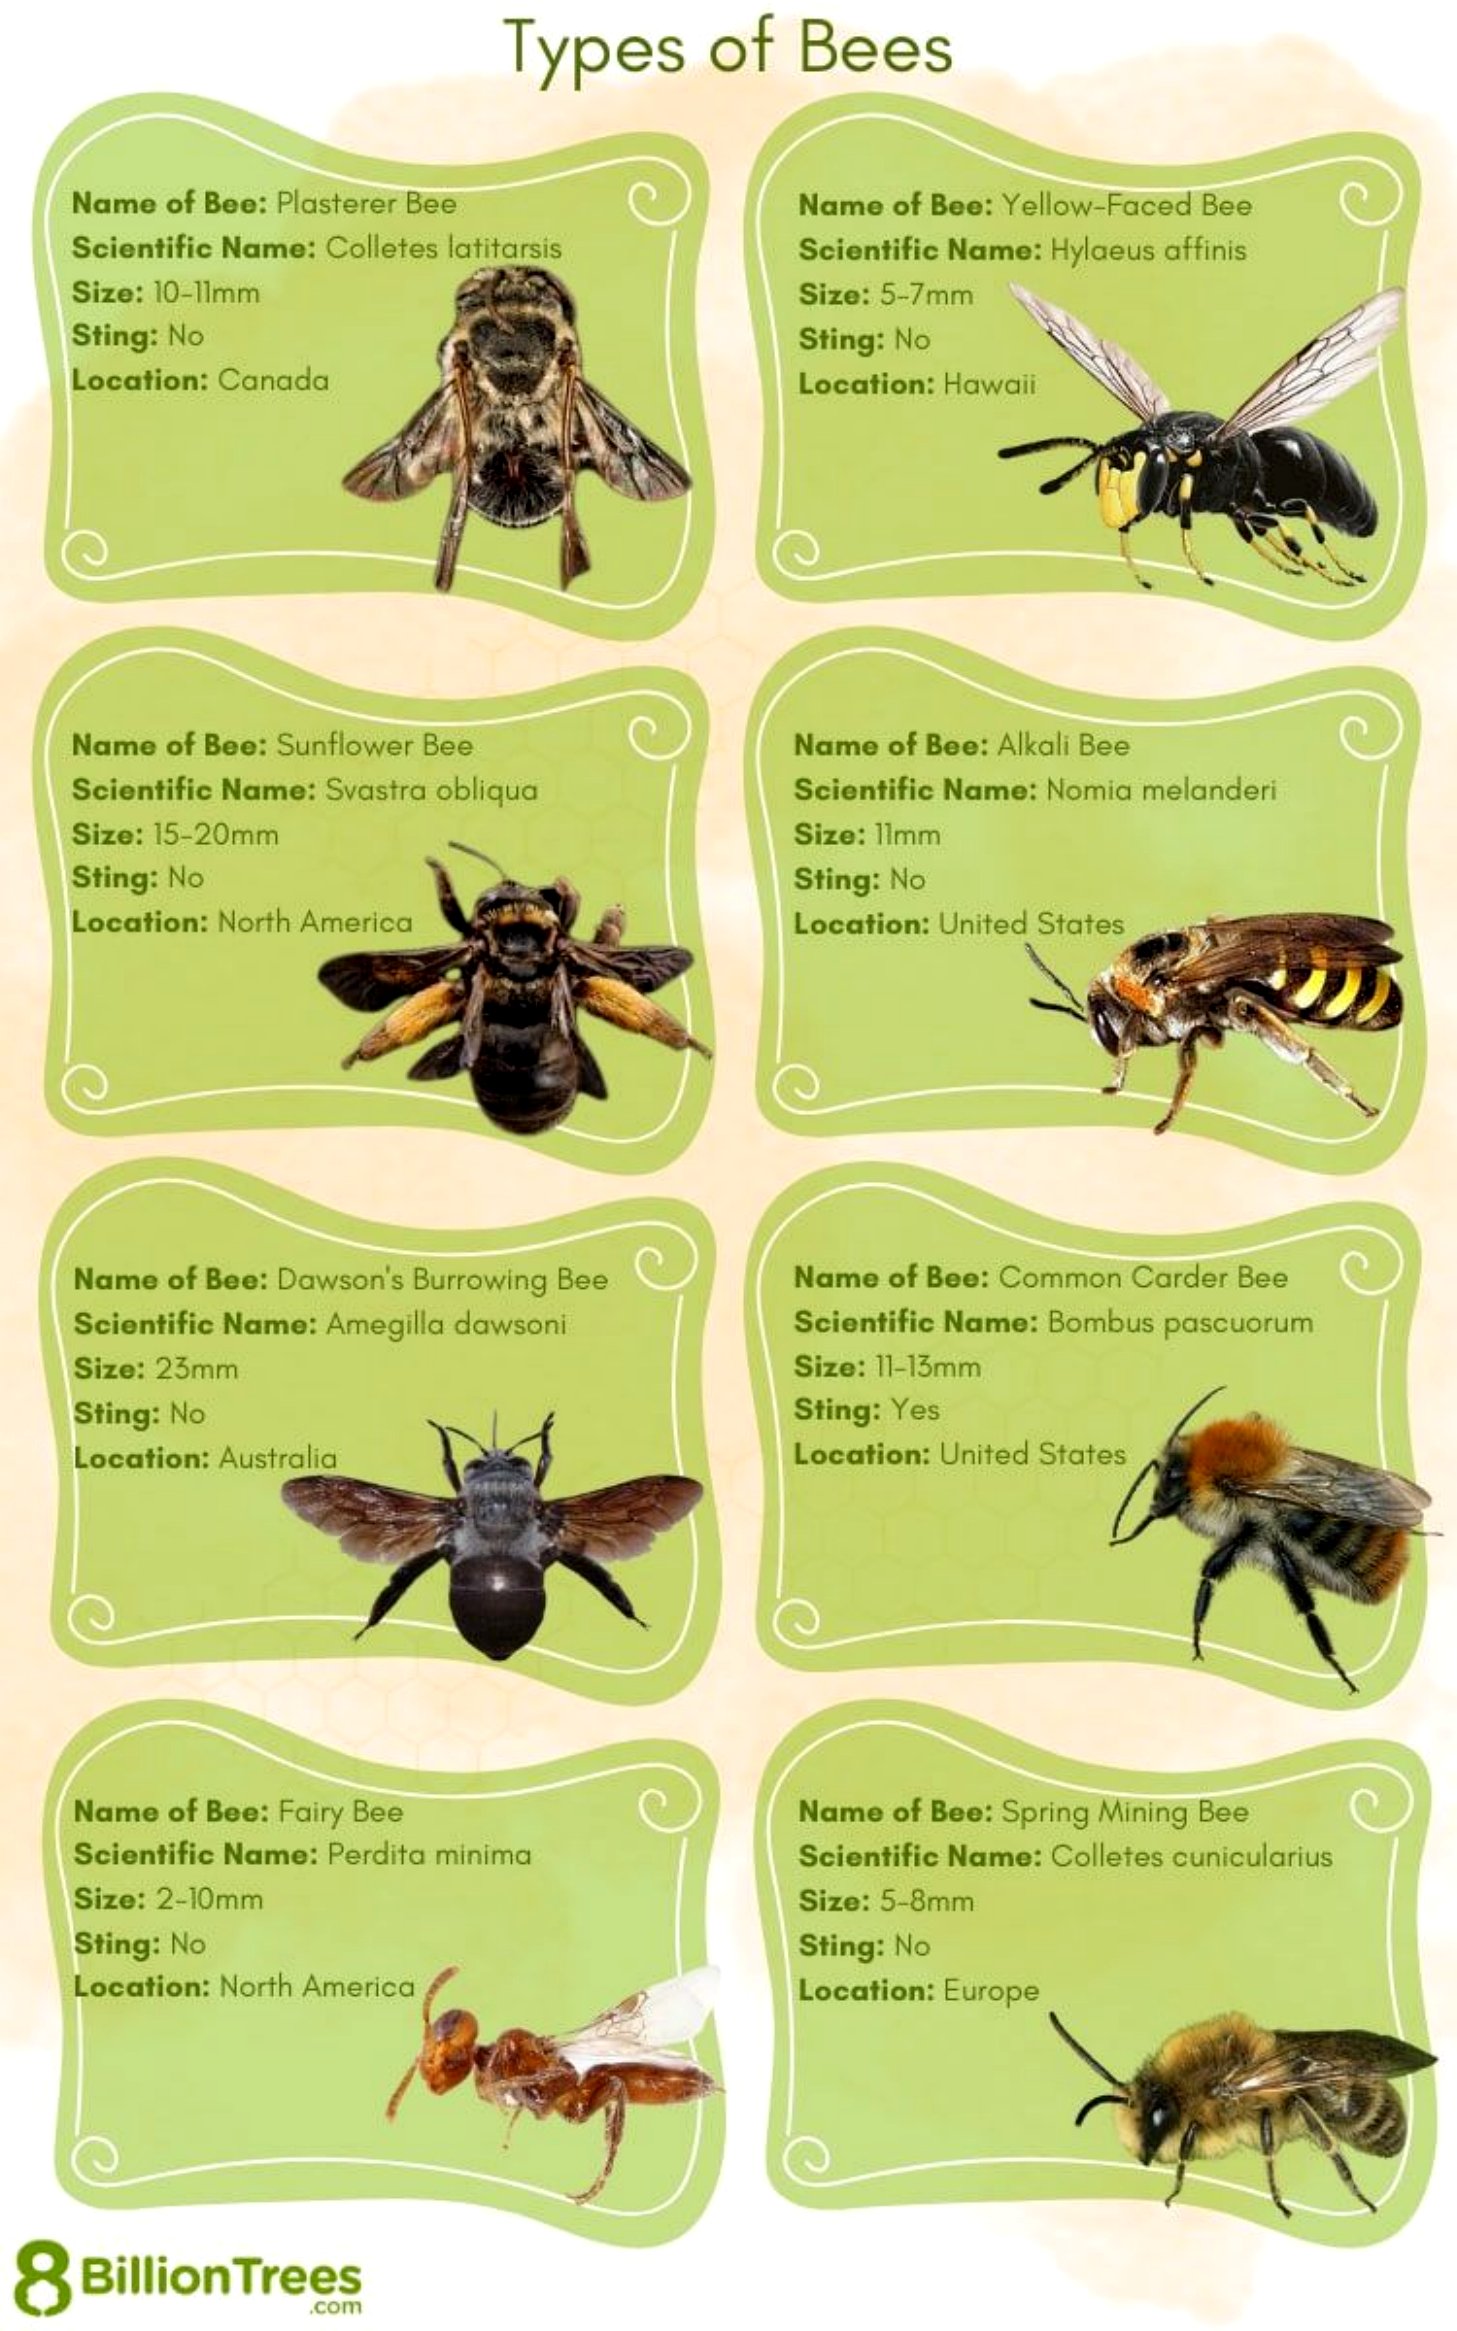
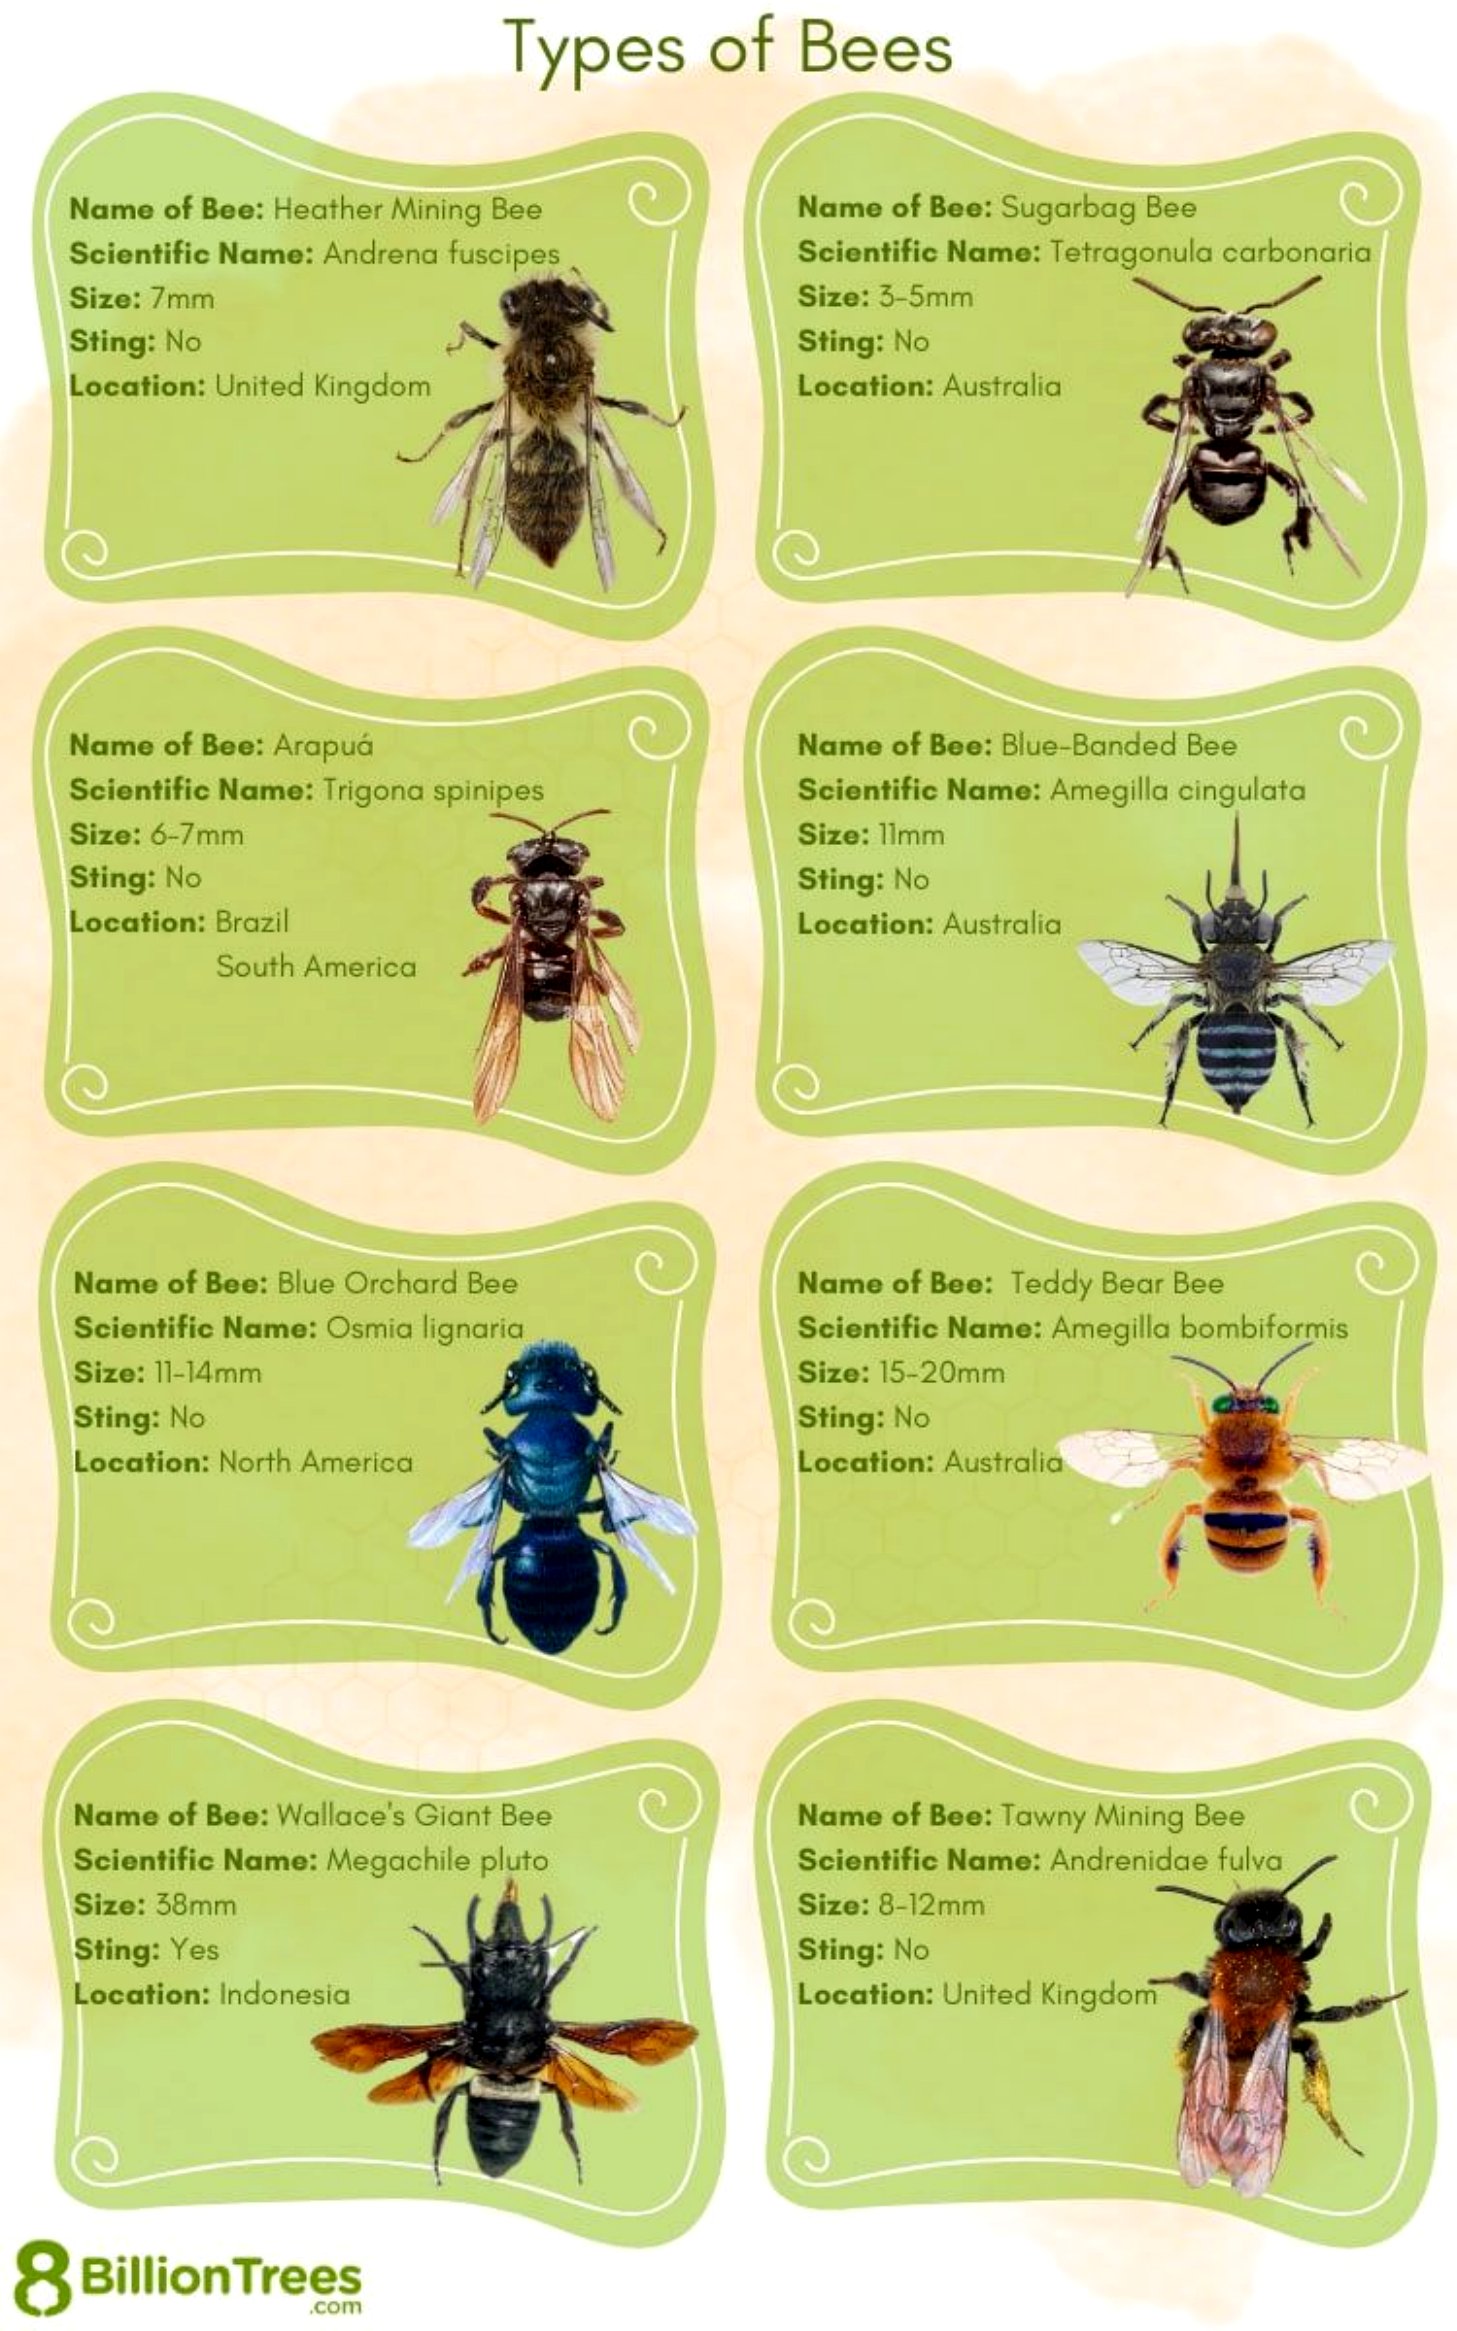
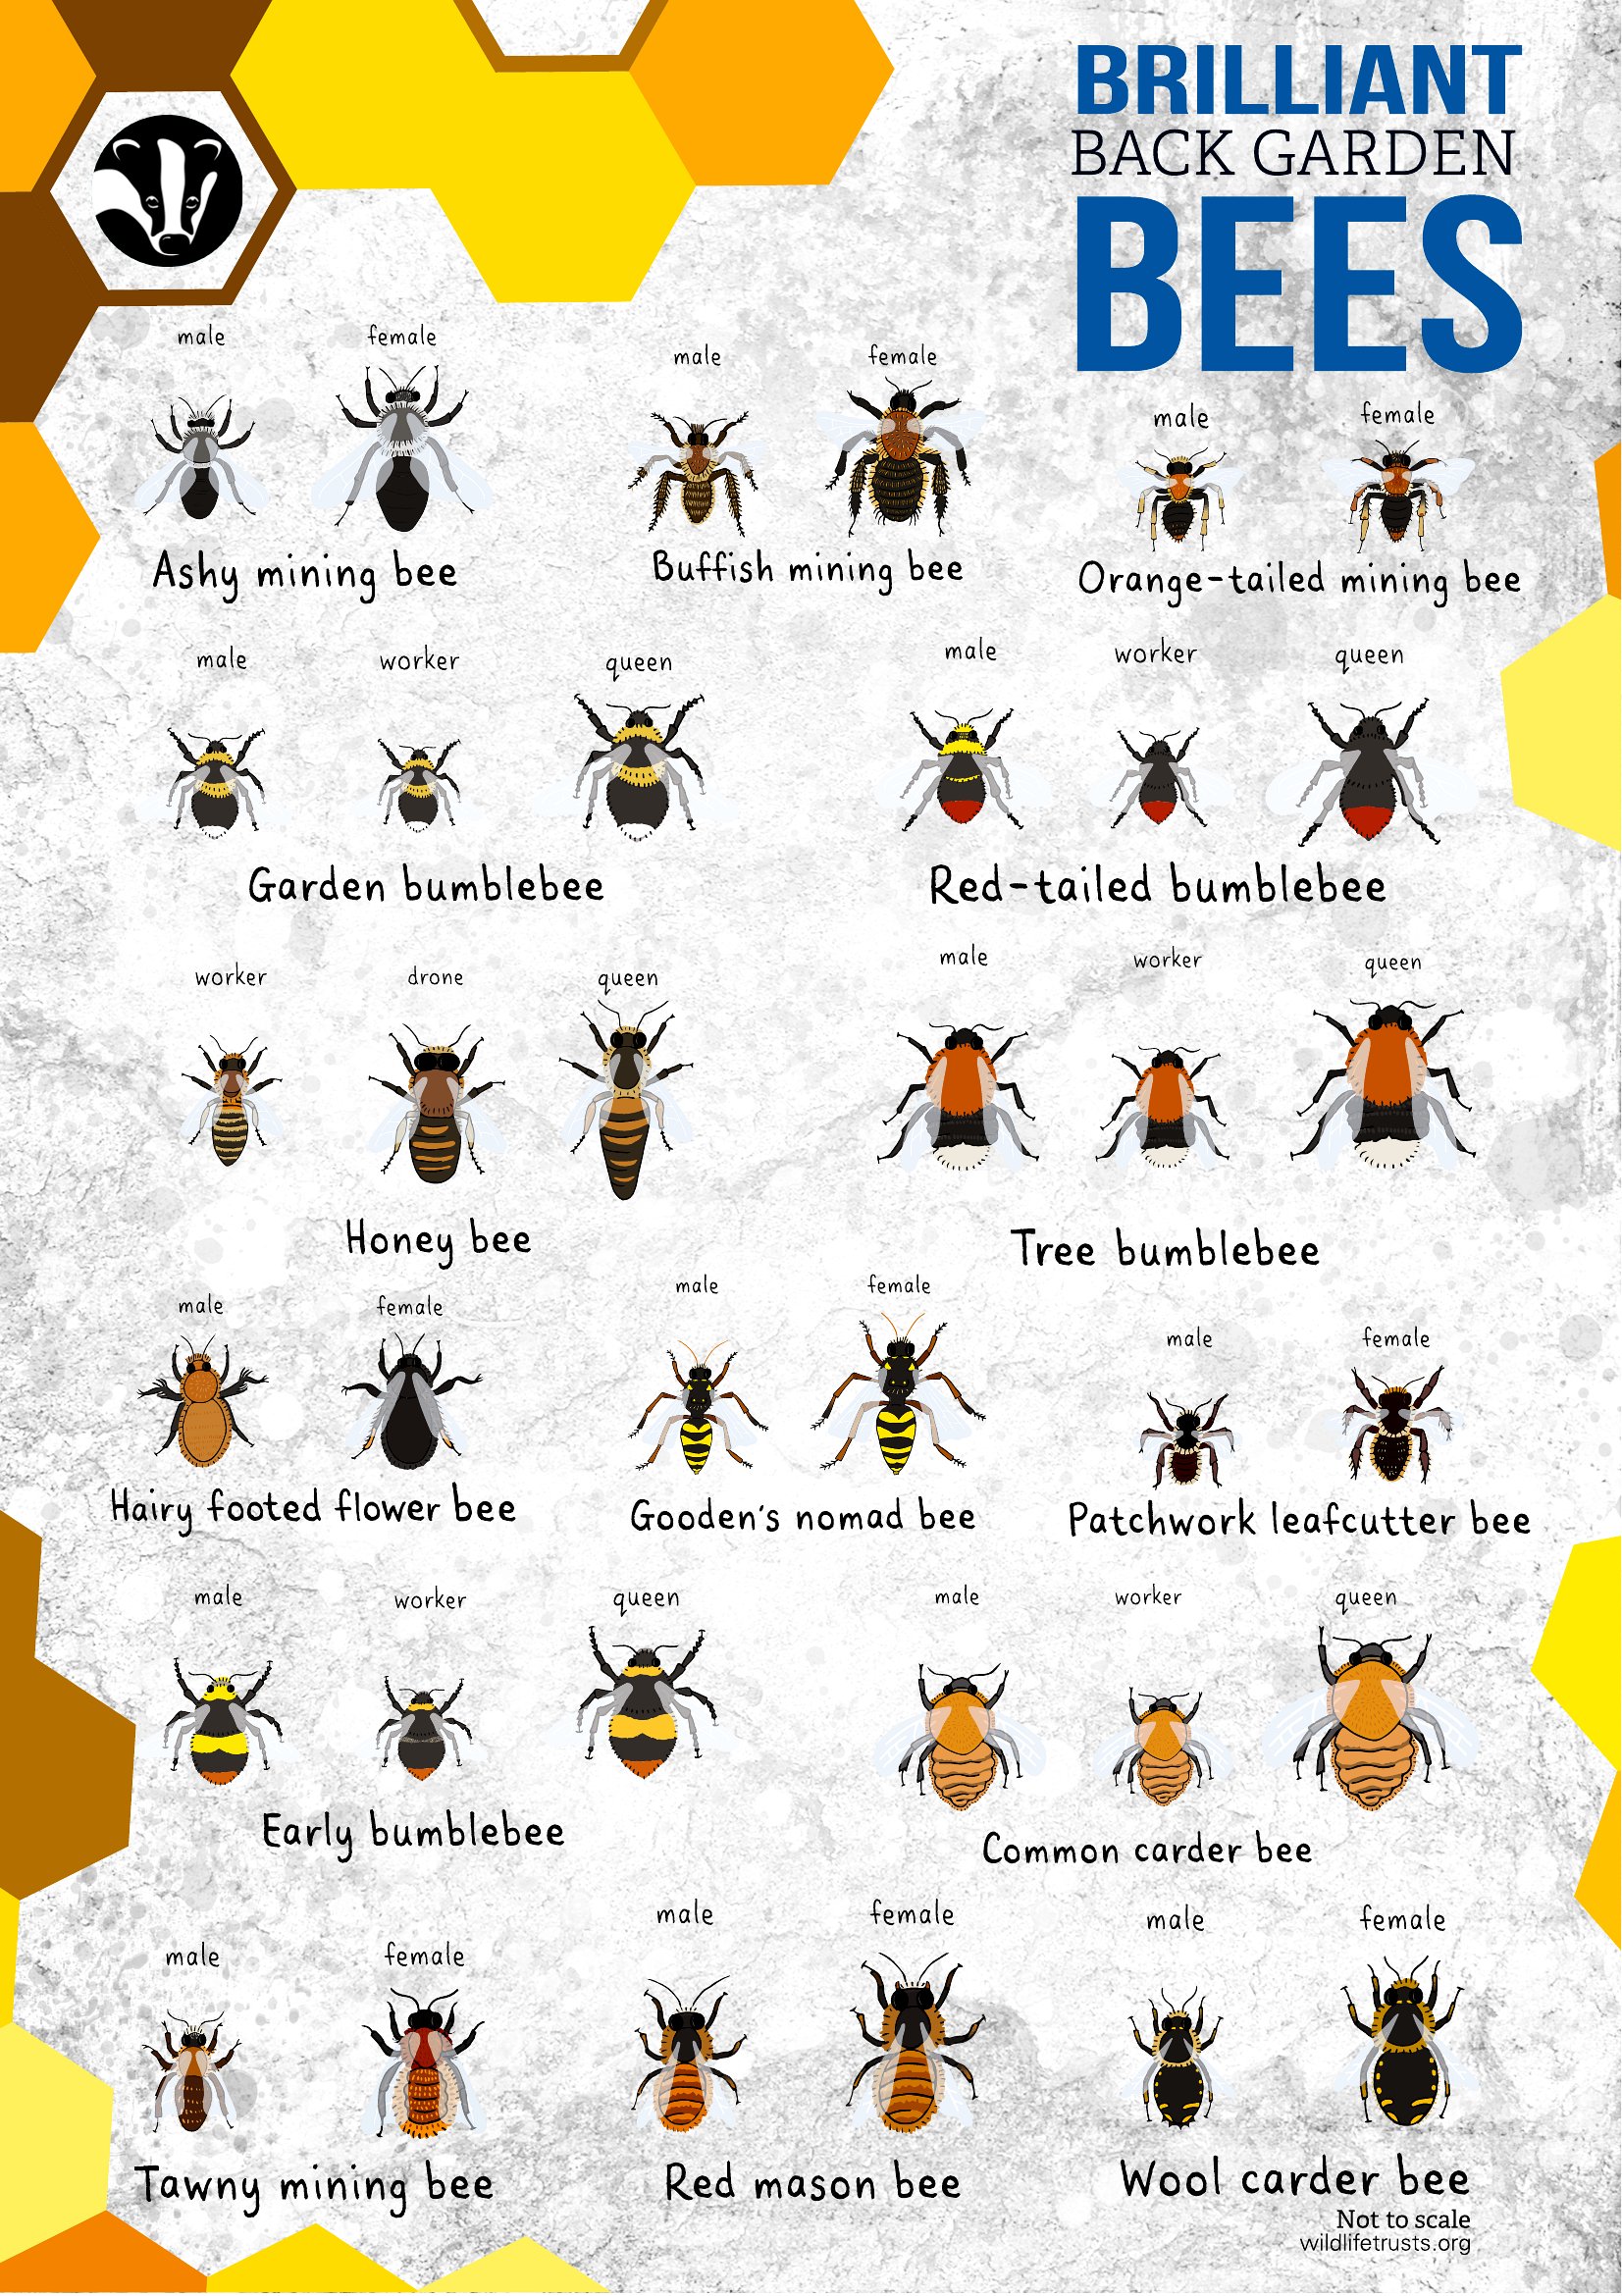
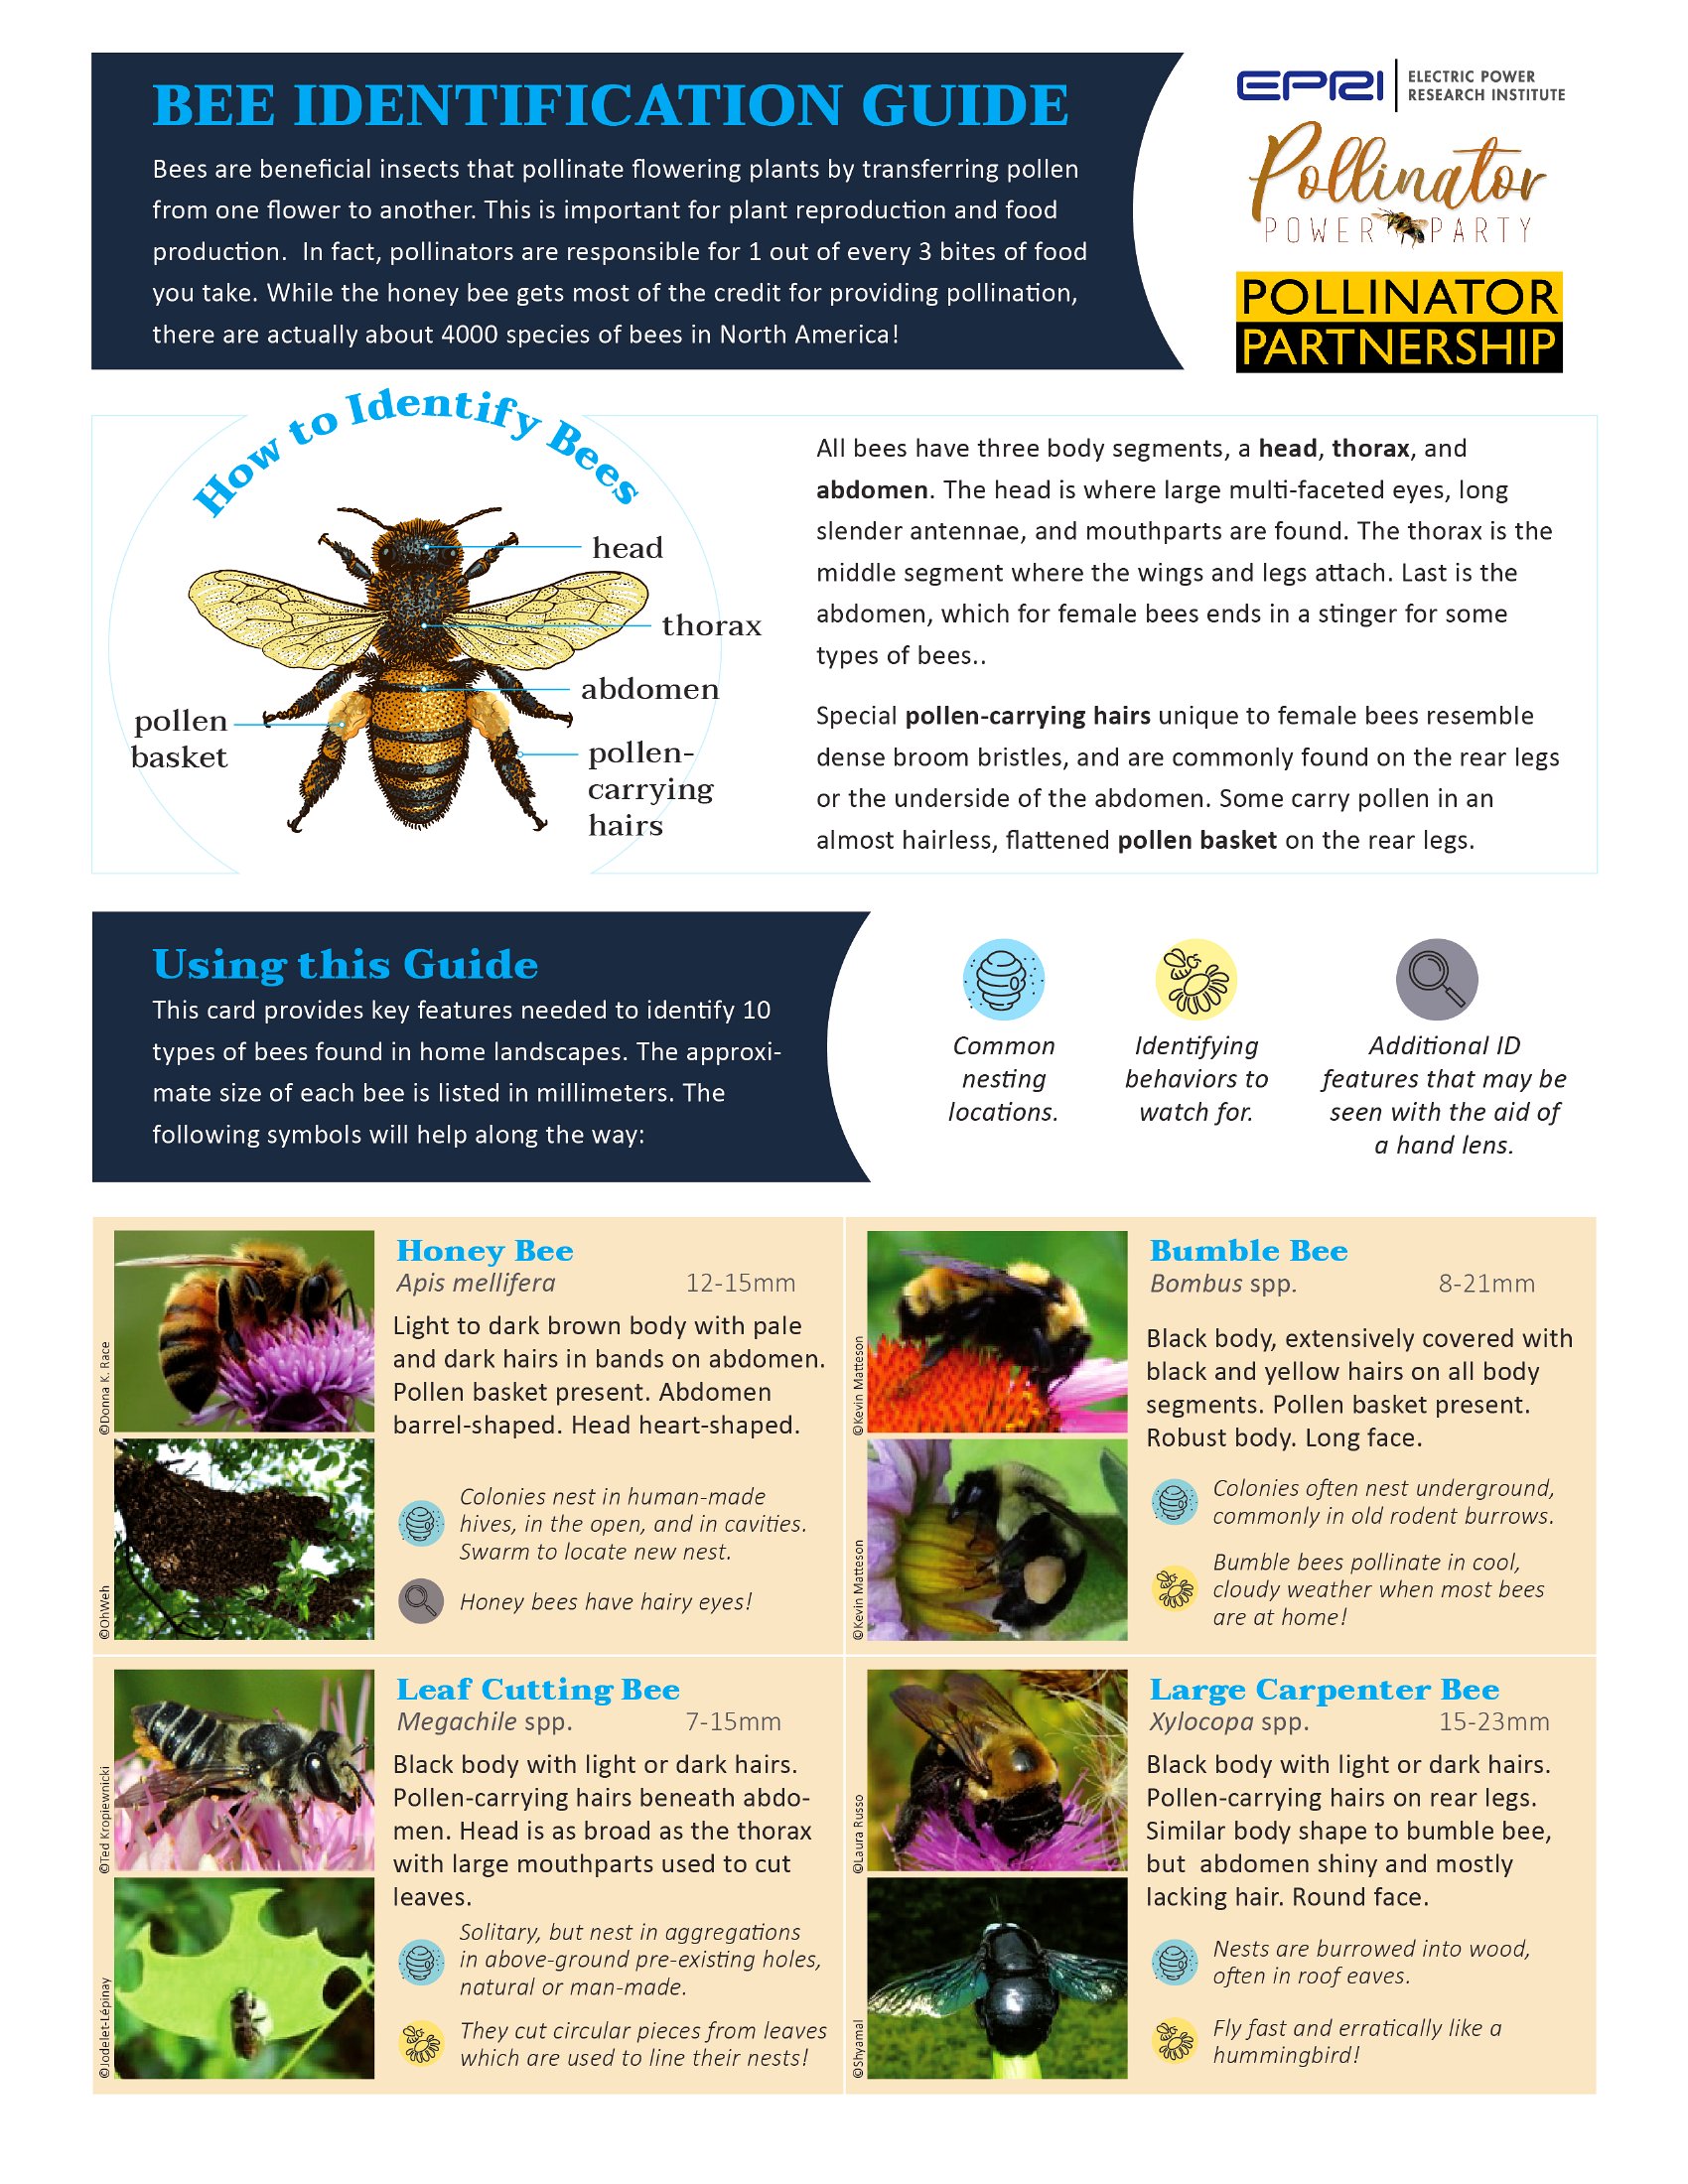
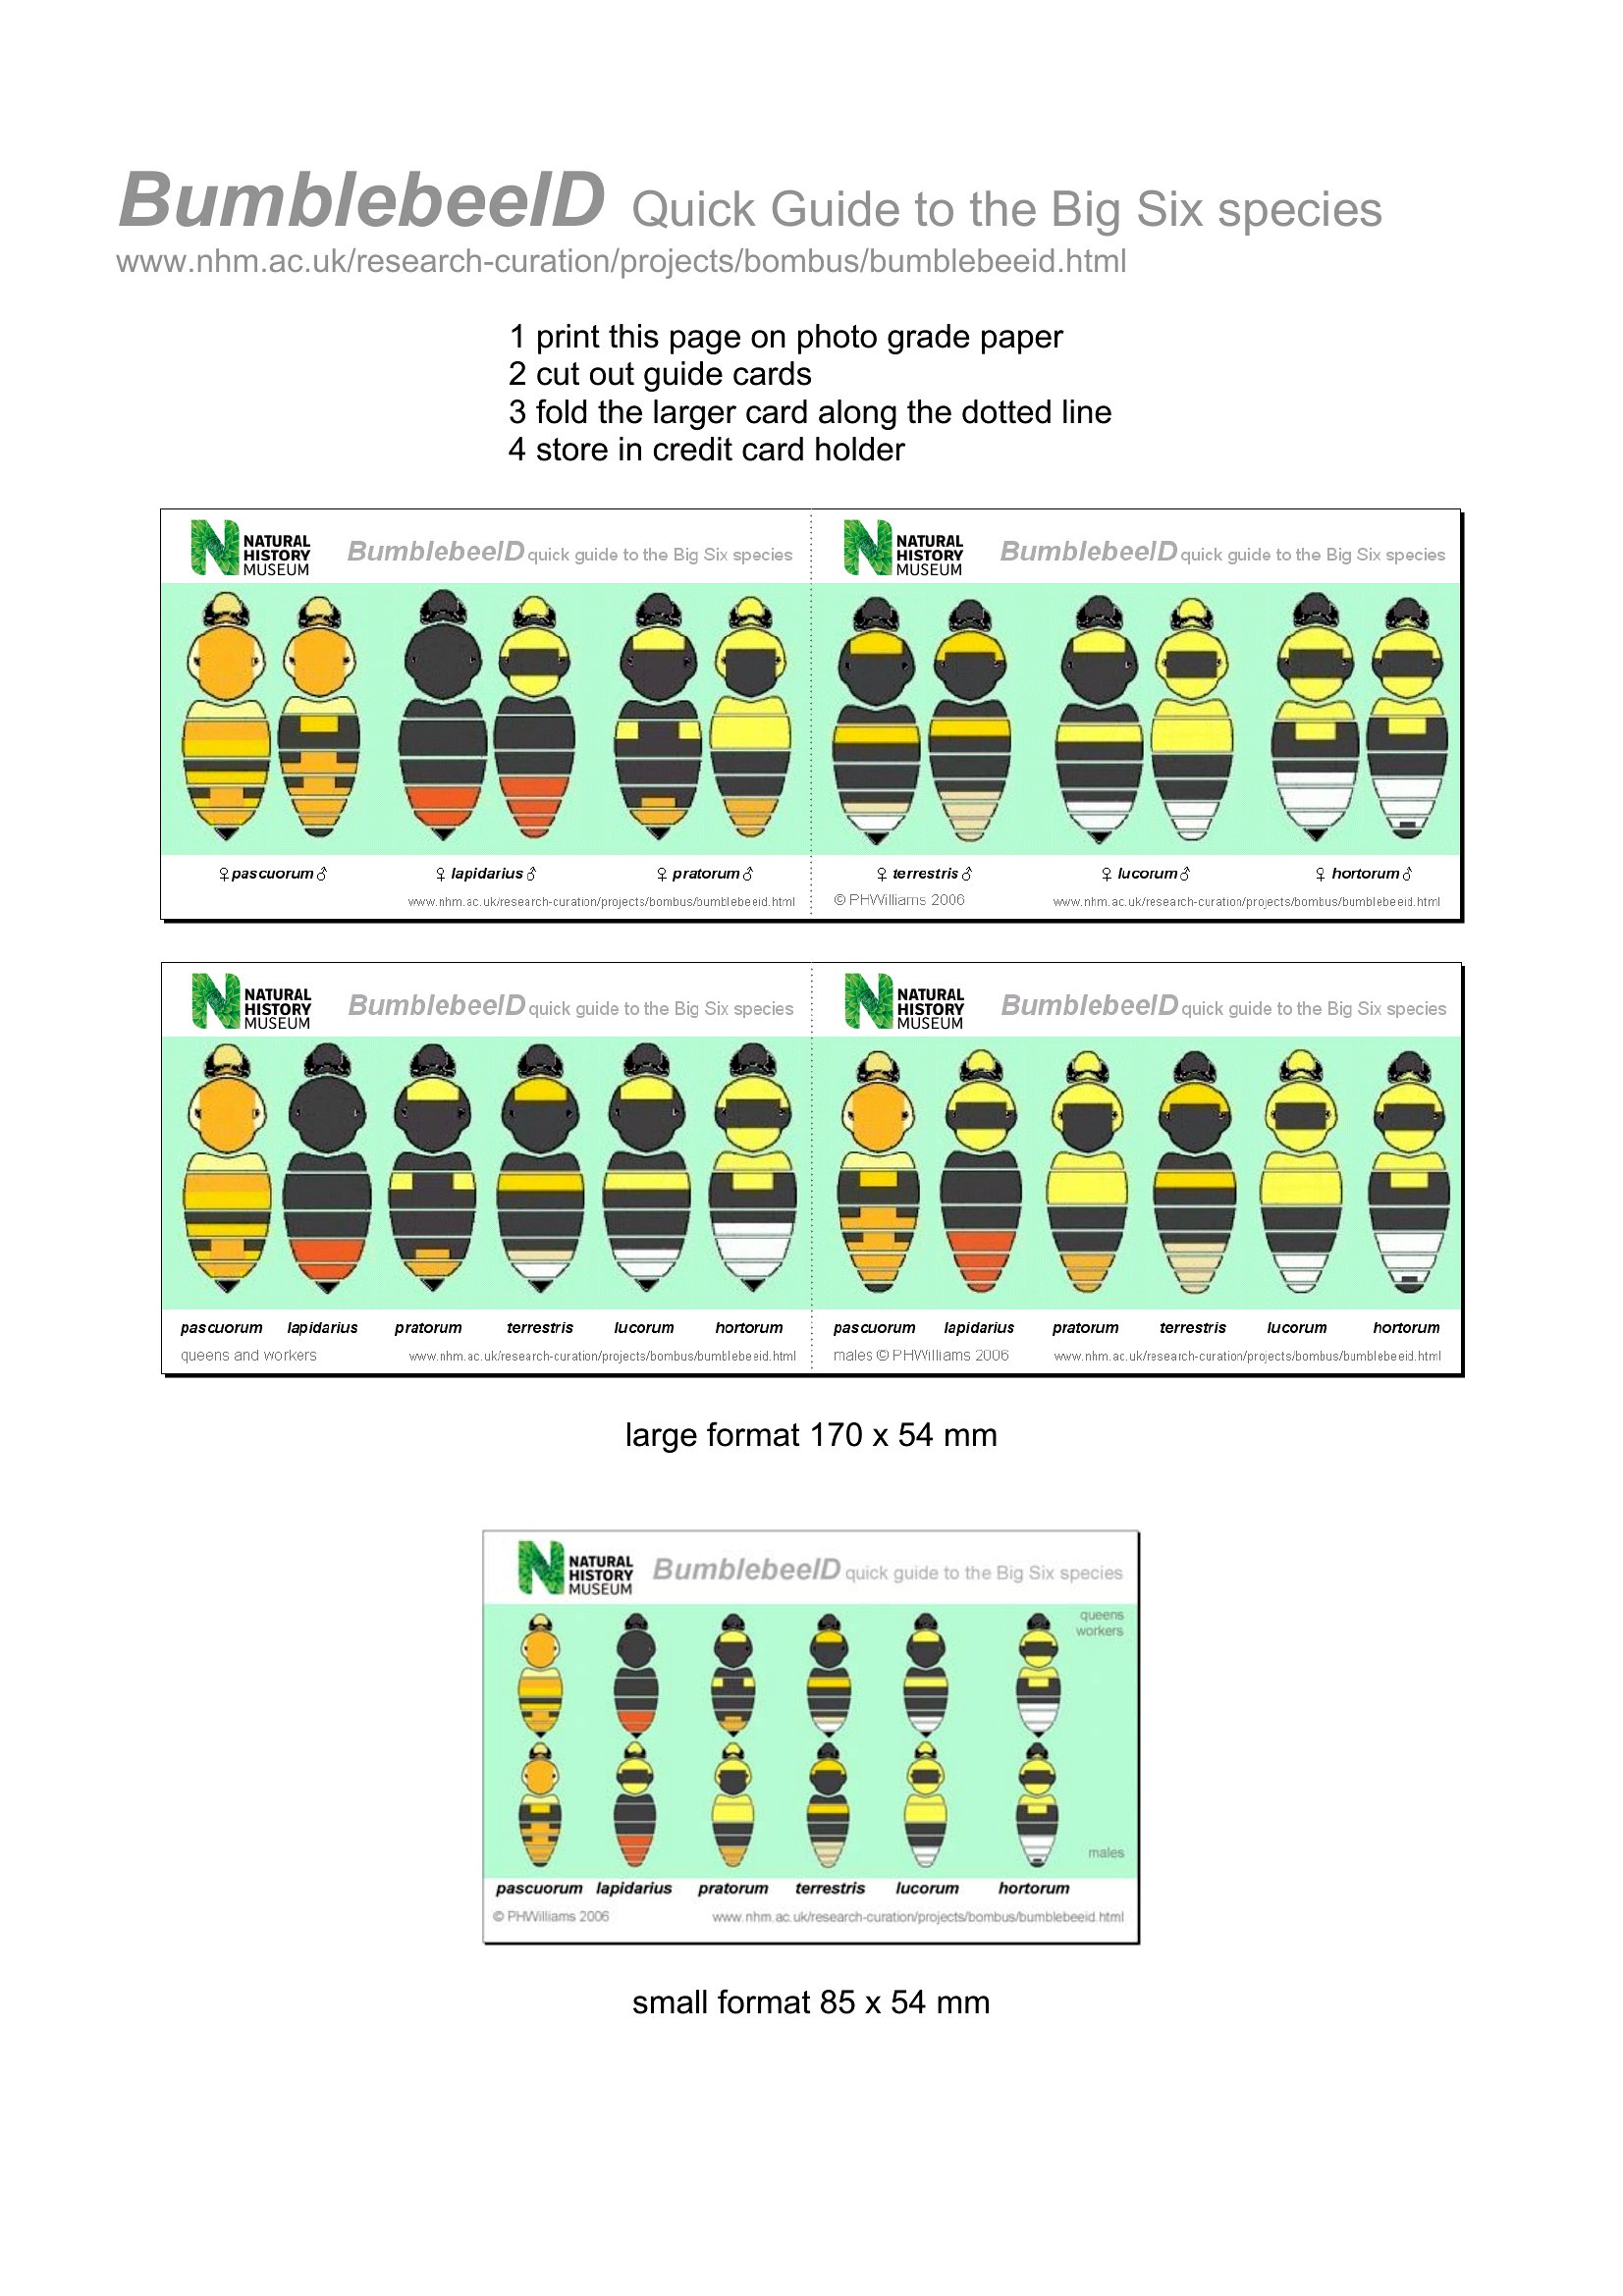
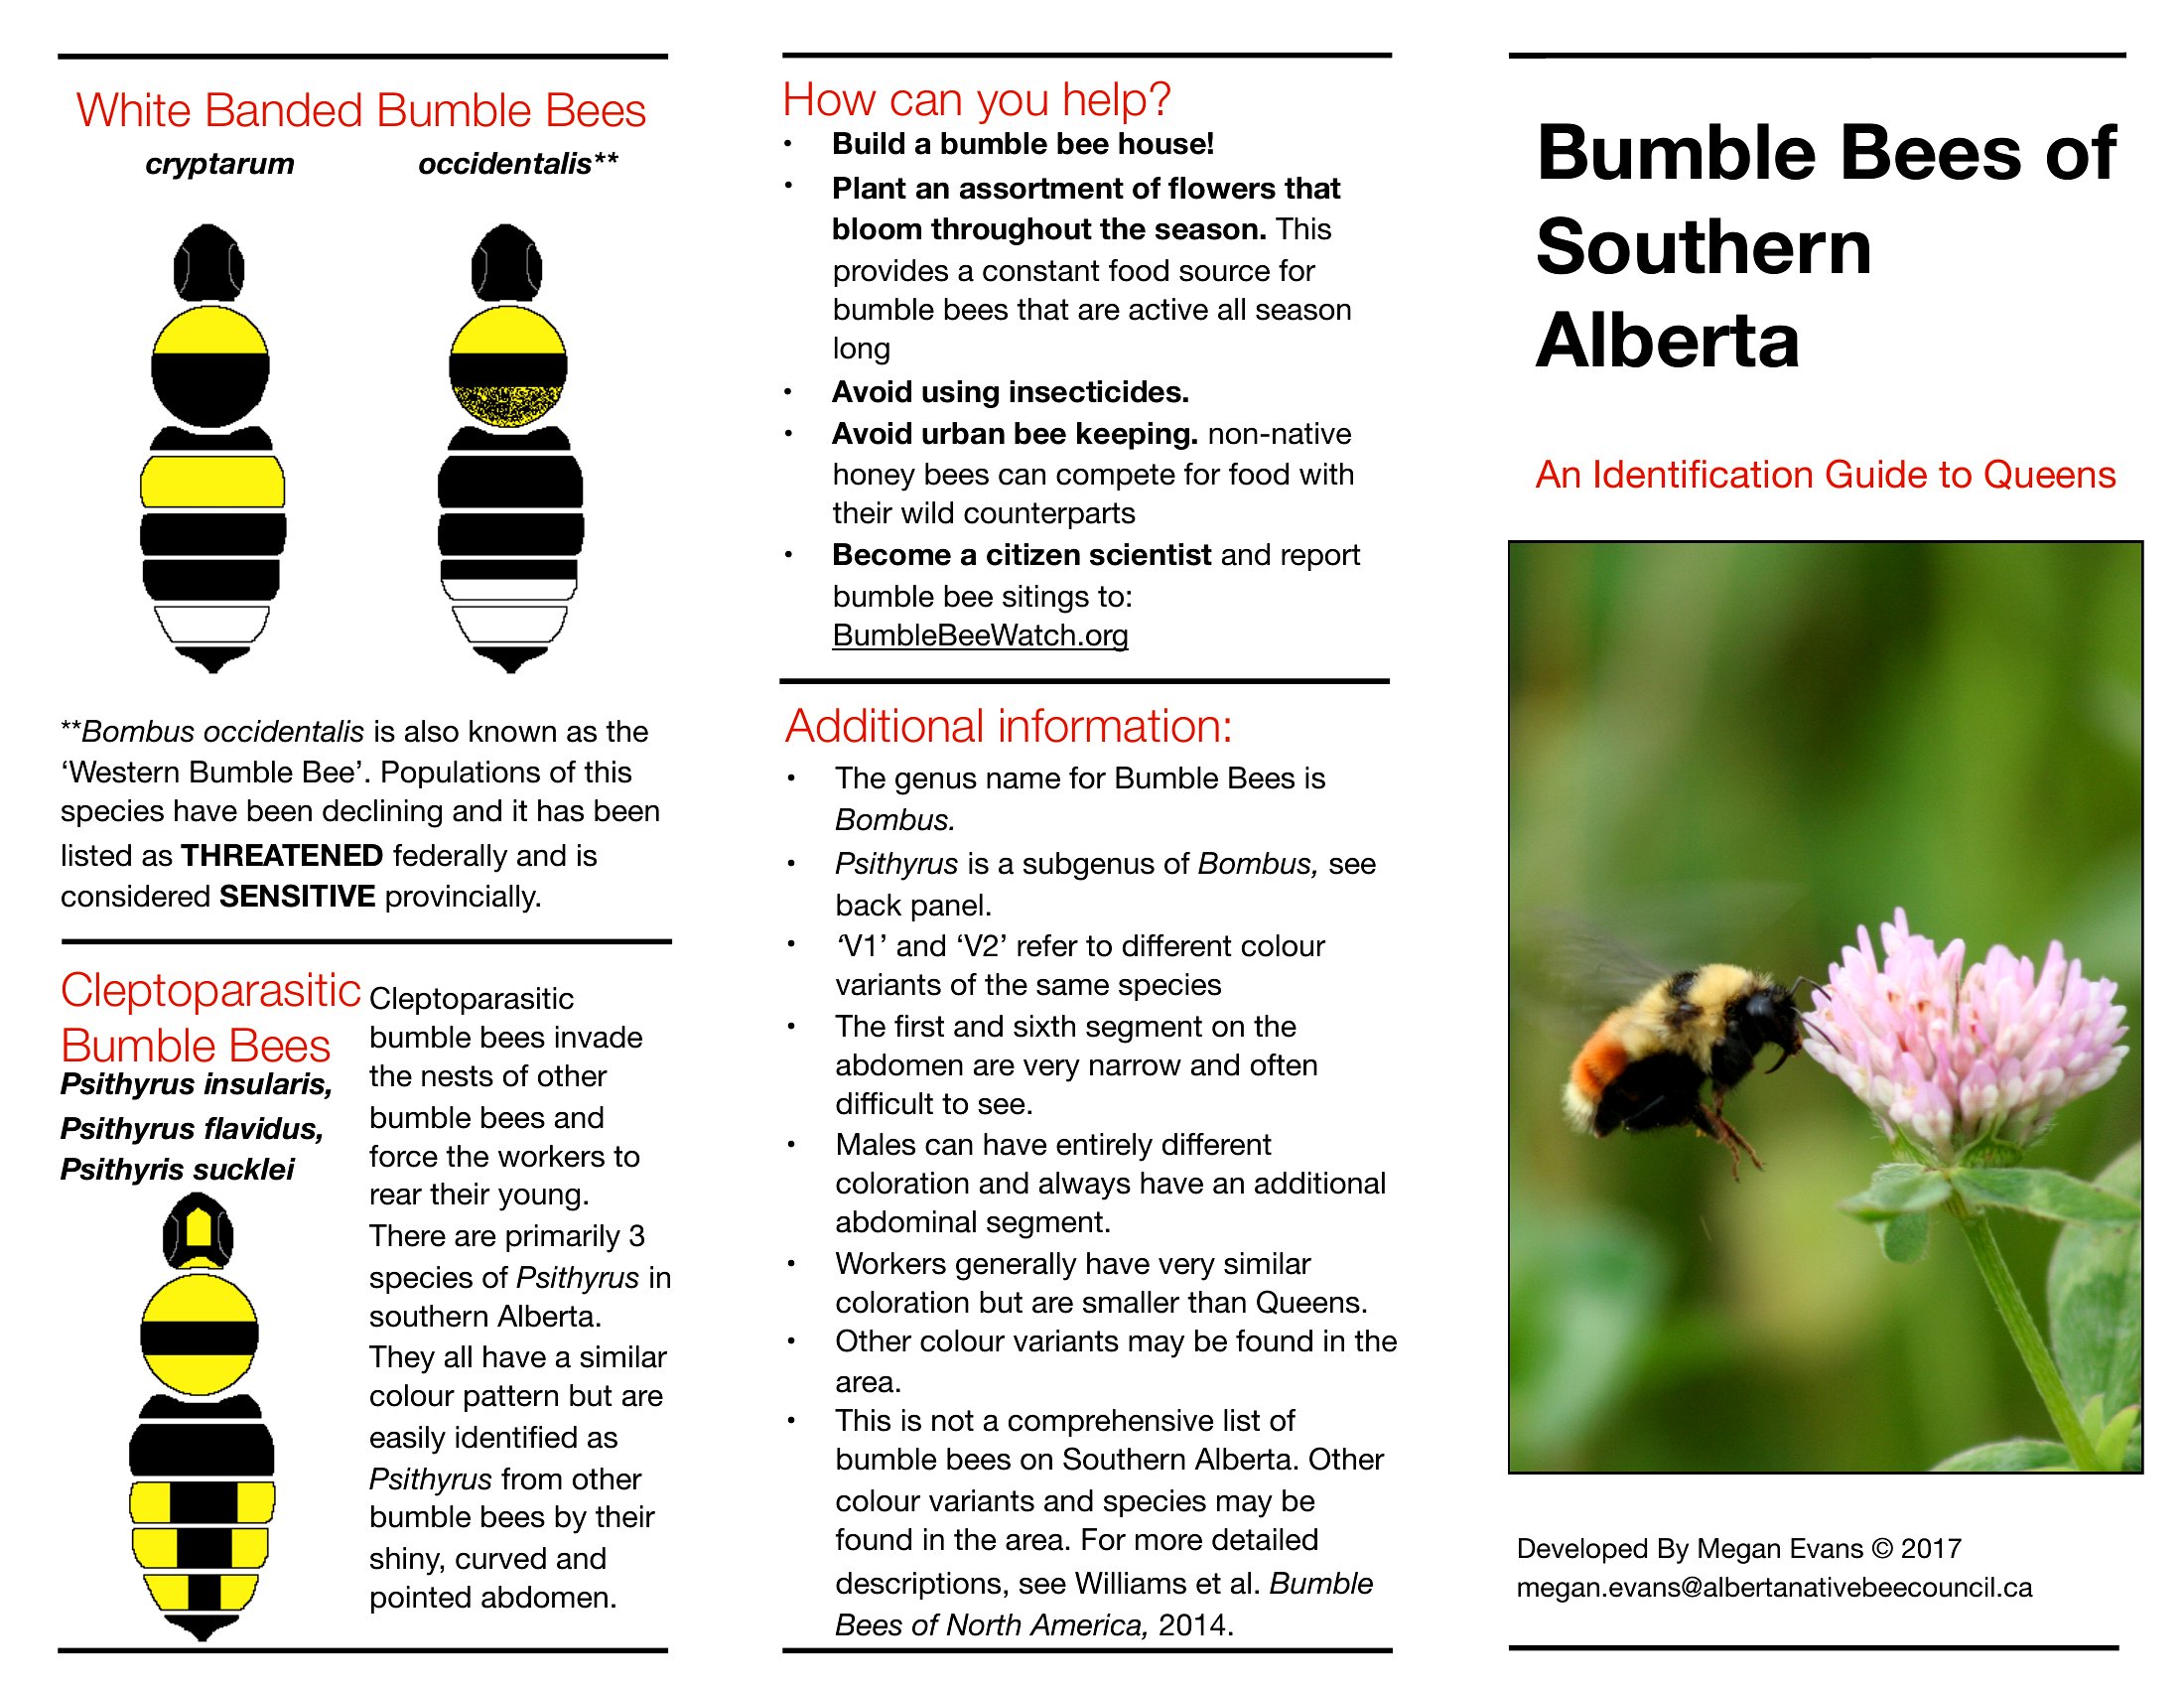
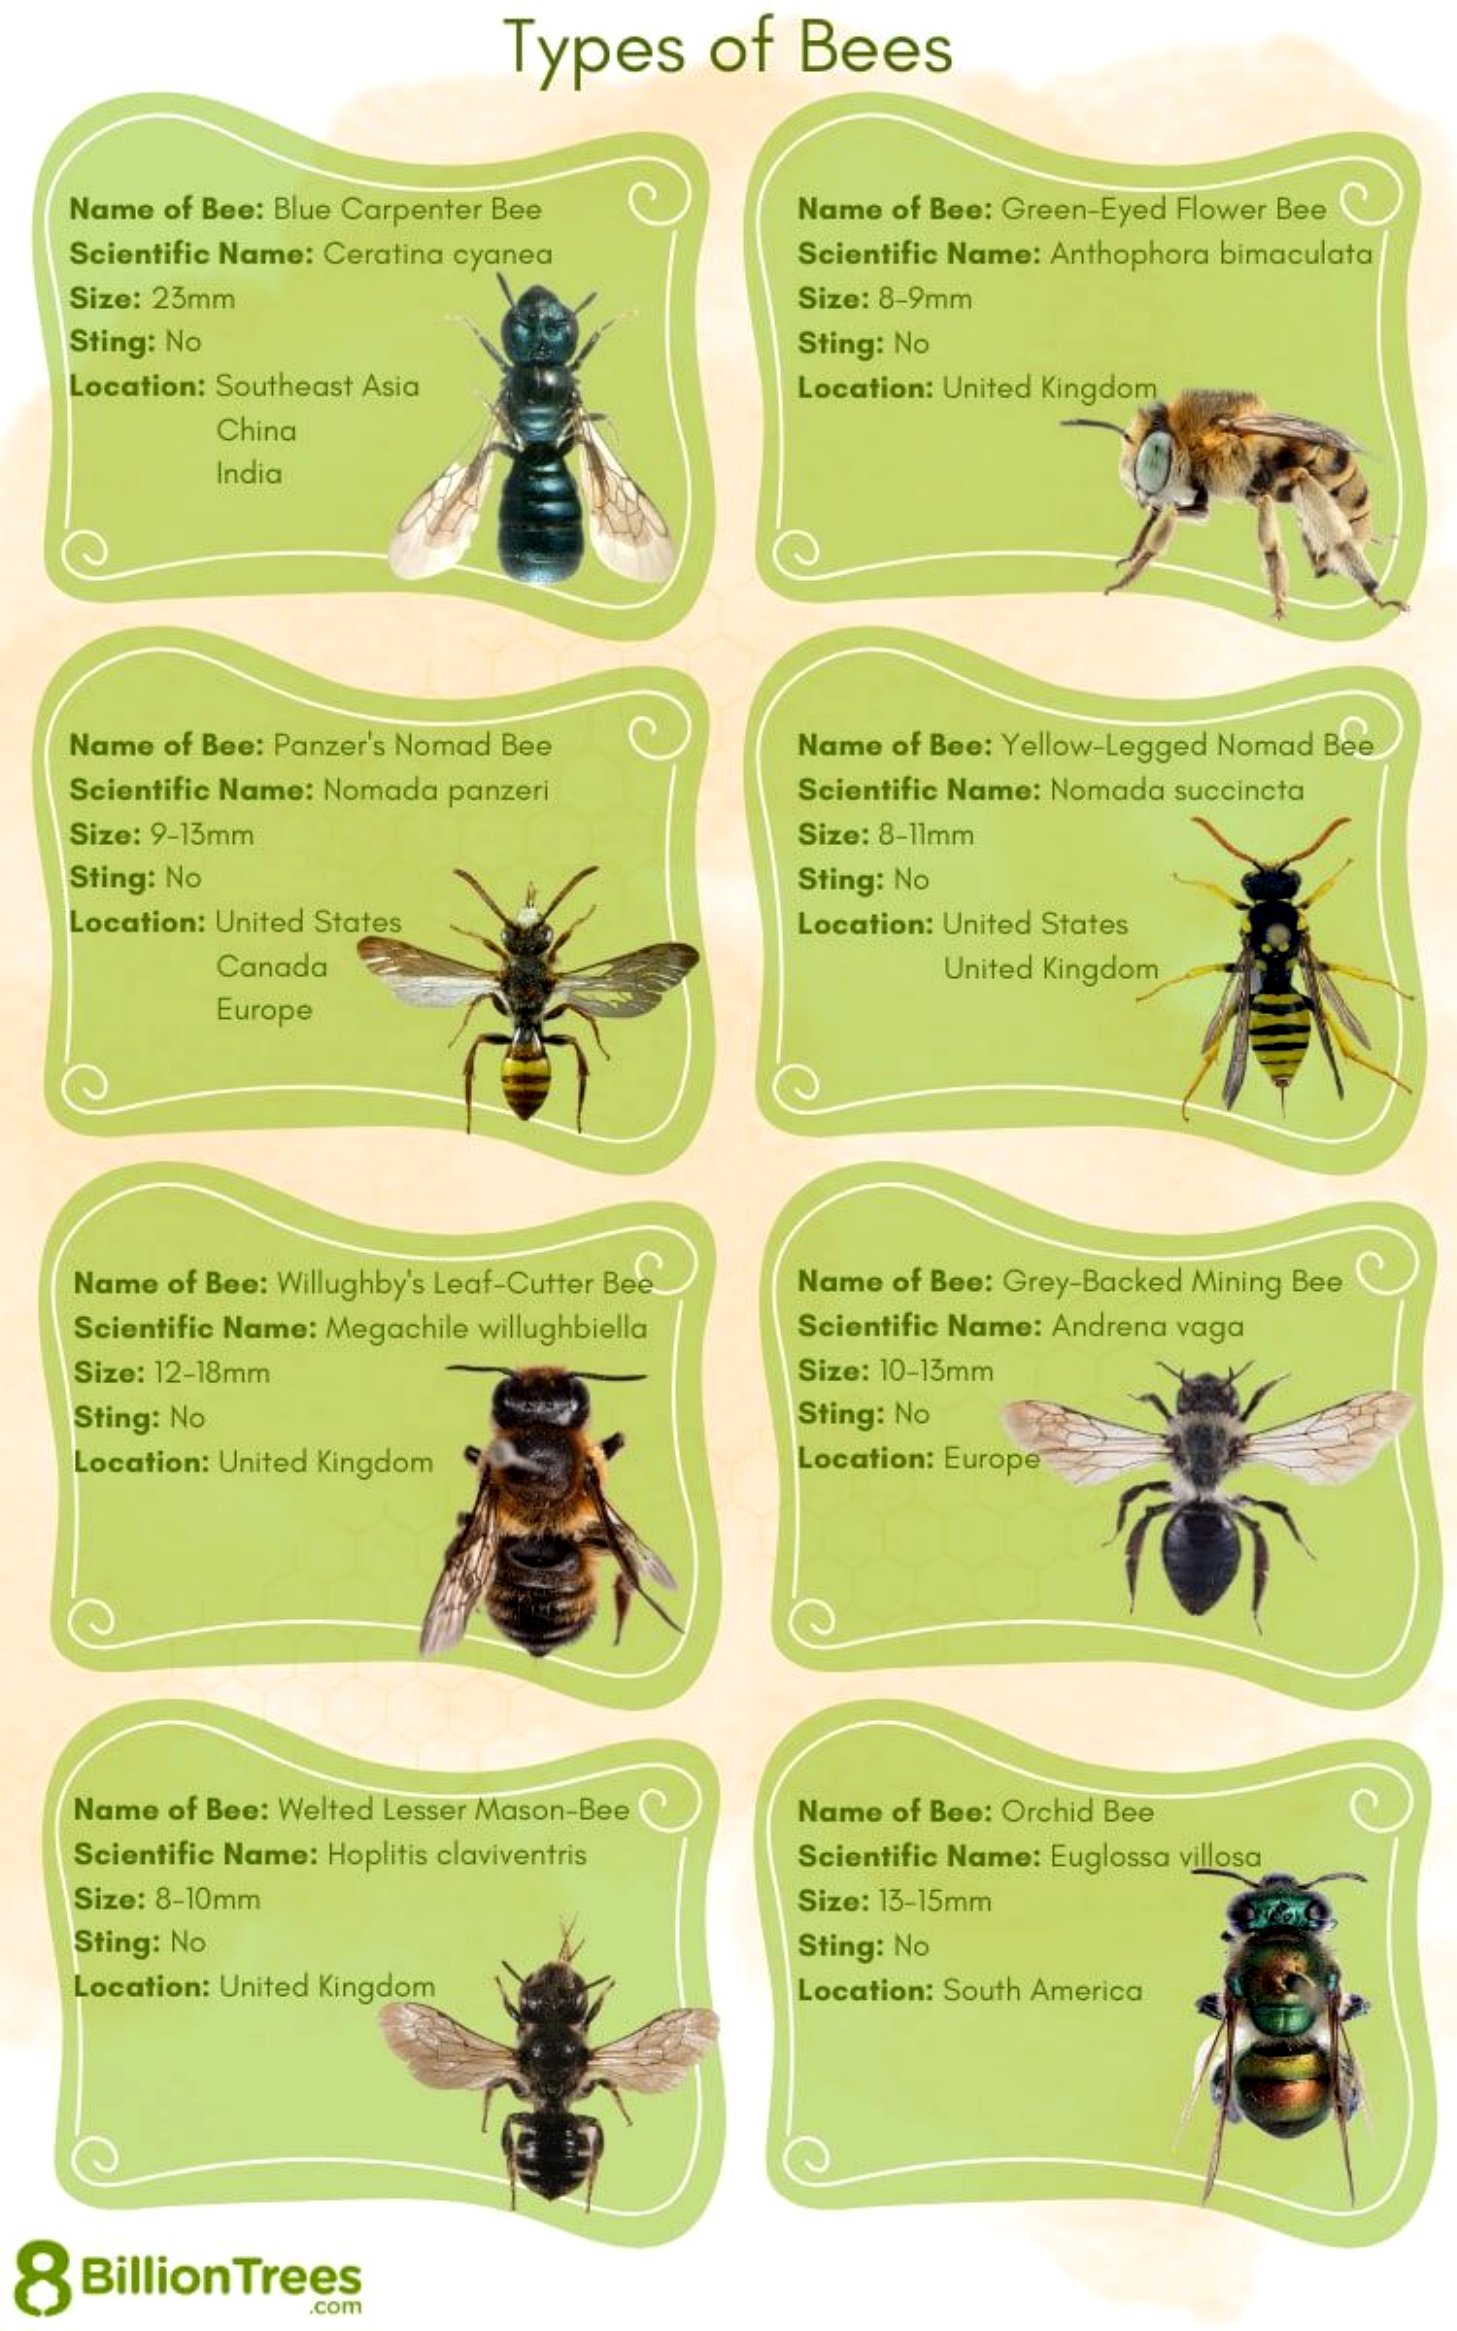
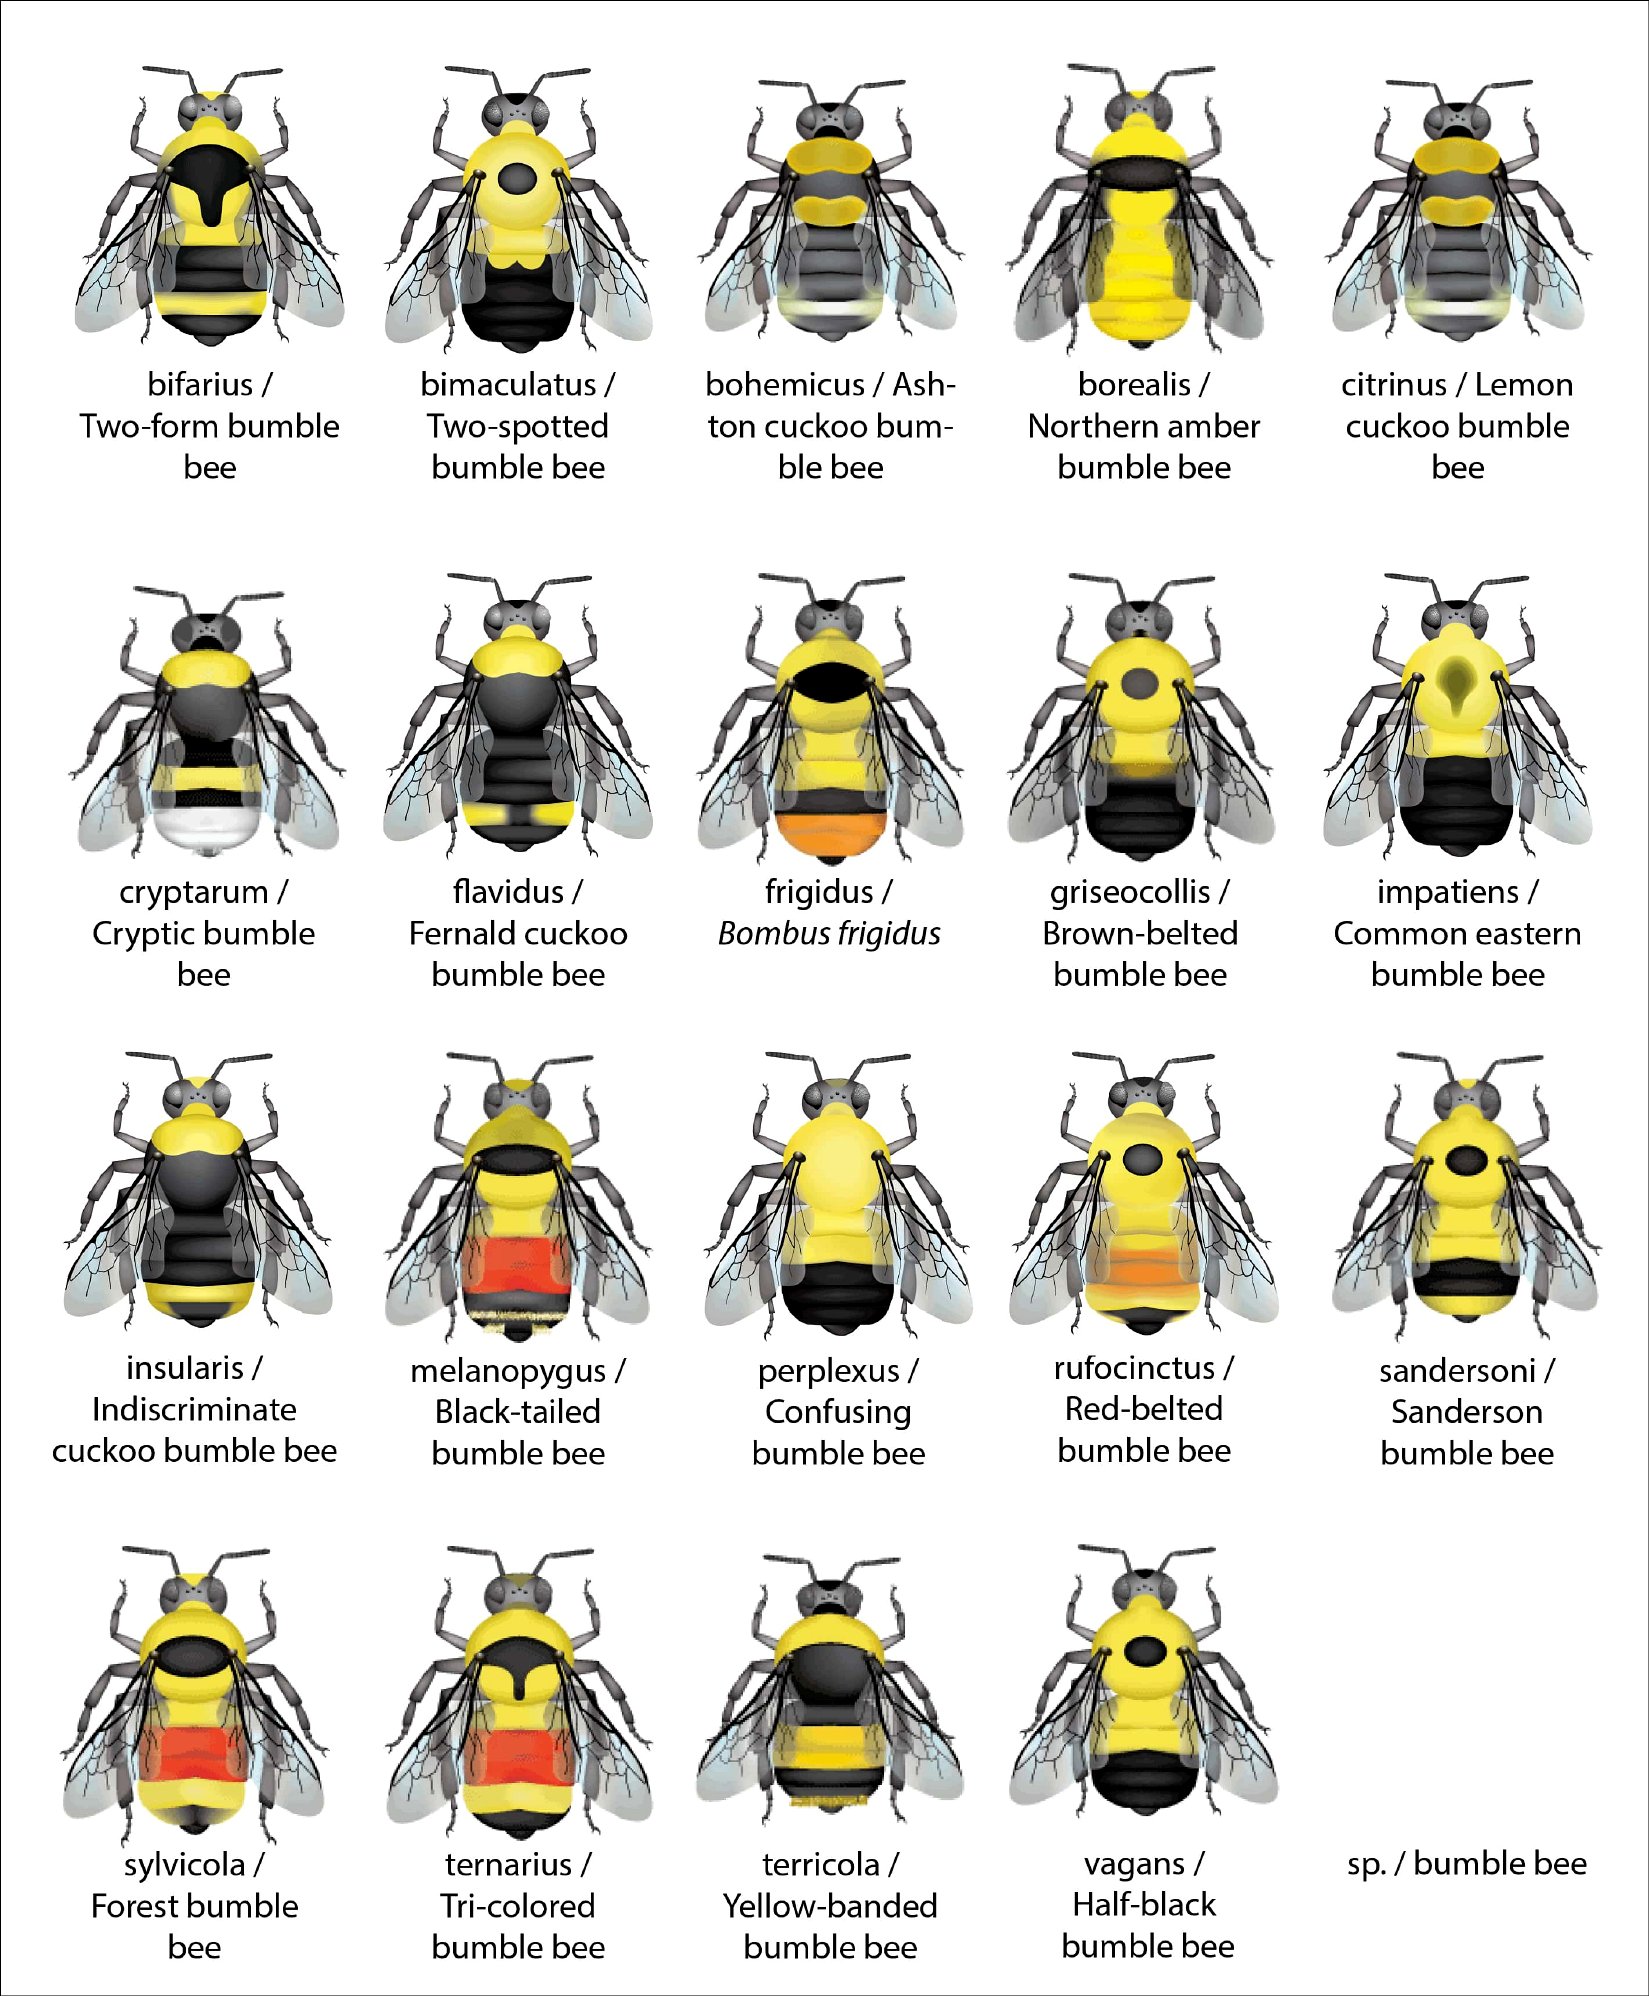
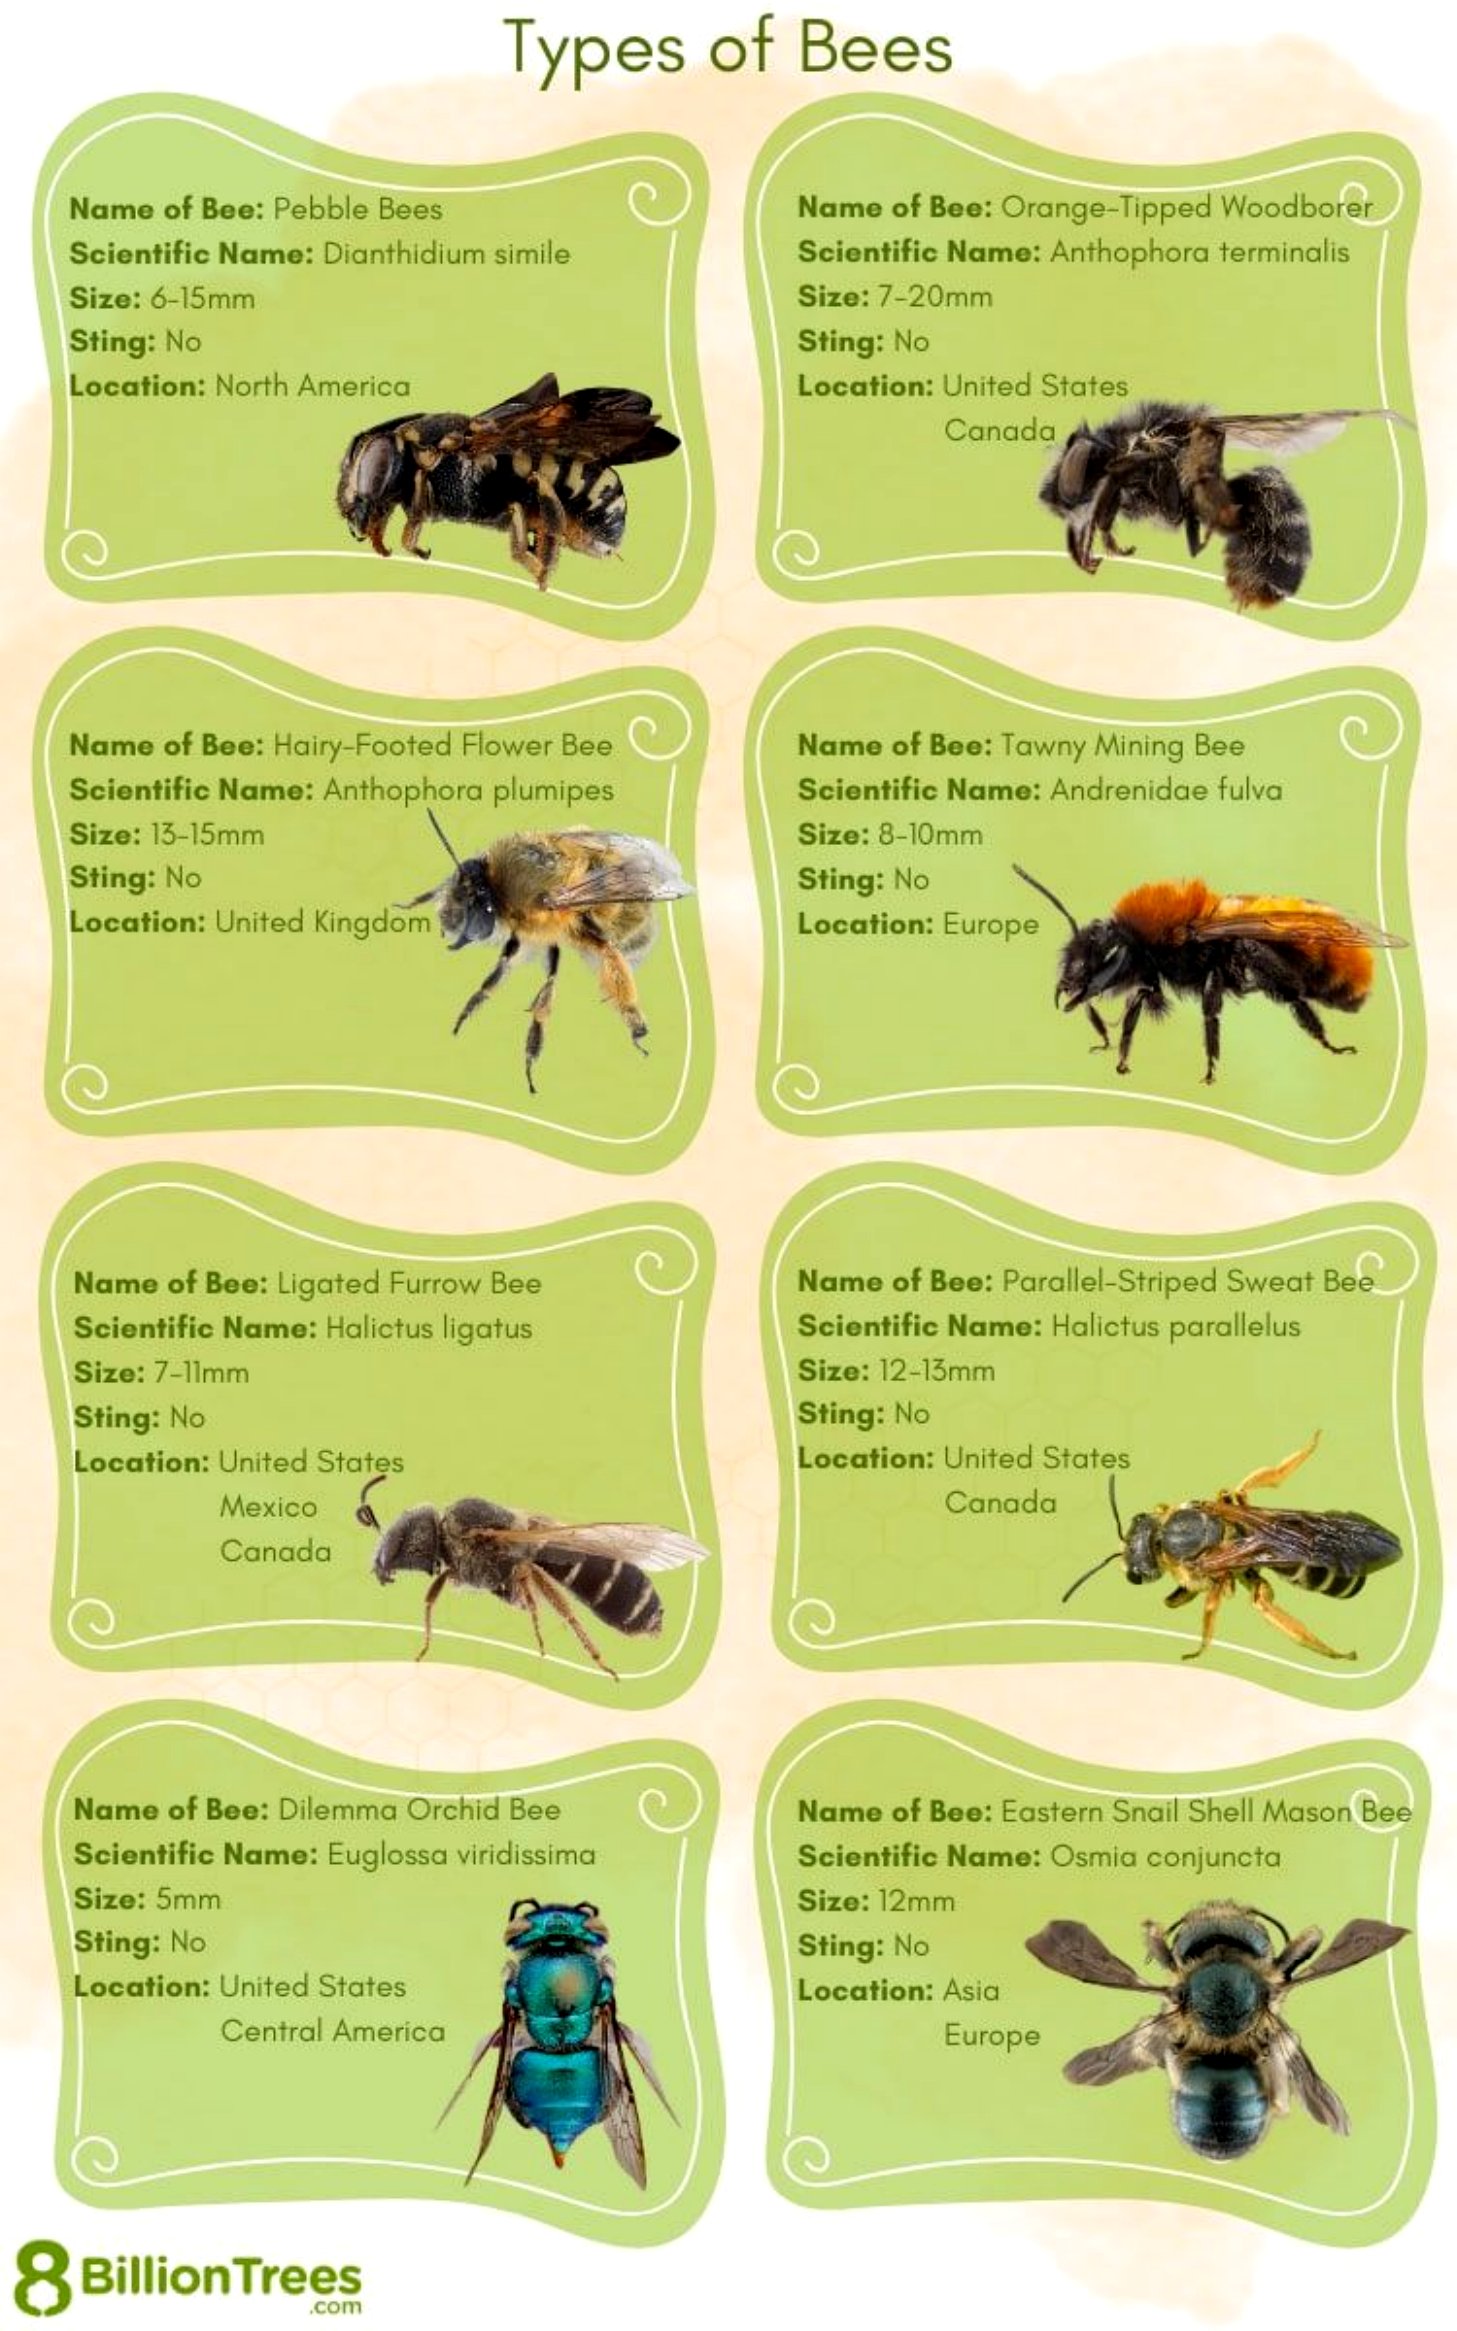
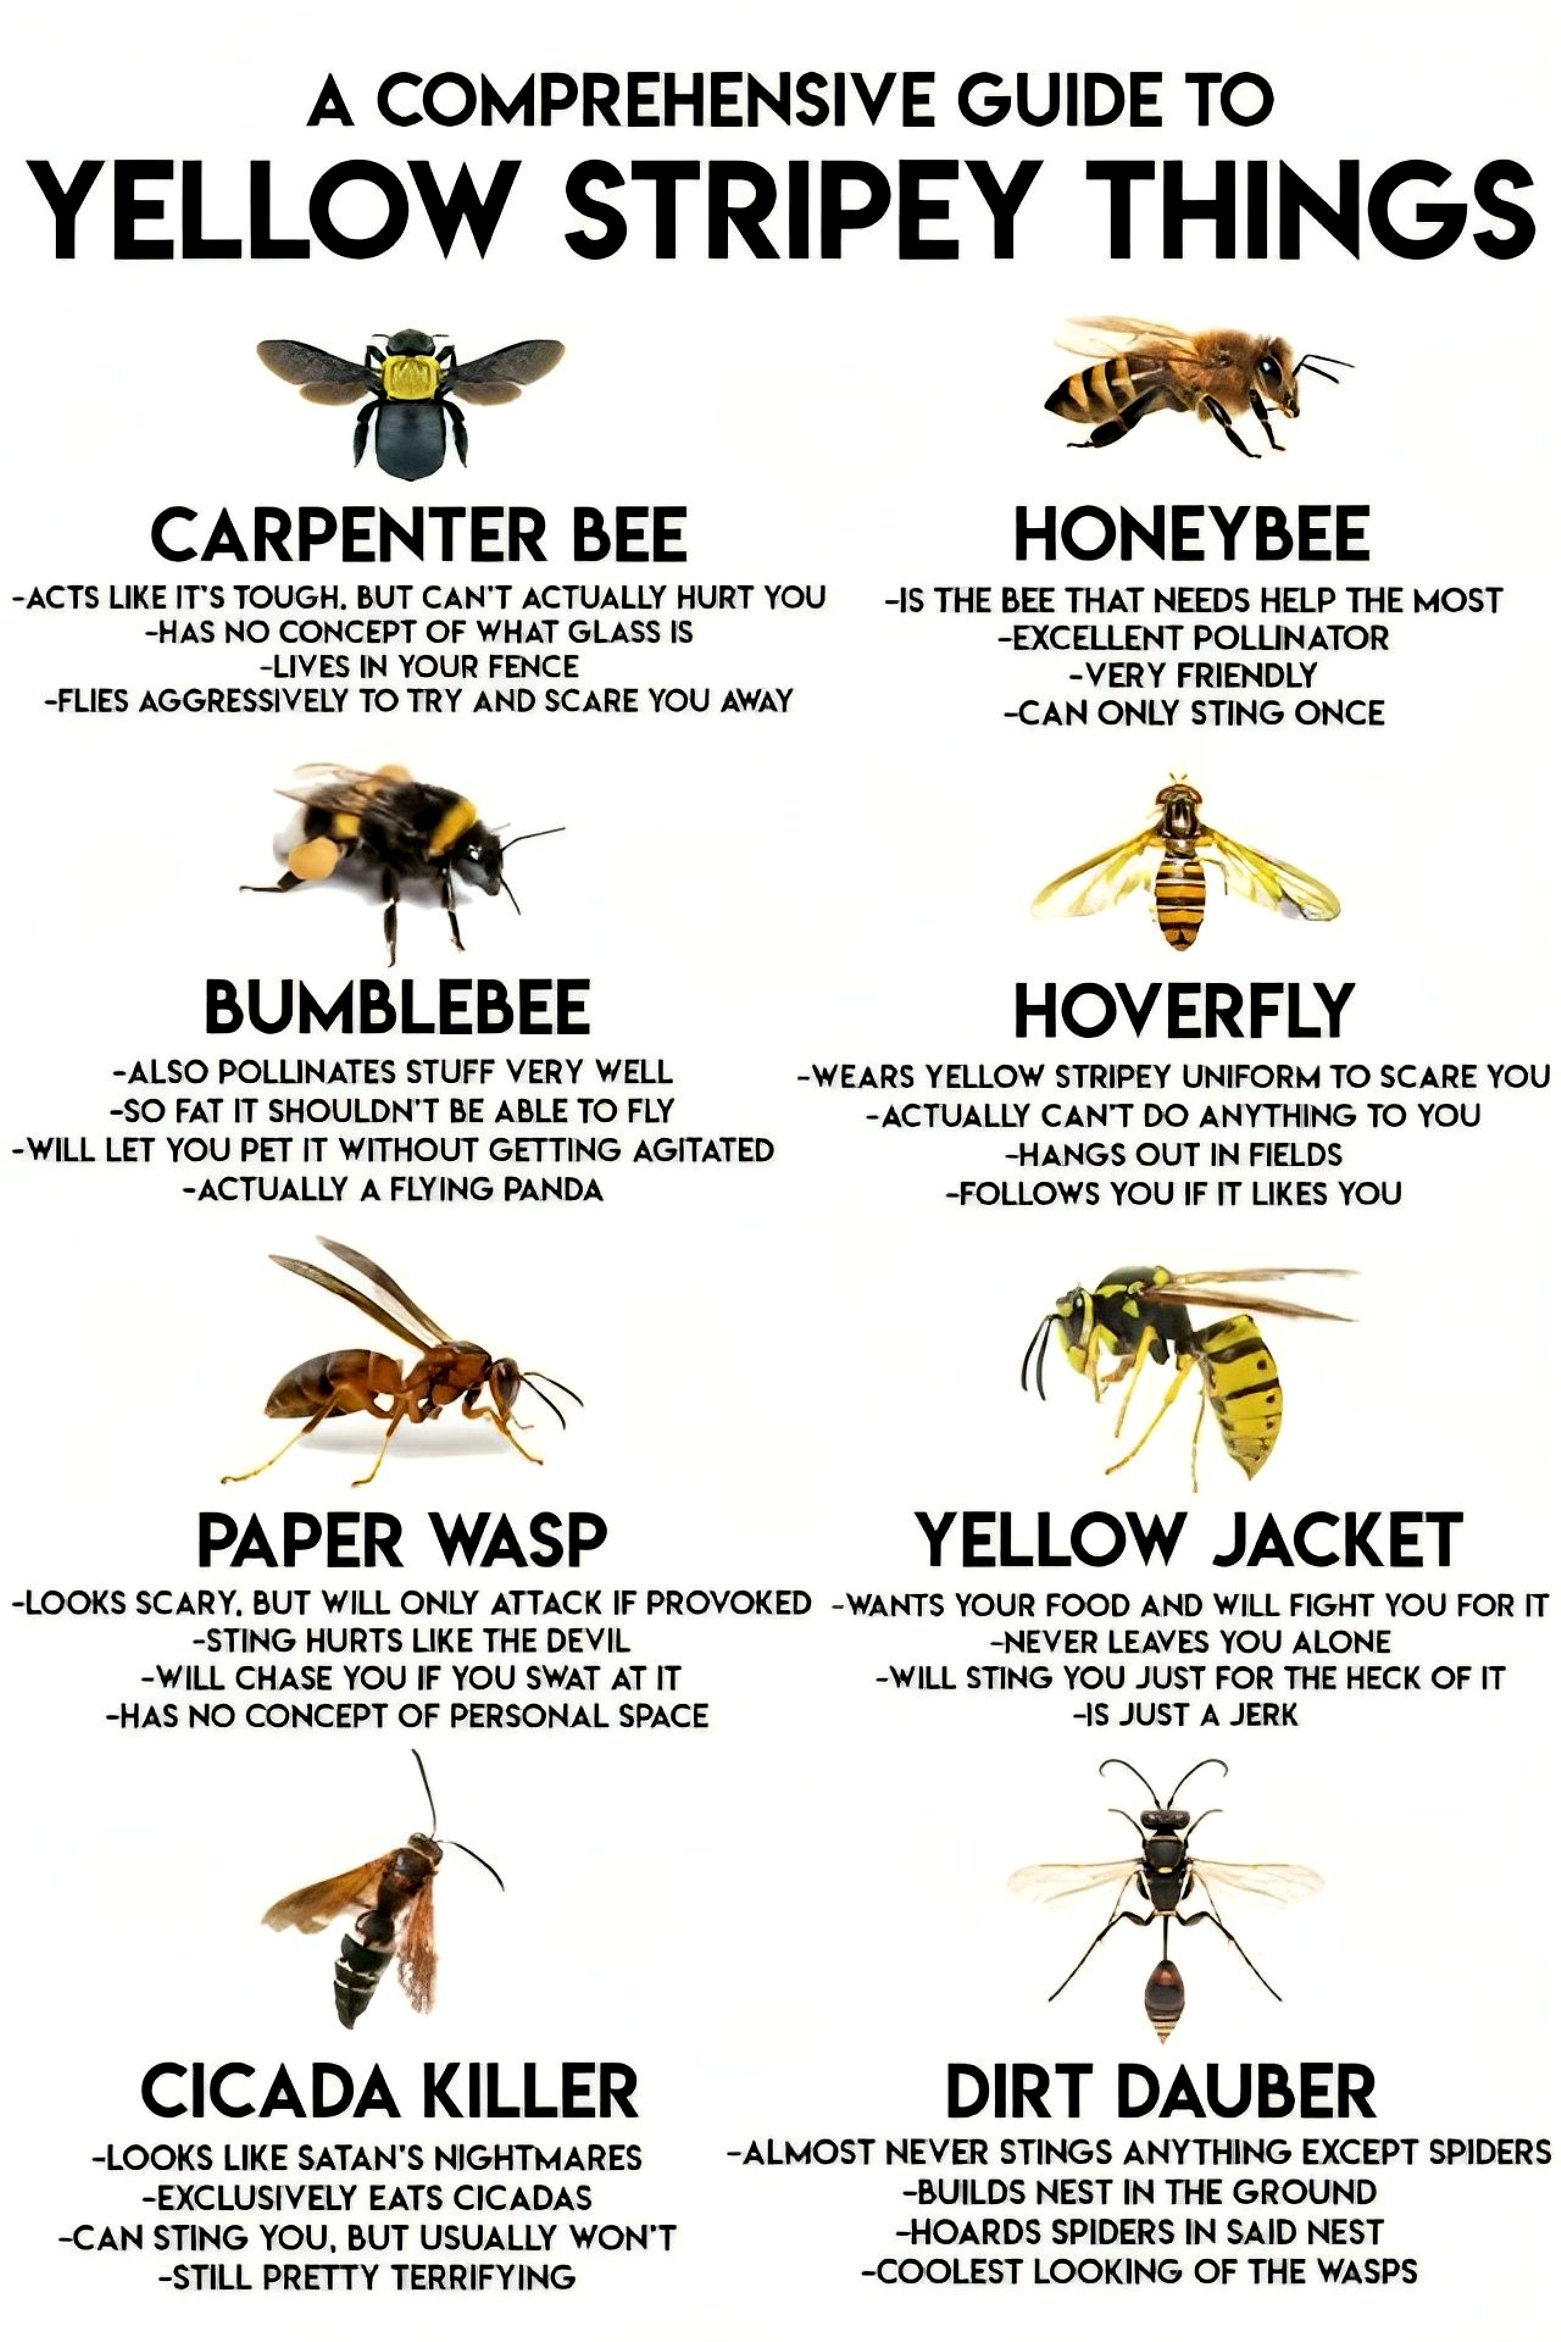
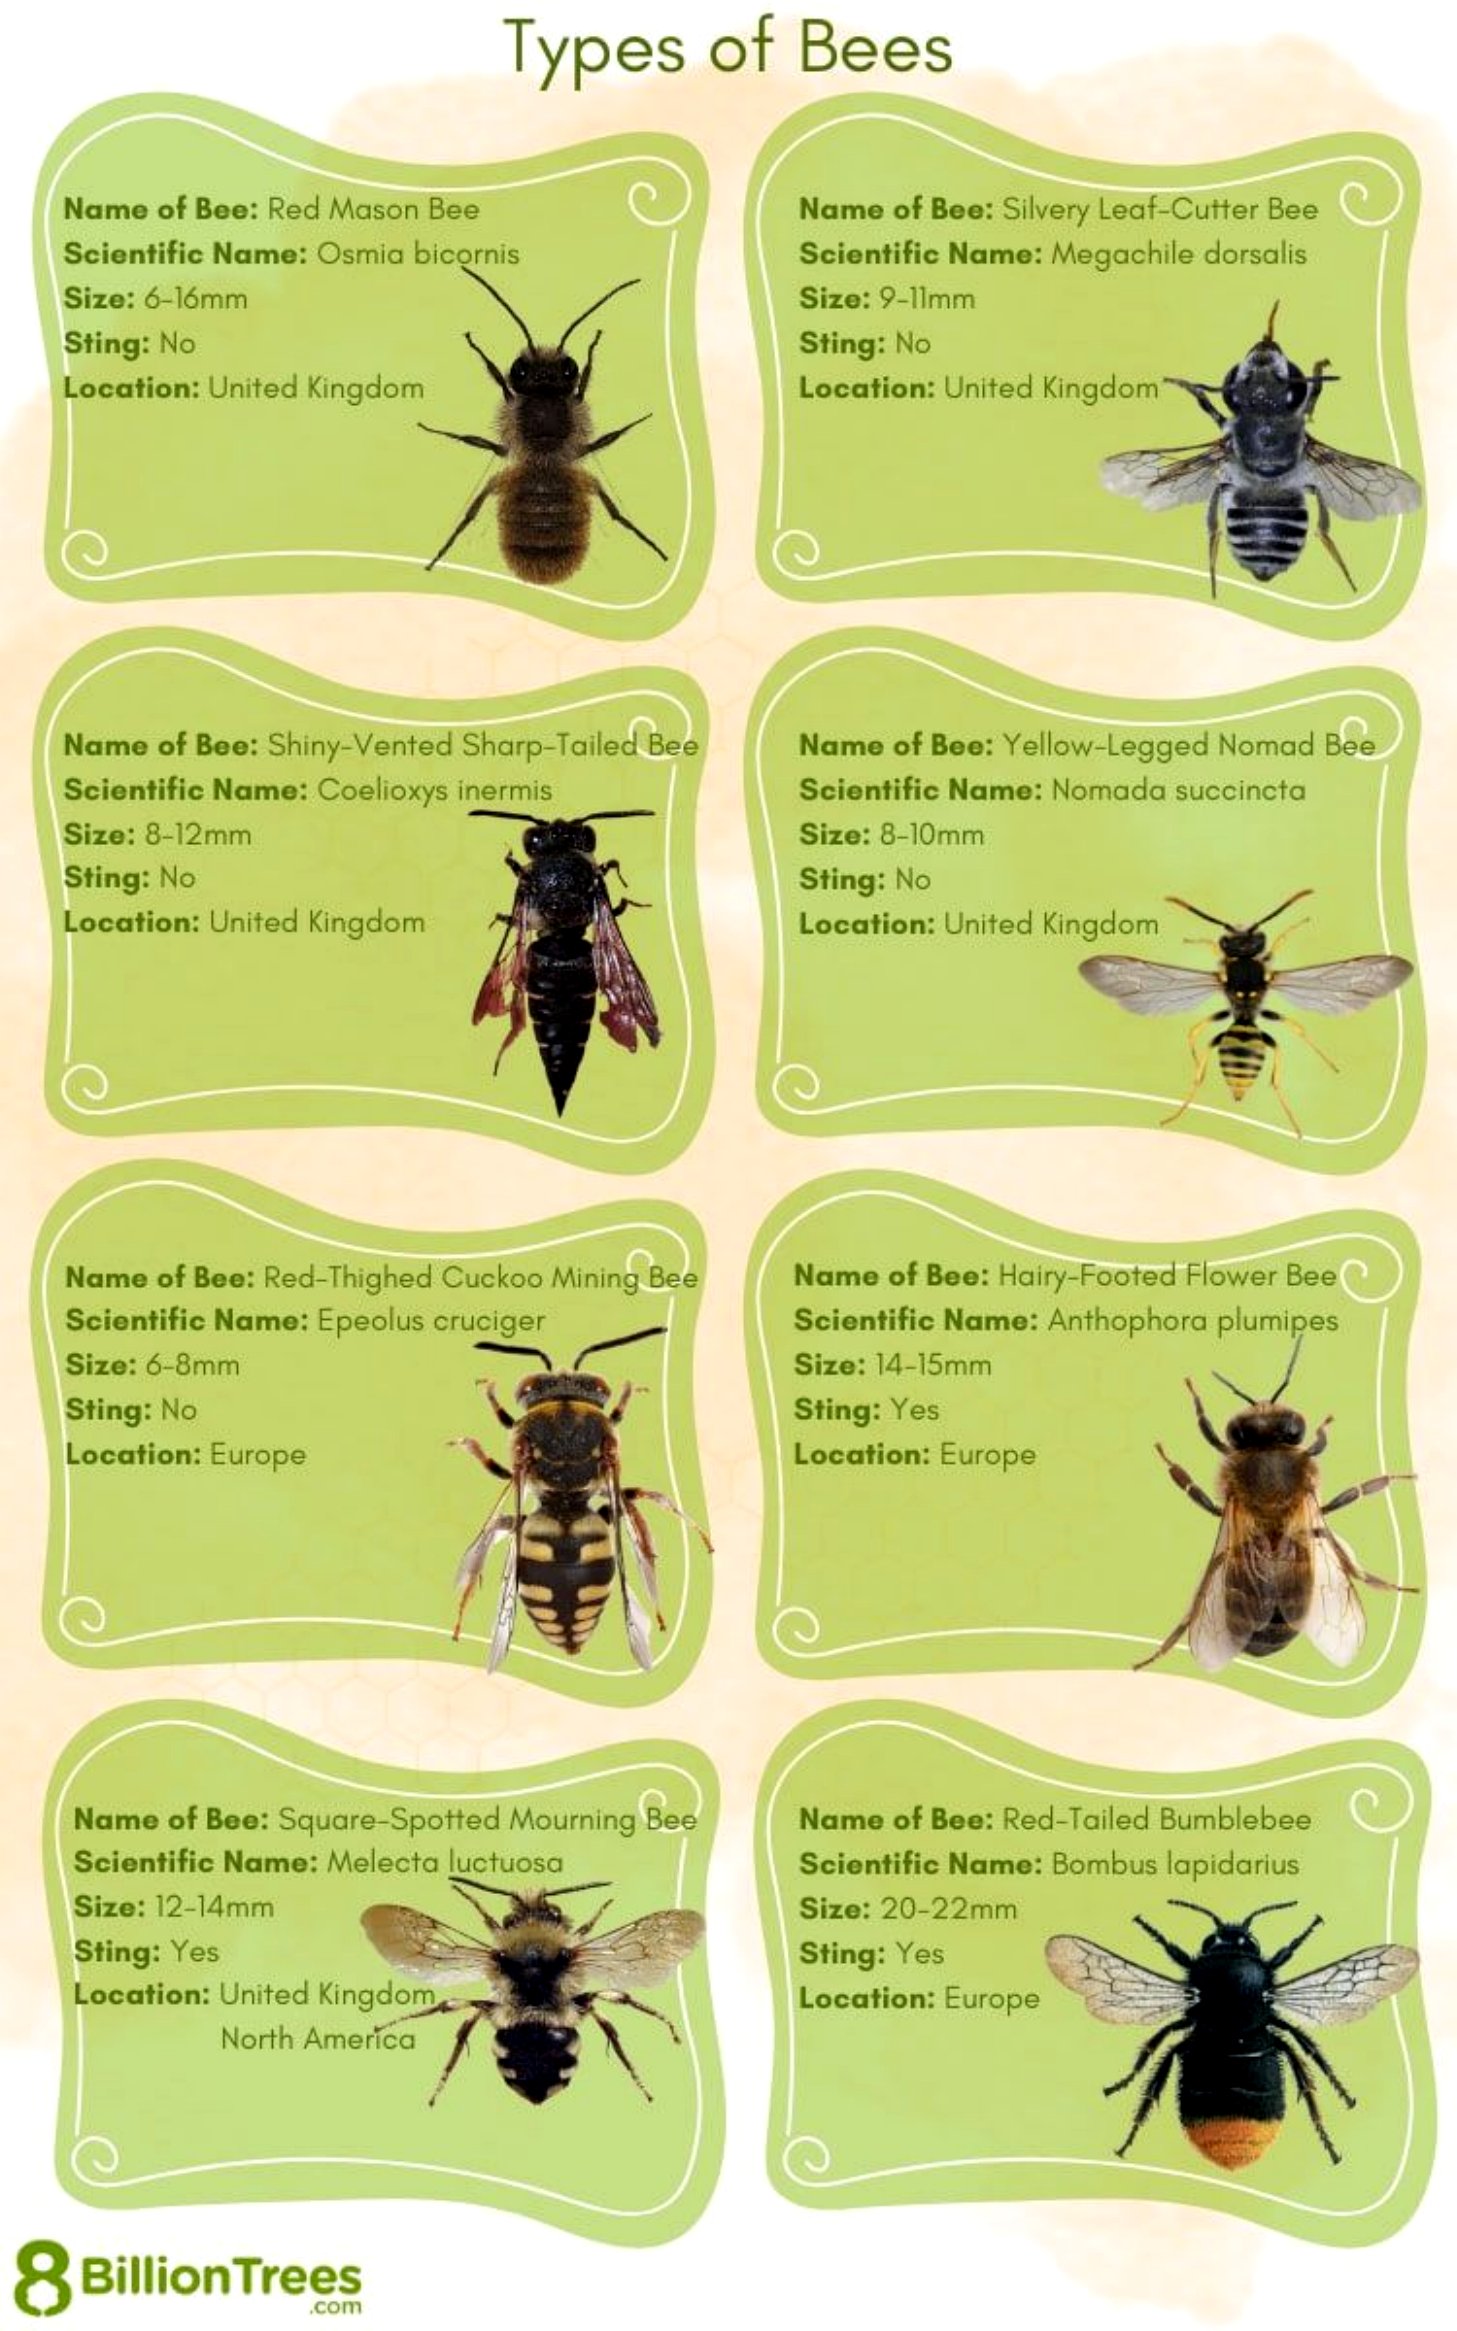
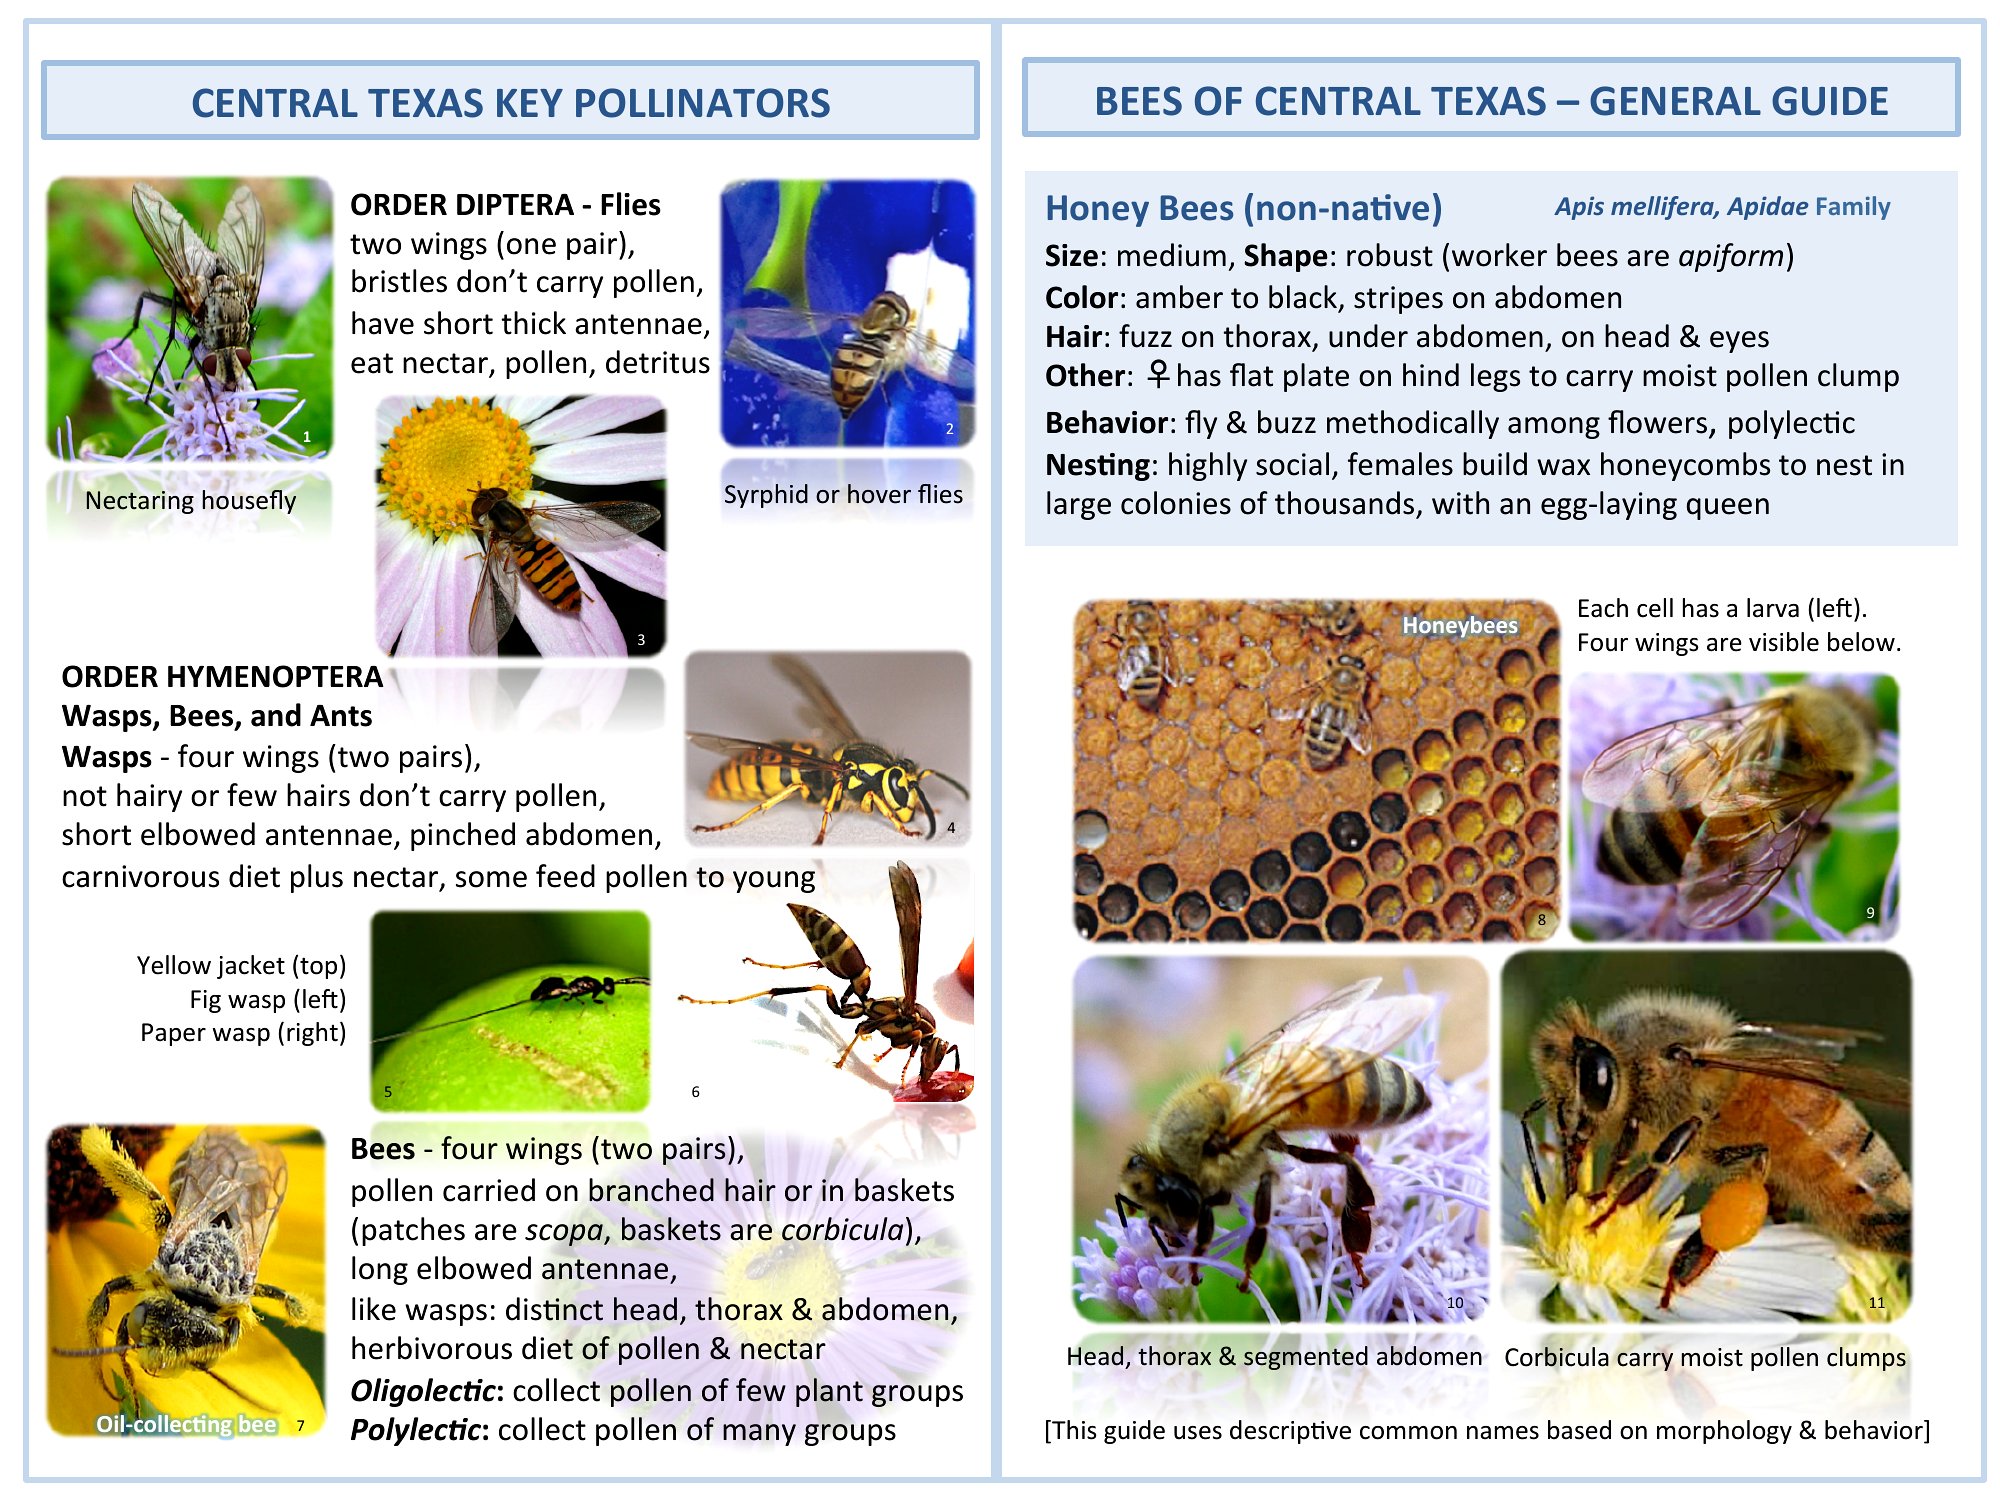
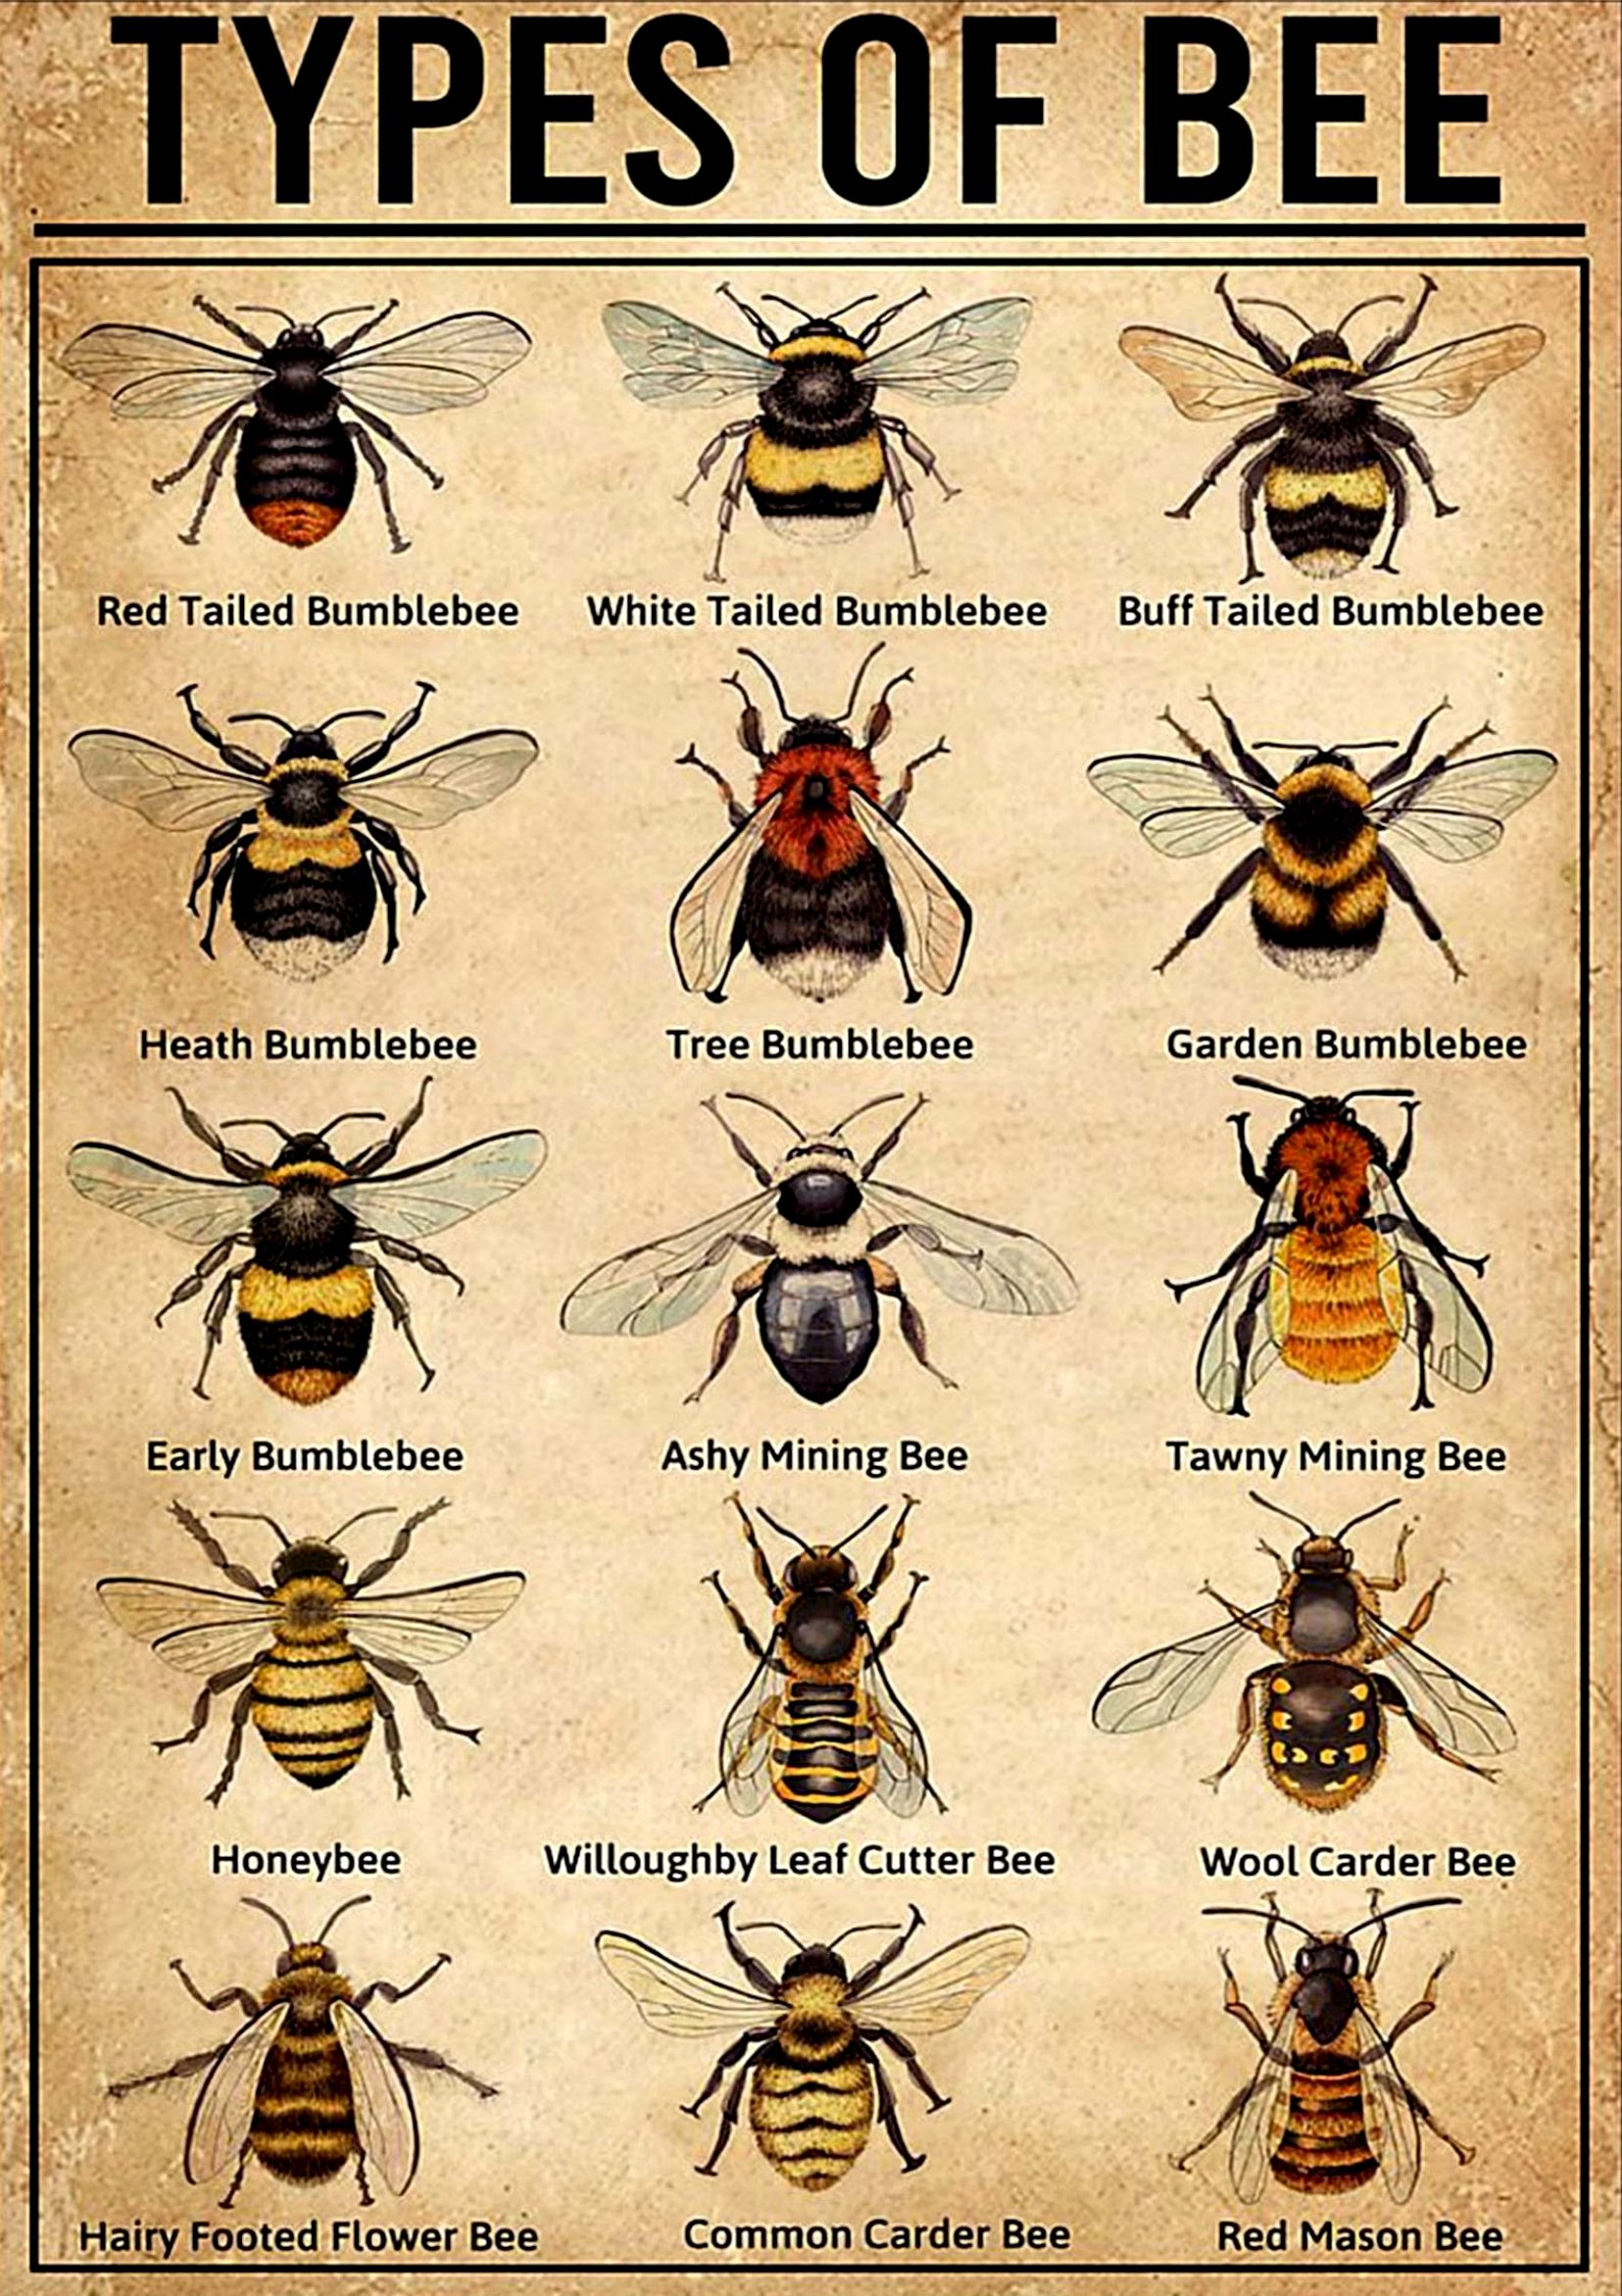
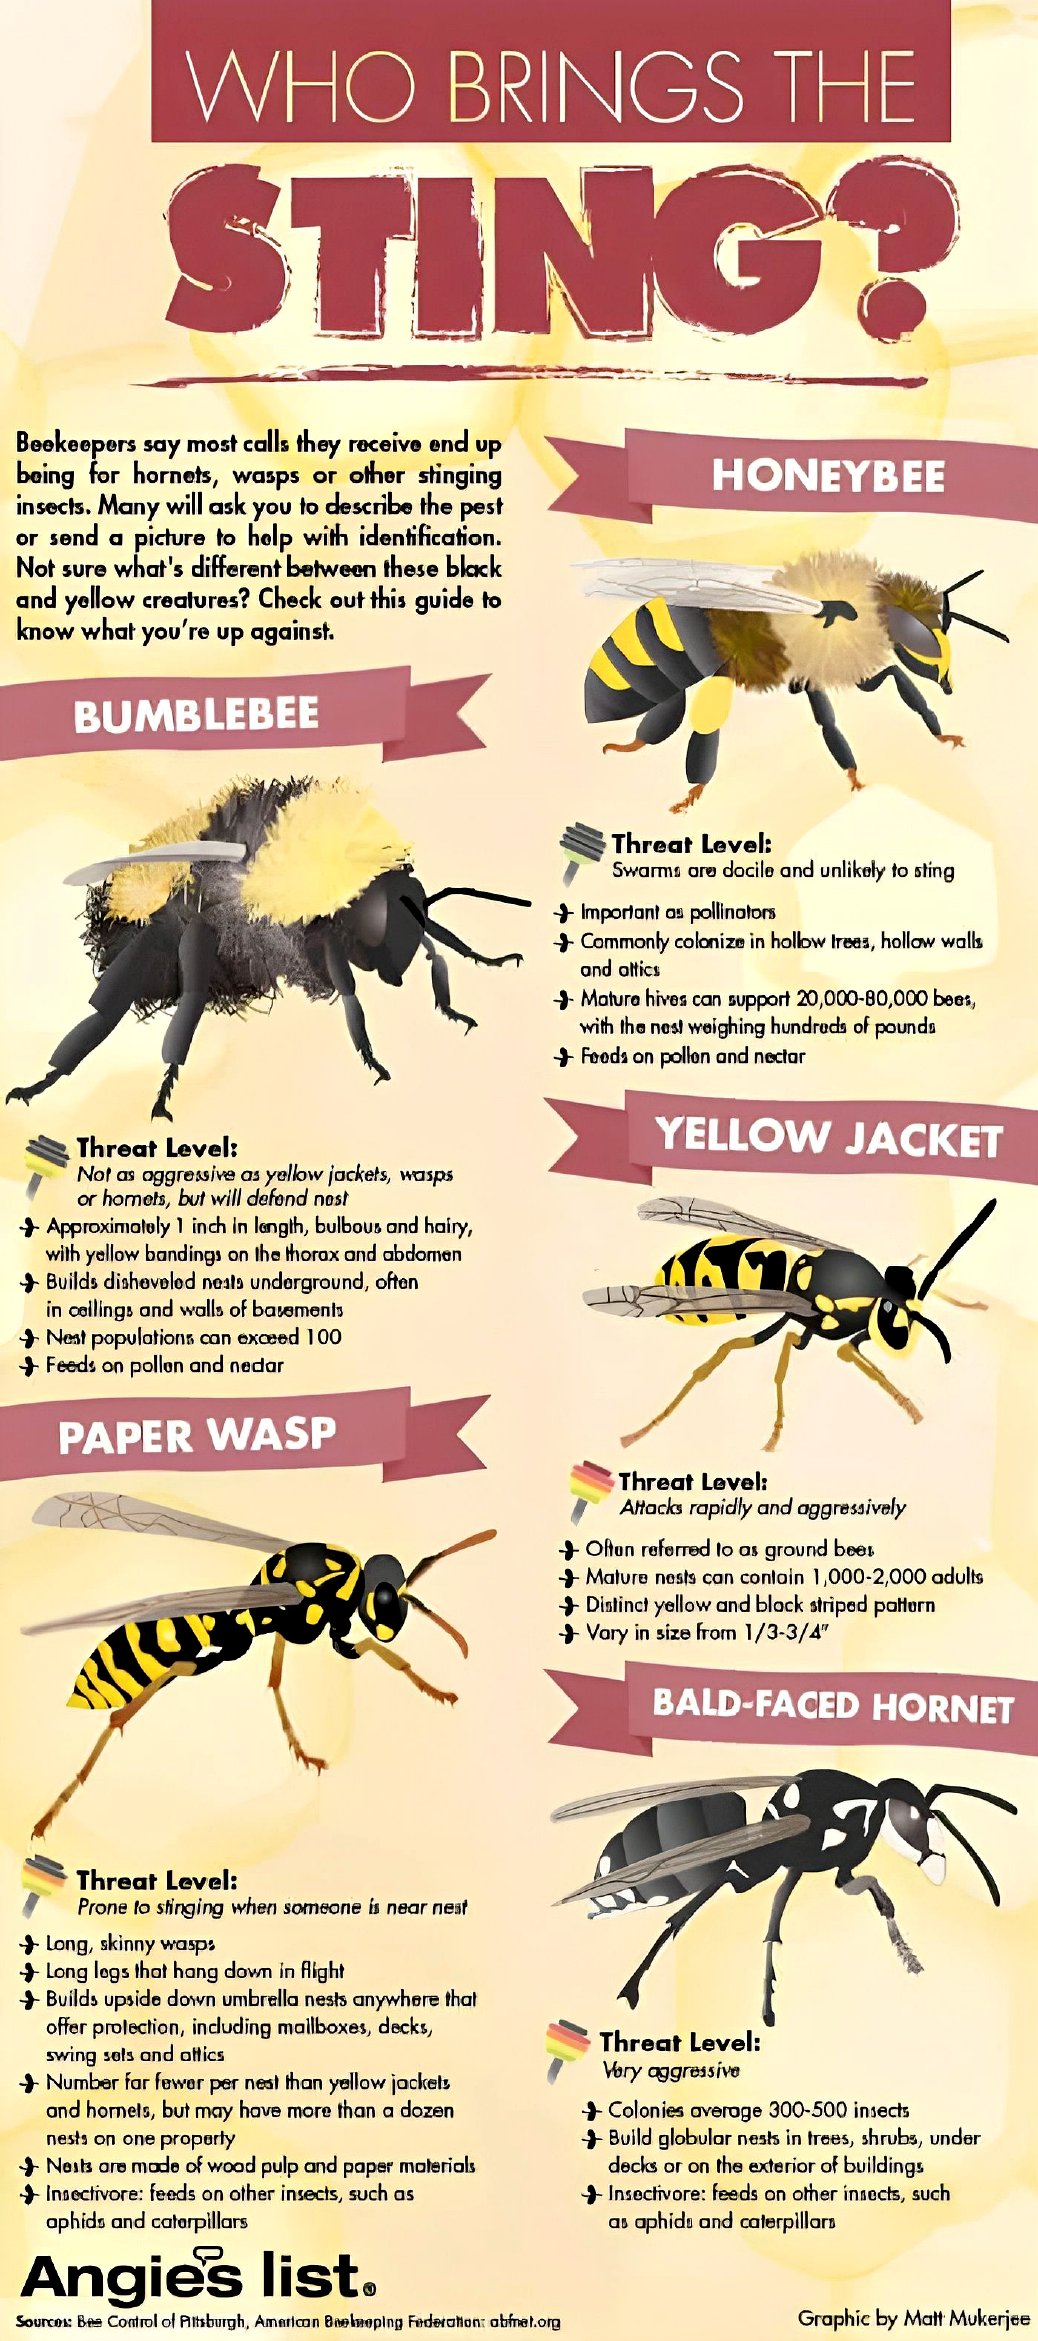
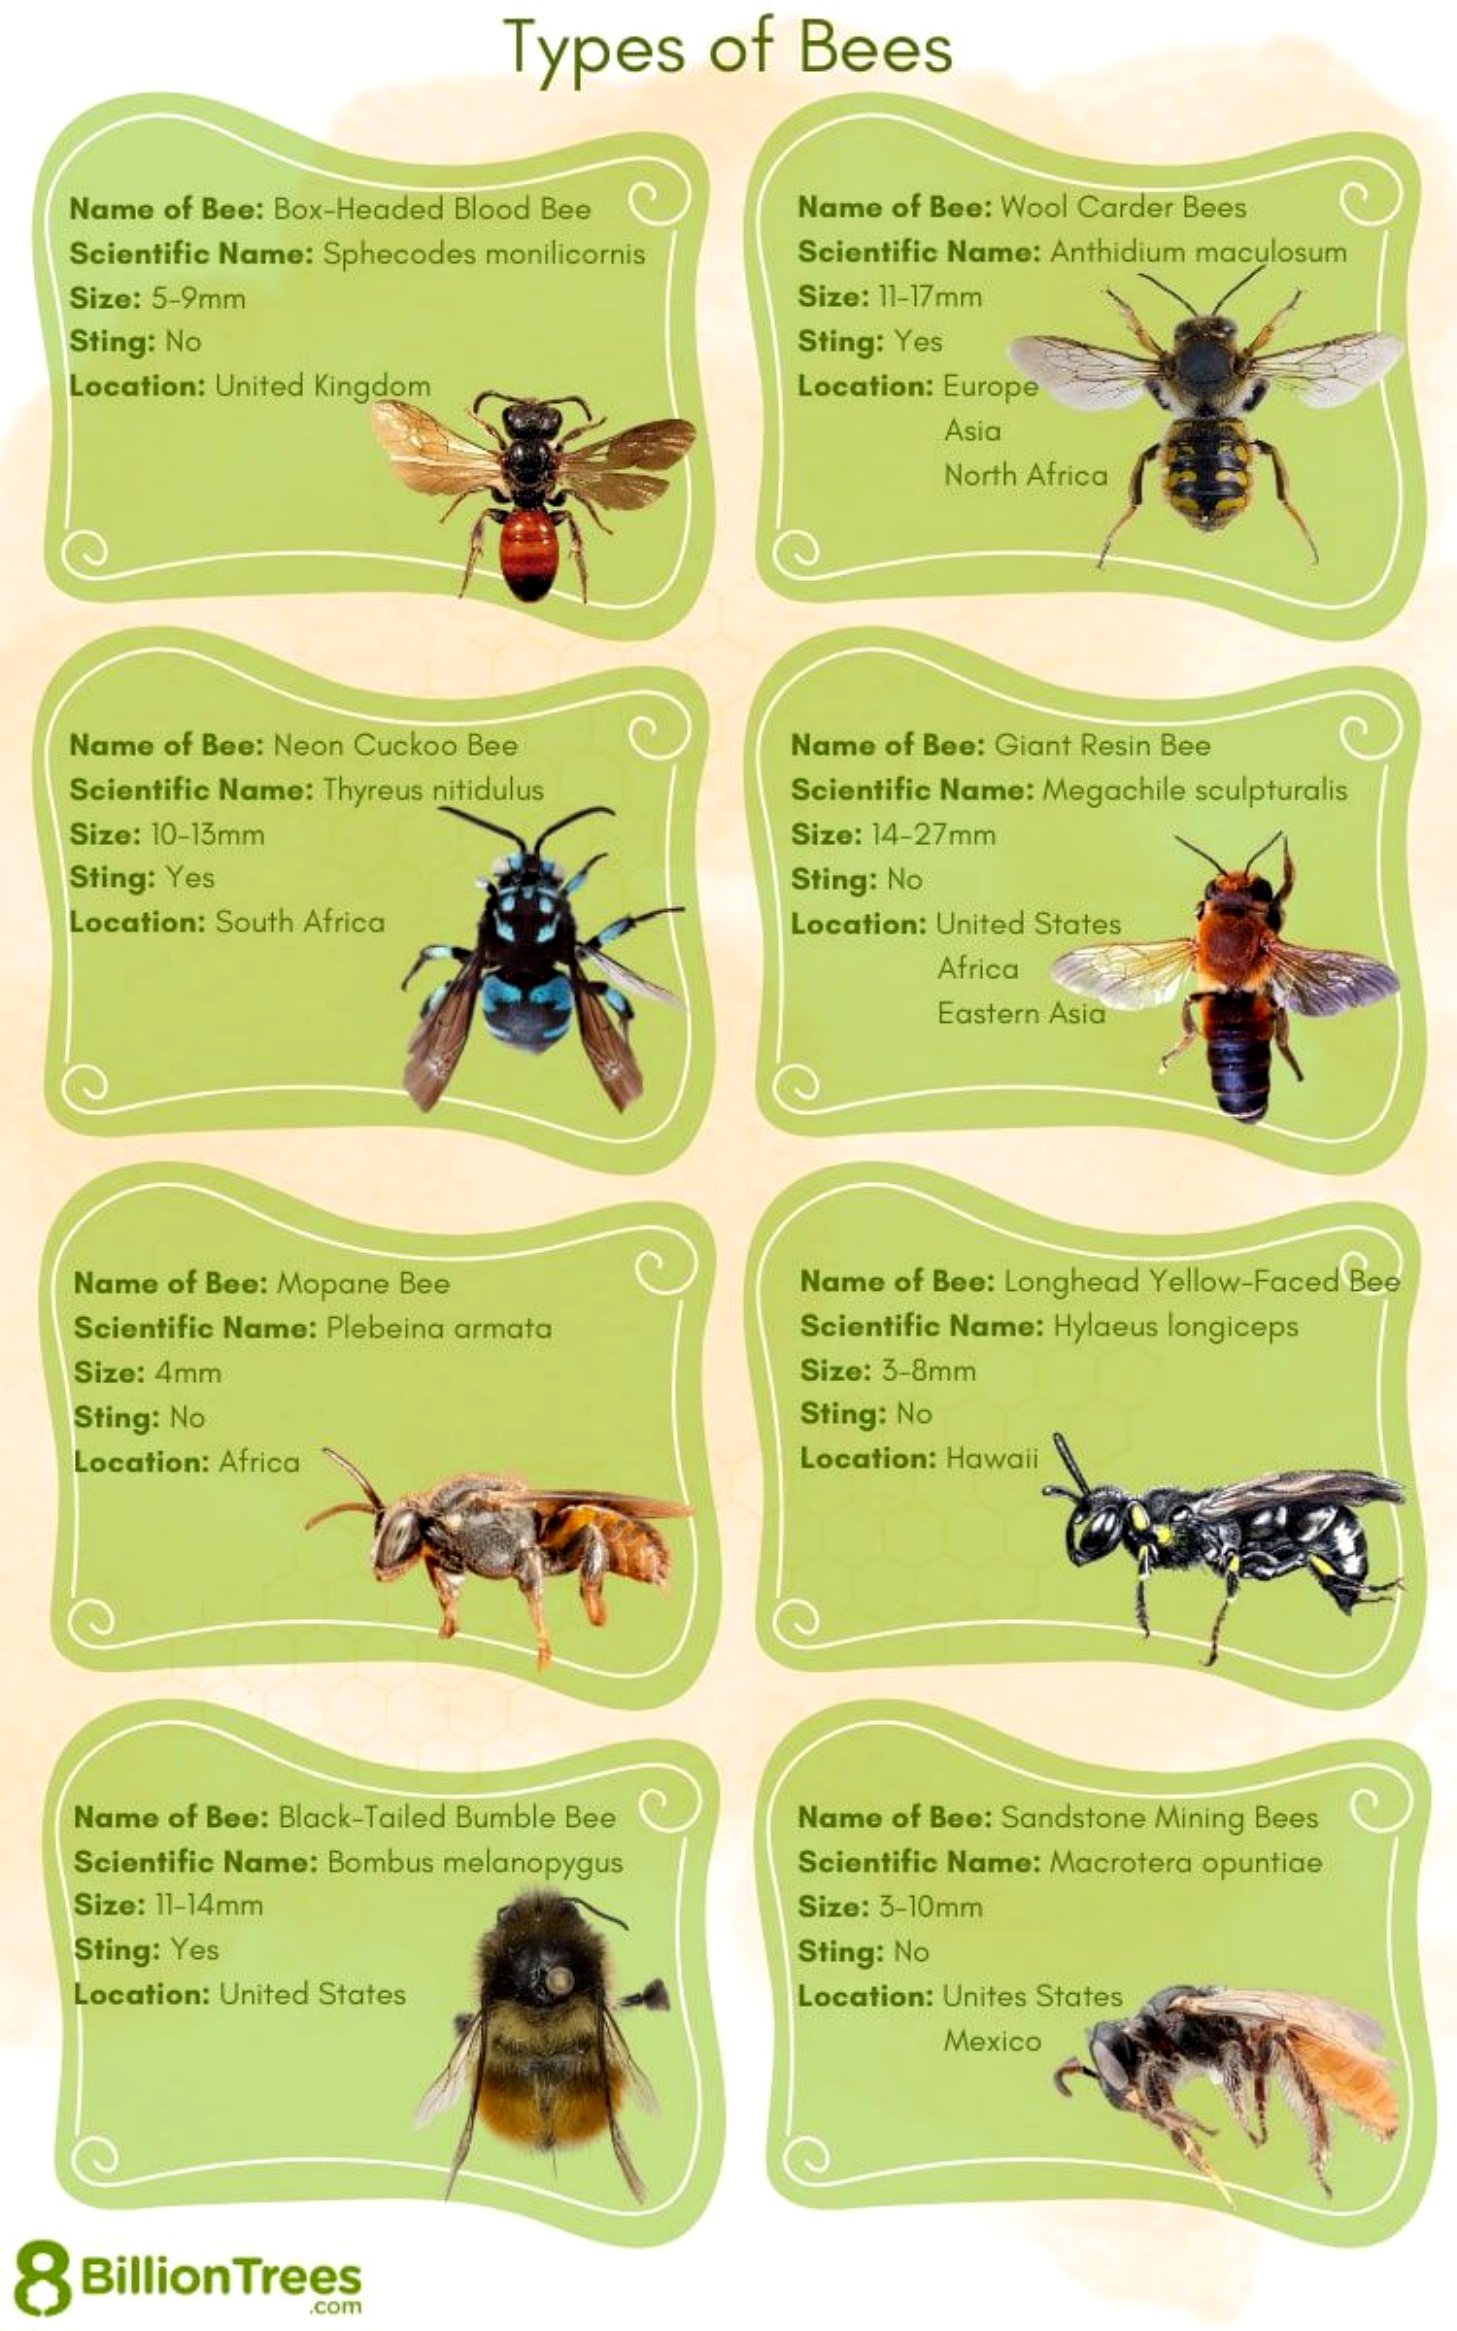
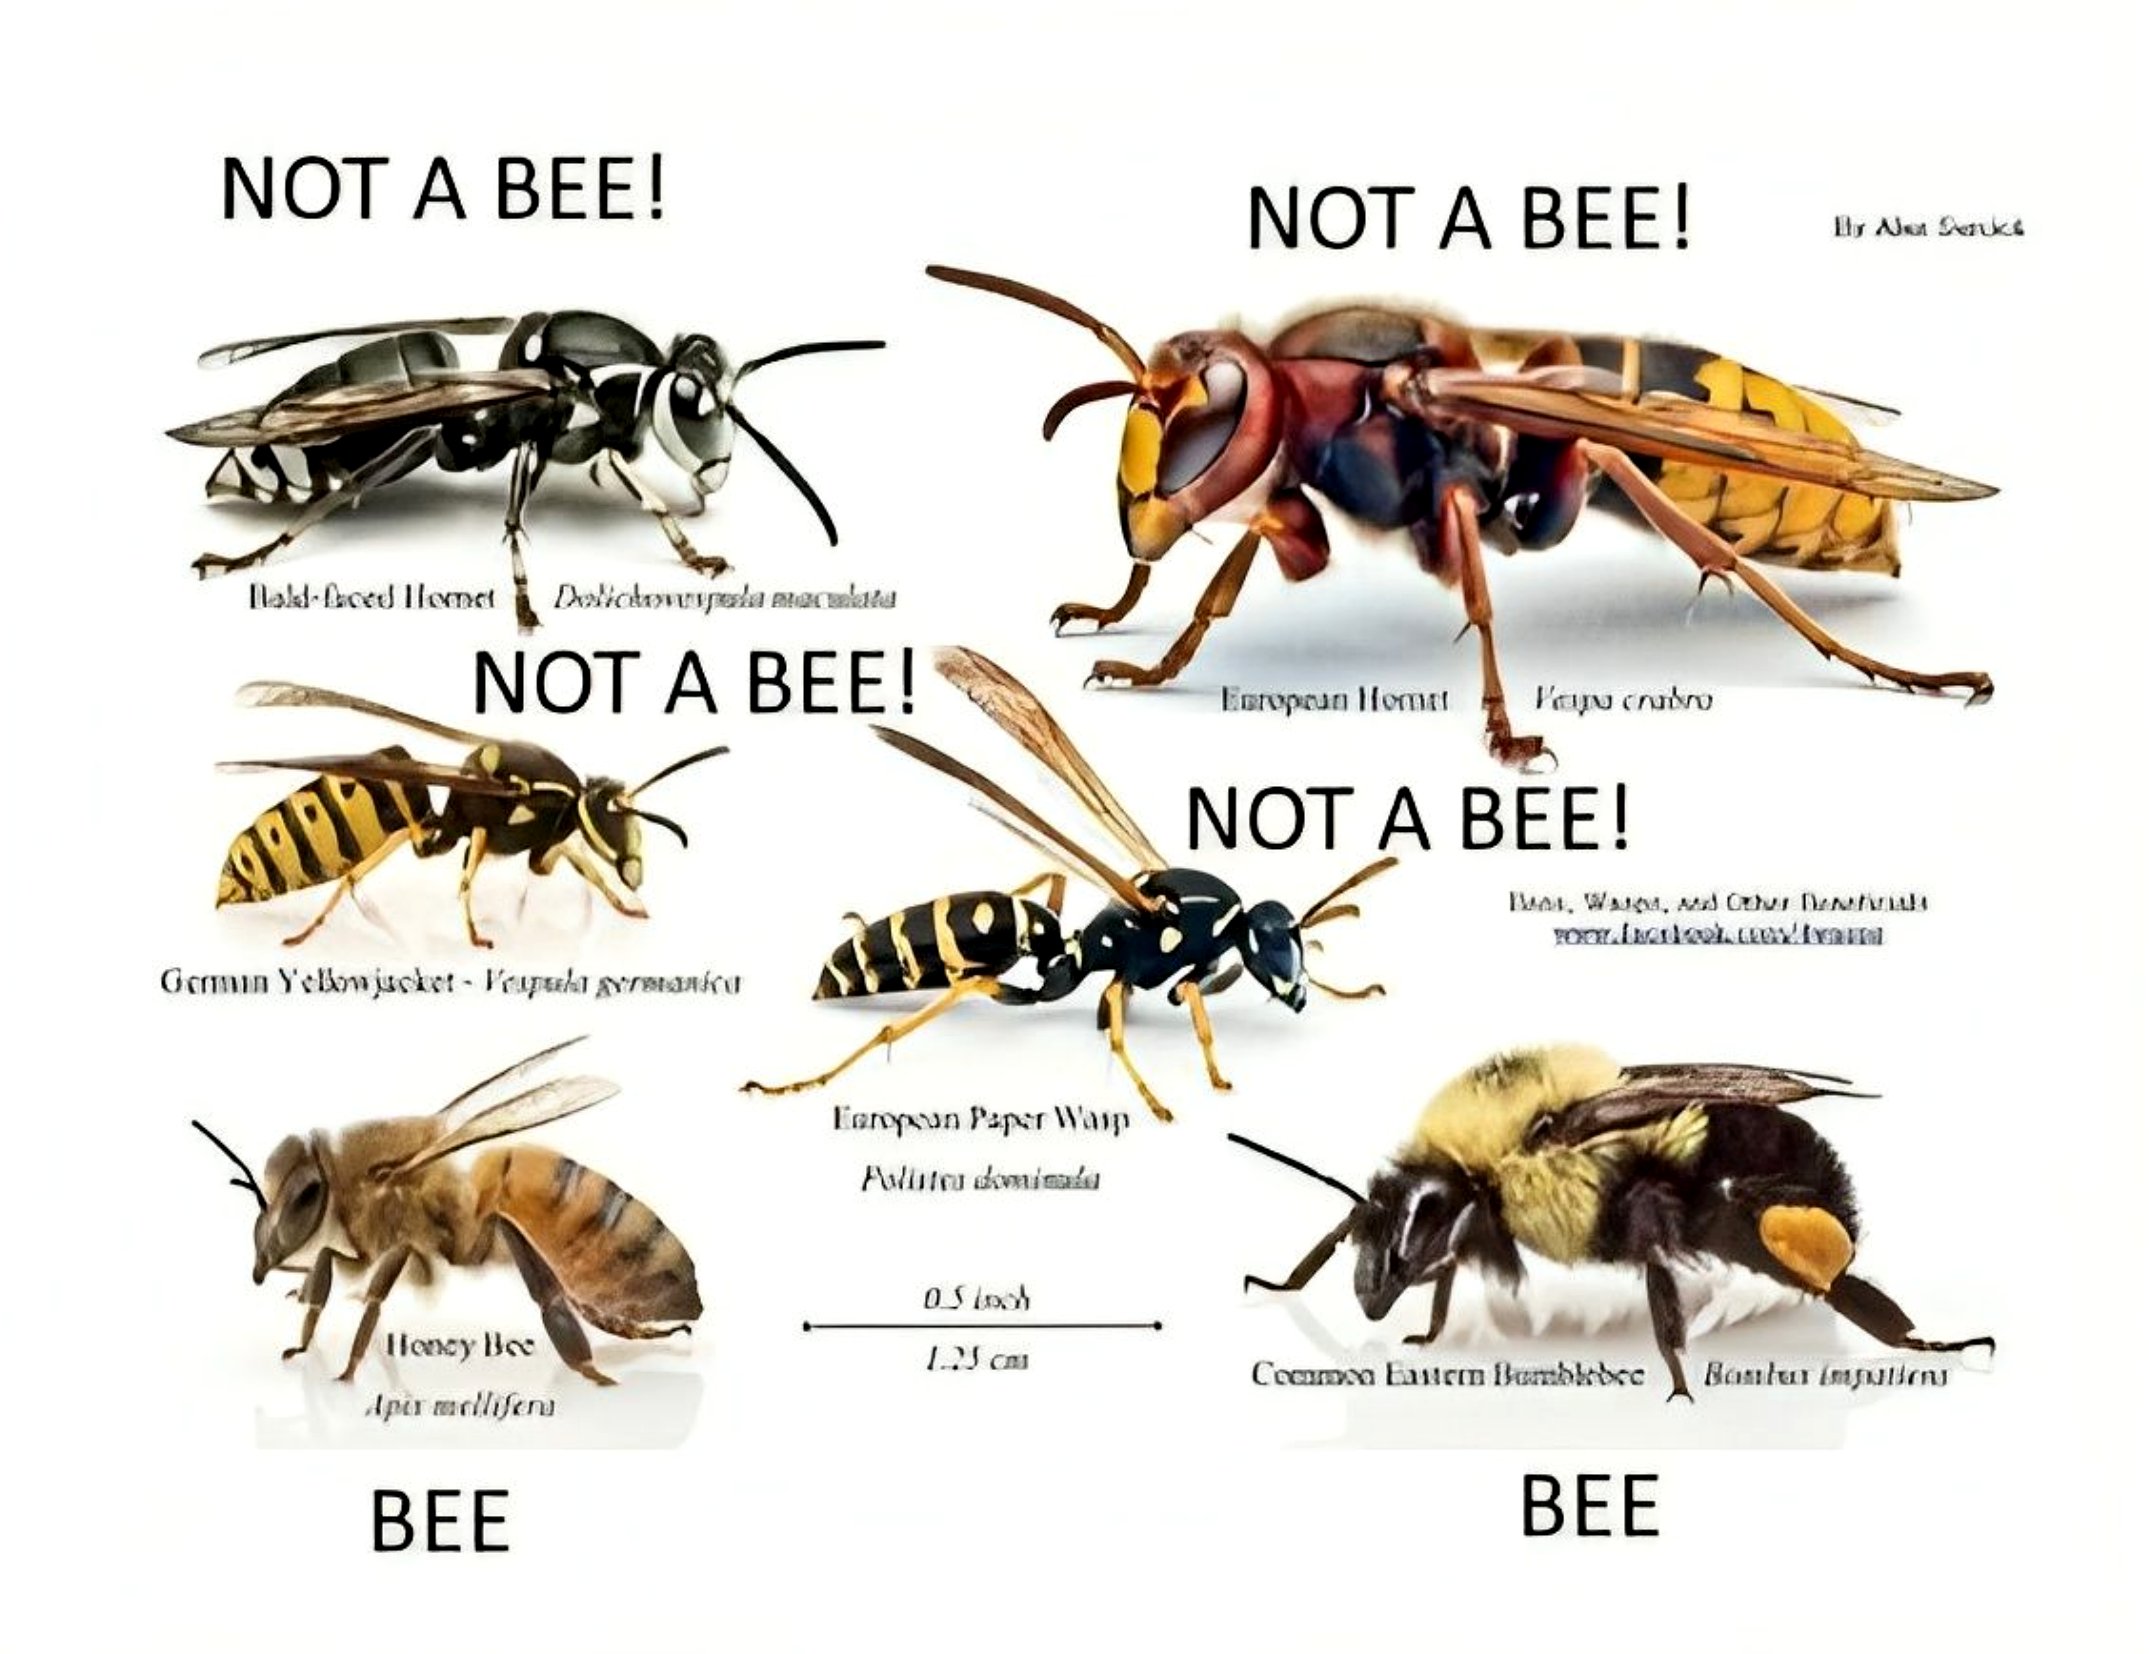
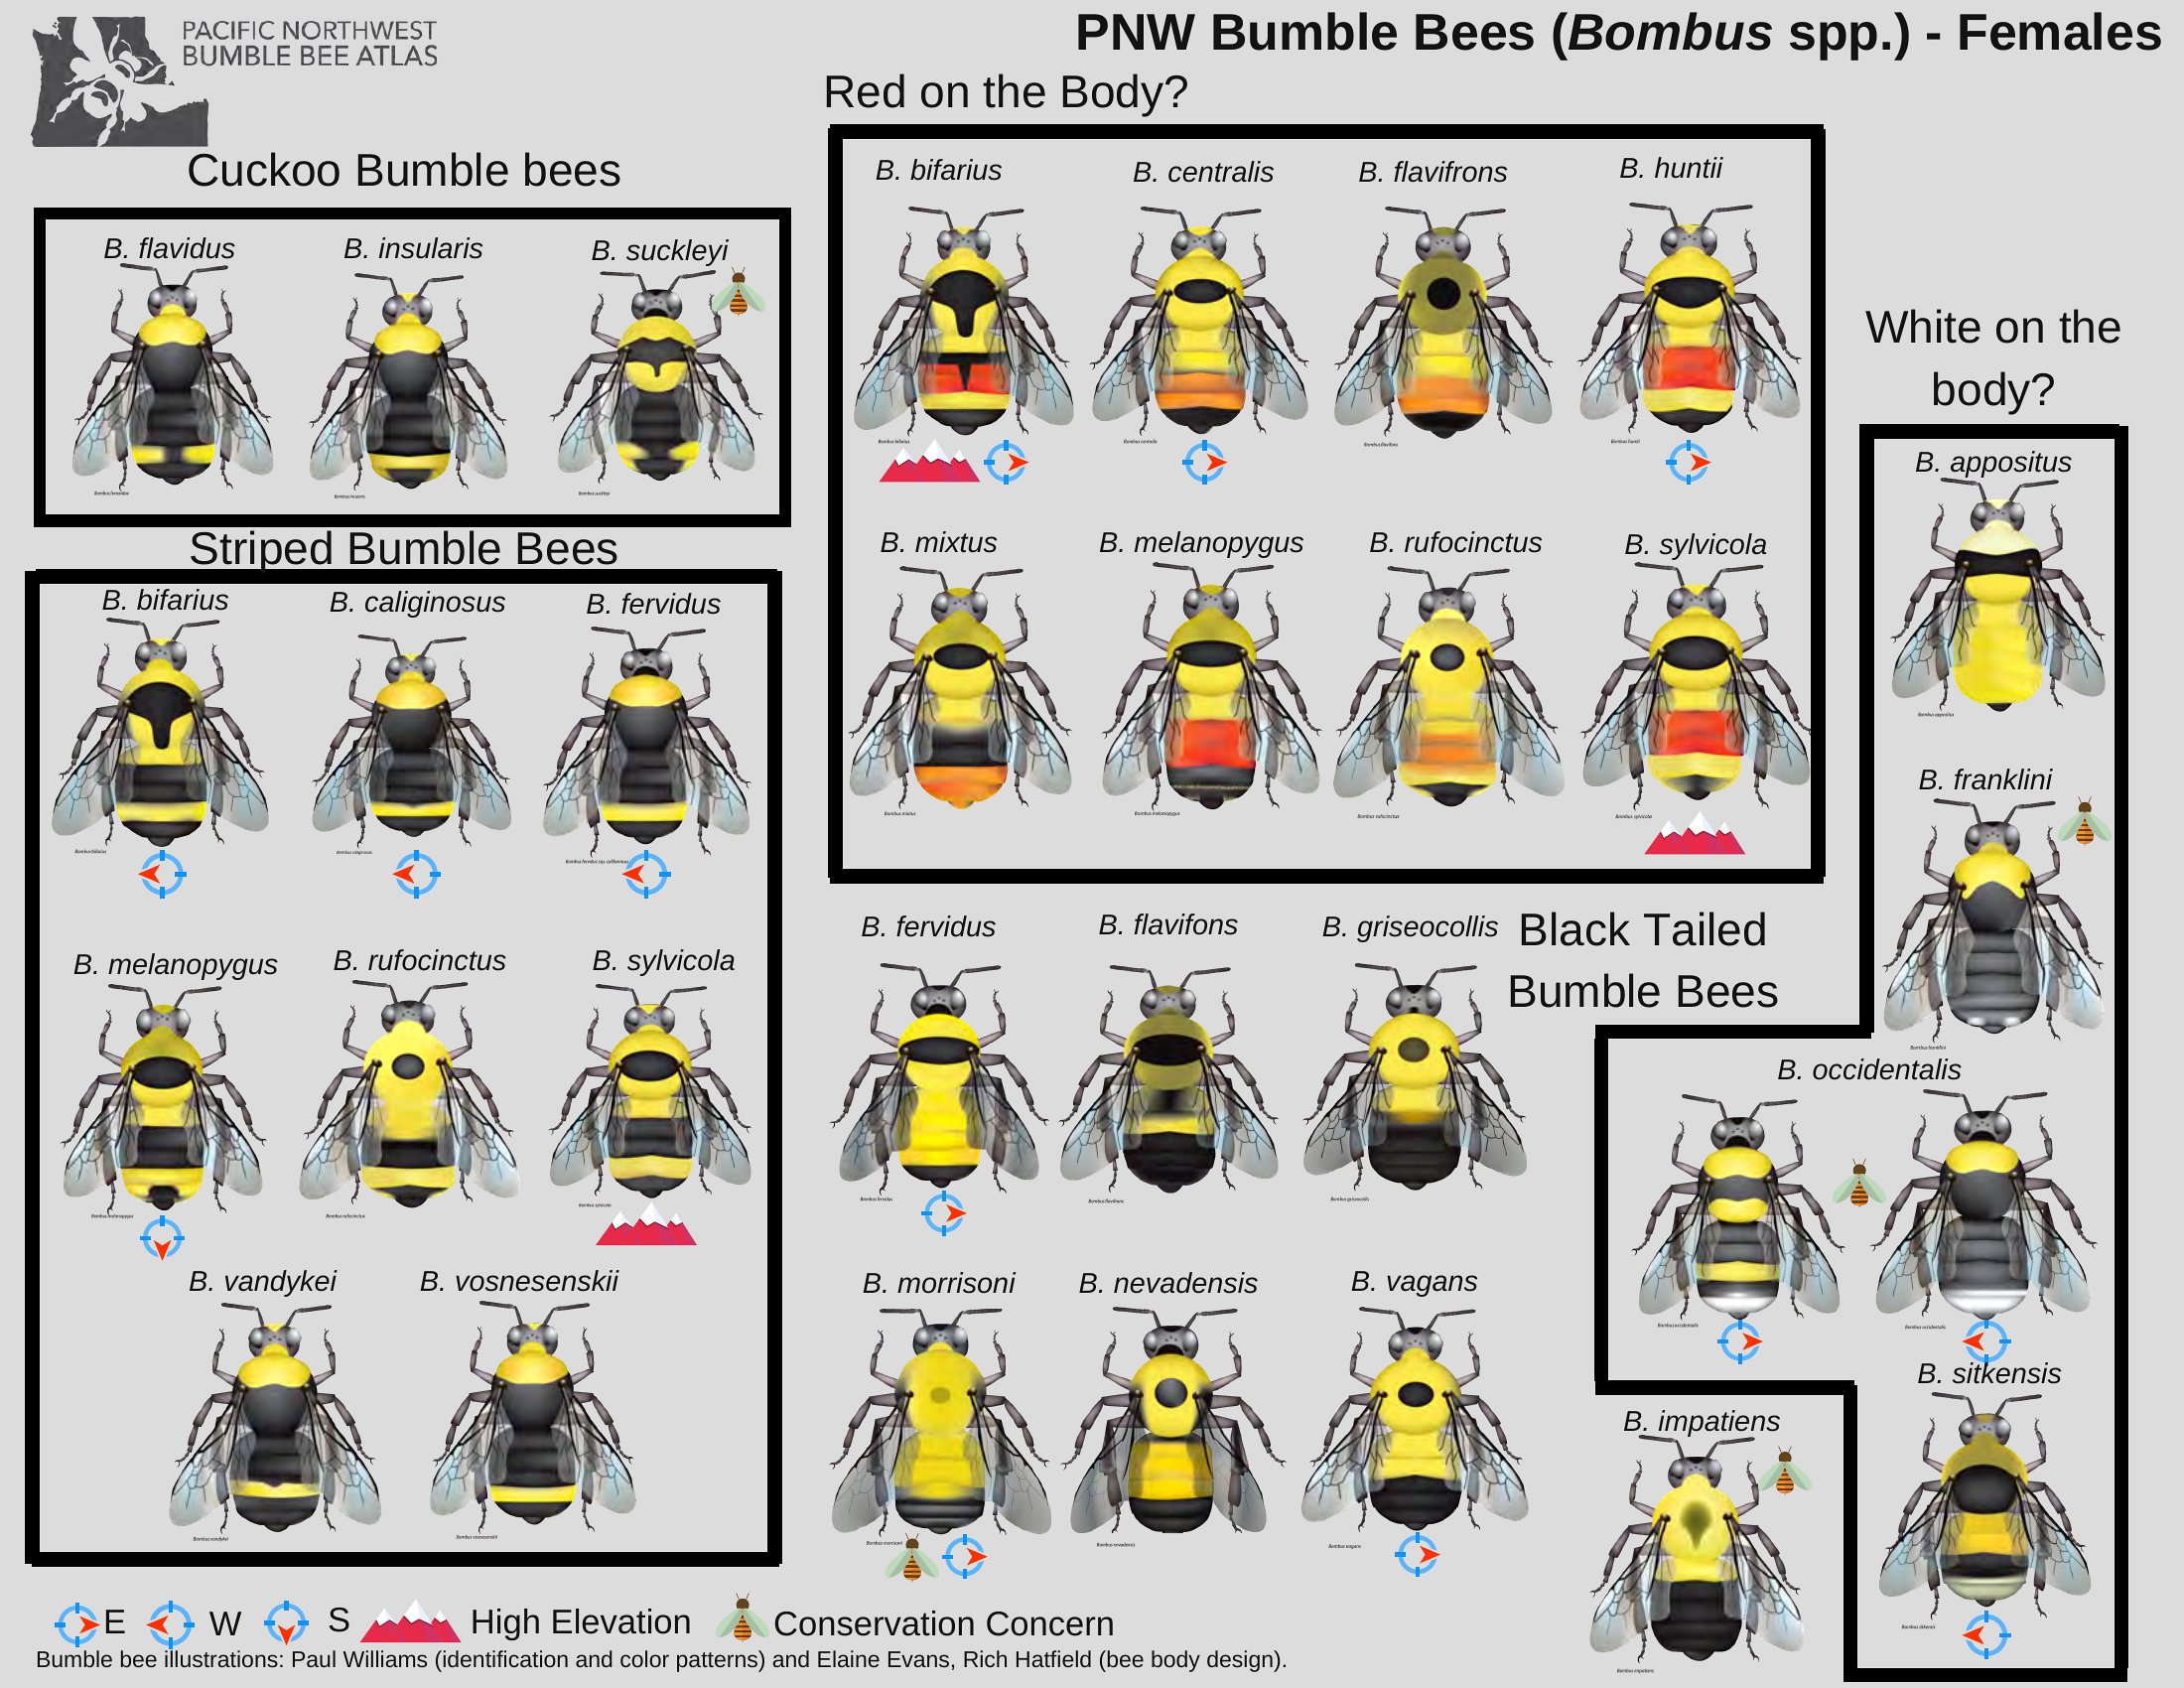
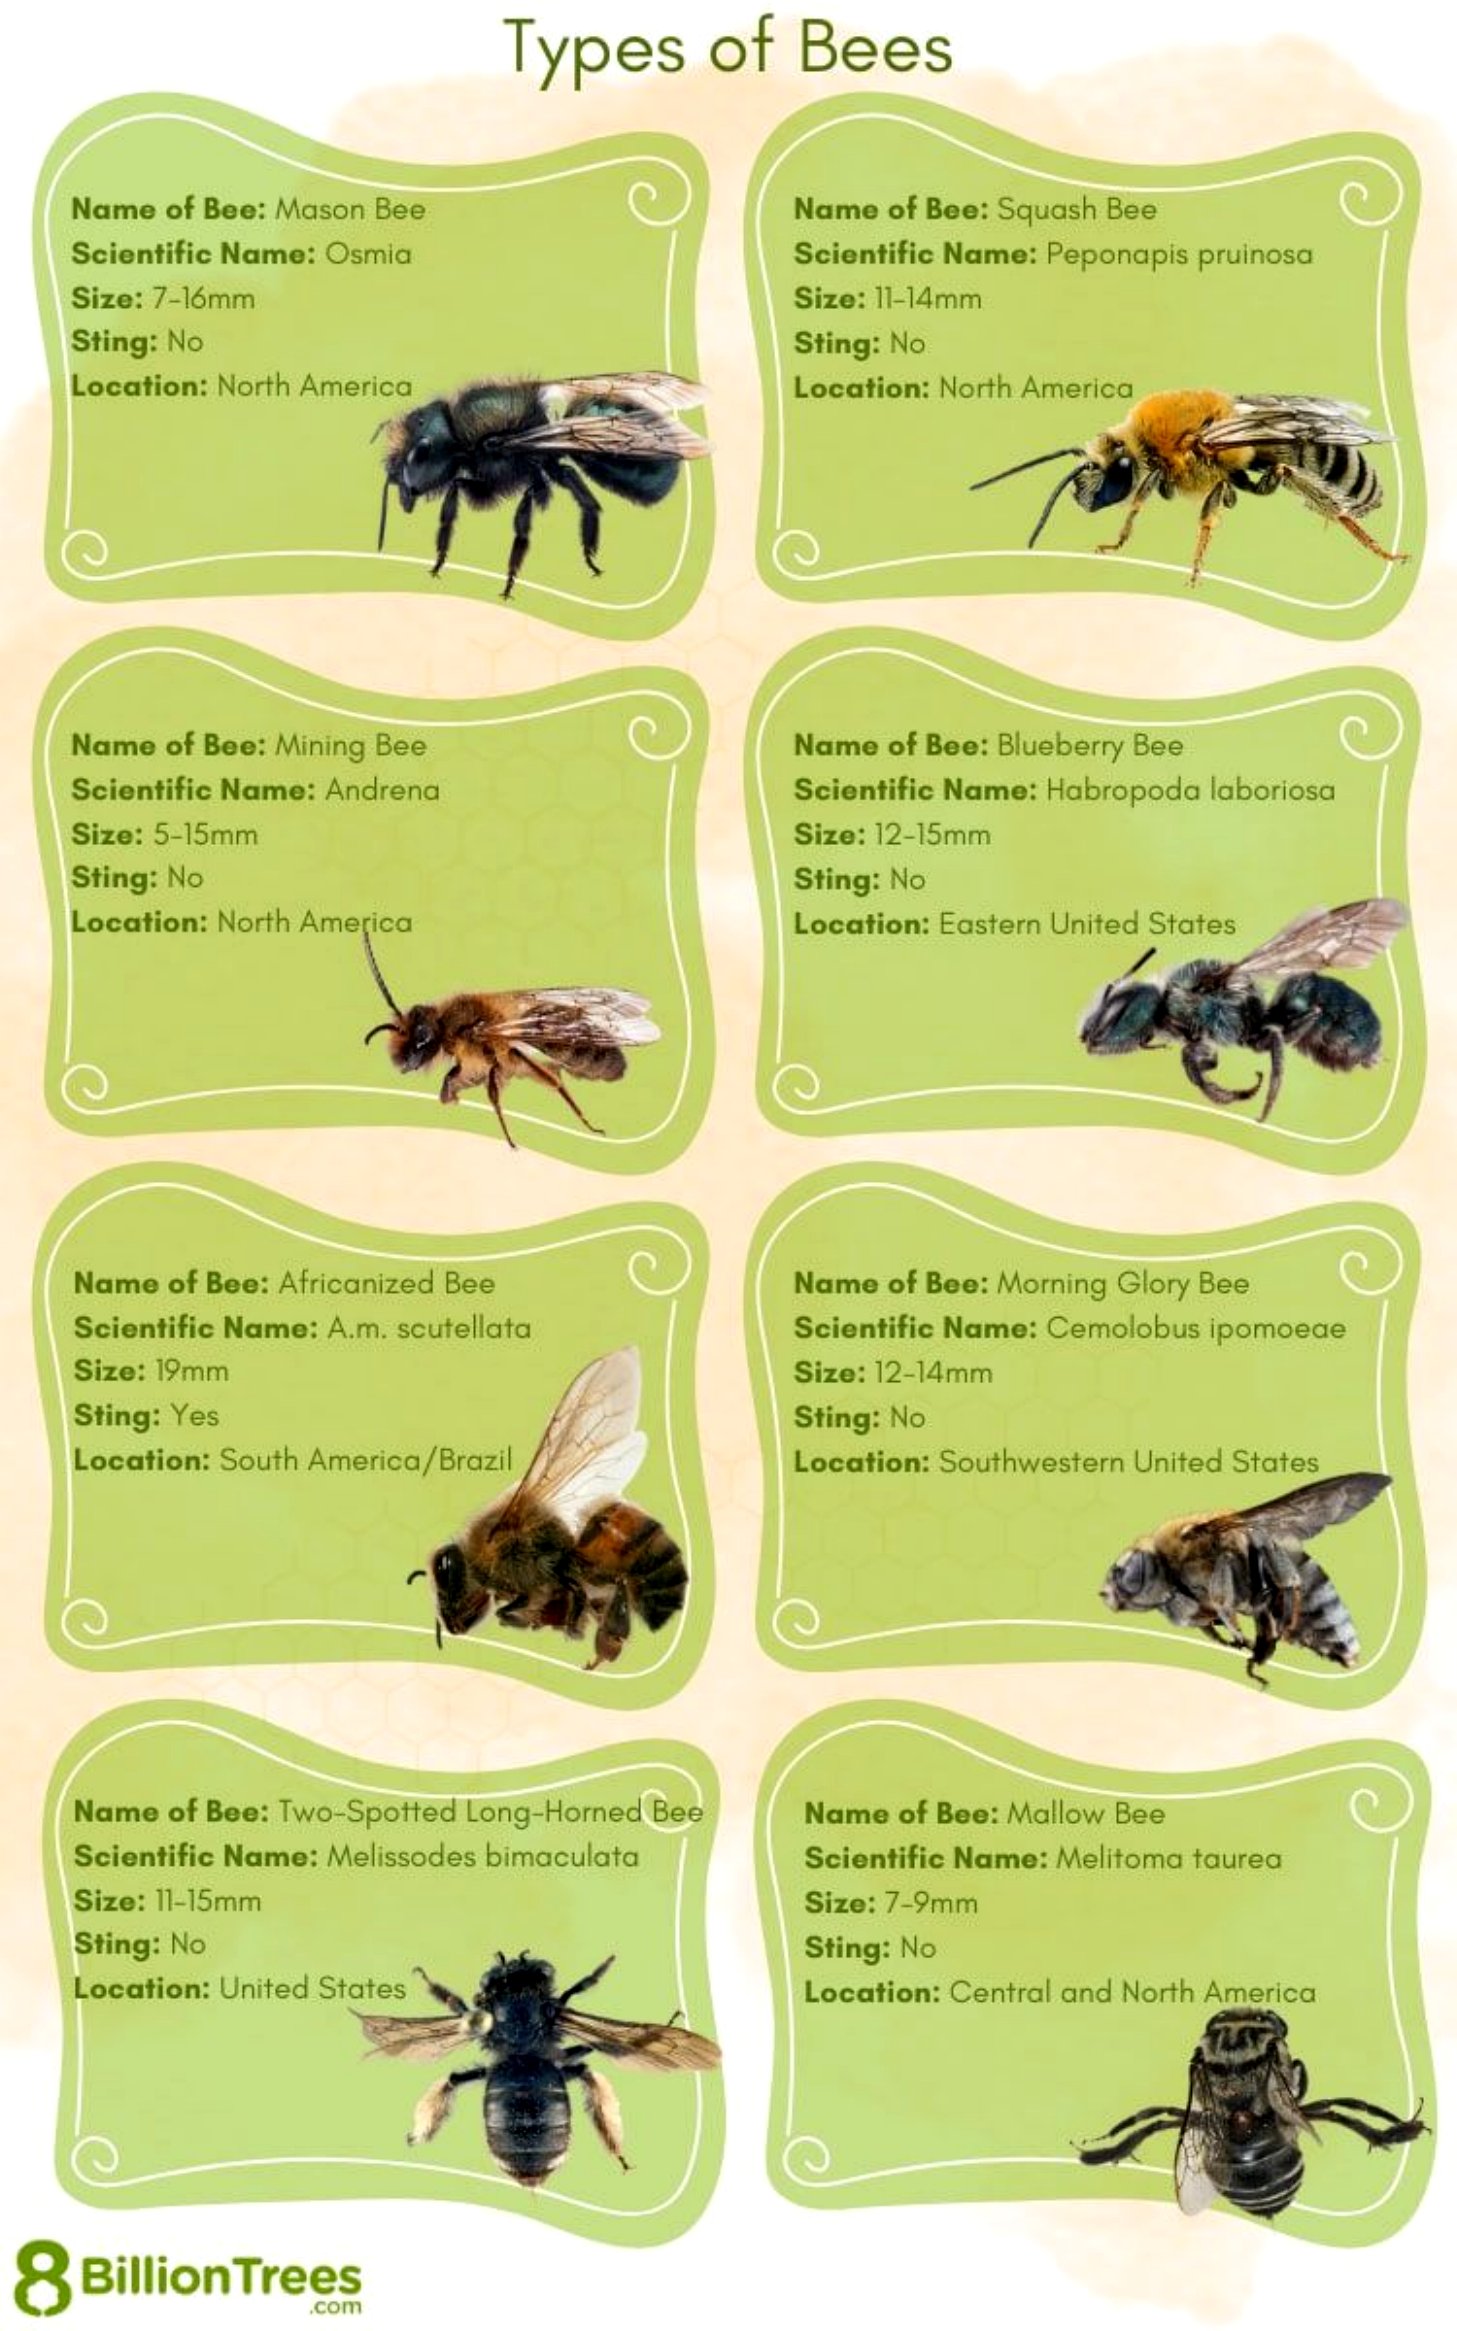
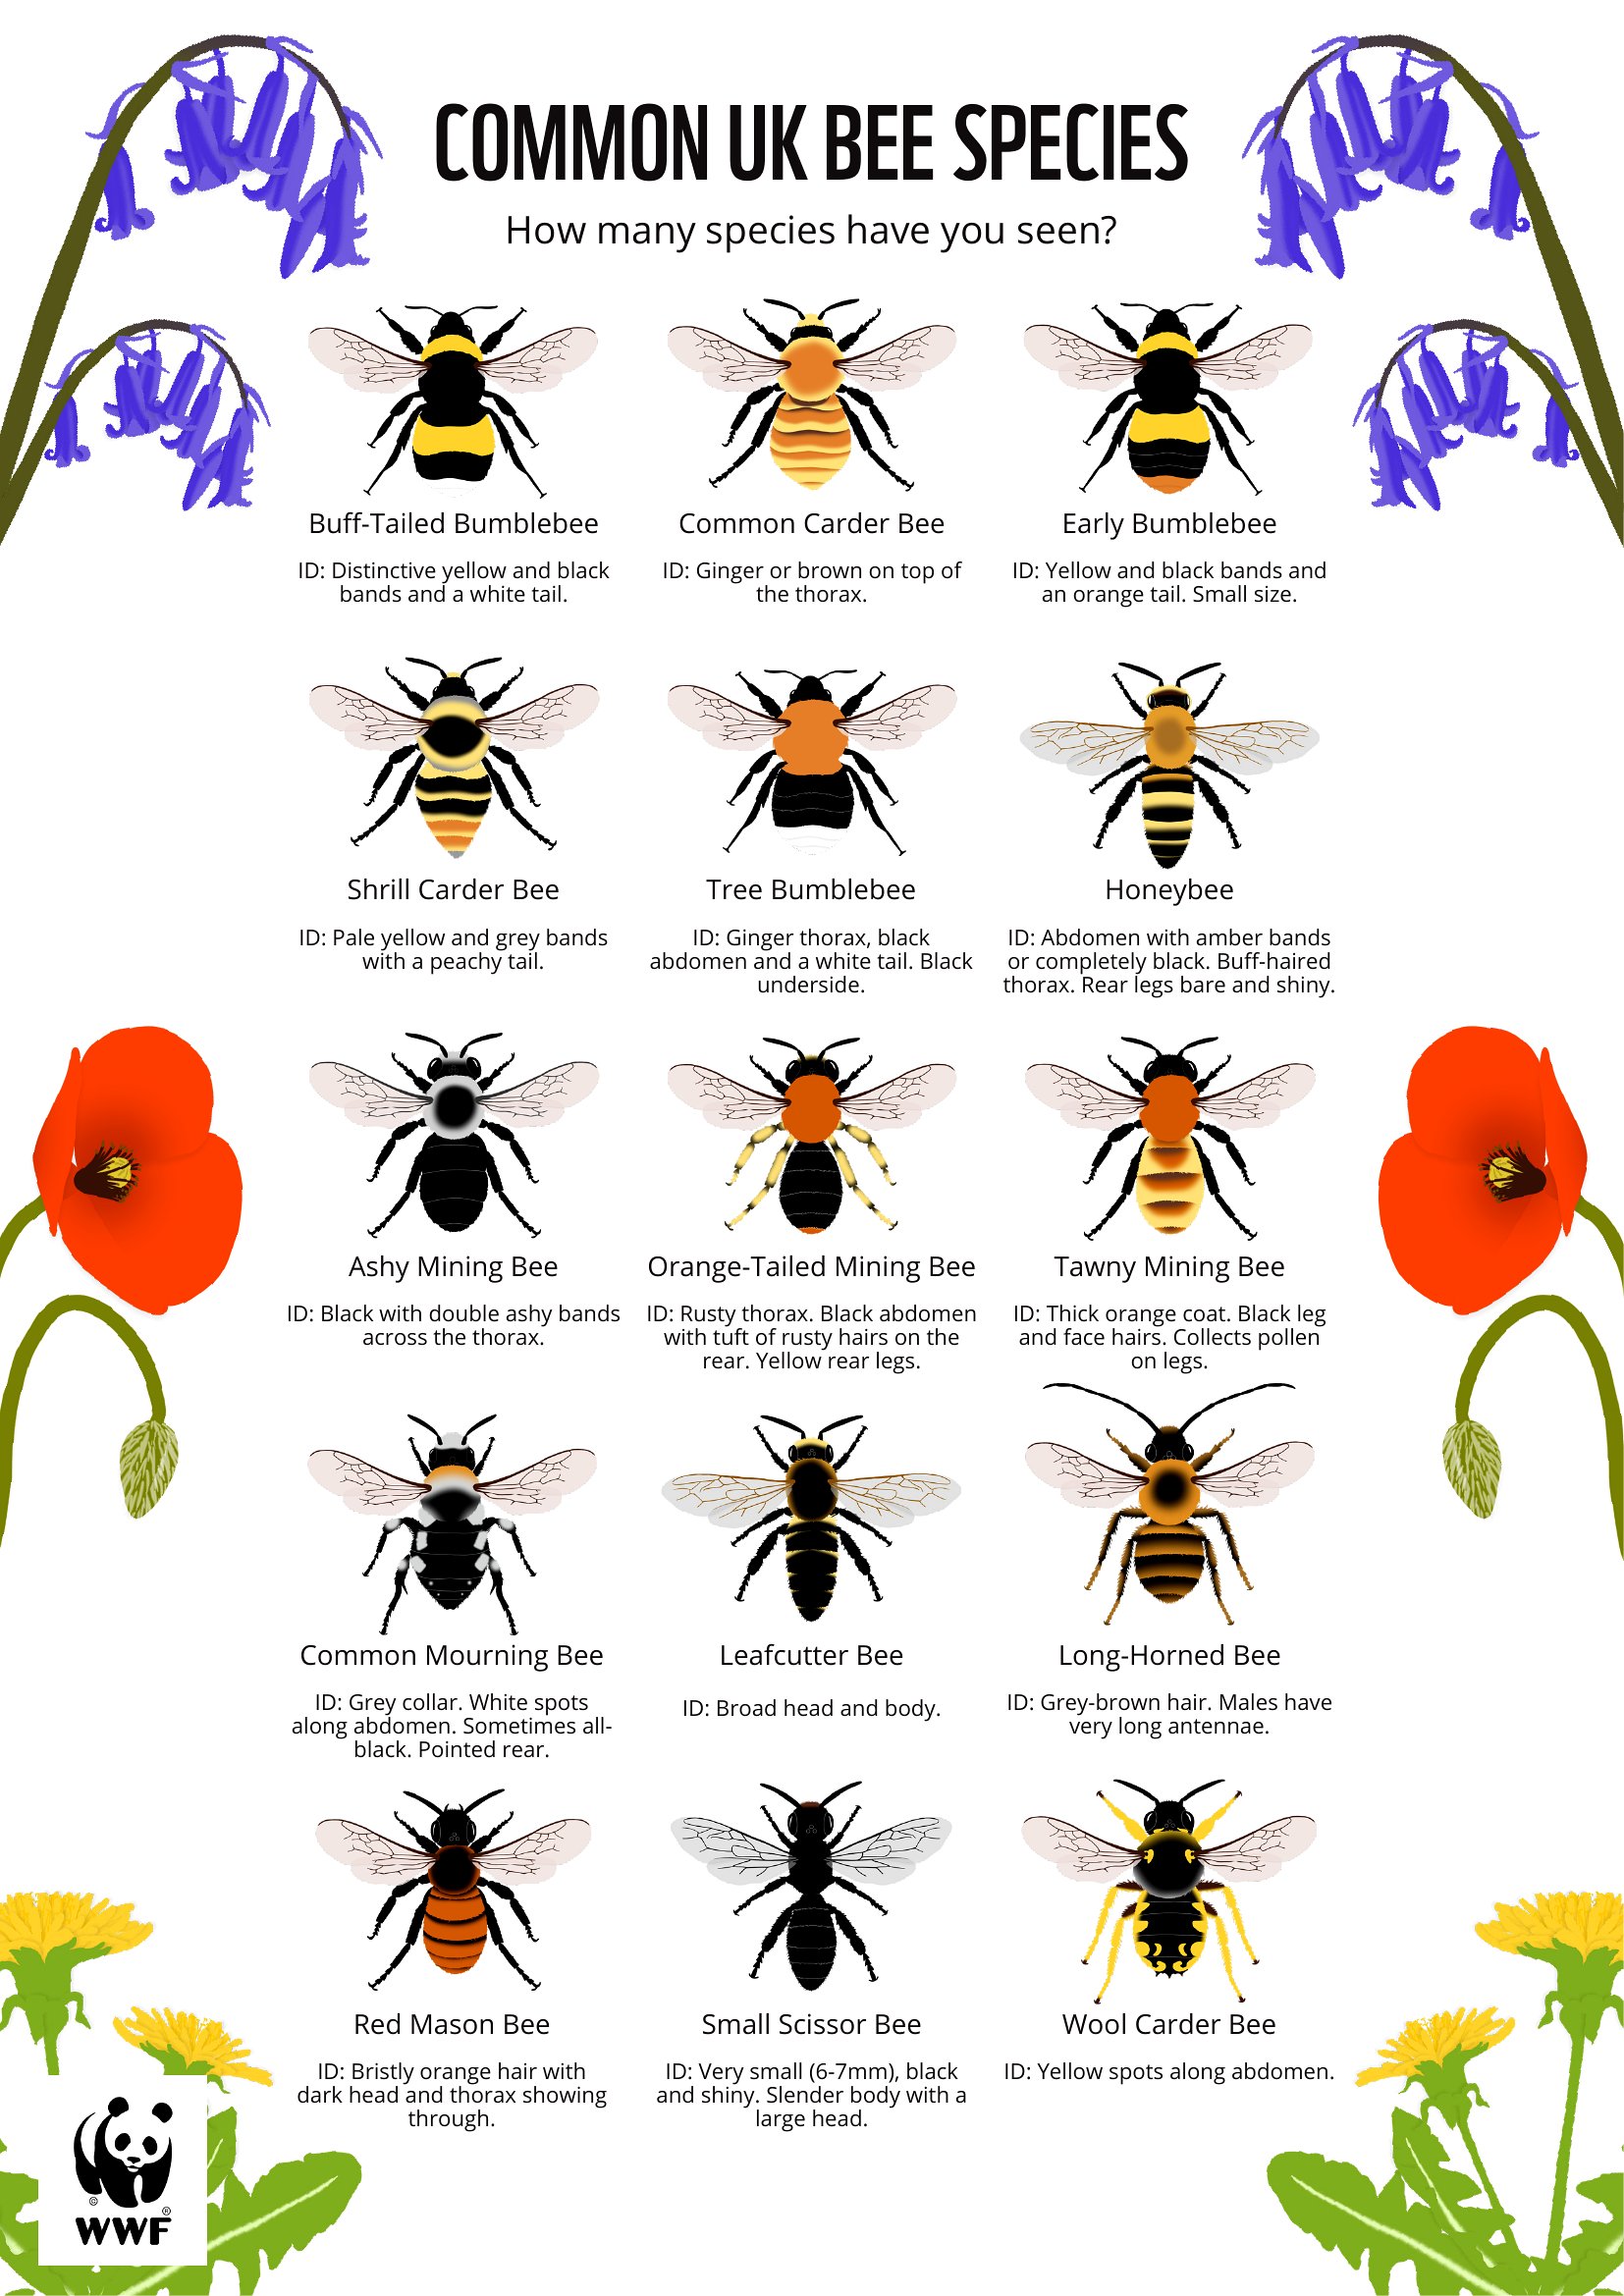
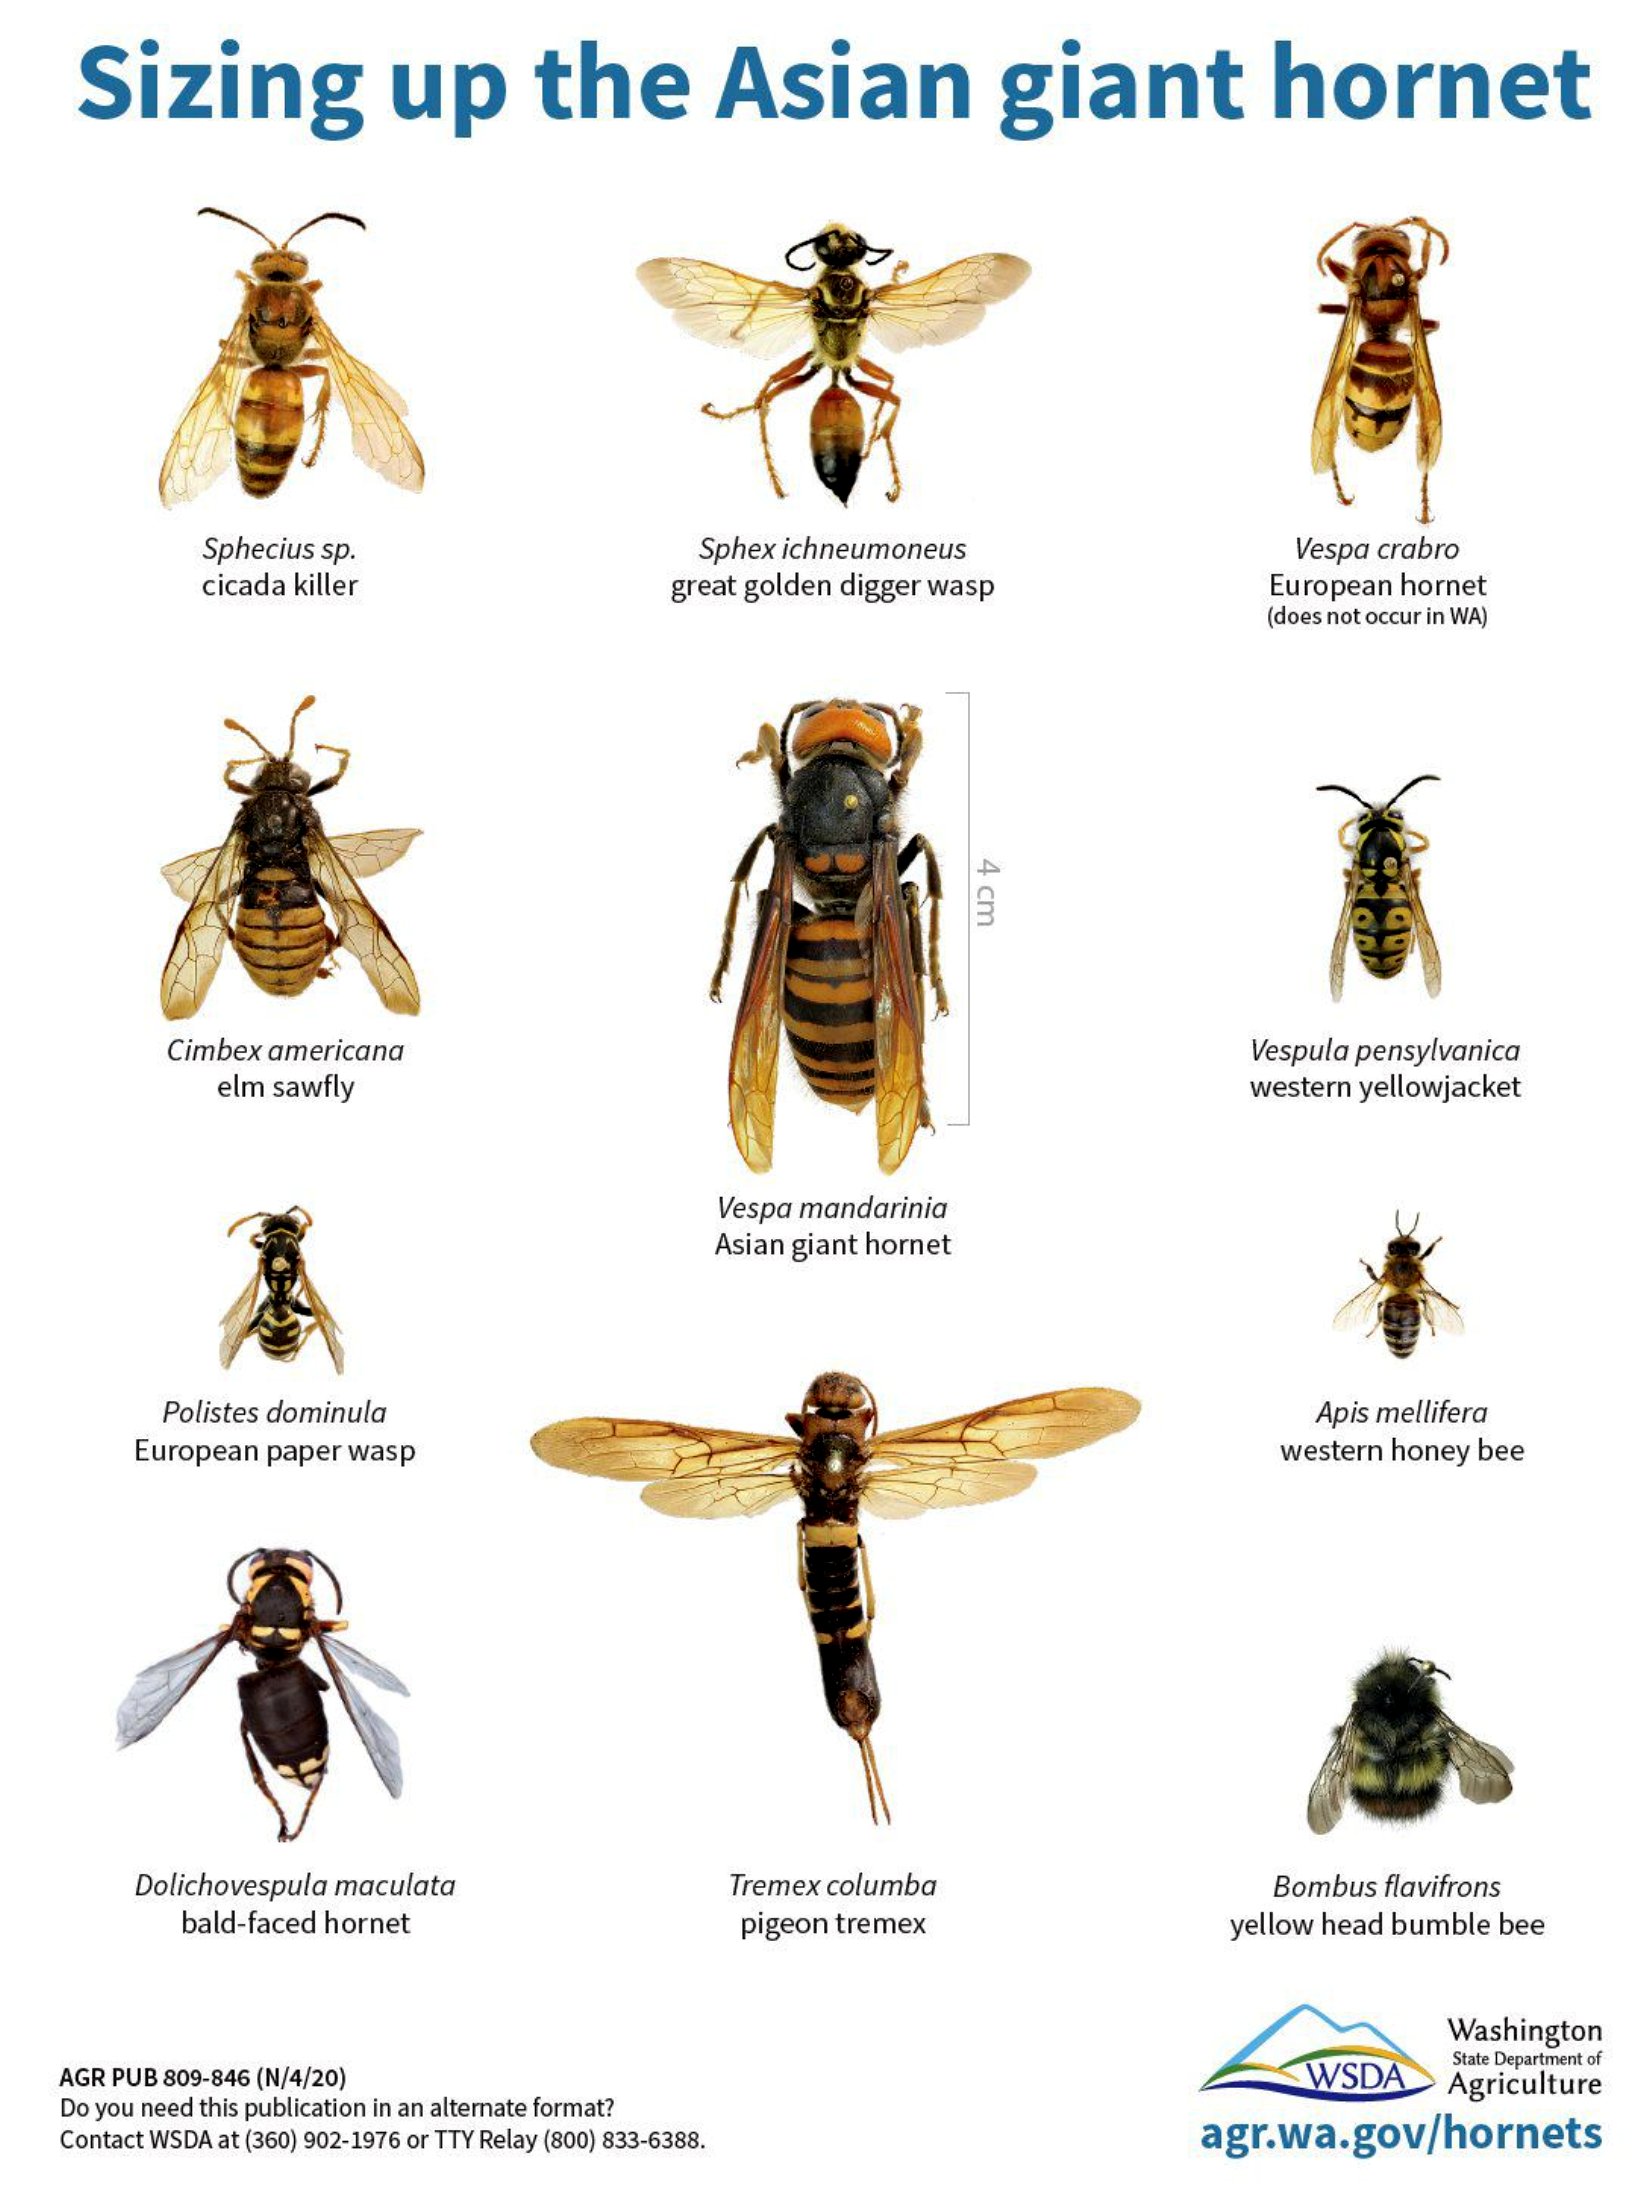
Each chart includes side-by-side comparisons of key features like body shape, color patterns, wing venation, and size ratios. For example, honeybees are shown with their distinctive golden bands, while bumblebees highlight fuzzy legs and rounded abdomens. These details help even beginners make accurate identifications in the field.
Can these charts help identify bees that aren’t native to my region?
While the charts focus on common species found in North America and Europe, the visual comparison format works for any bee. If you’re unsure about a local species, use the chart’s structure to note unique traits (like stripe patterns or body hair) and cross-reference with regional field guides for confirmation.
Are these charts useful for tracking seasonal changes in bee activity?
Yes, many charts include notes on typical flight seasons or behaviors, such as early spring bumblebees or late-summer carpenter bees. You can print multiple charts and annotate them with dates to monitor which species appear at different times of year in your area.
Comments
Join the conversation
Sign in to share your thoughts and leave a comment on this resource.