Skip to content
50% off this one-time $1.99 pack with HALFOFF — or unlimited with Pro.HALFOFF
Premium

Free Printable Dew Point Charts (PDF)

Data
mollywilson by mollywilson
Updated 0 downloads Quality-checked template

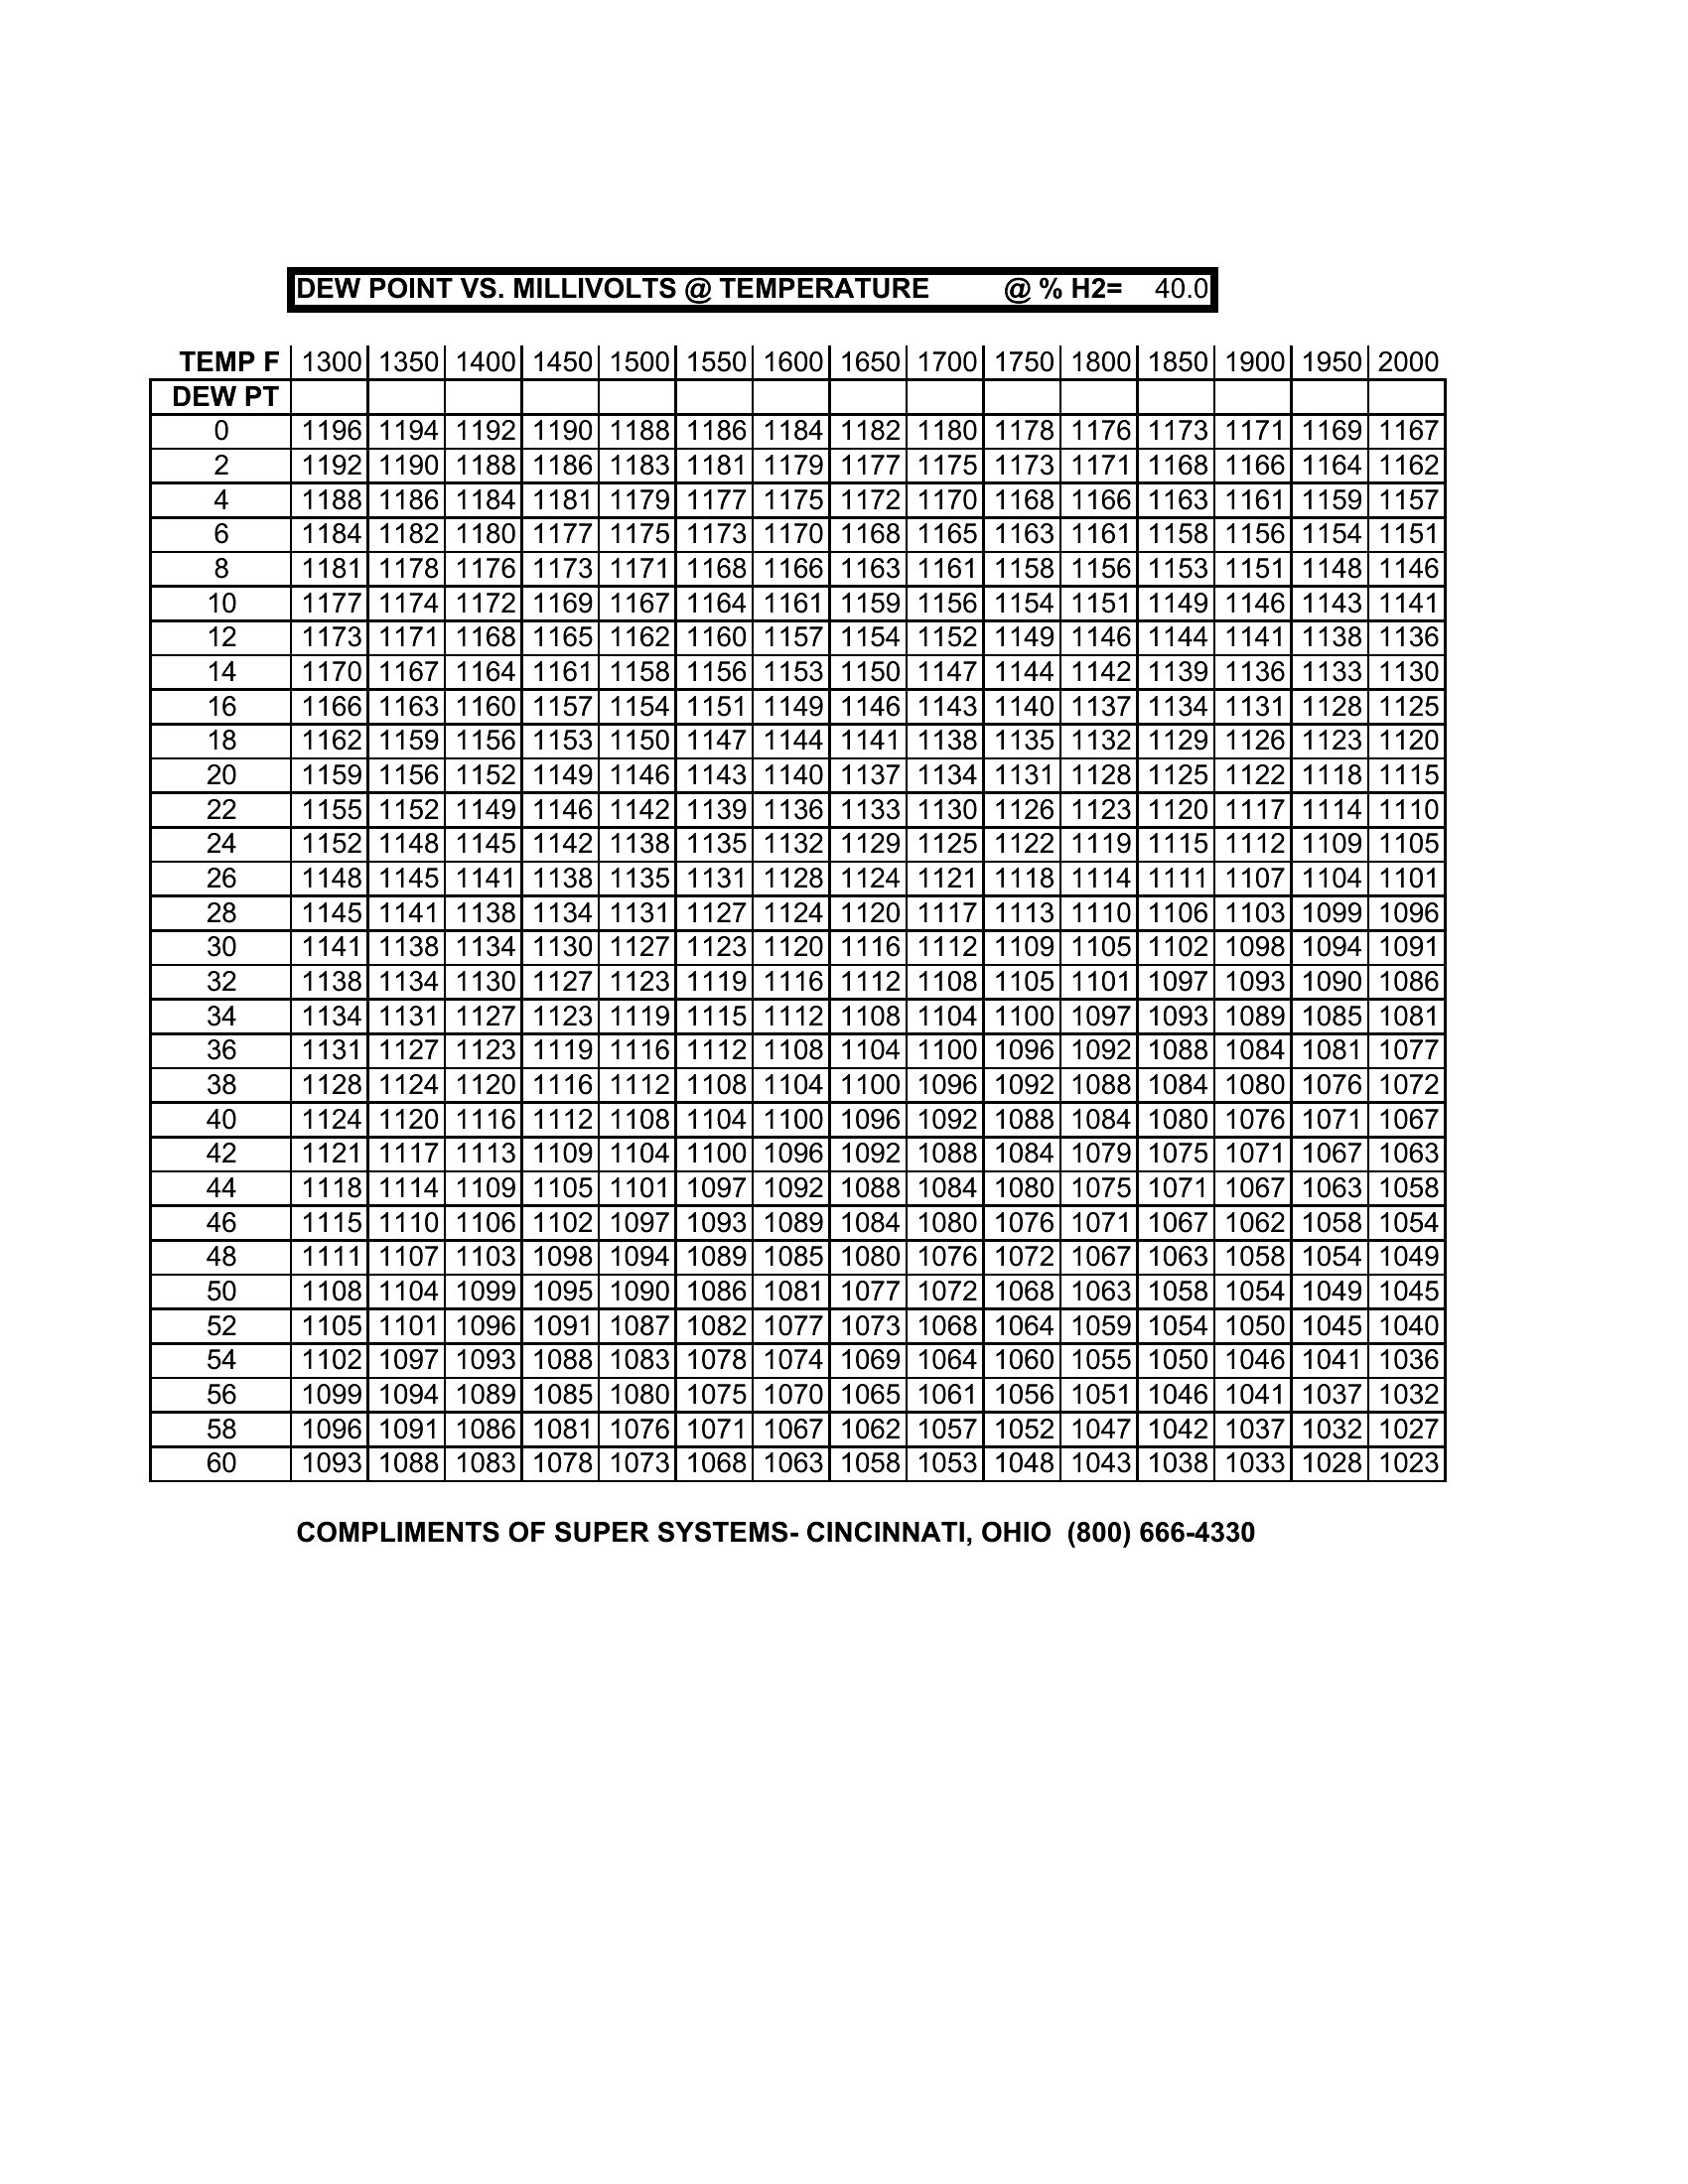
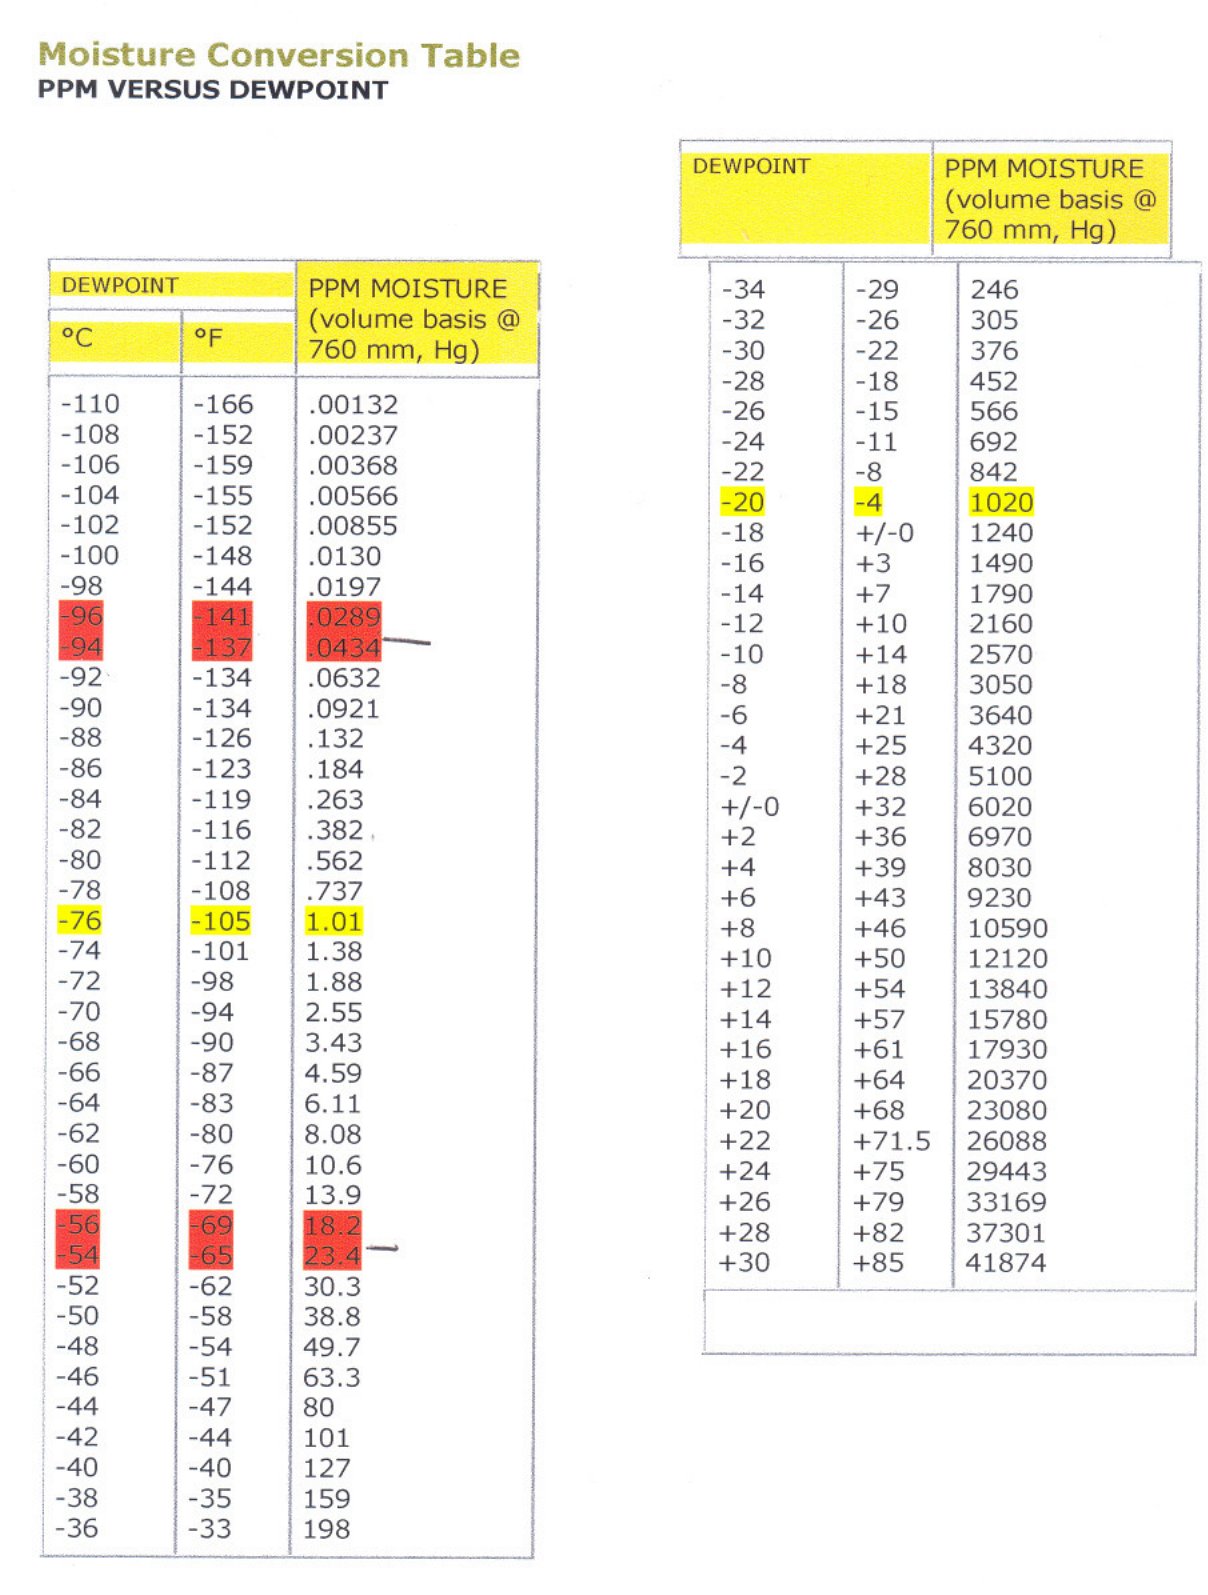
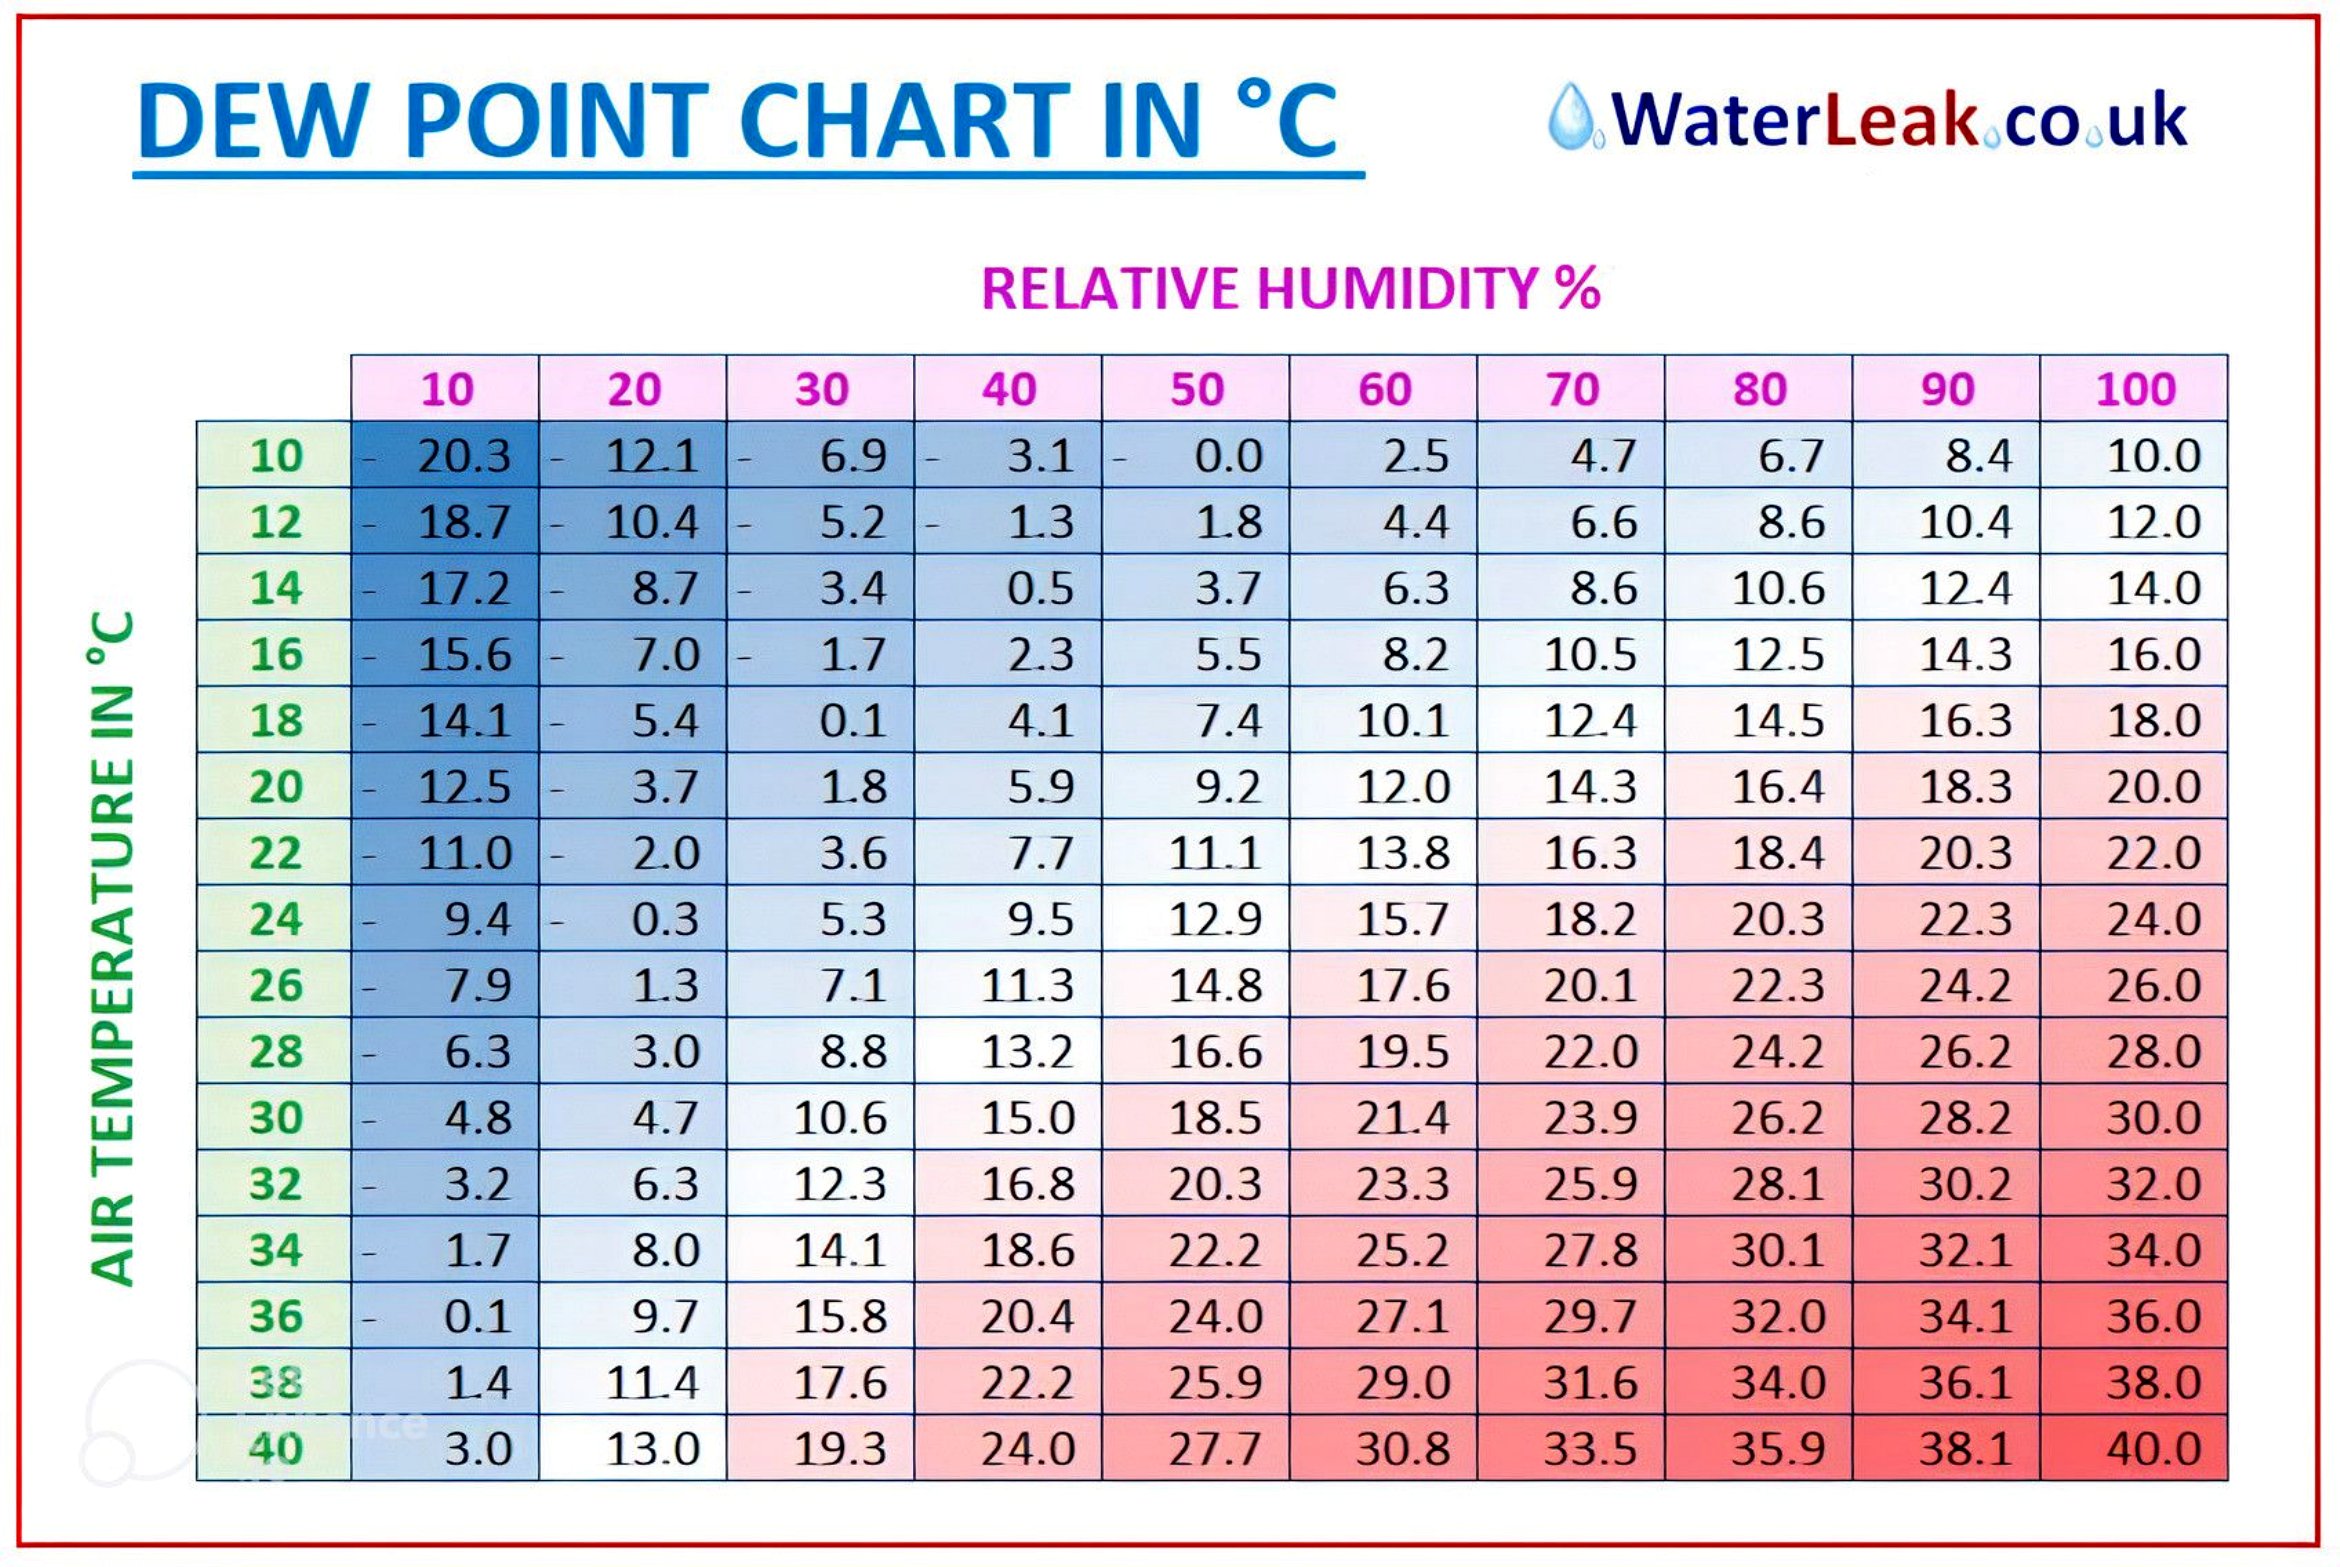
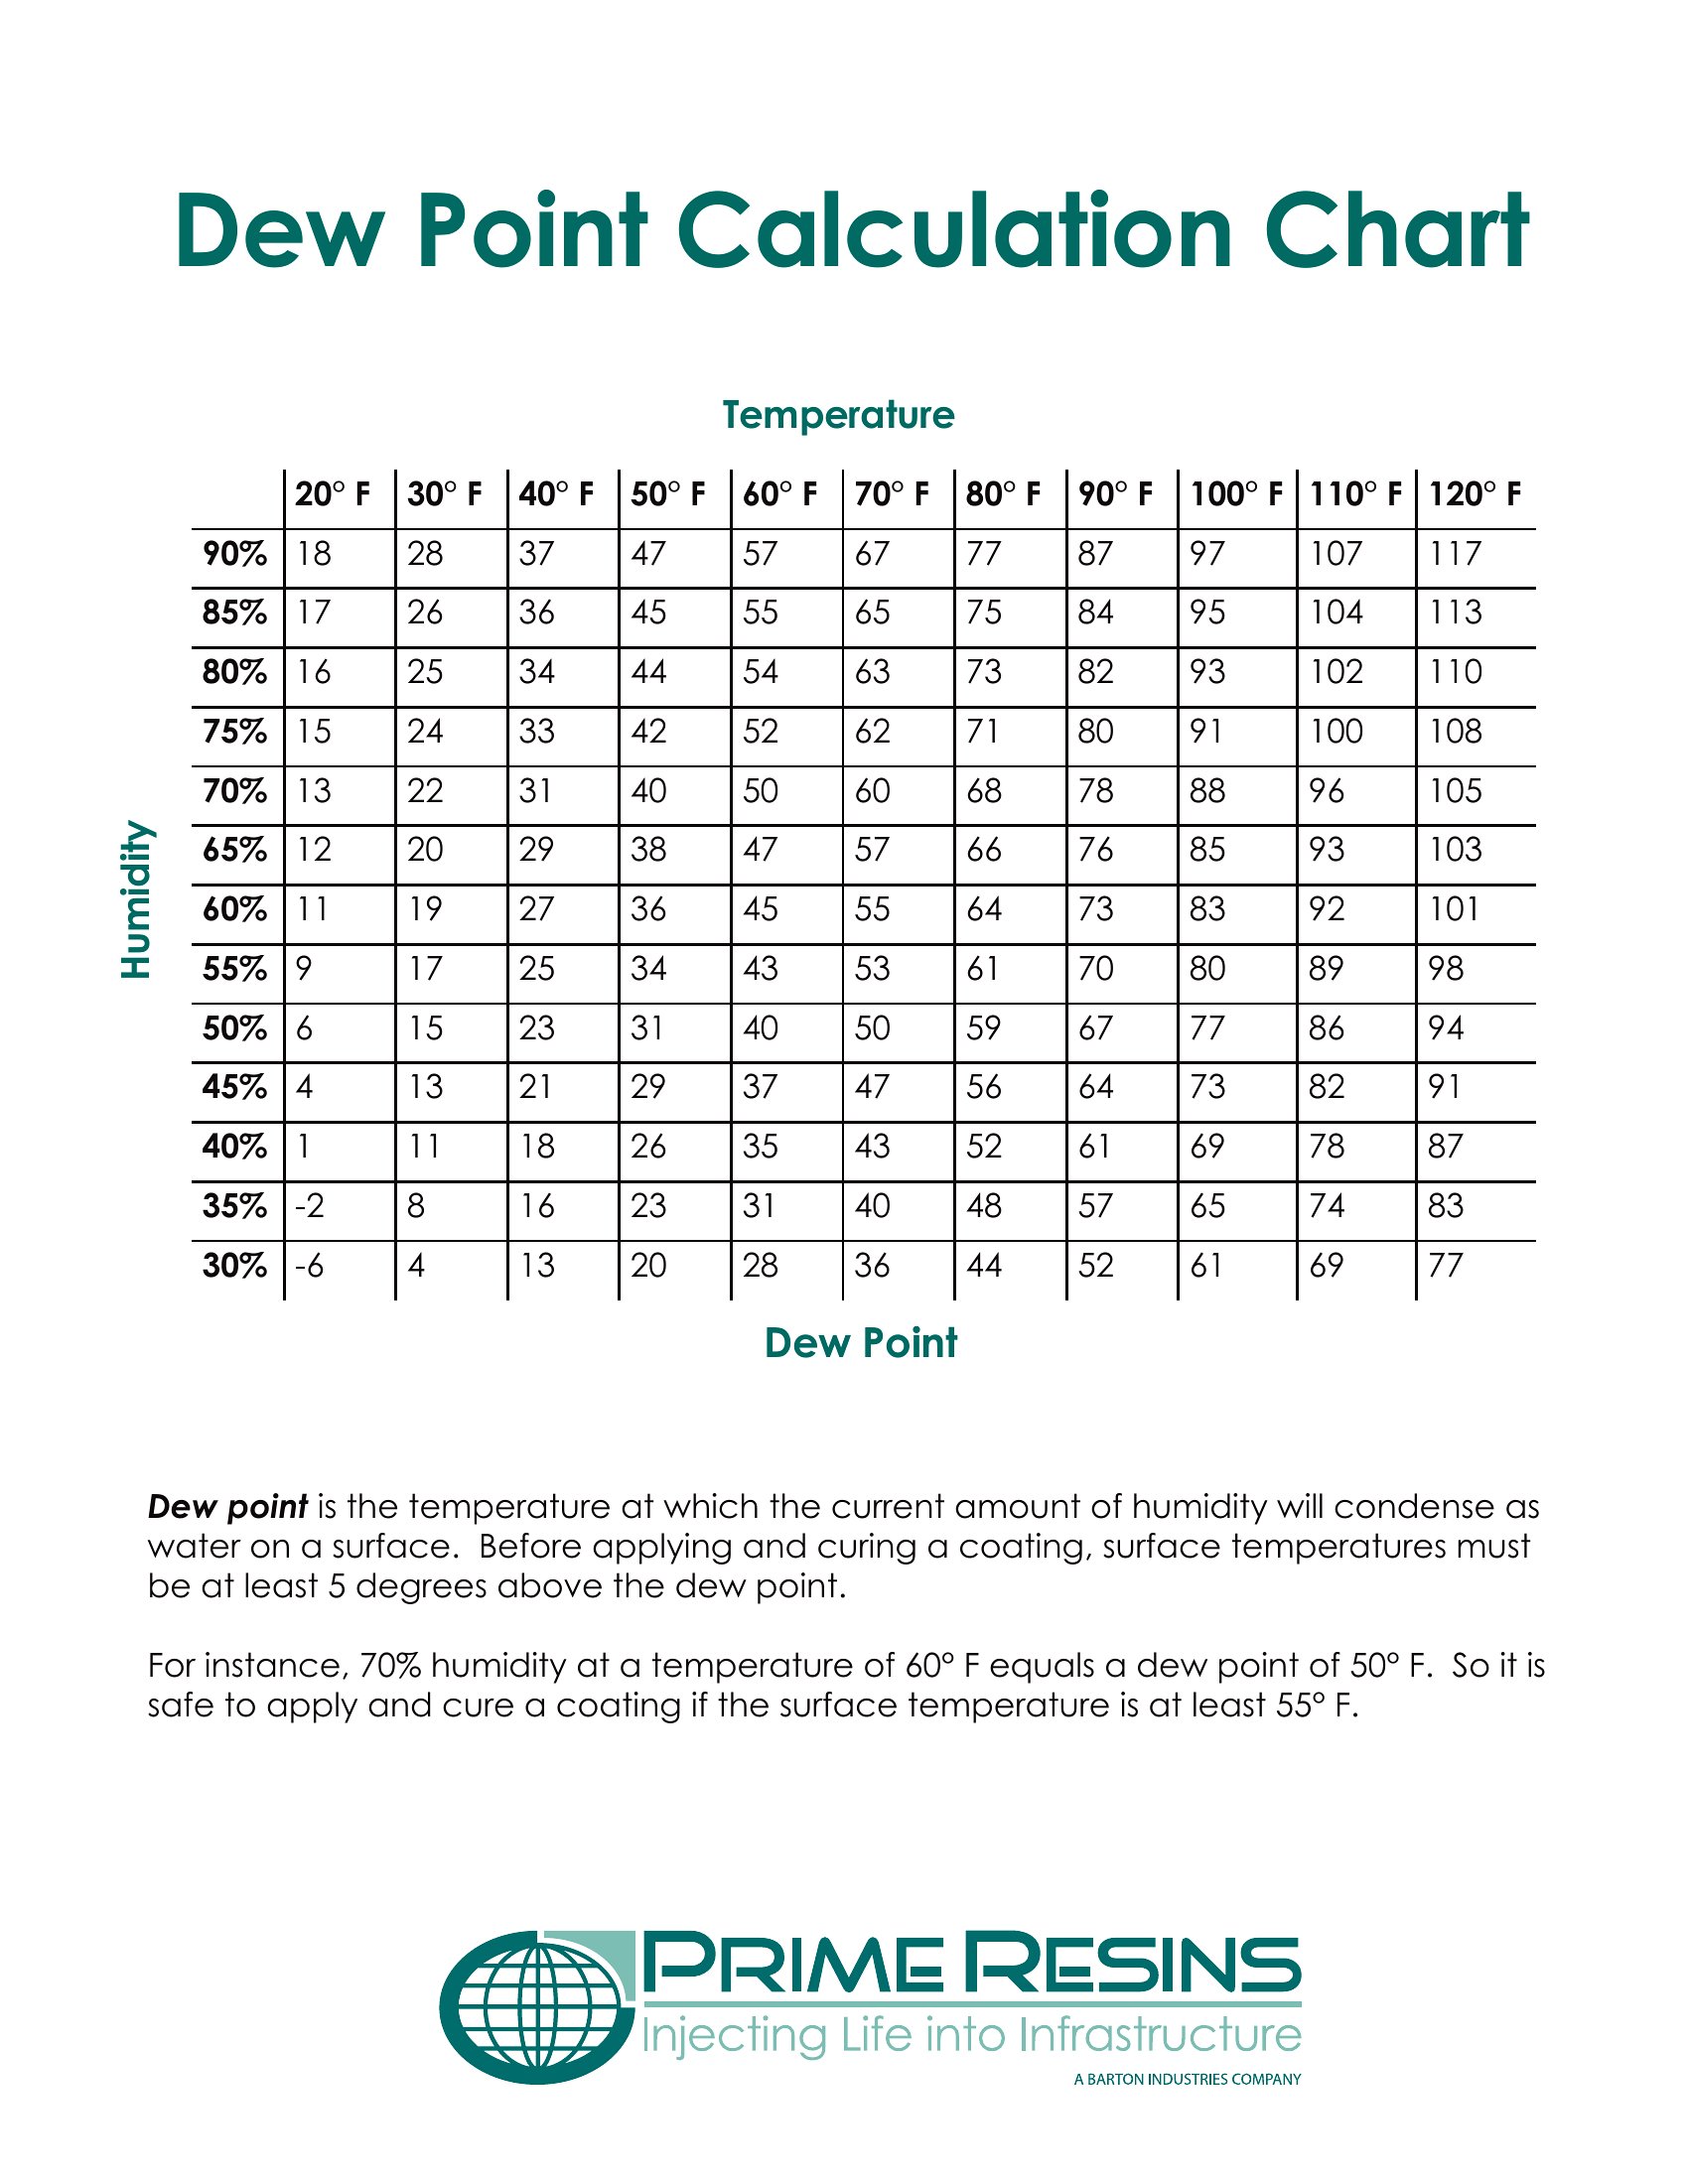
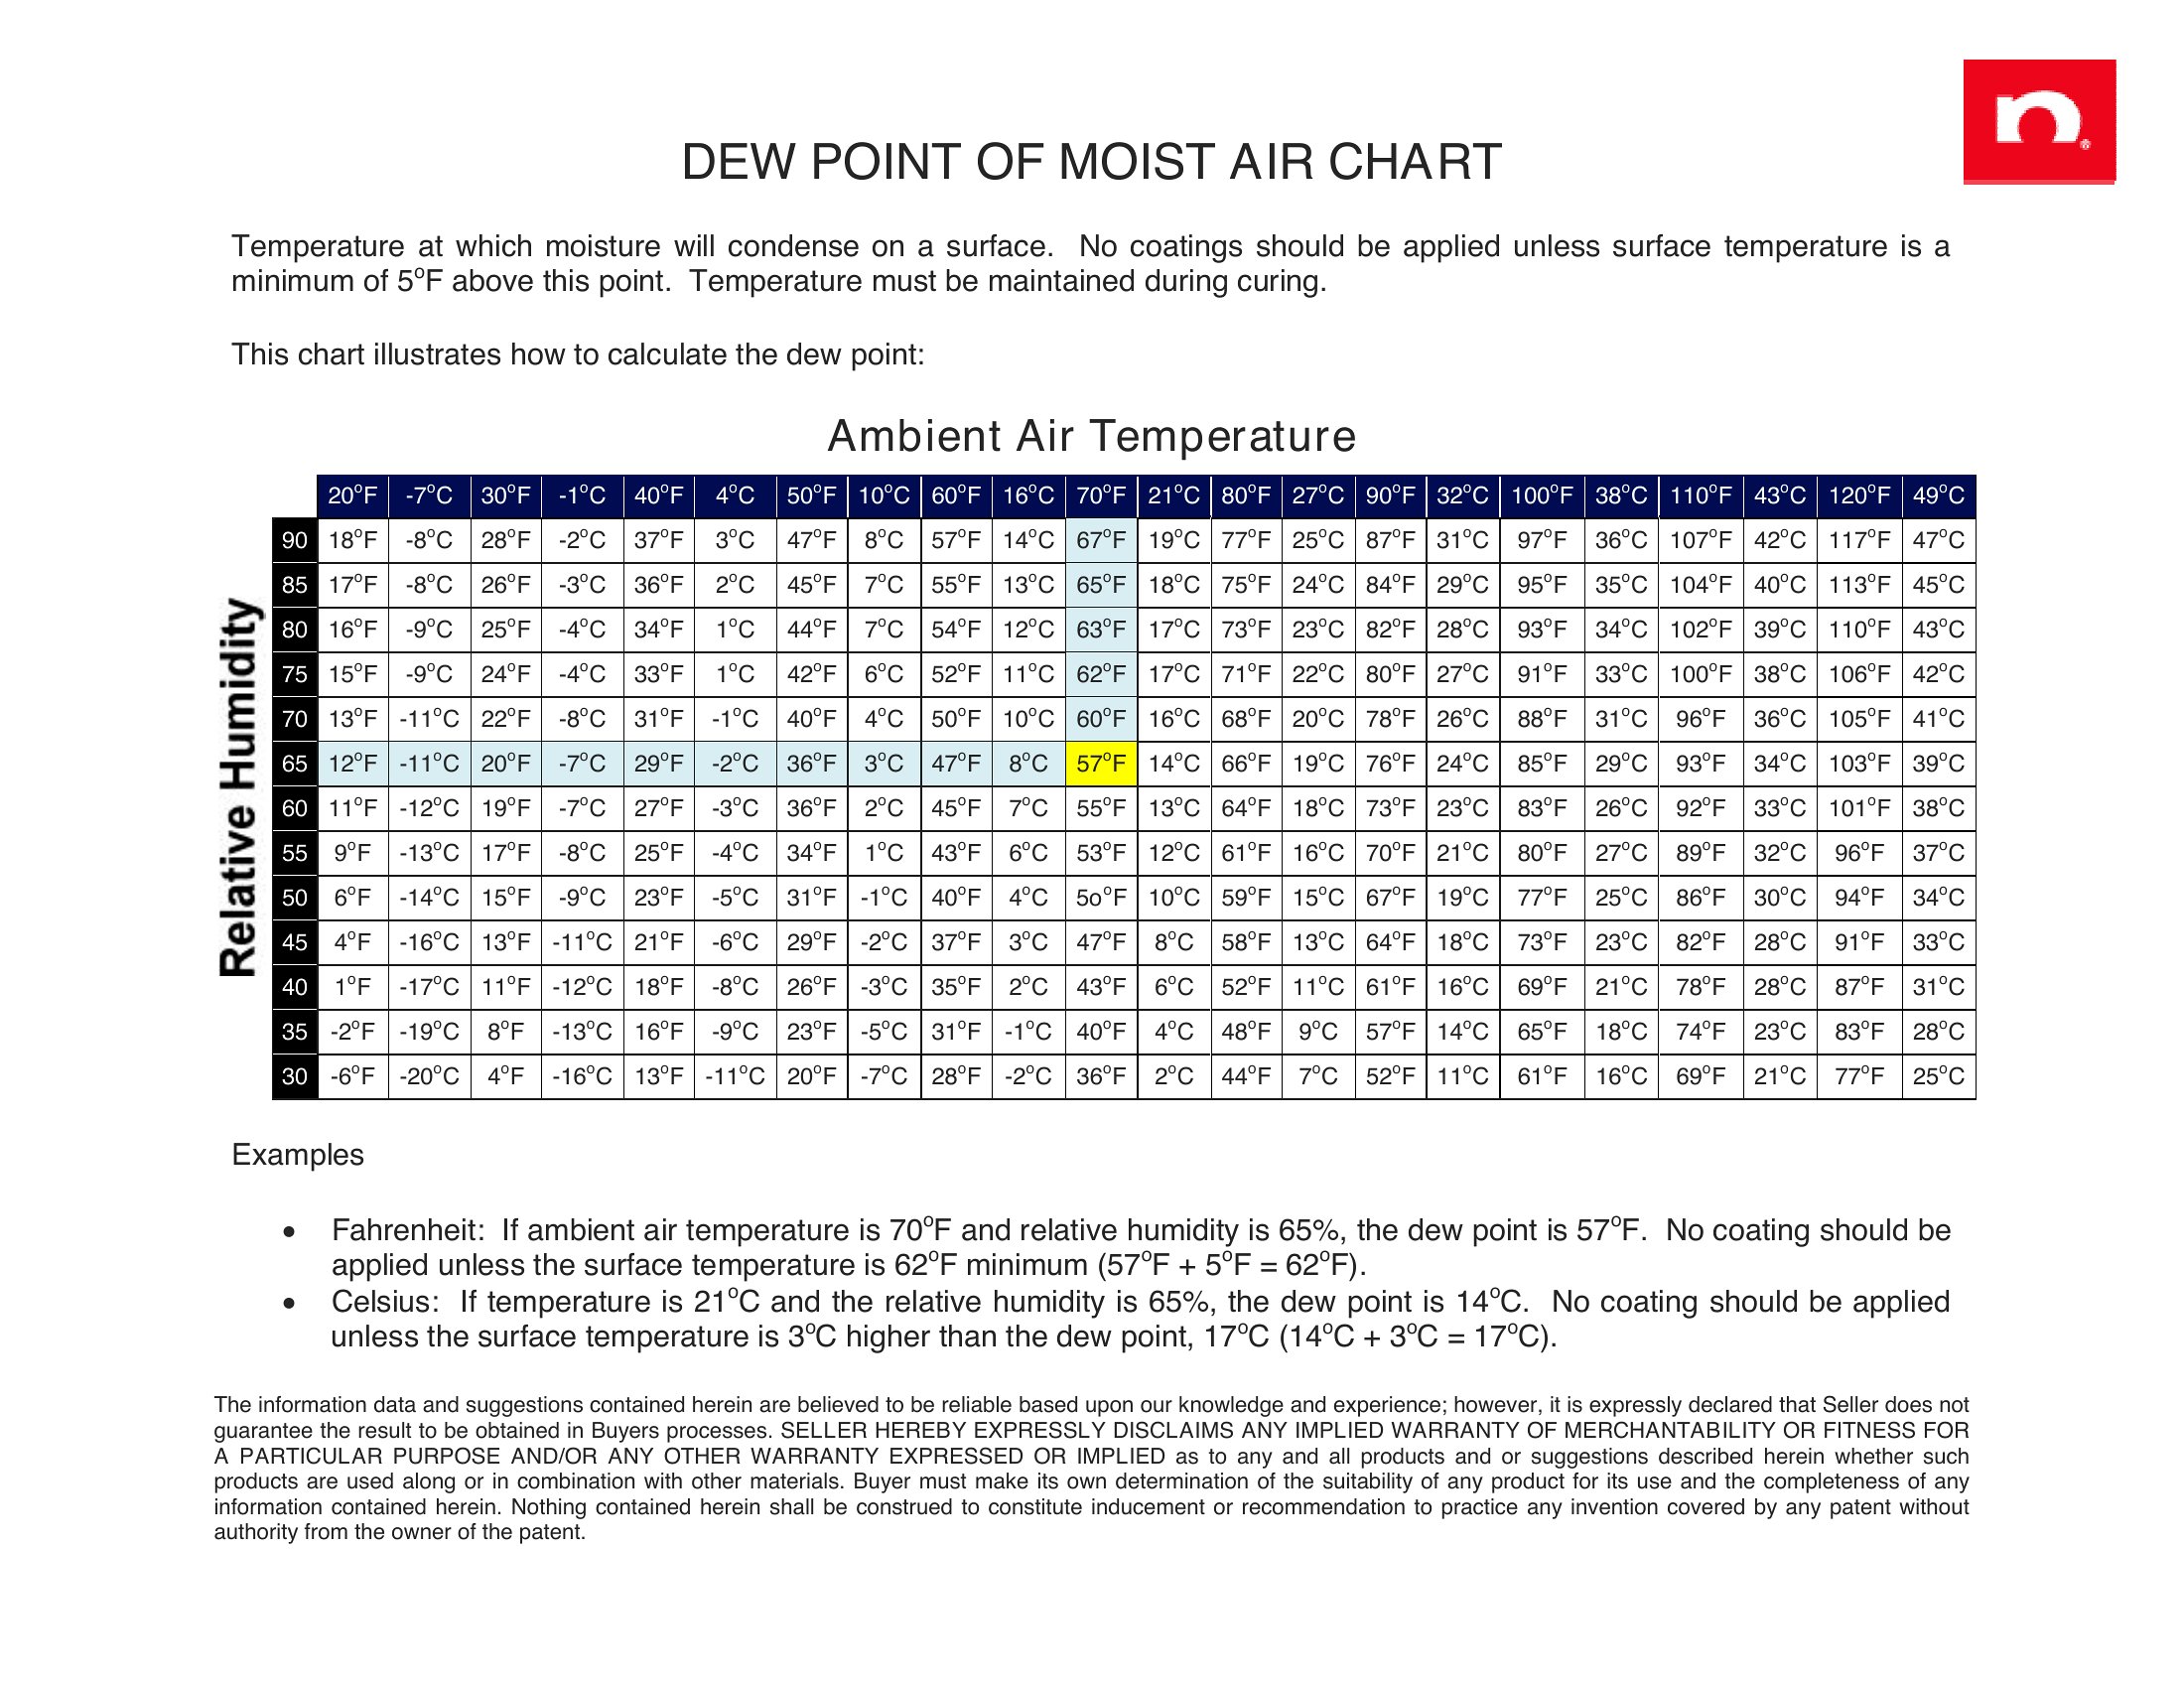
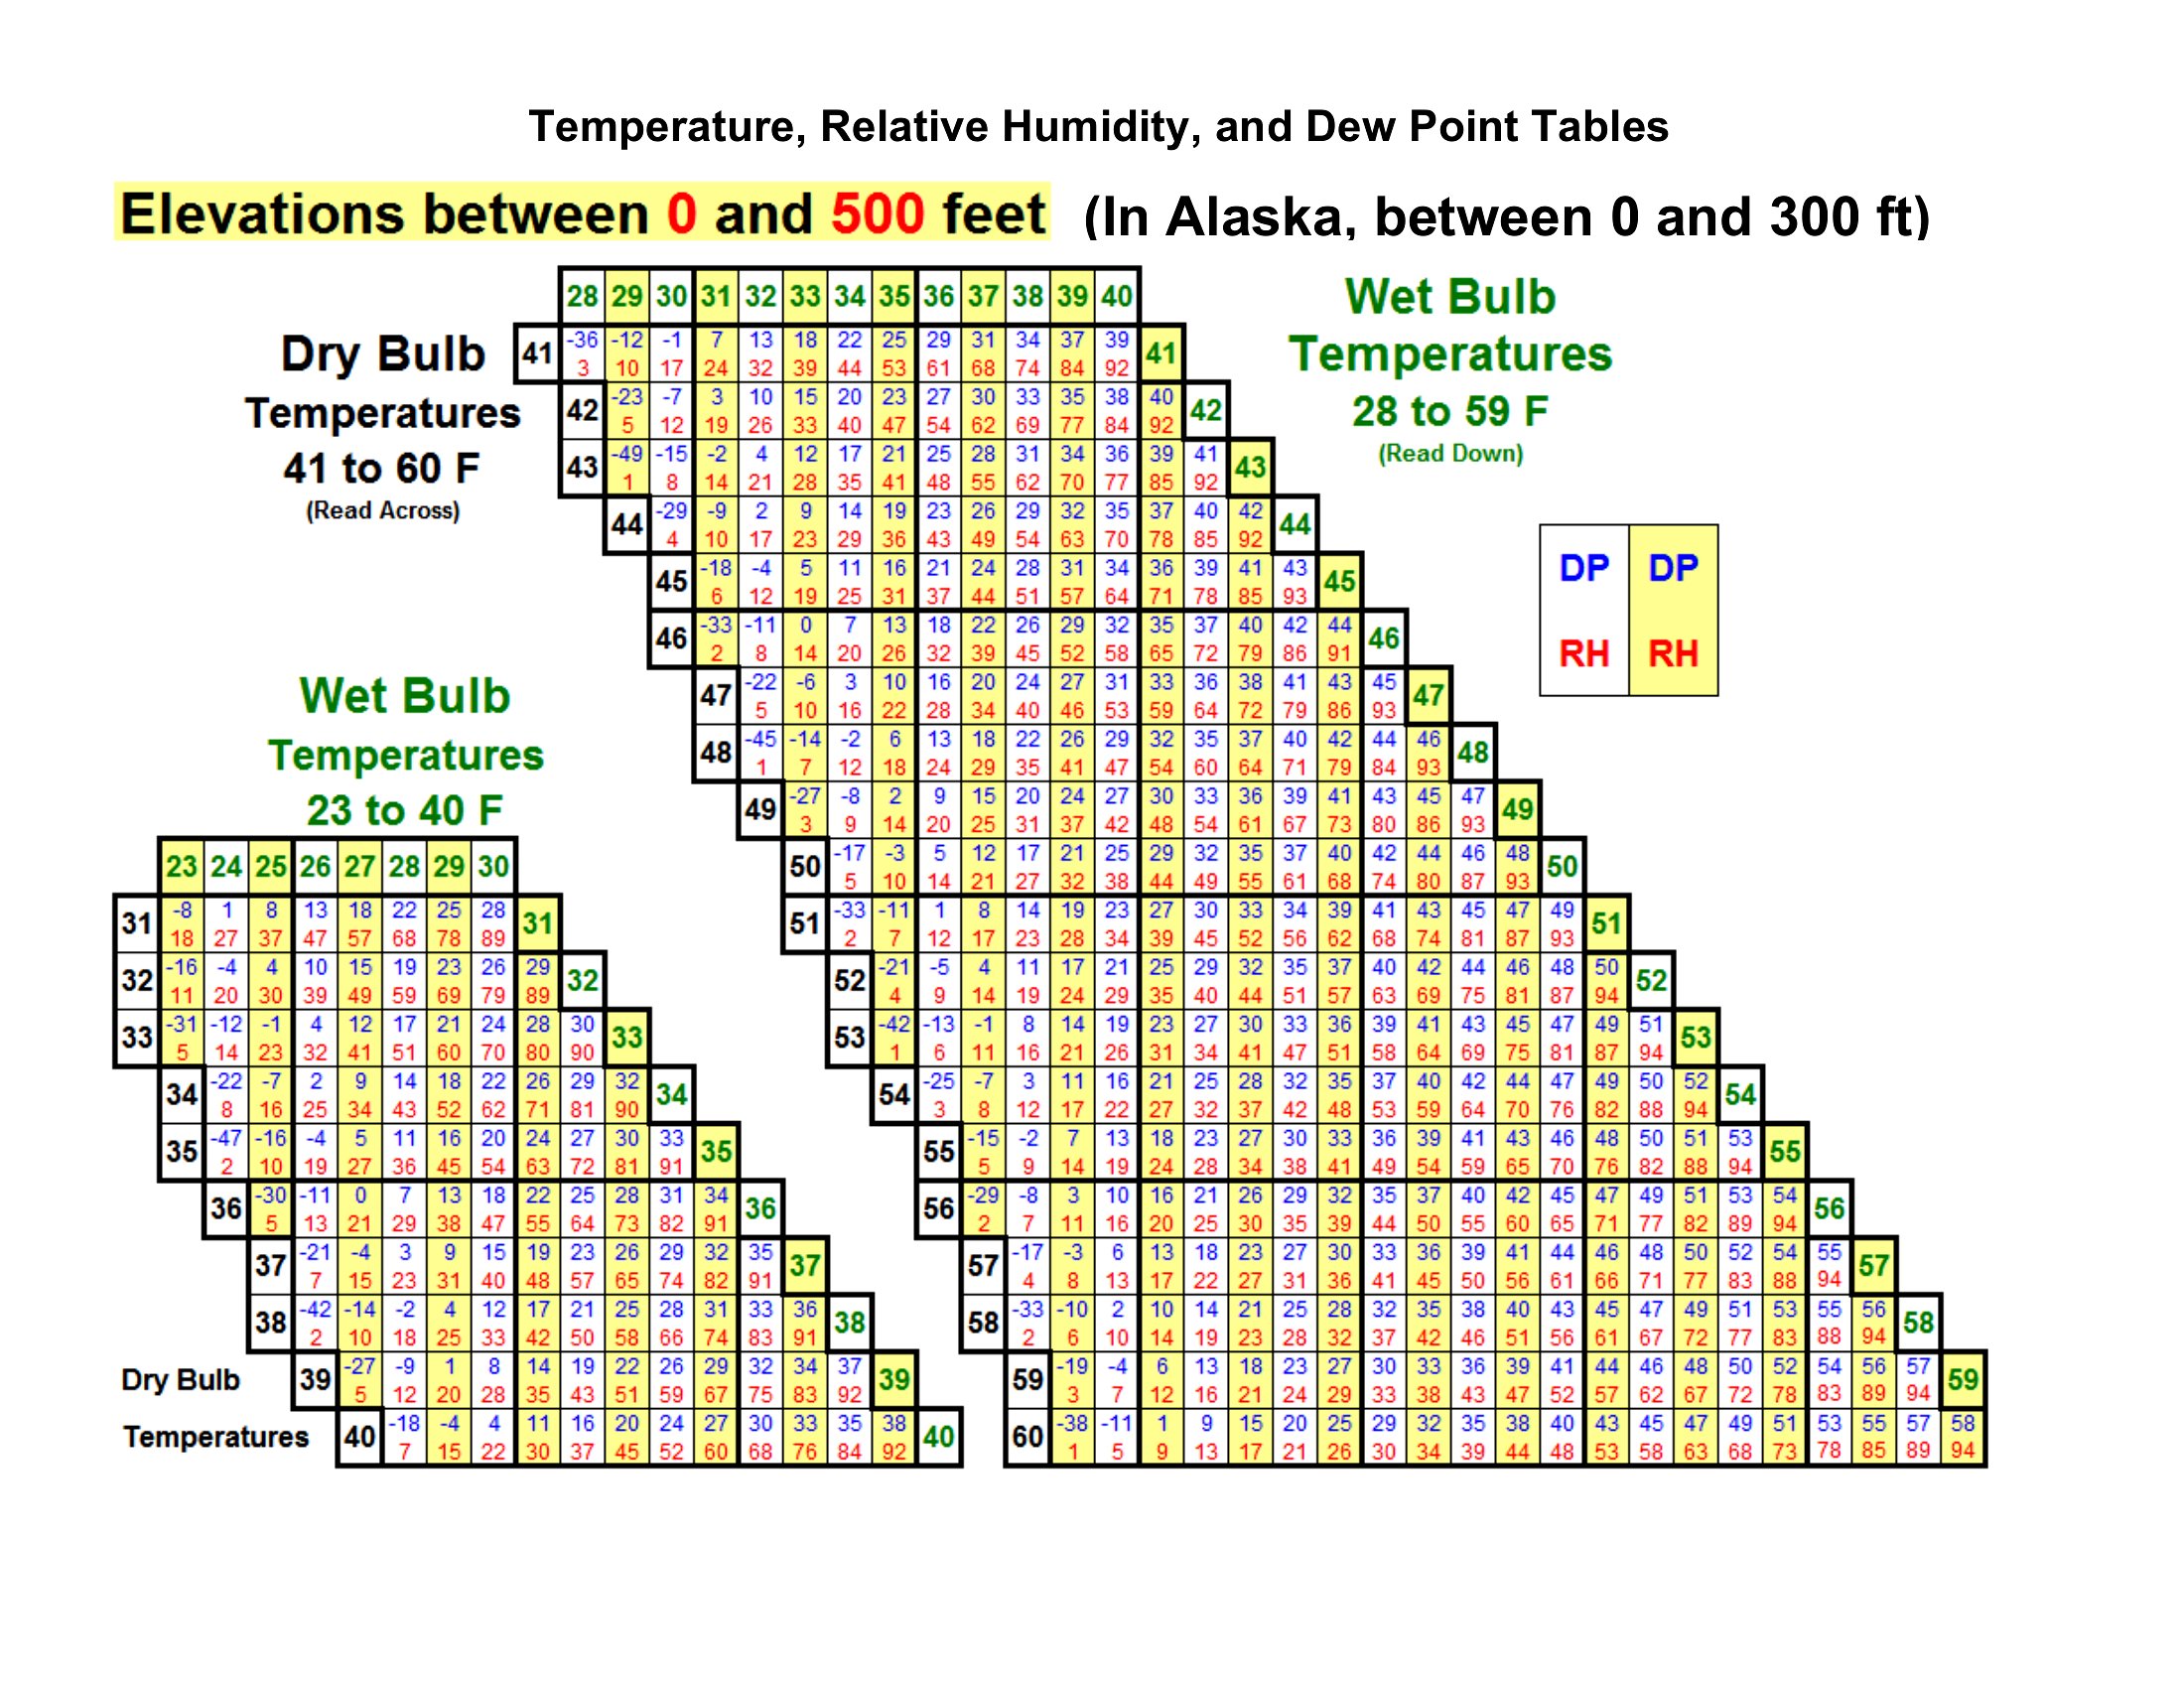
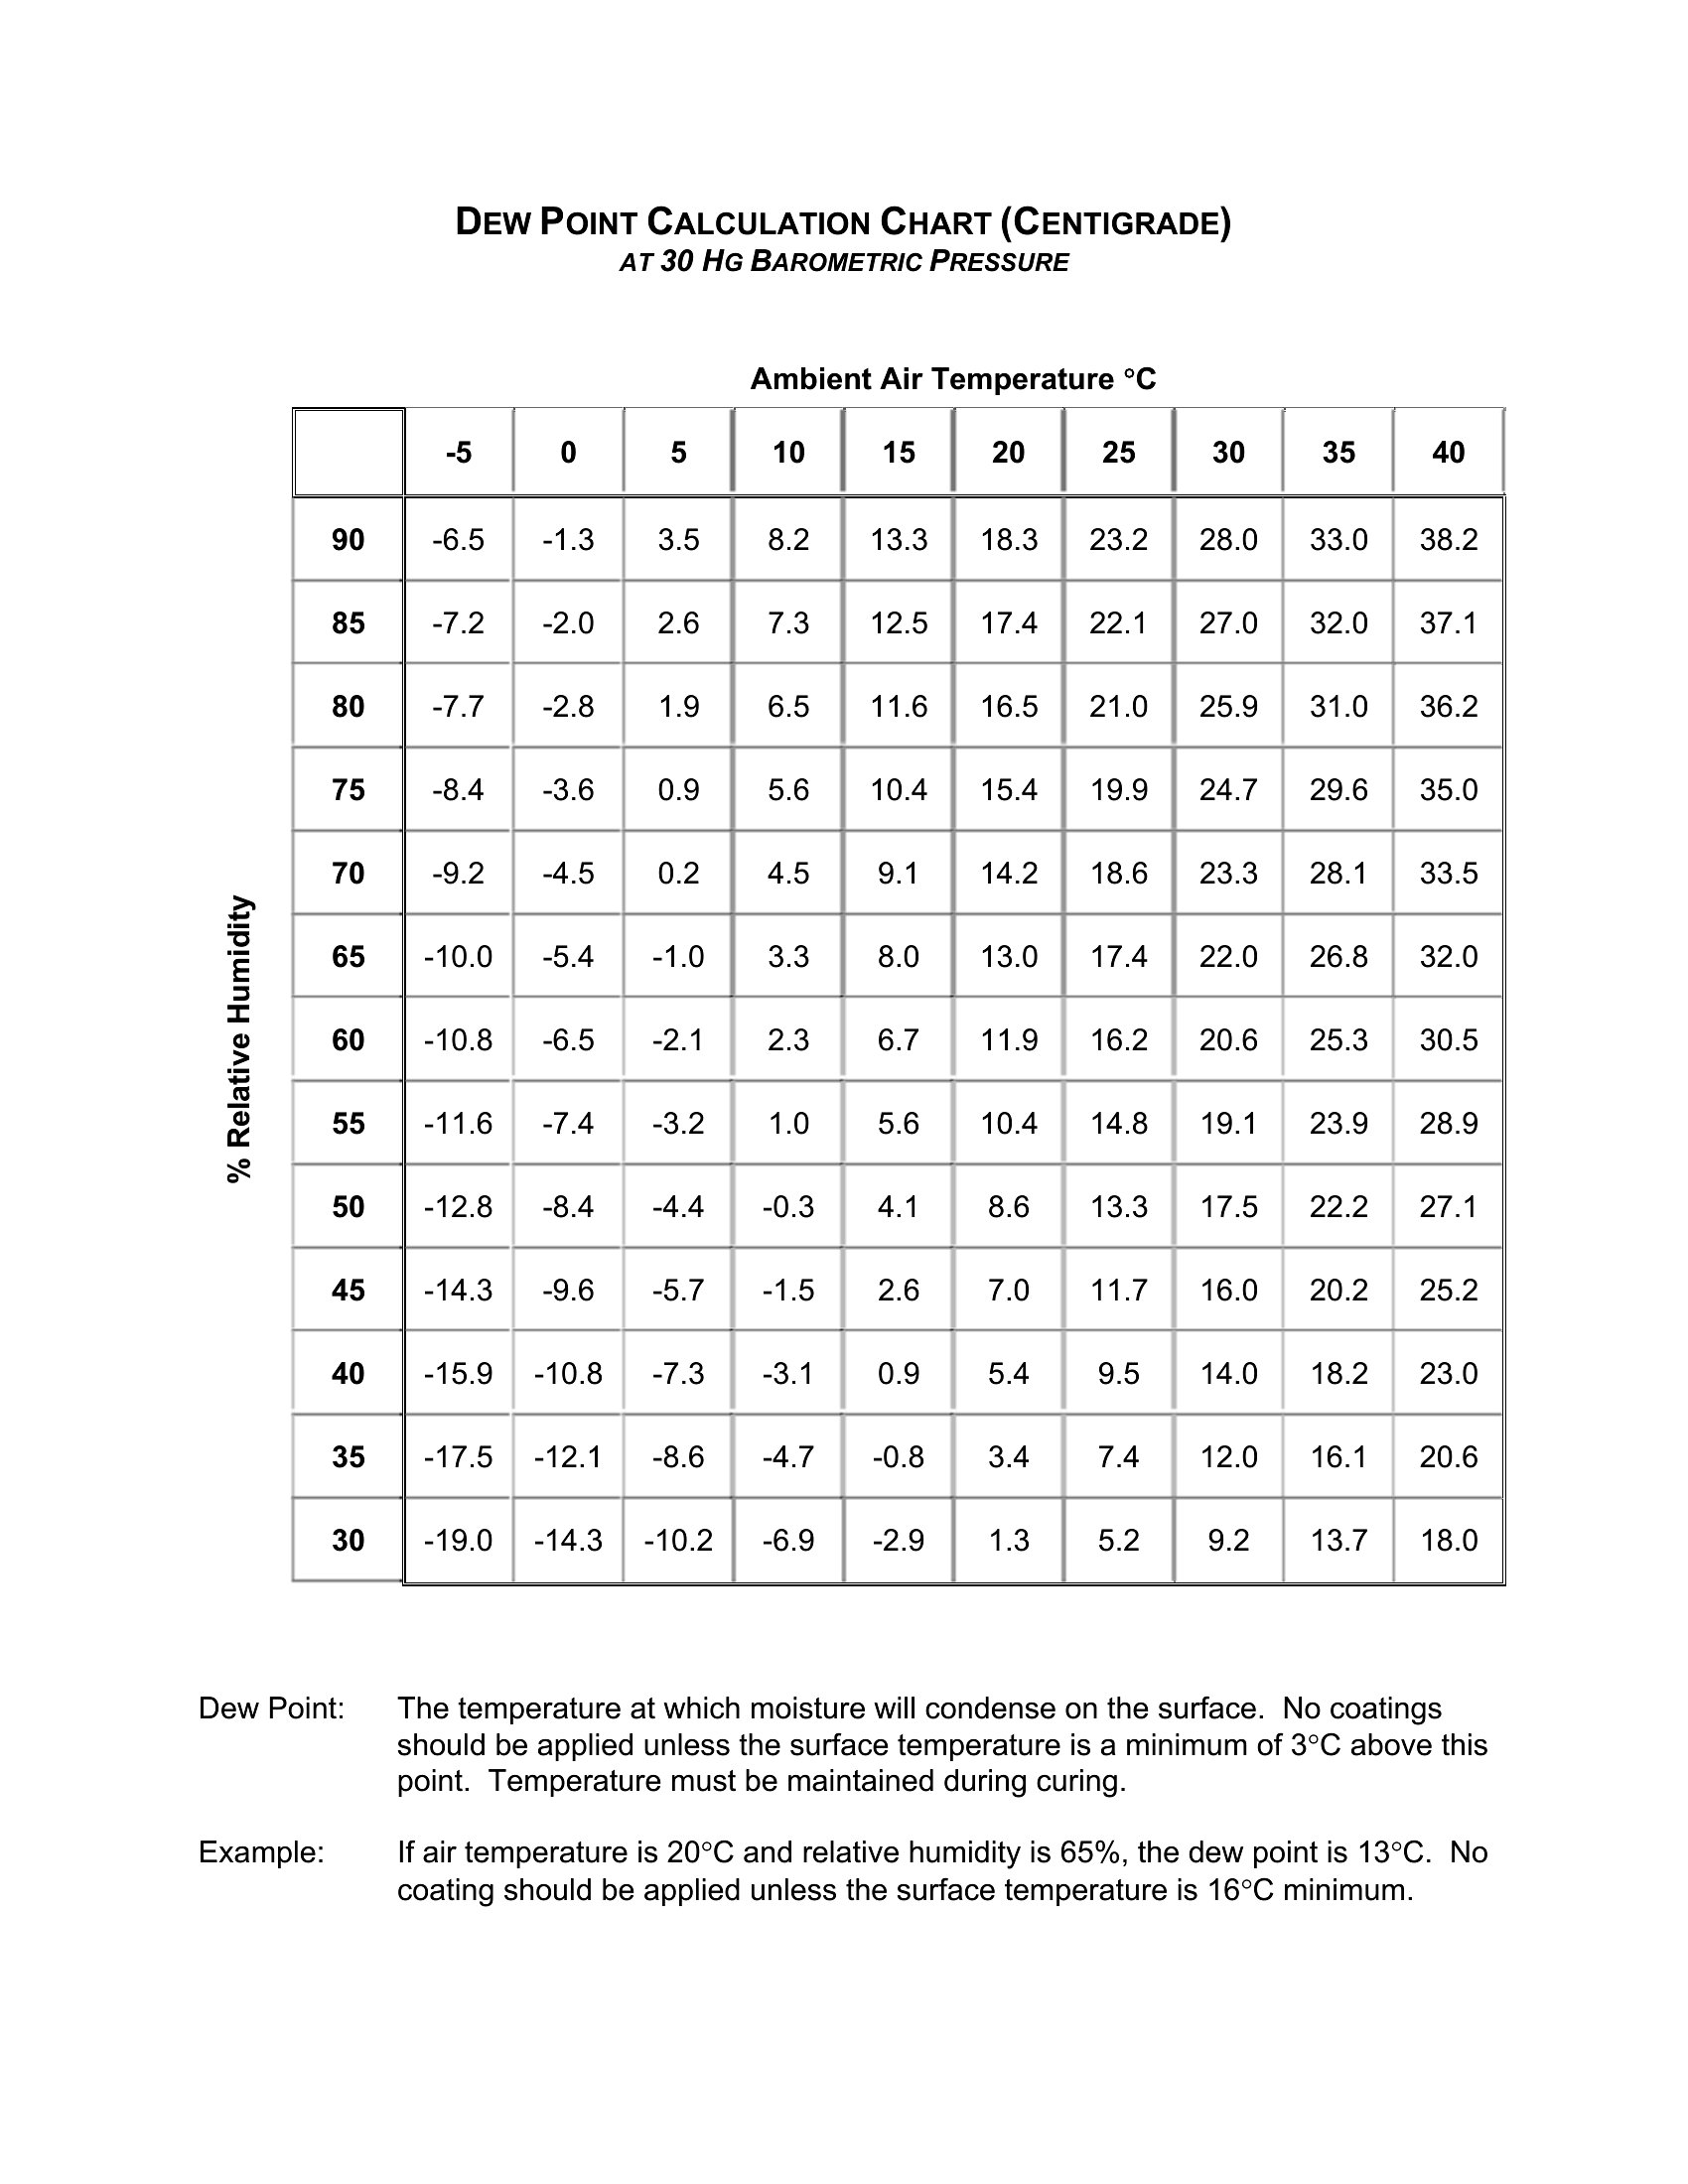
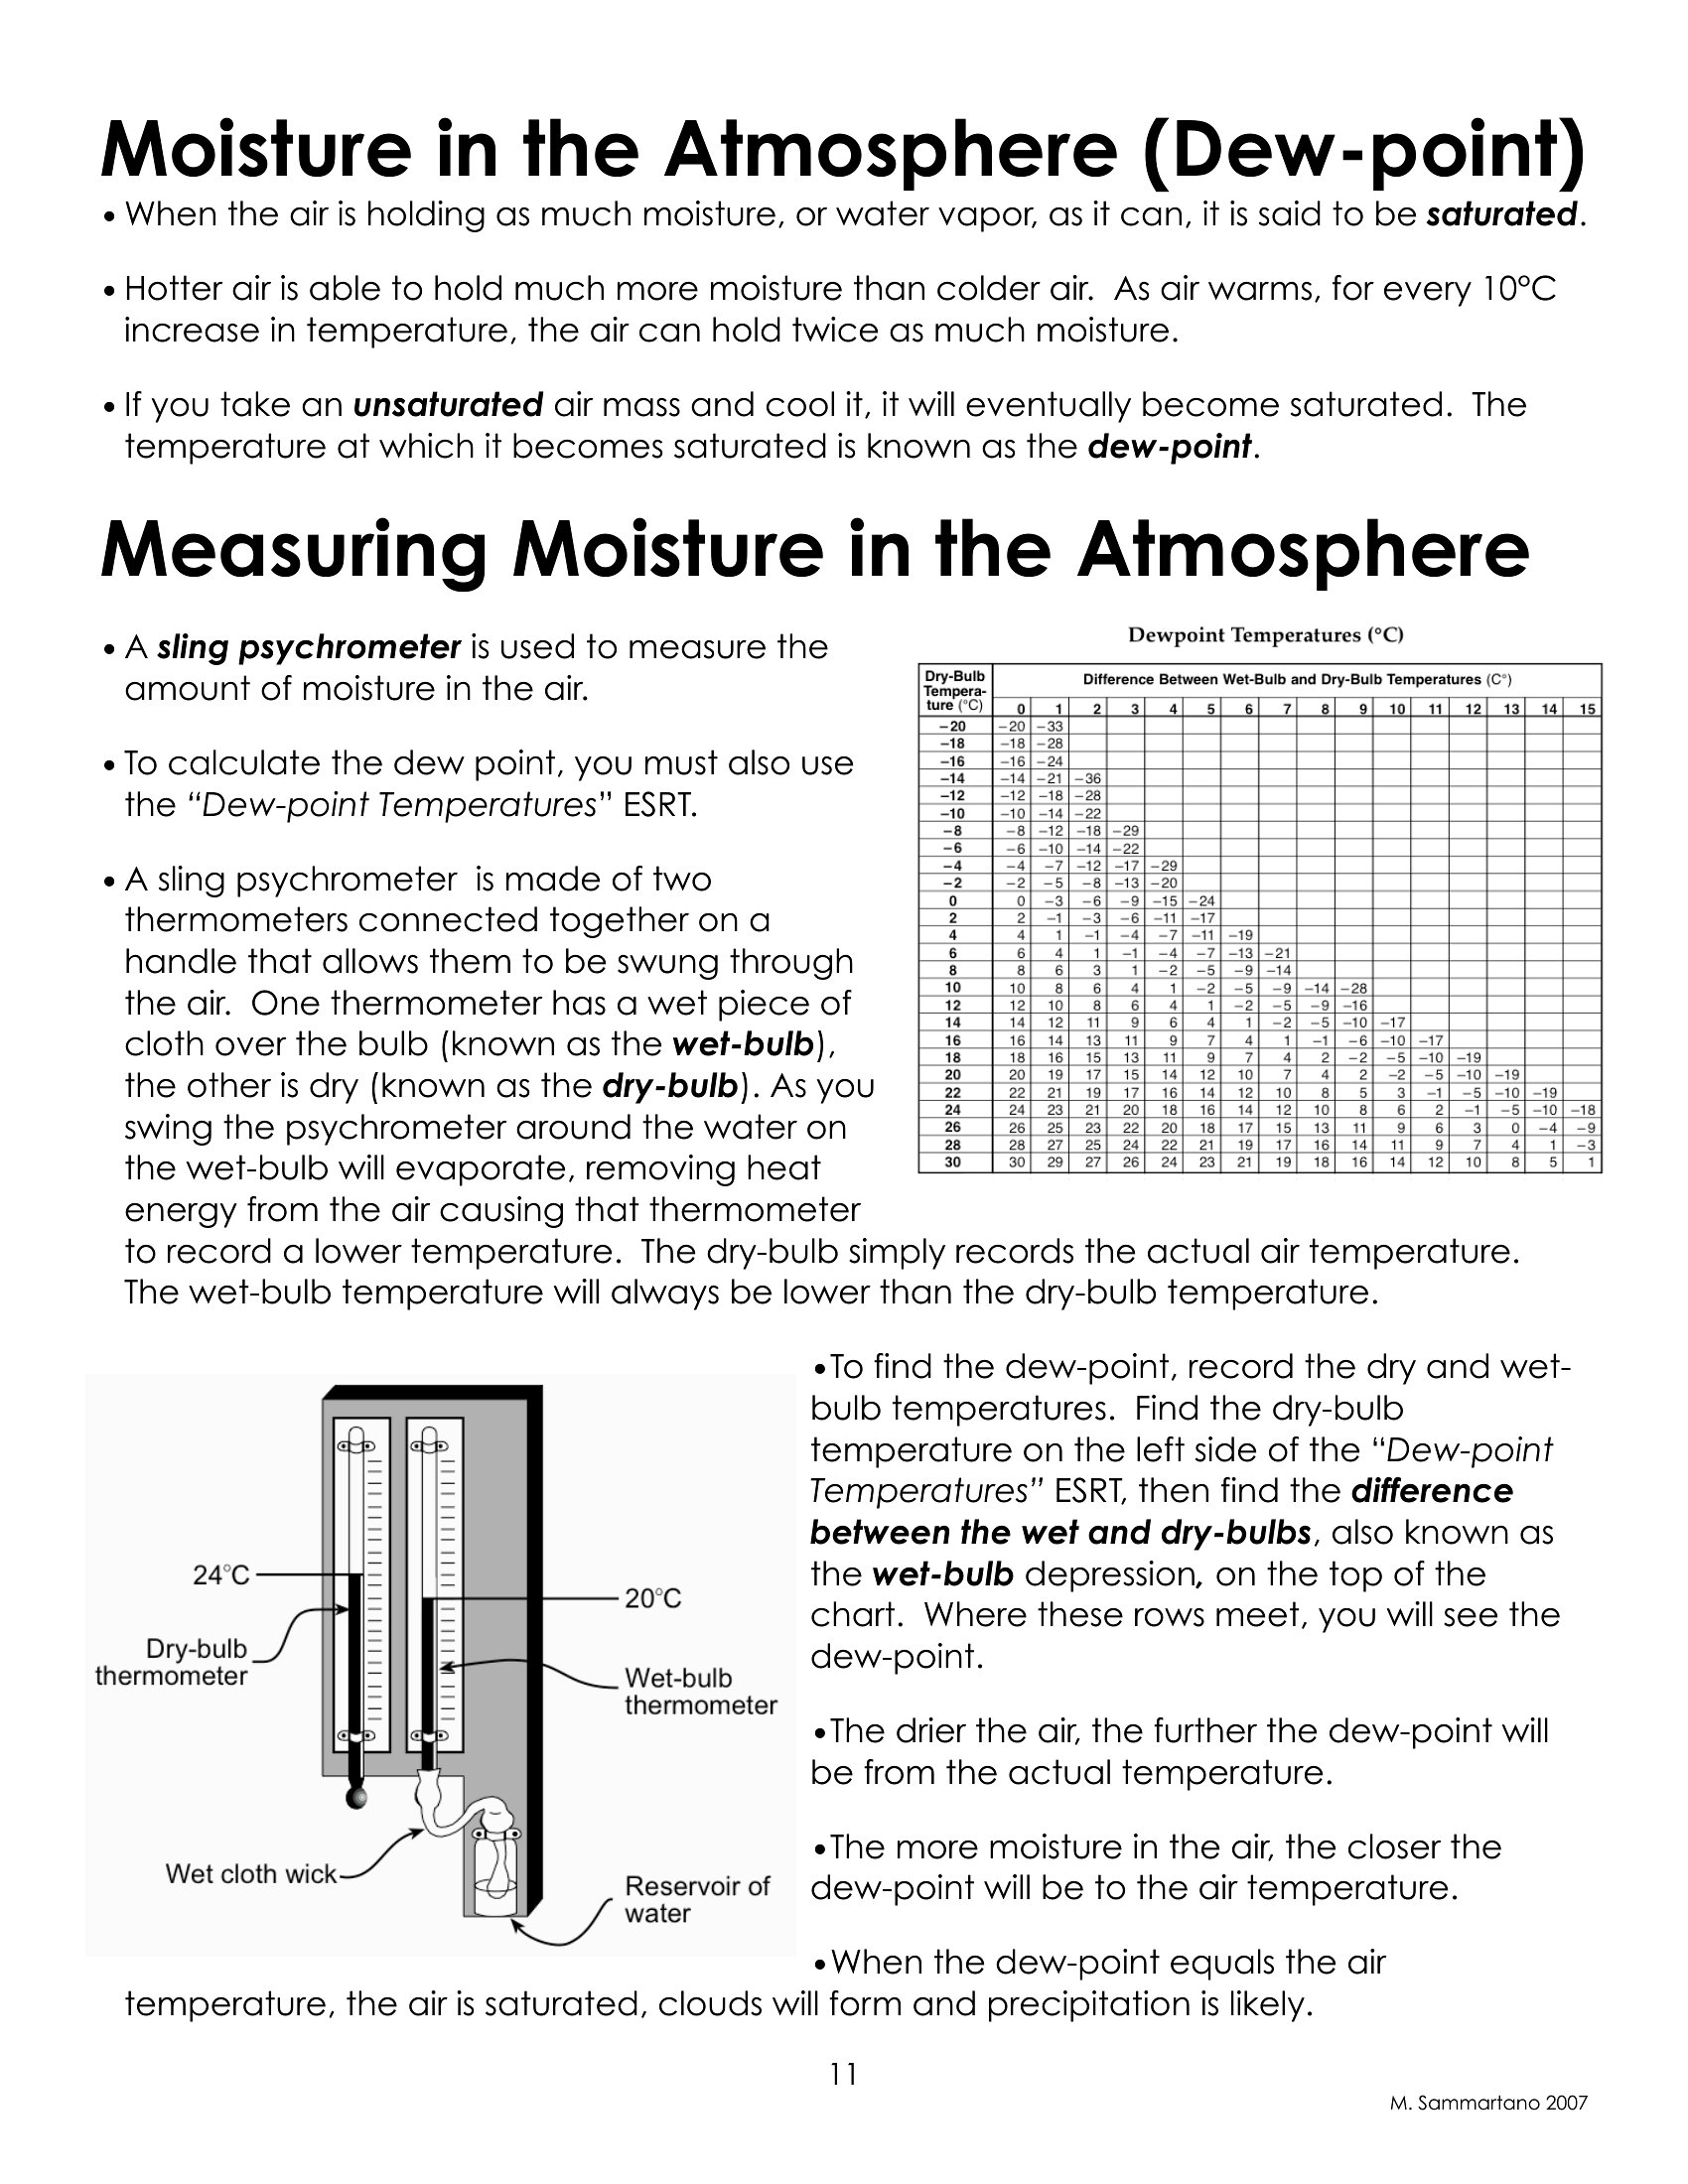
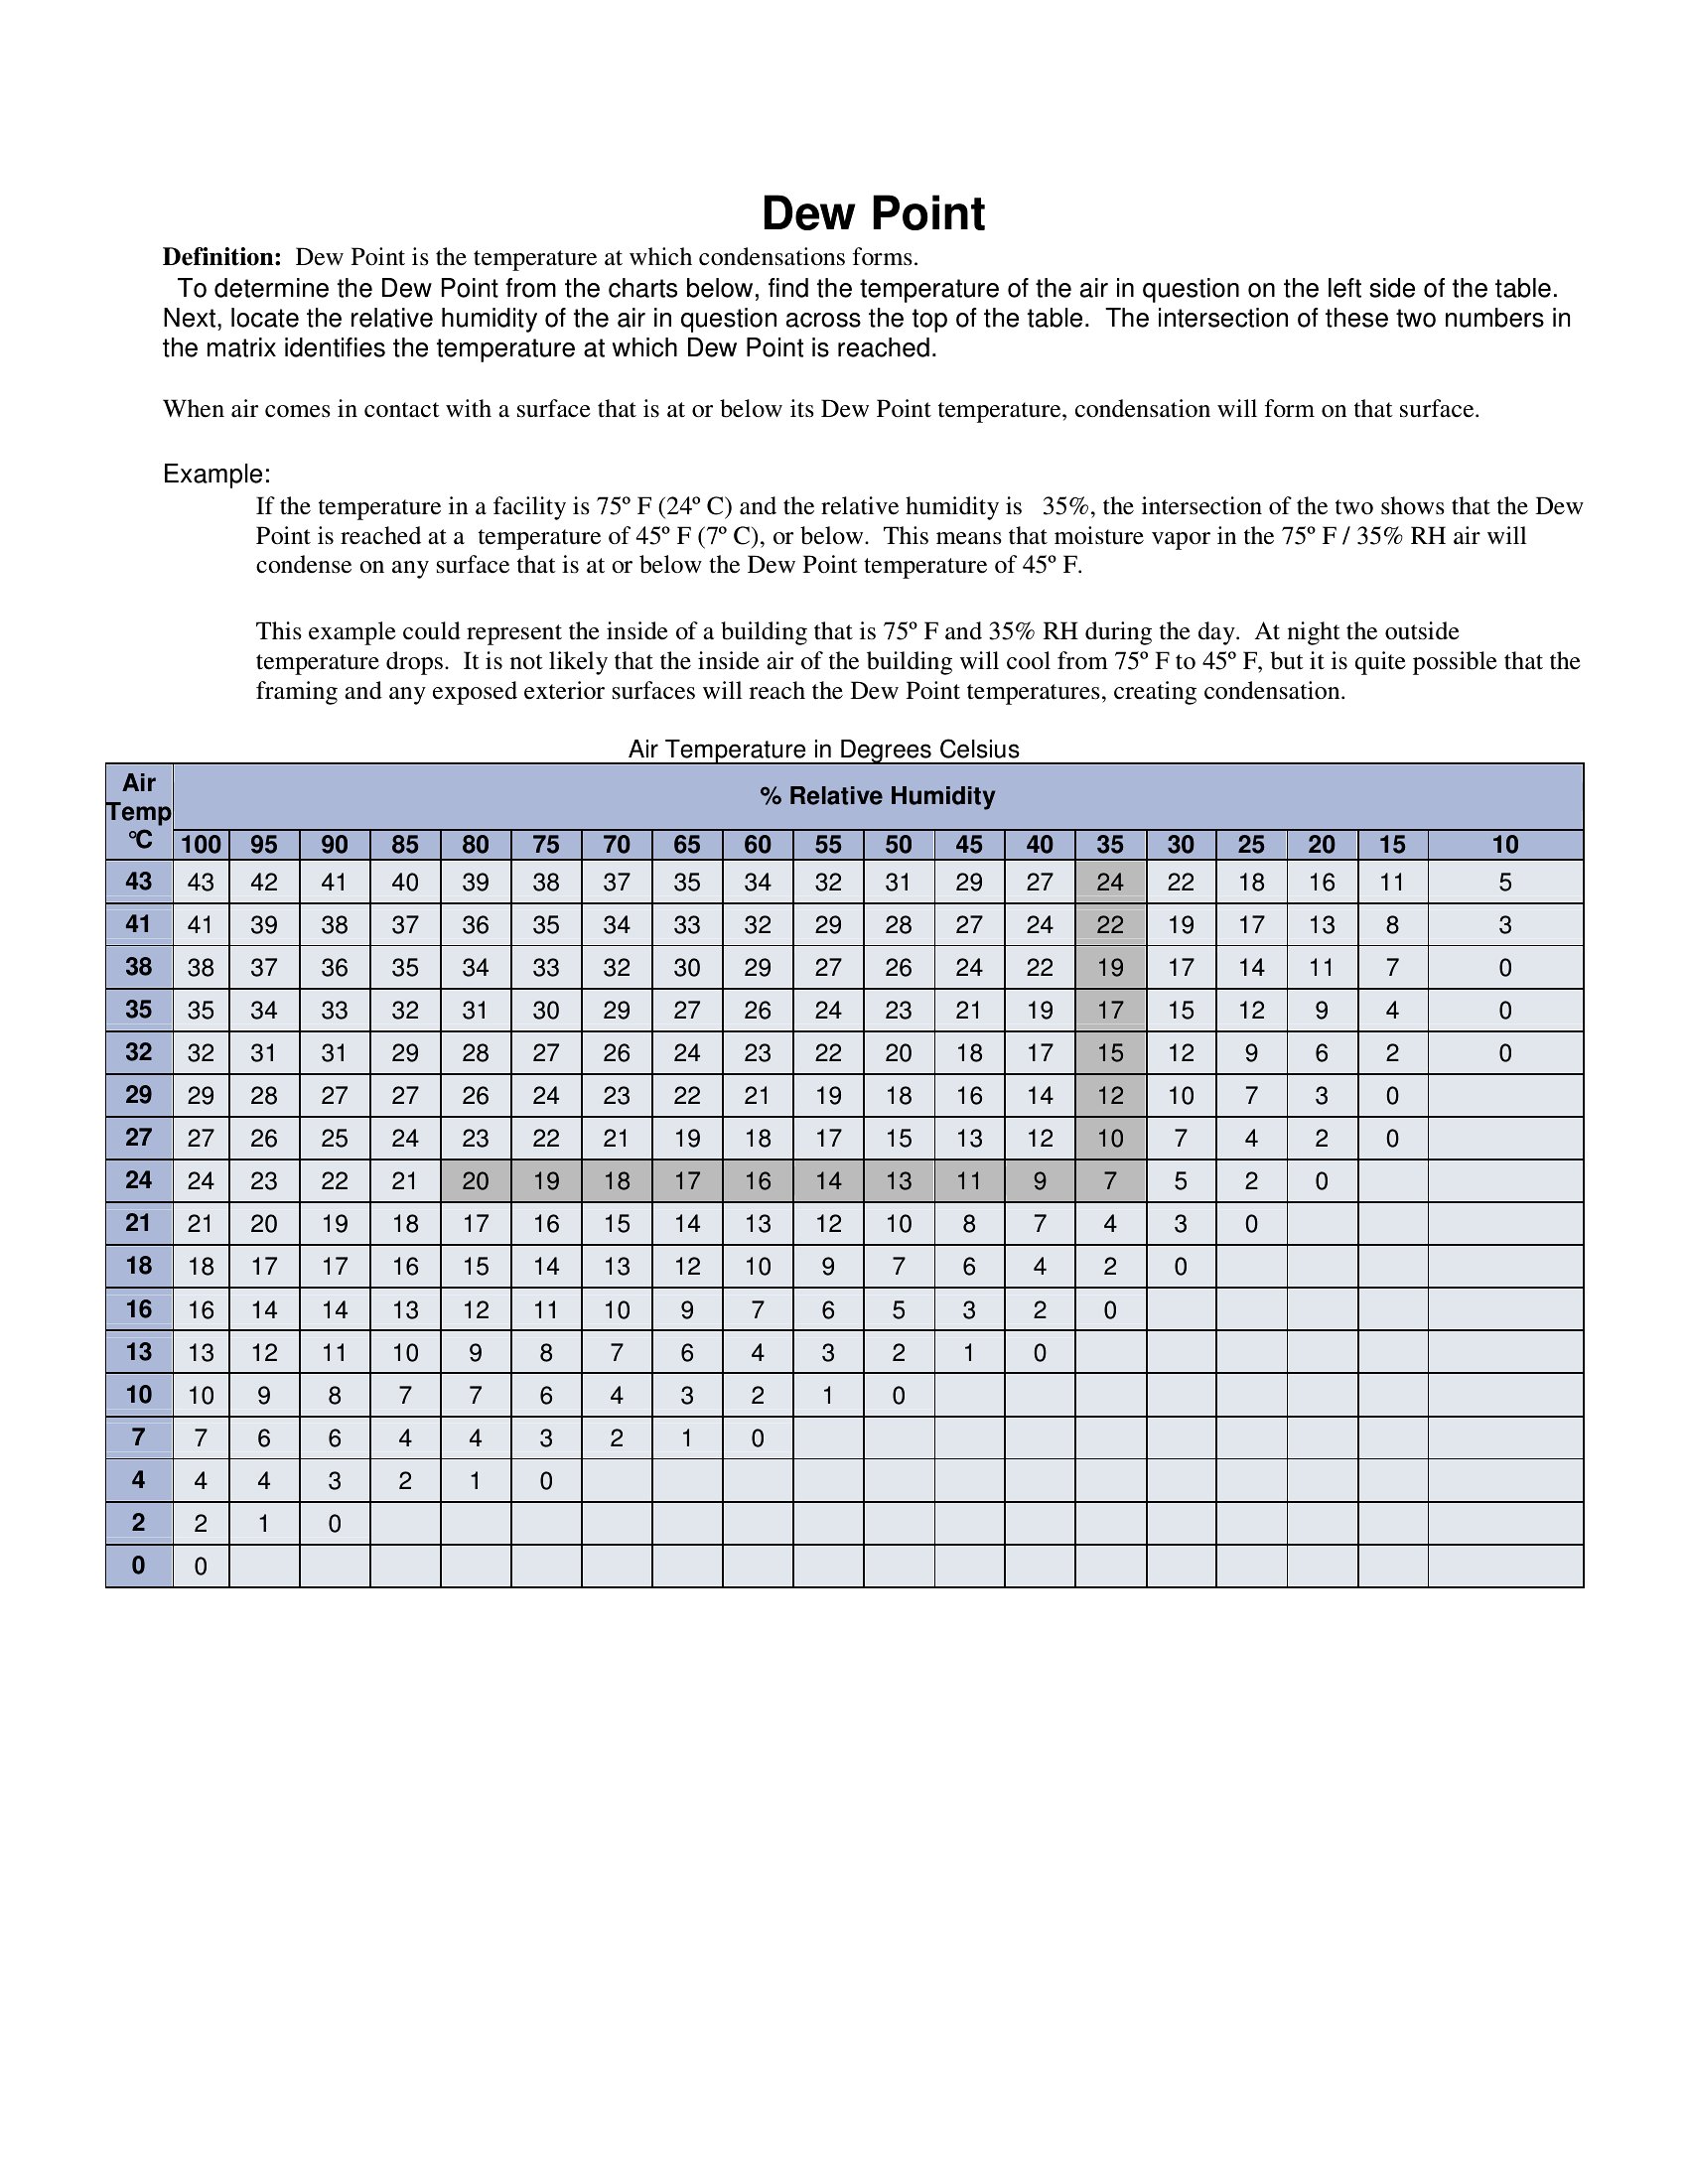
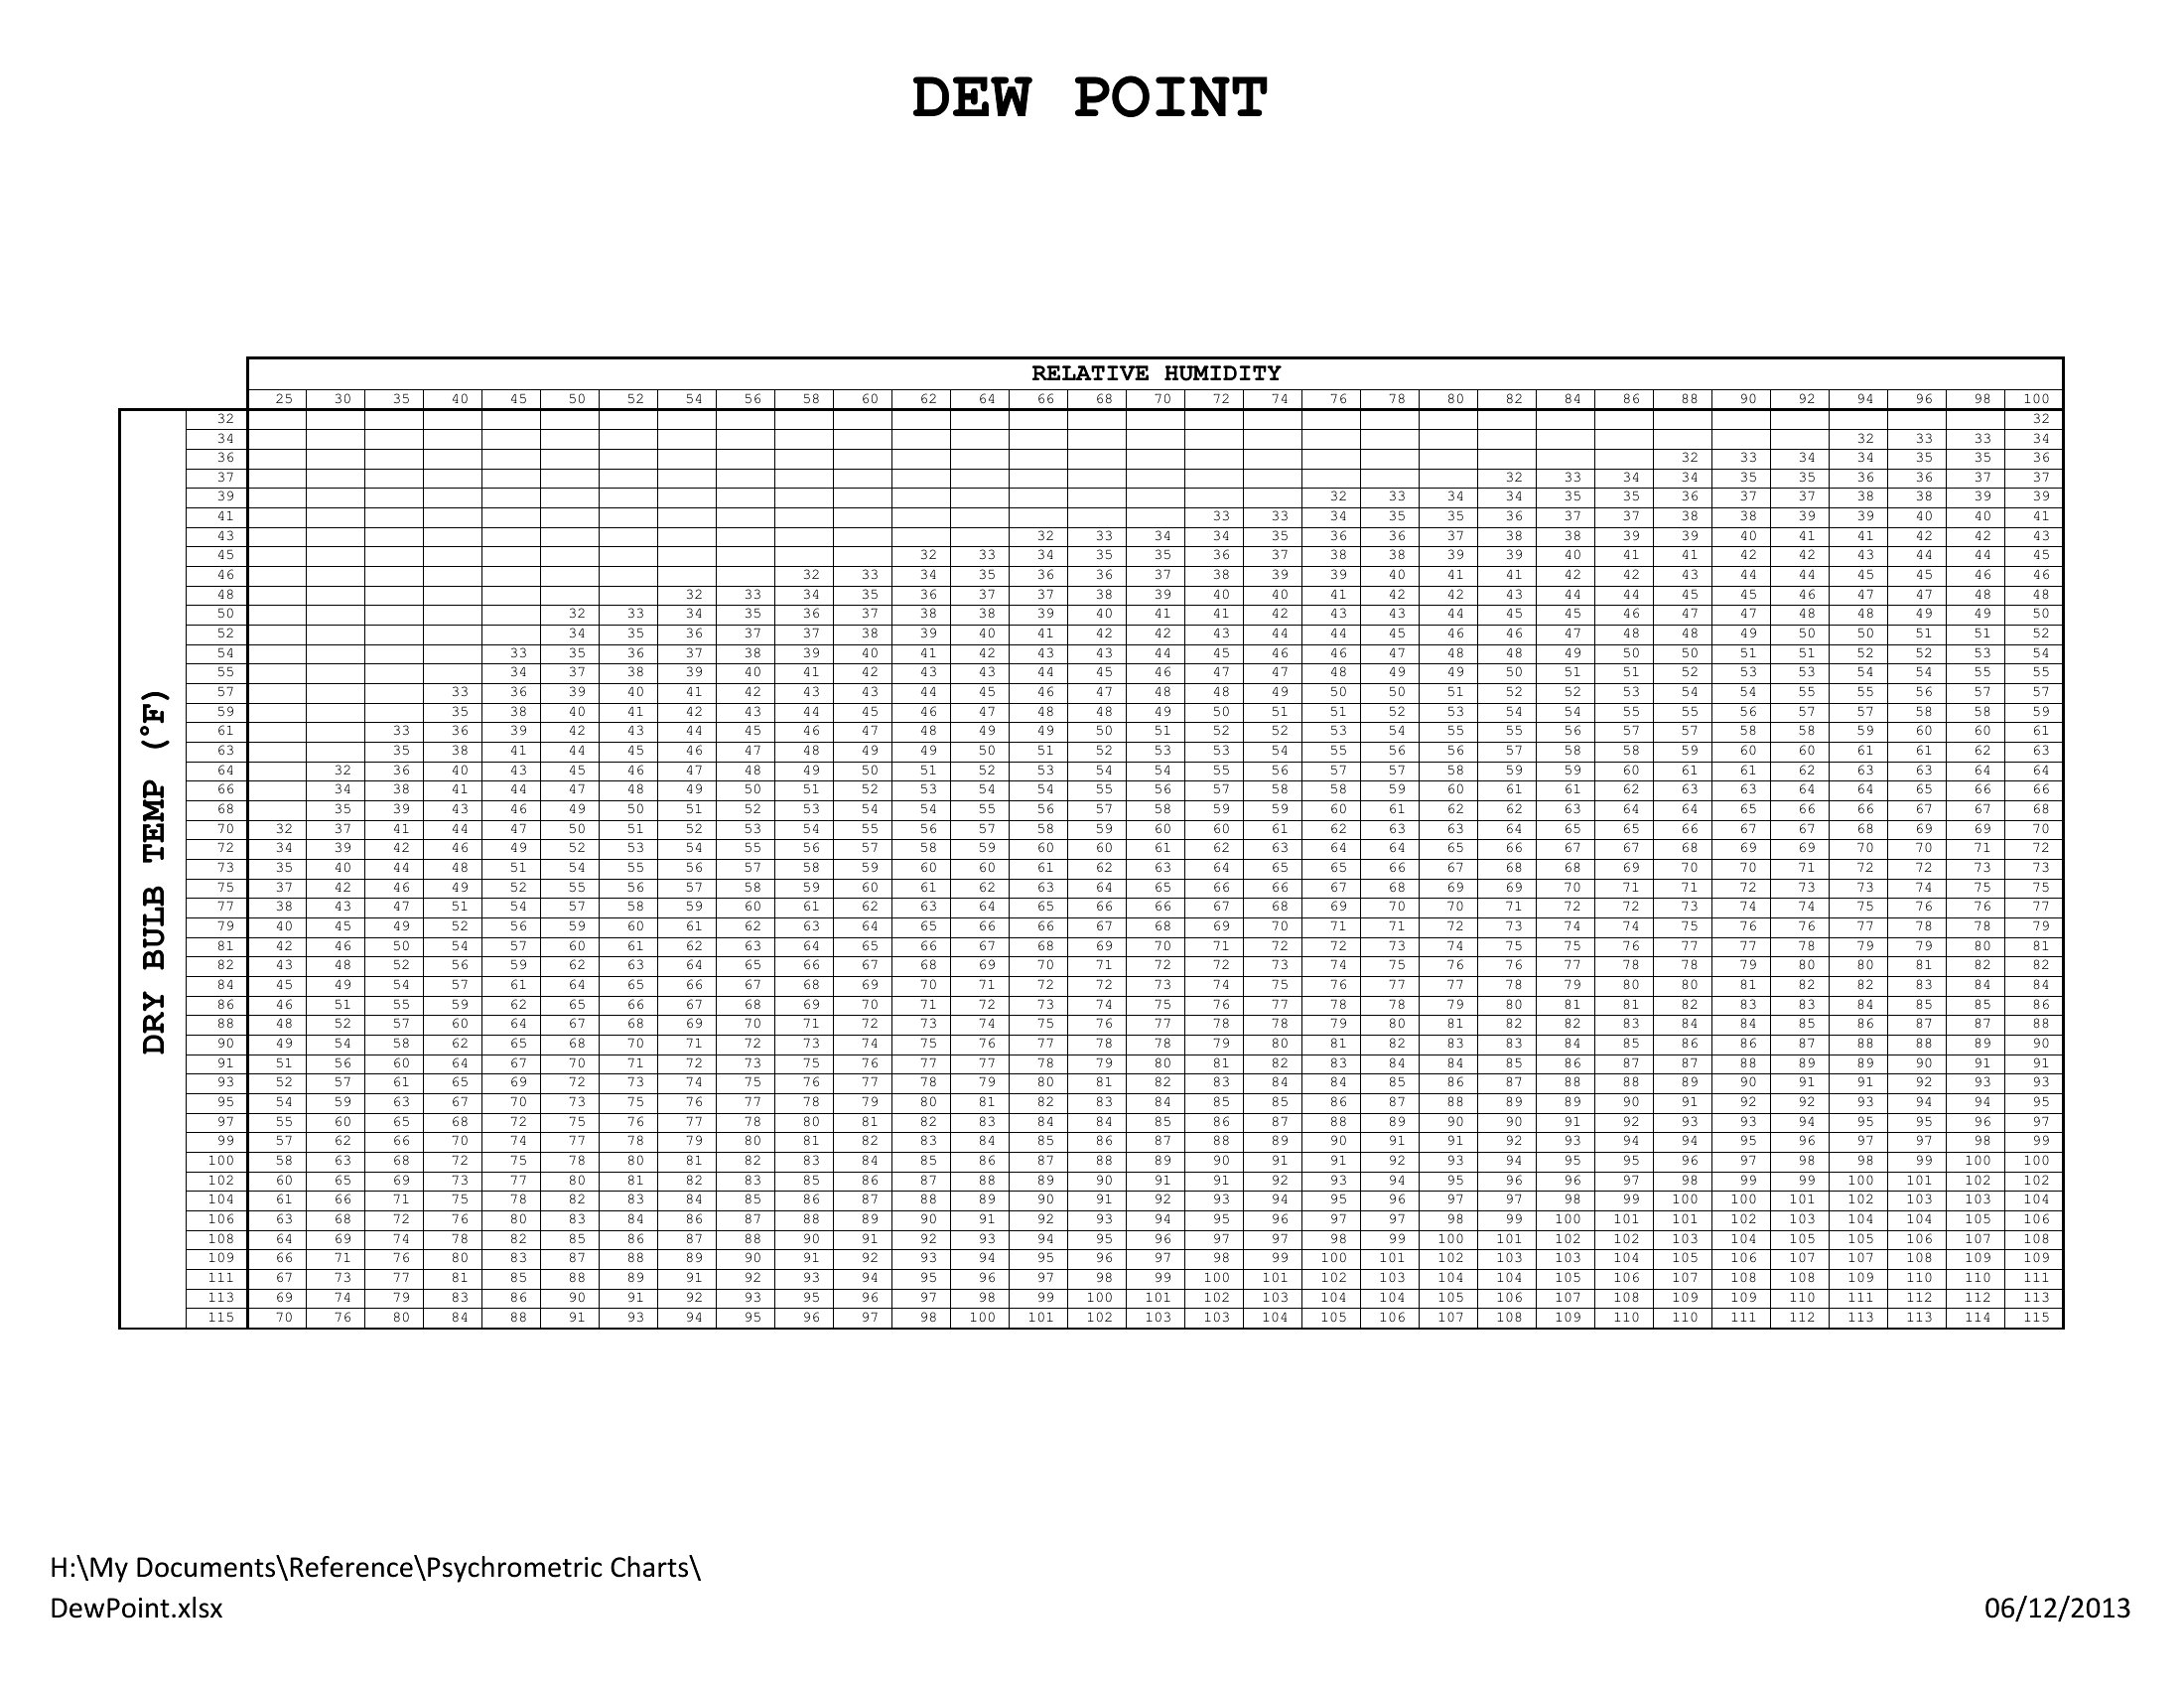
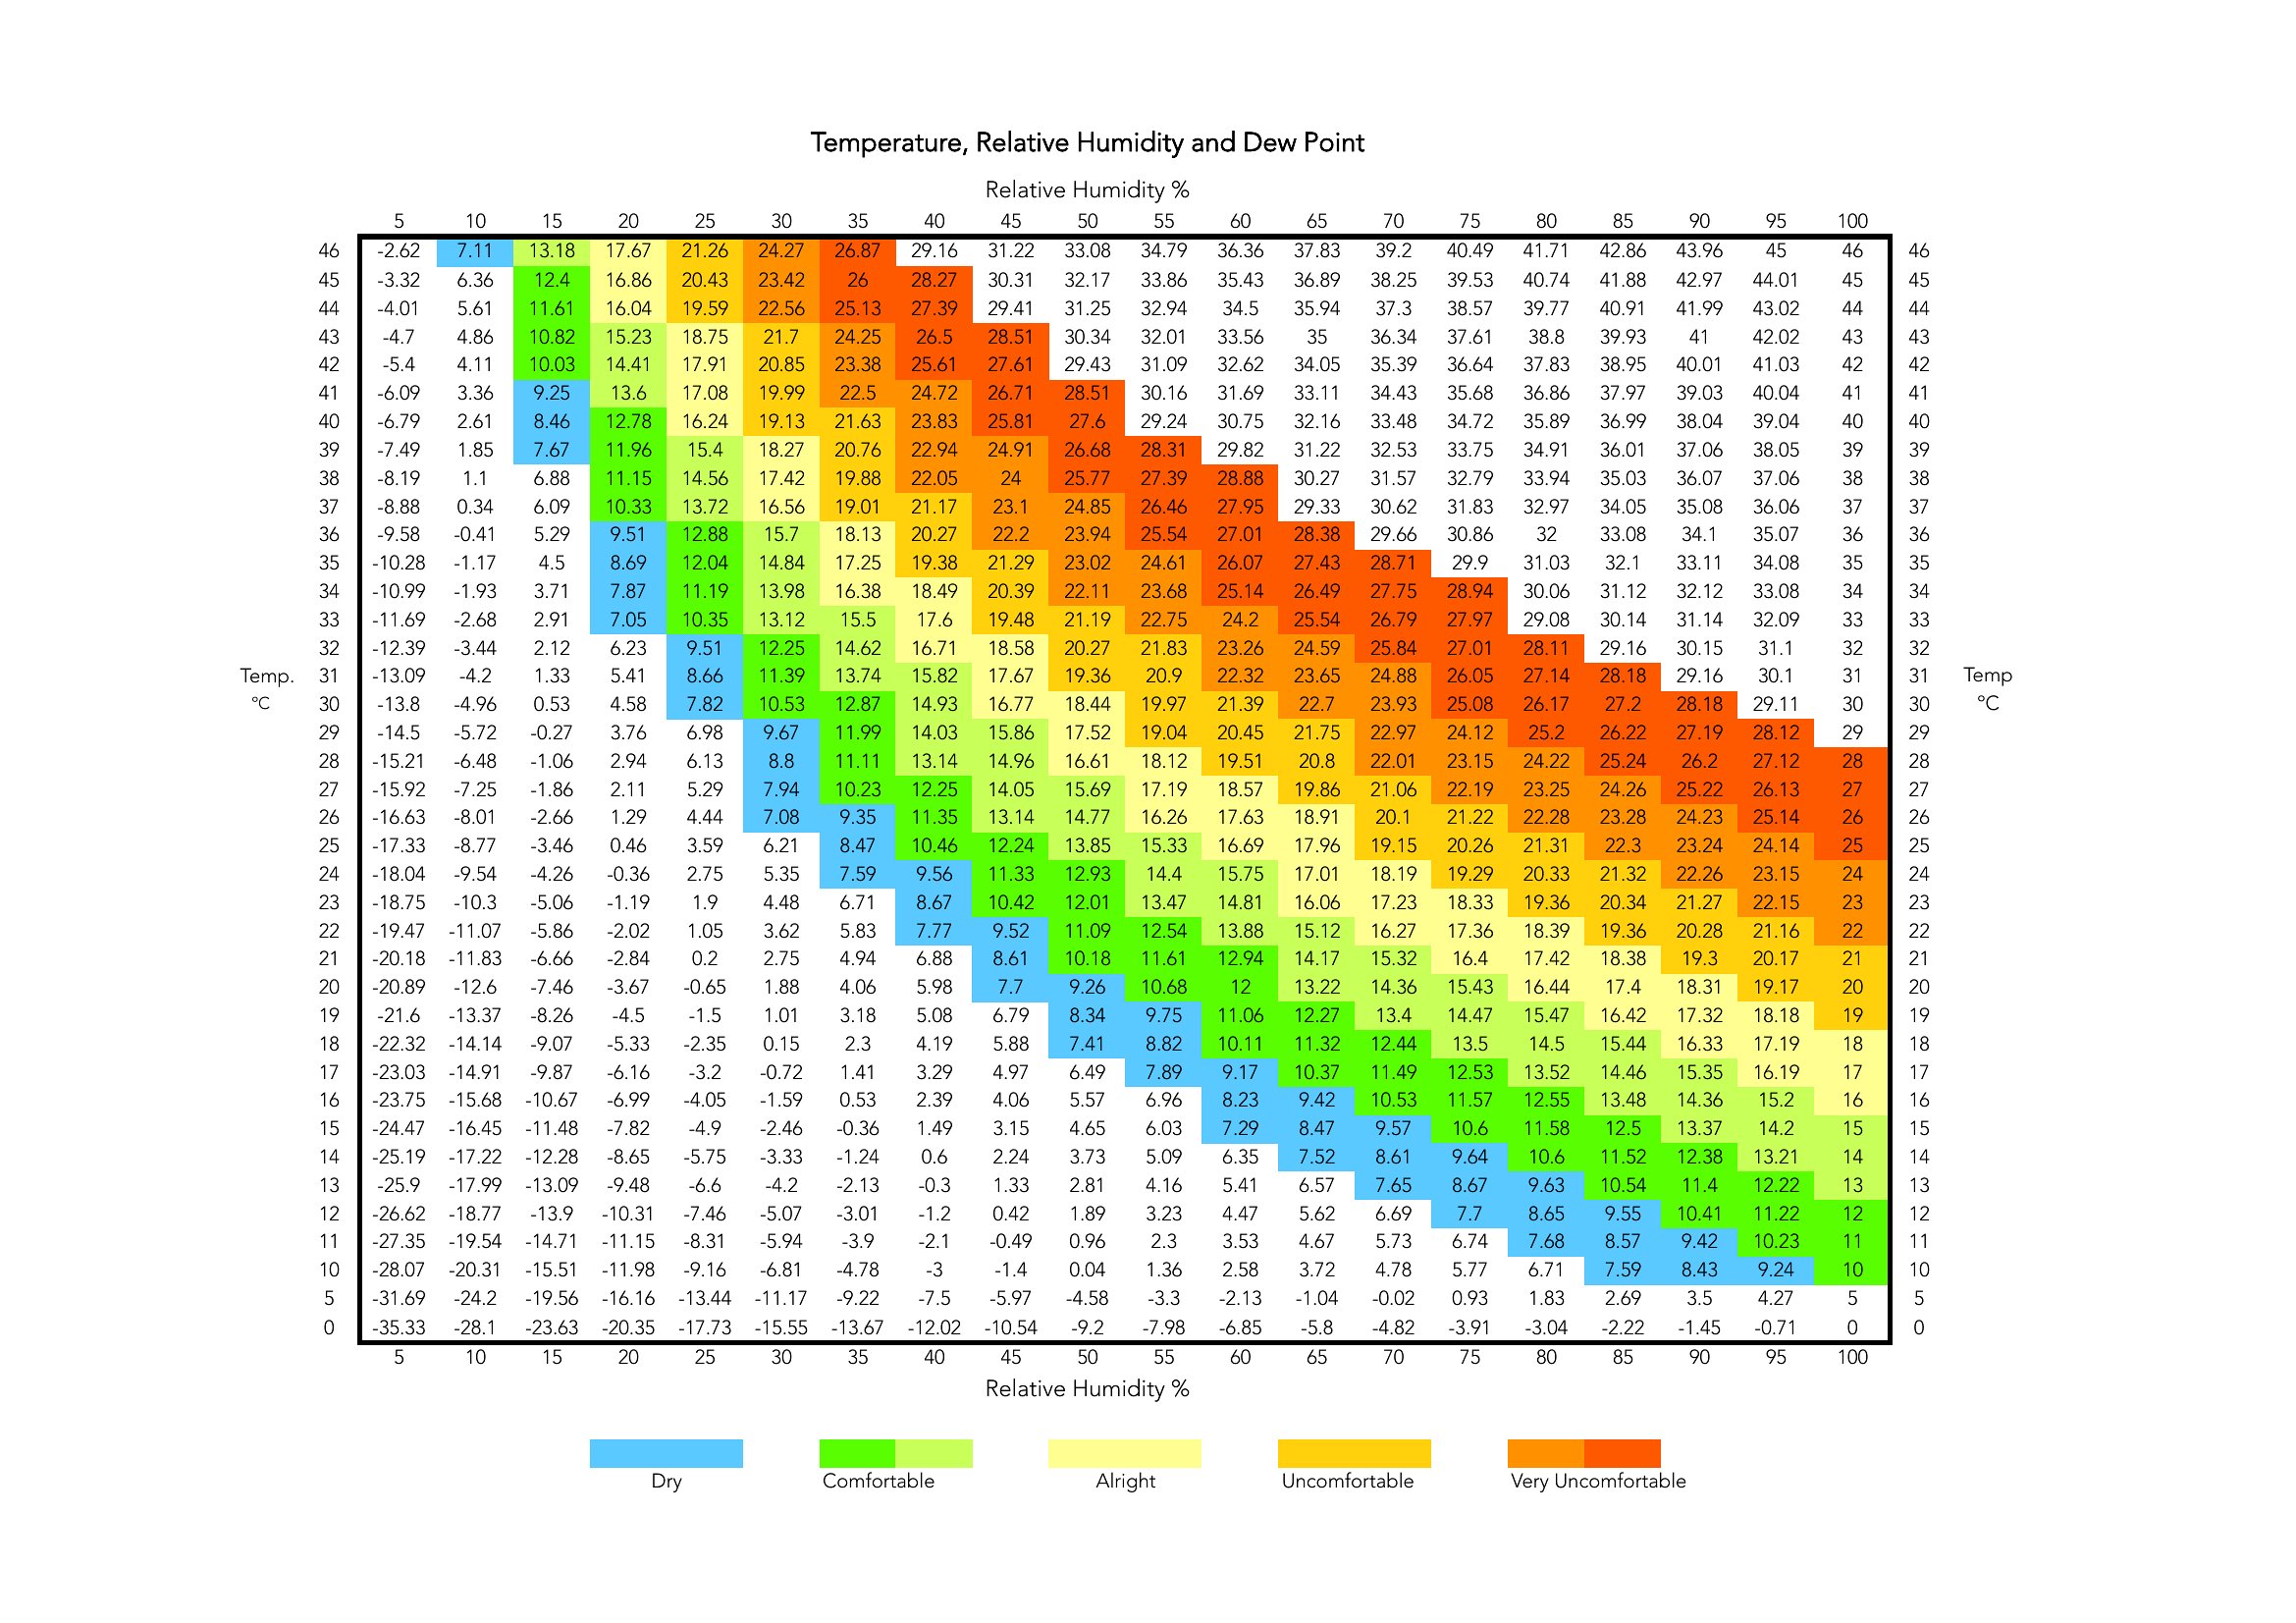
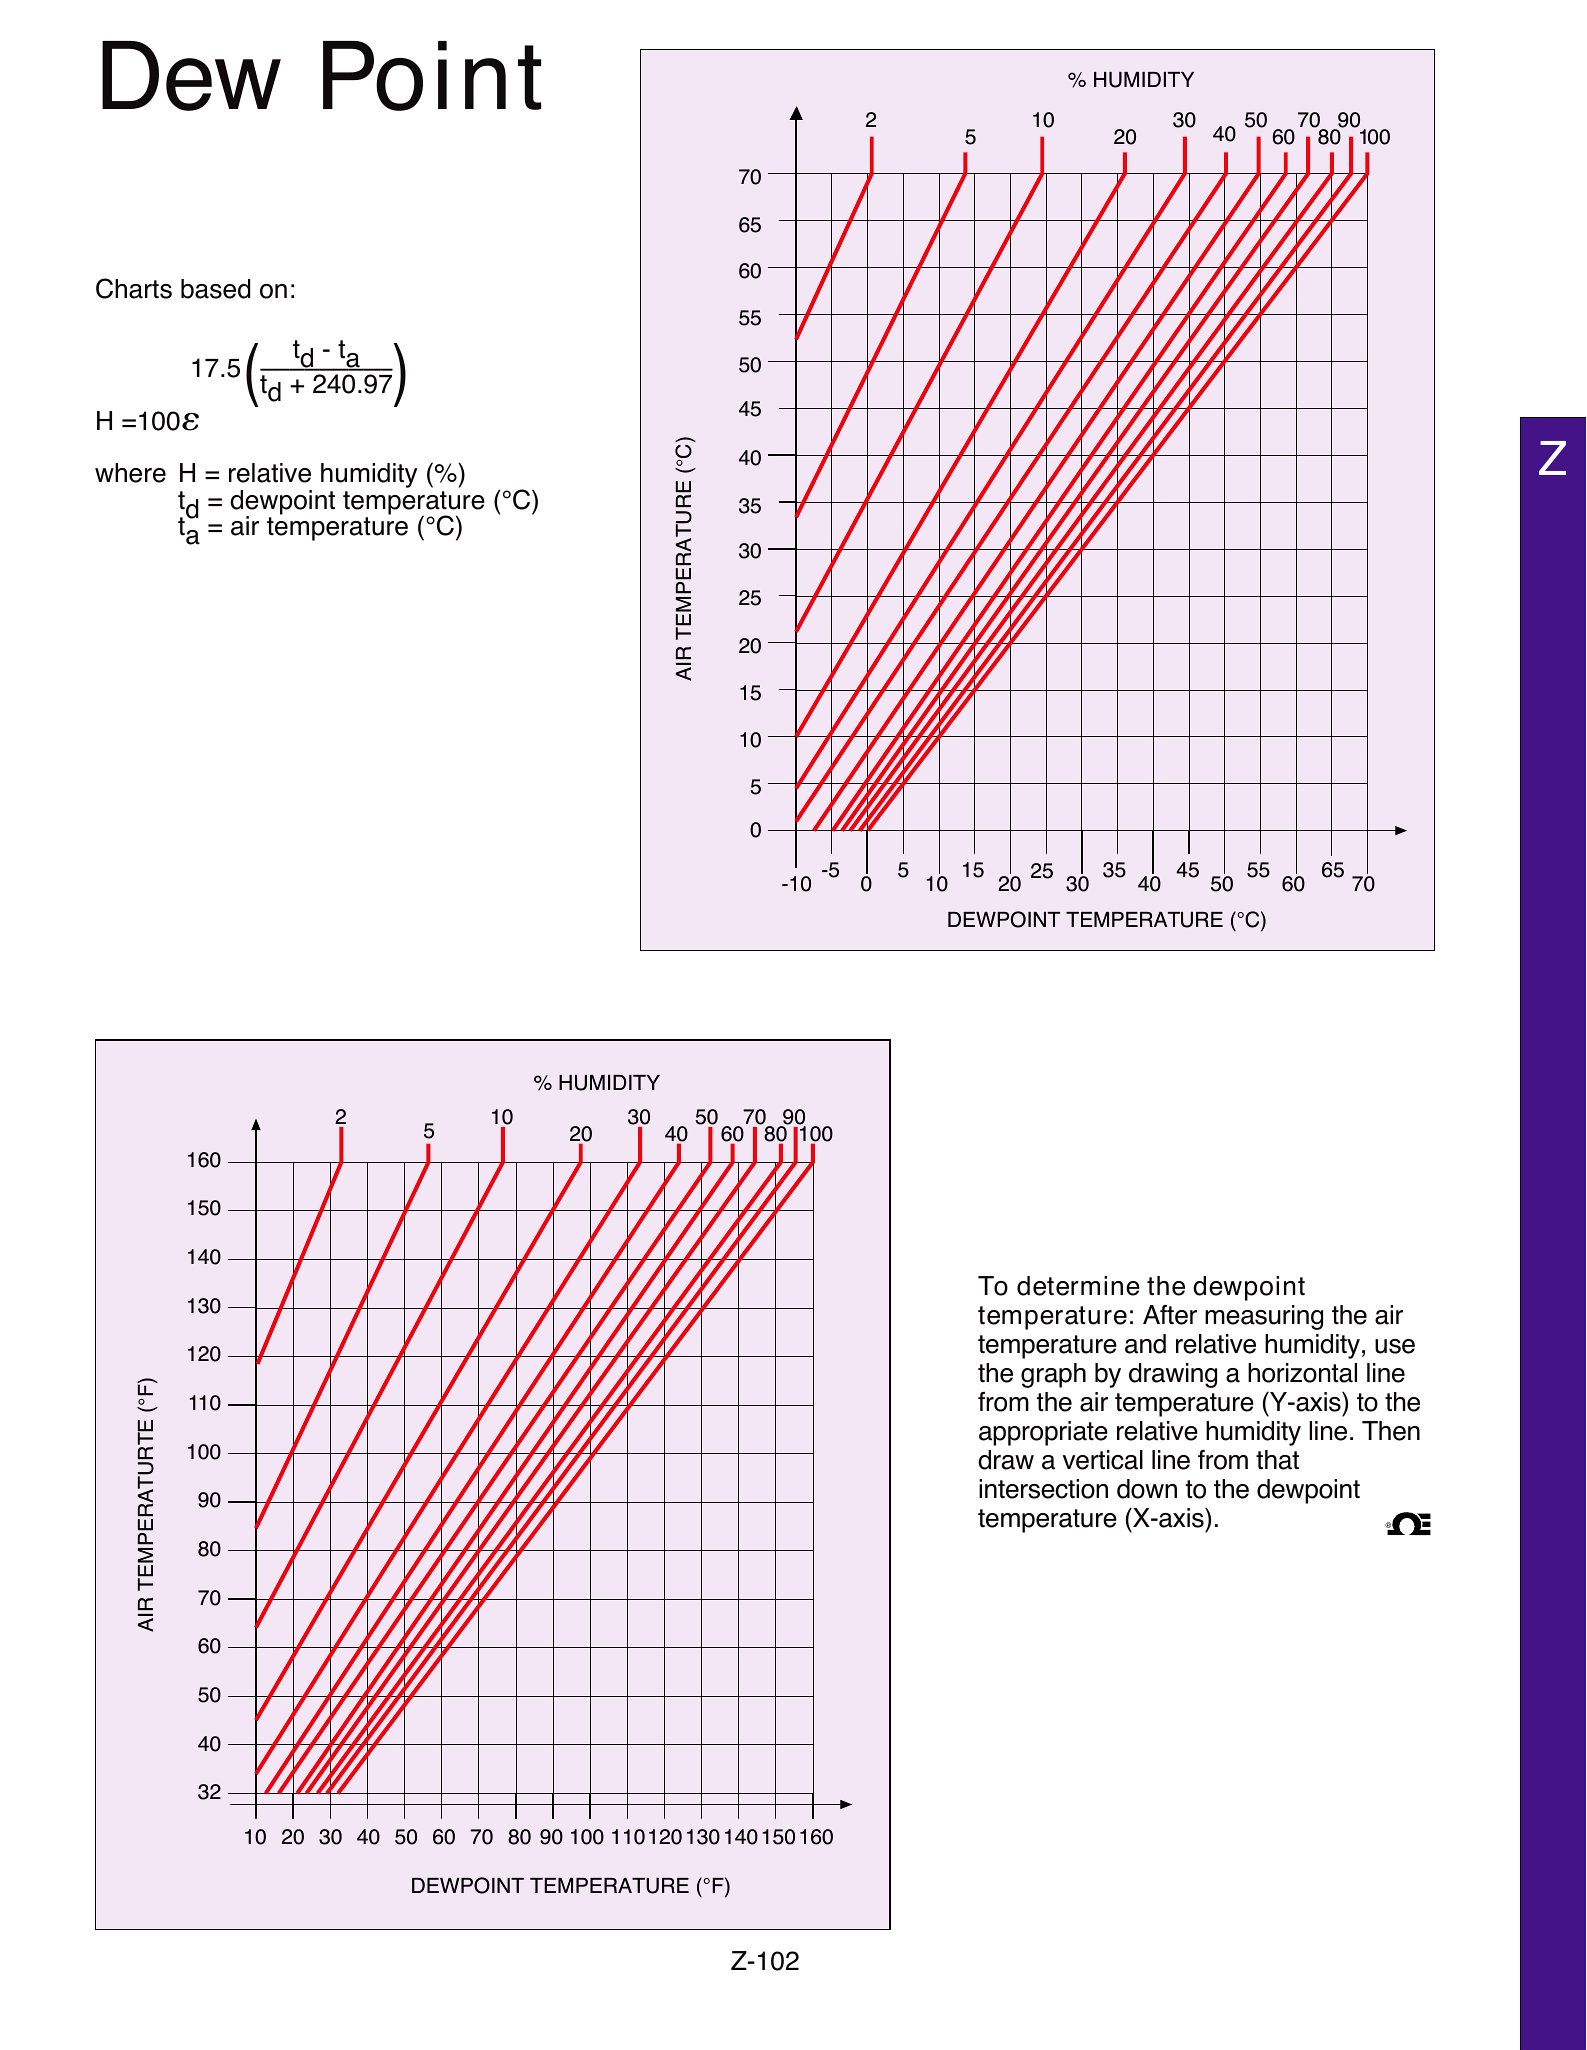
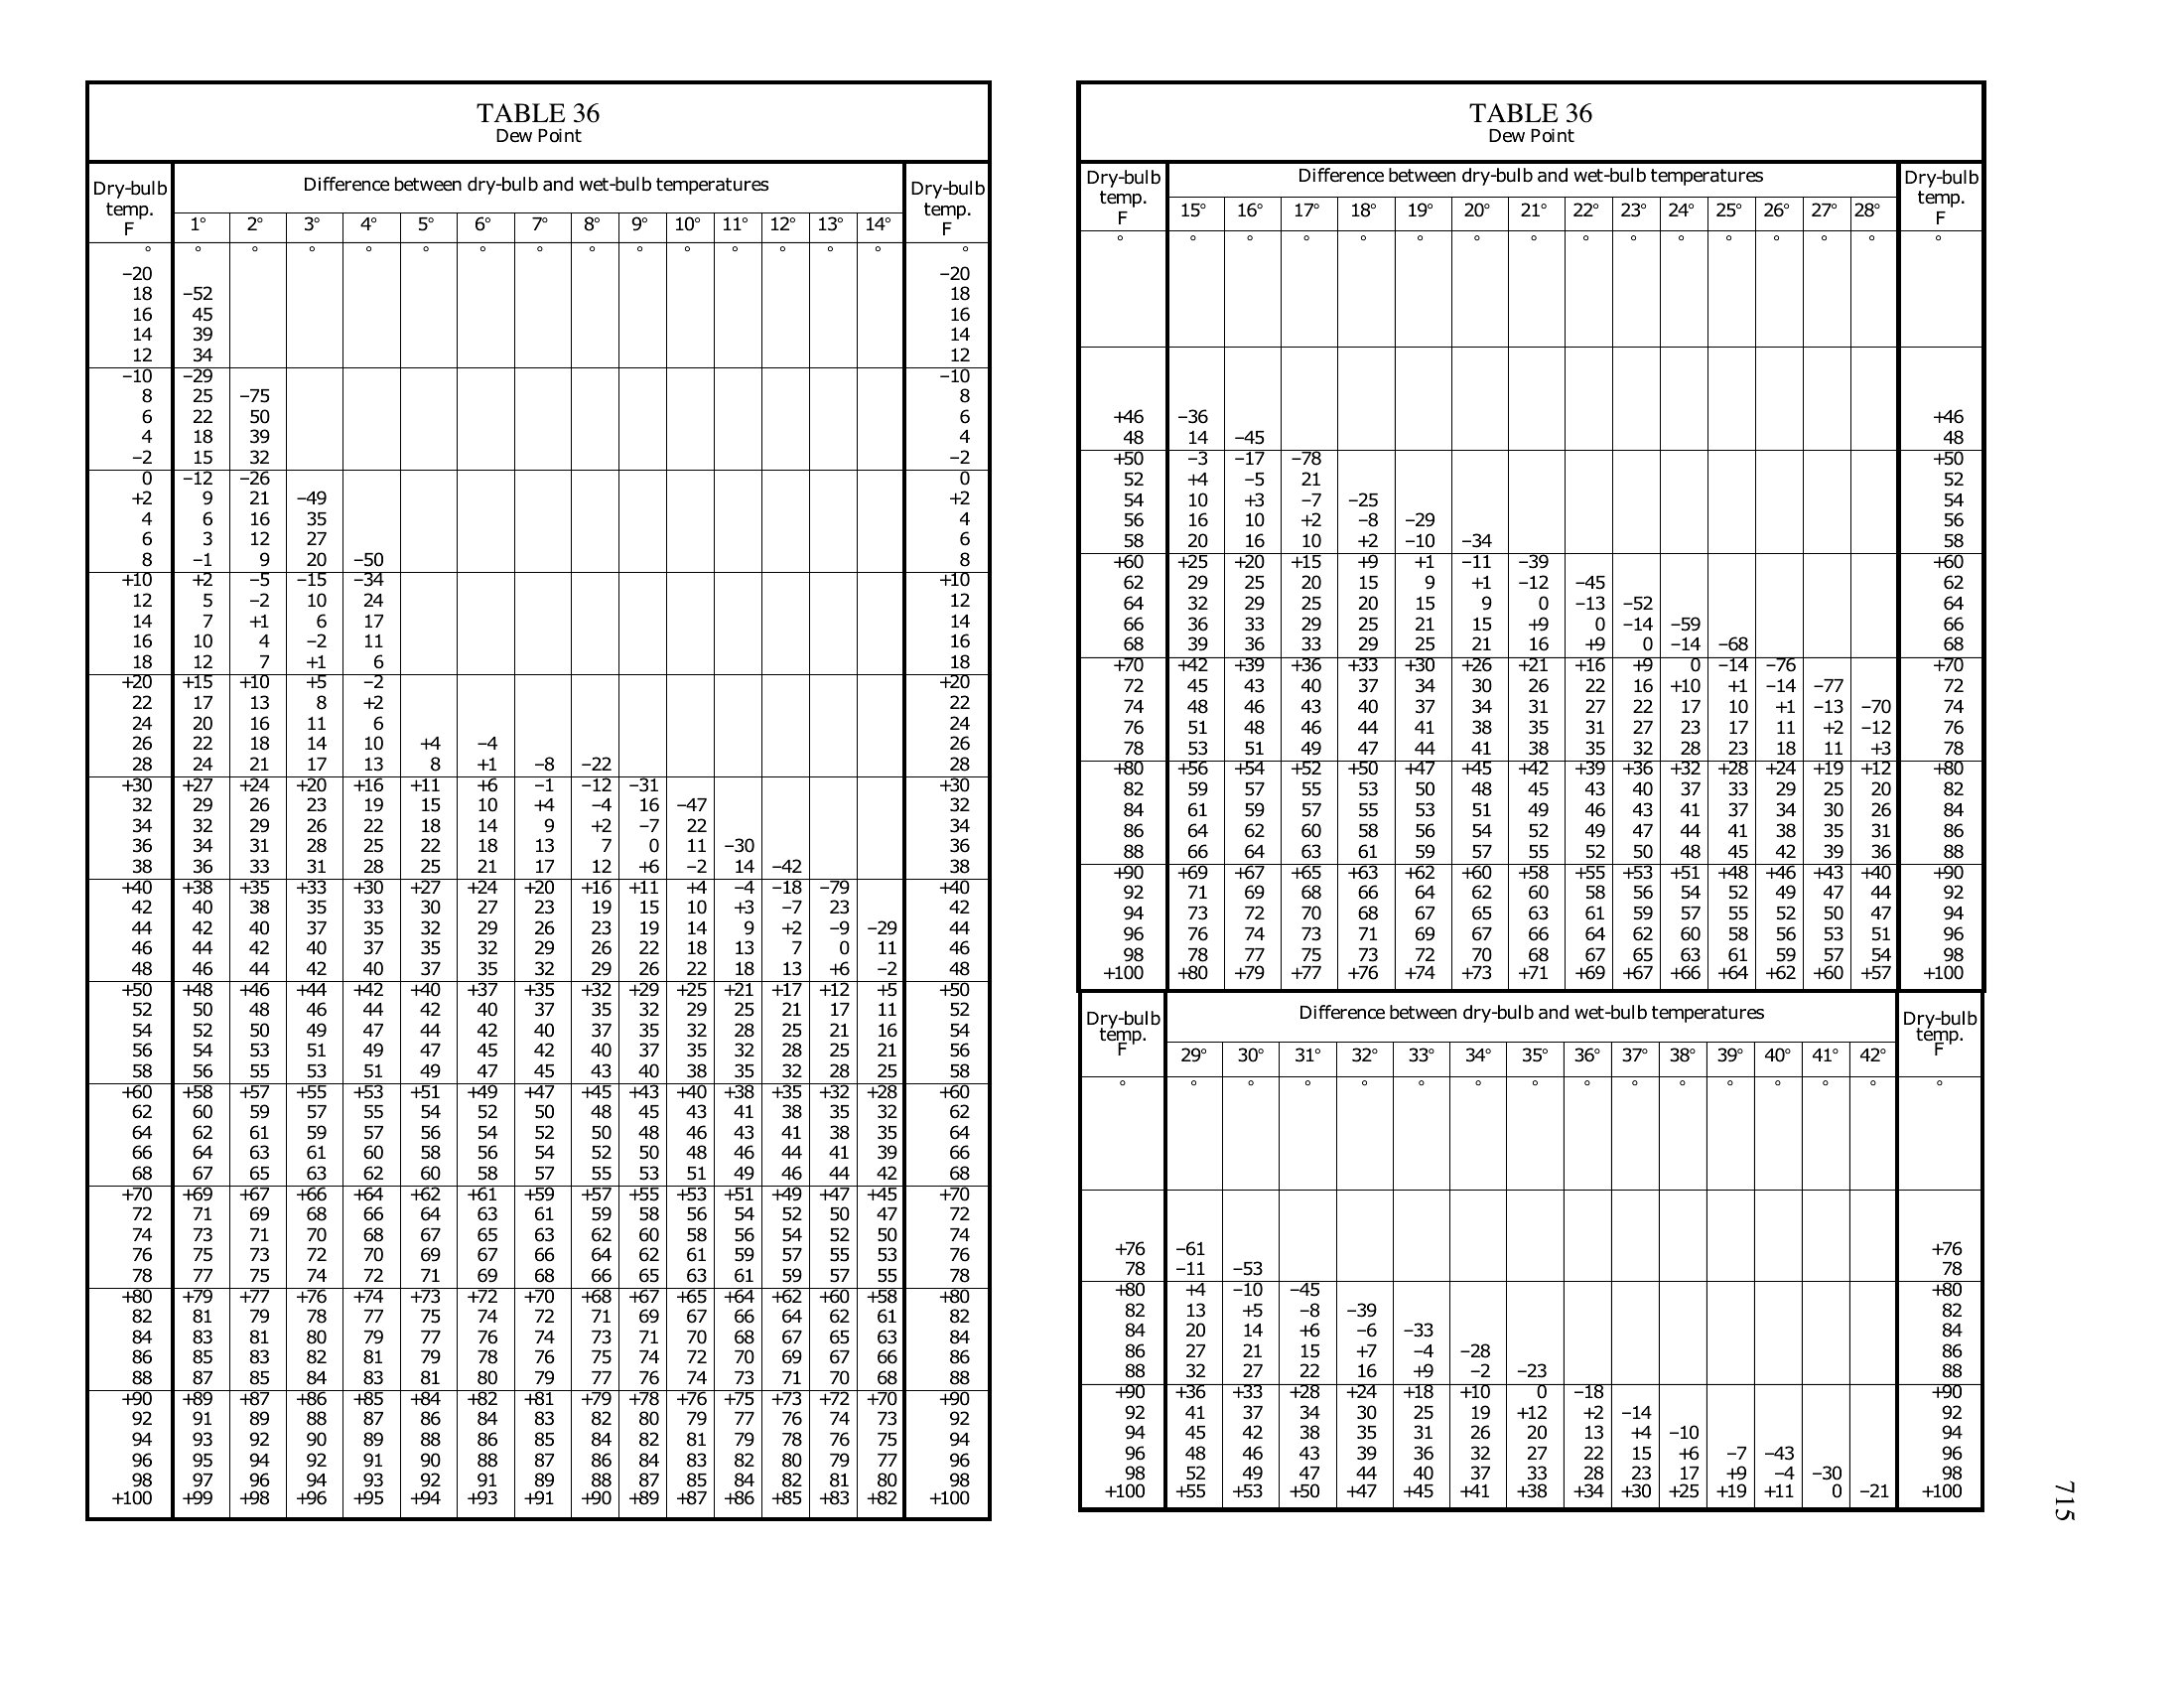
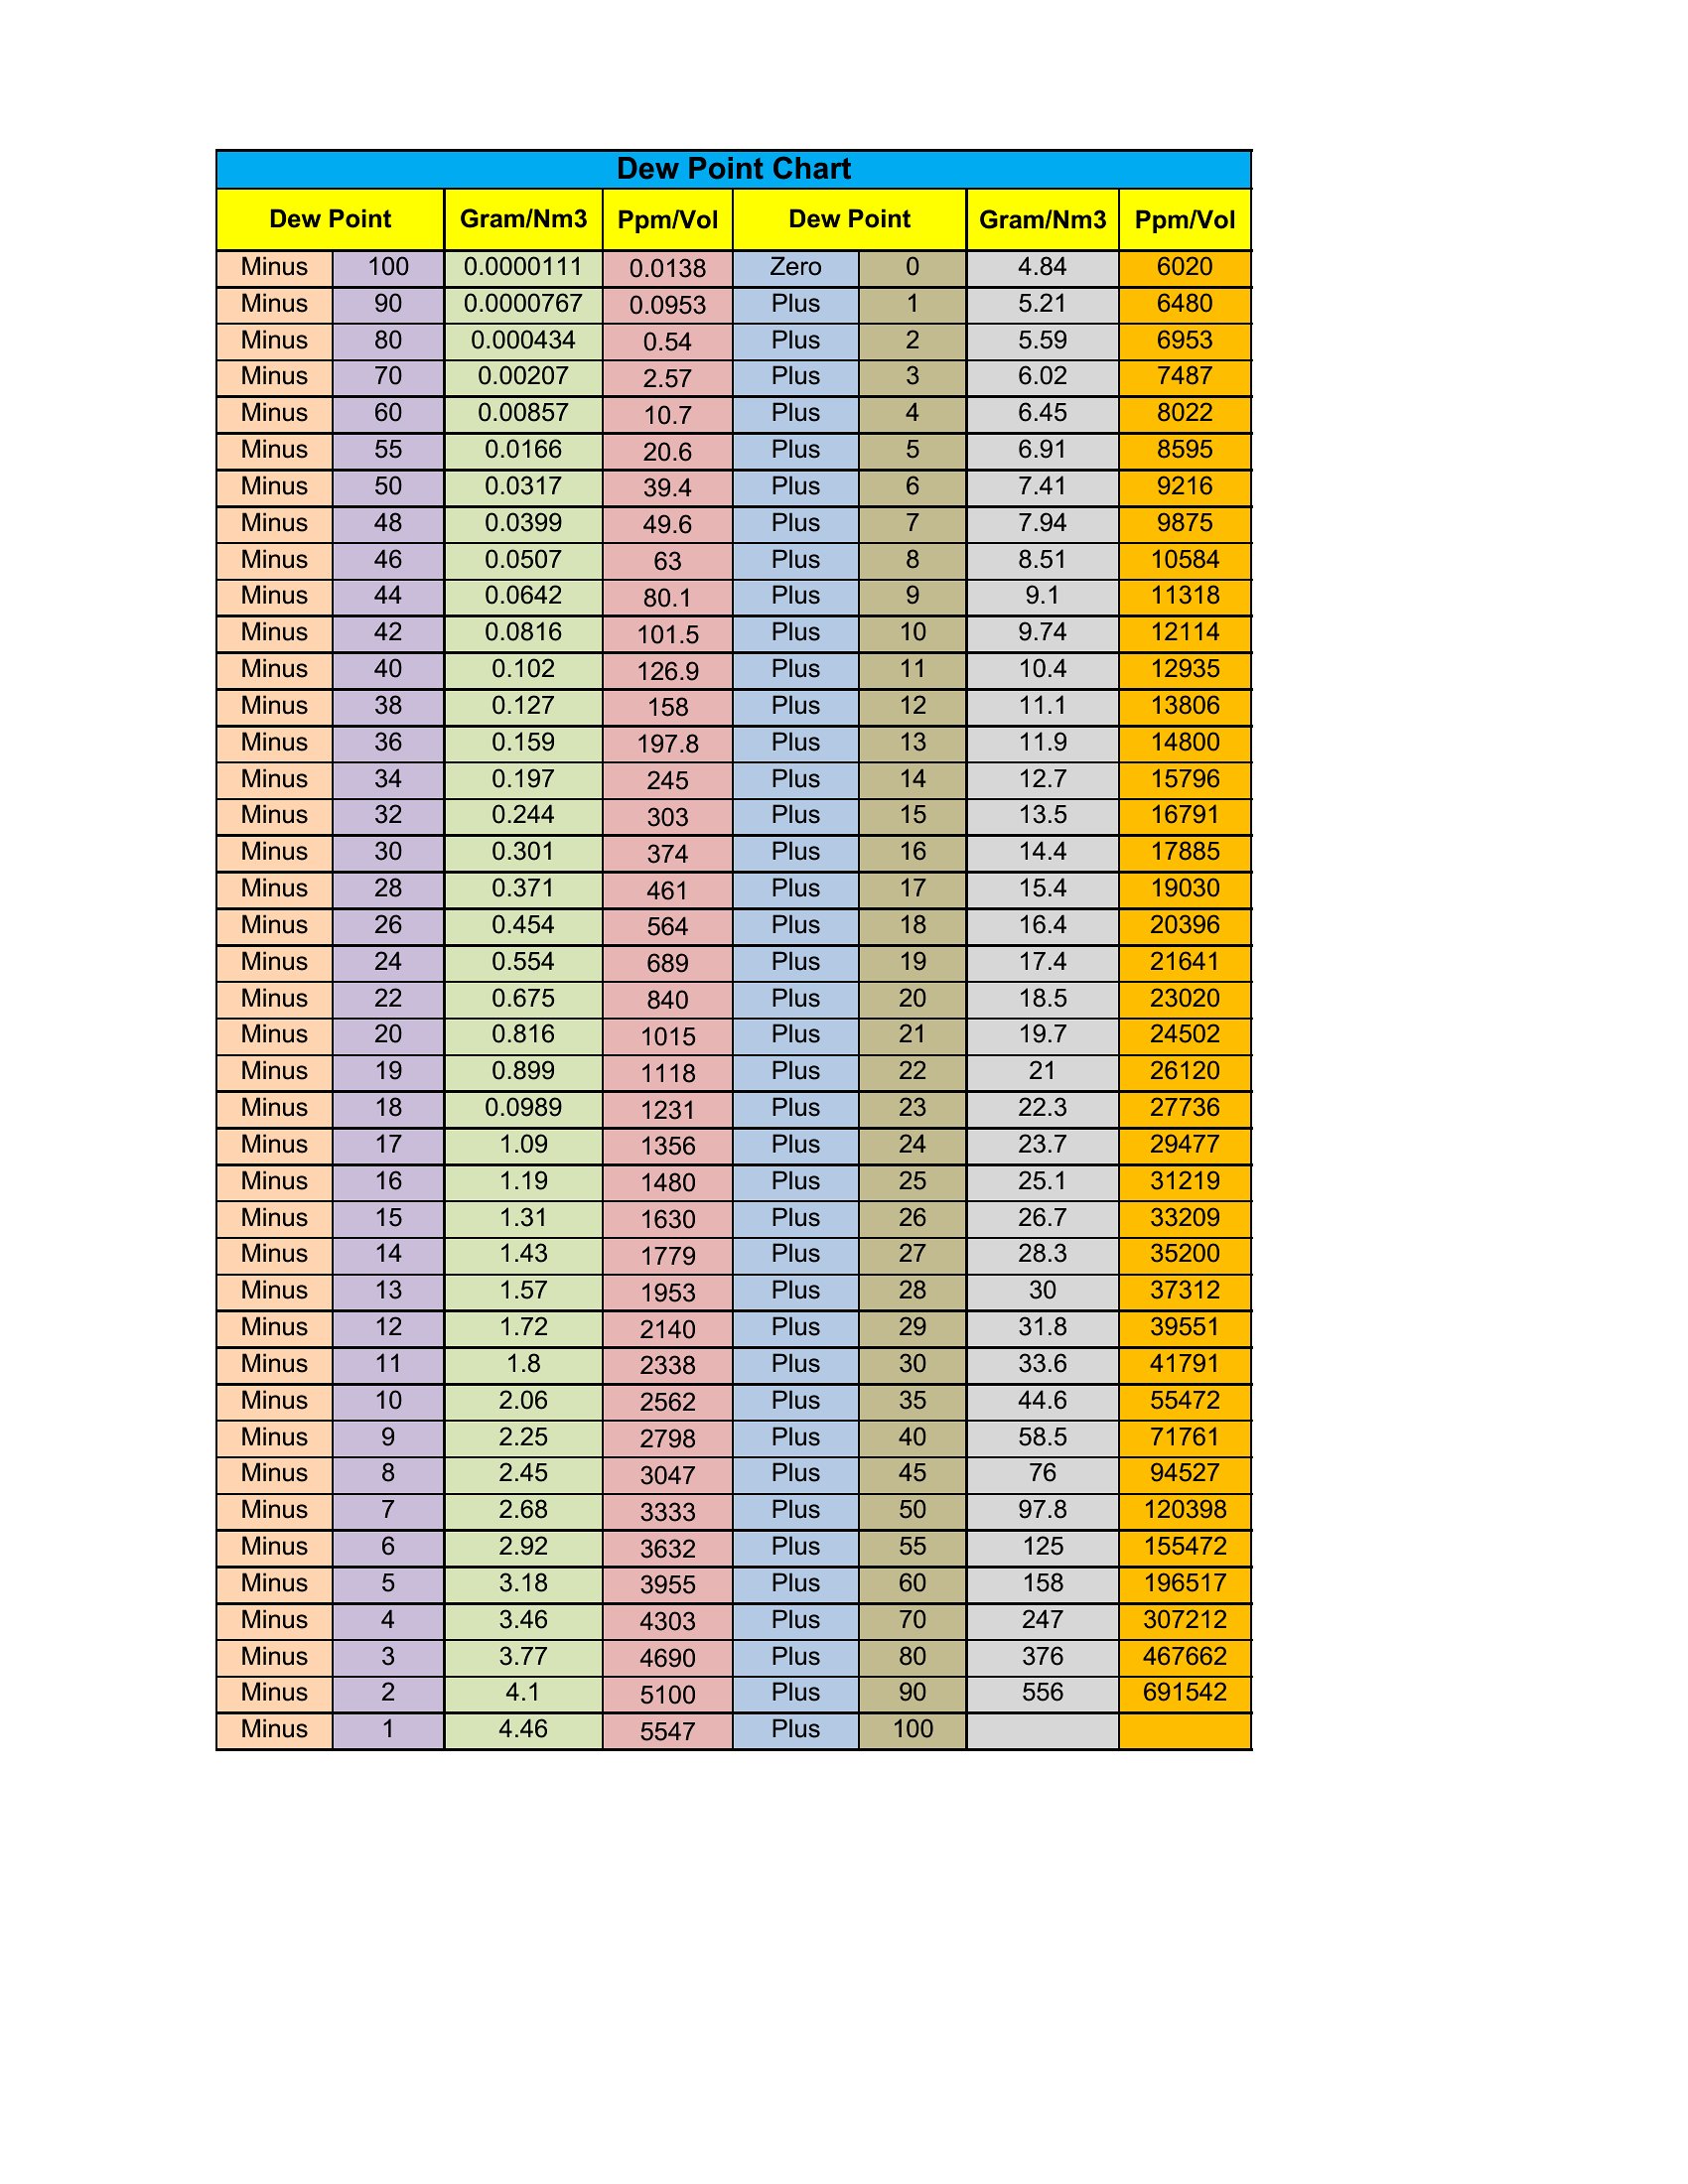
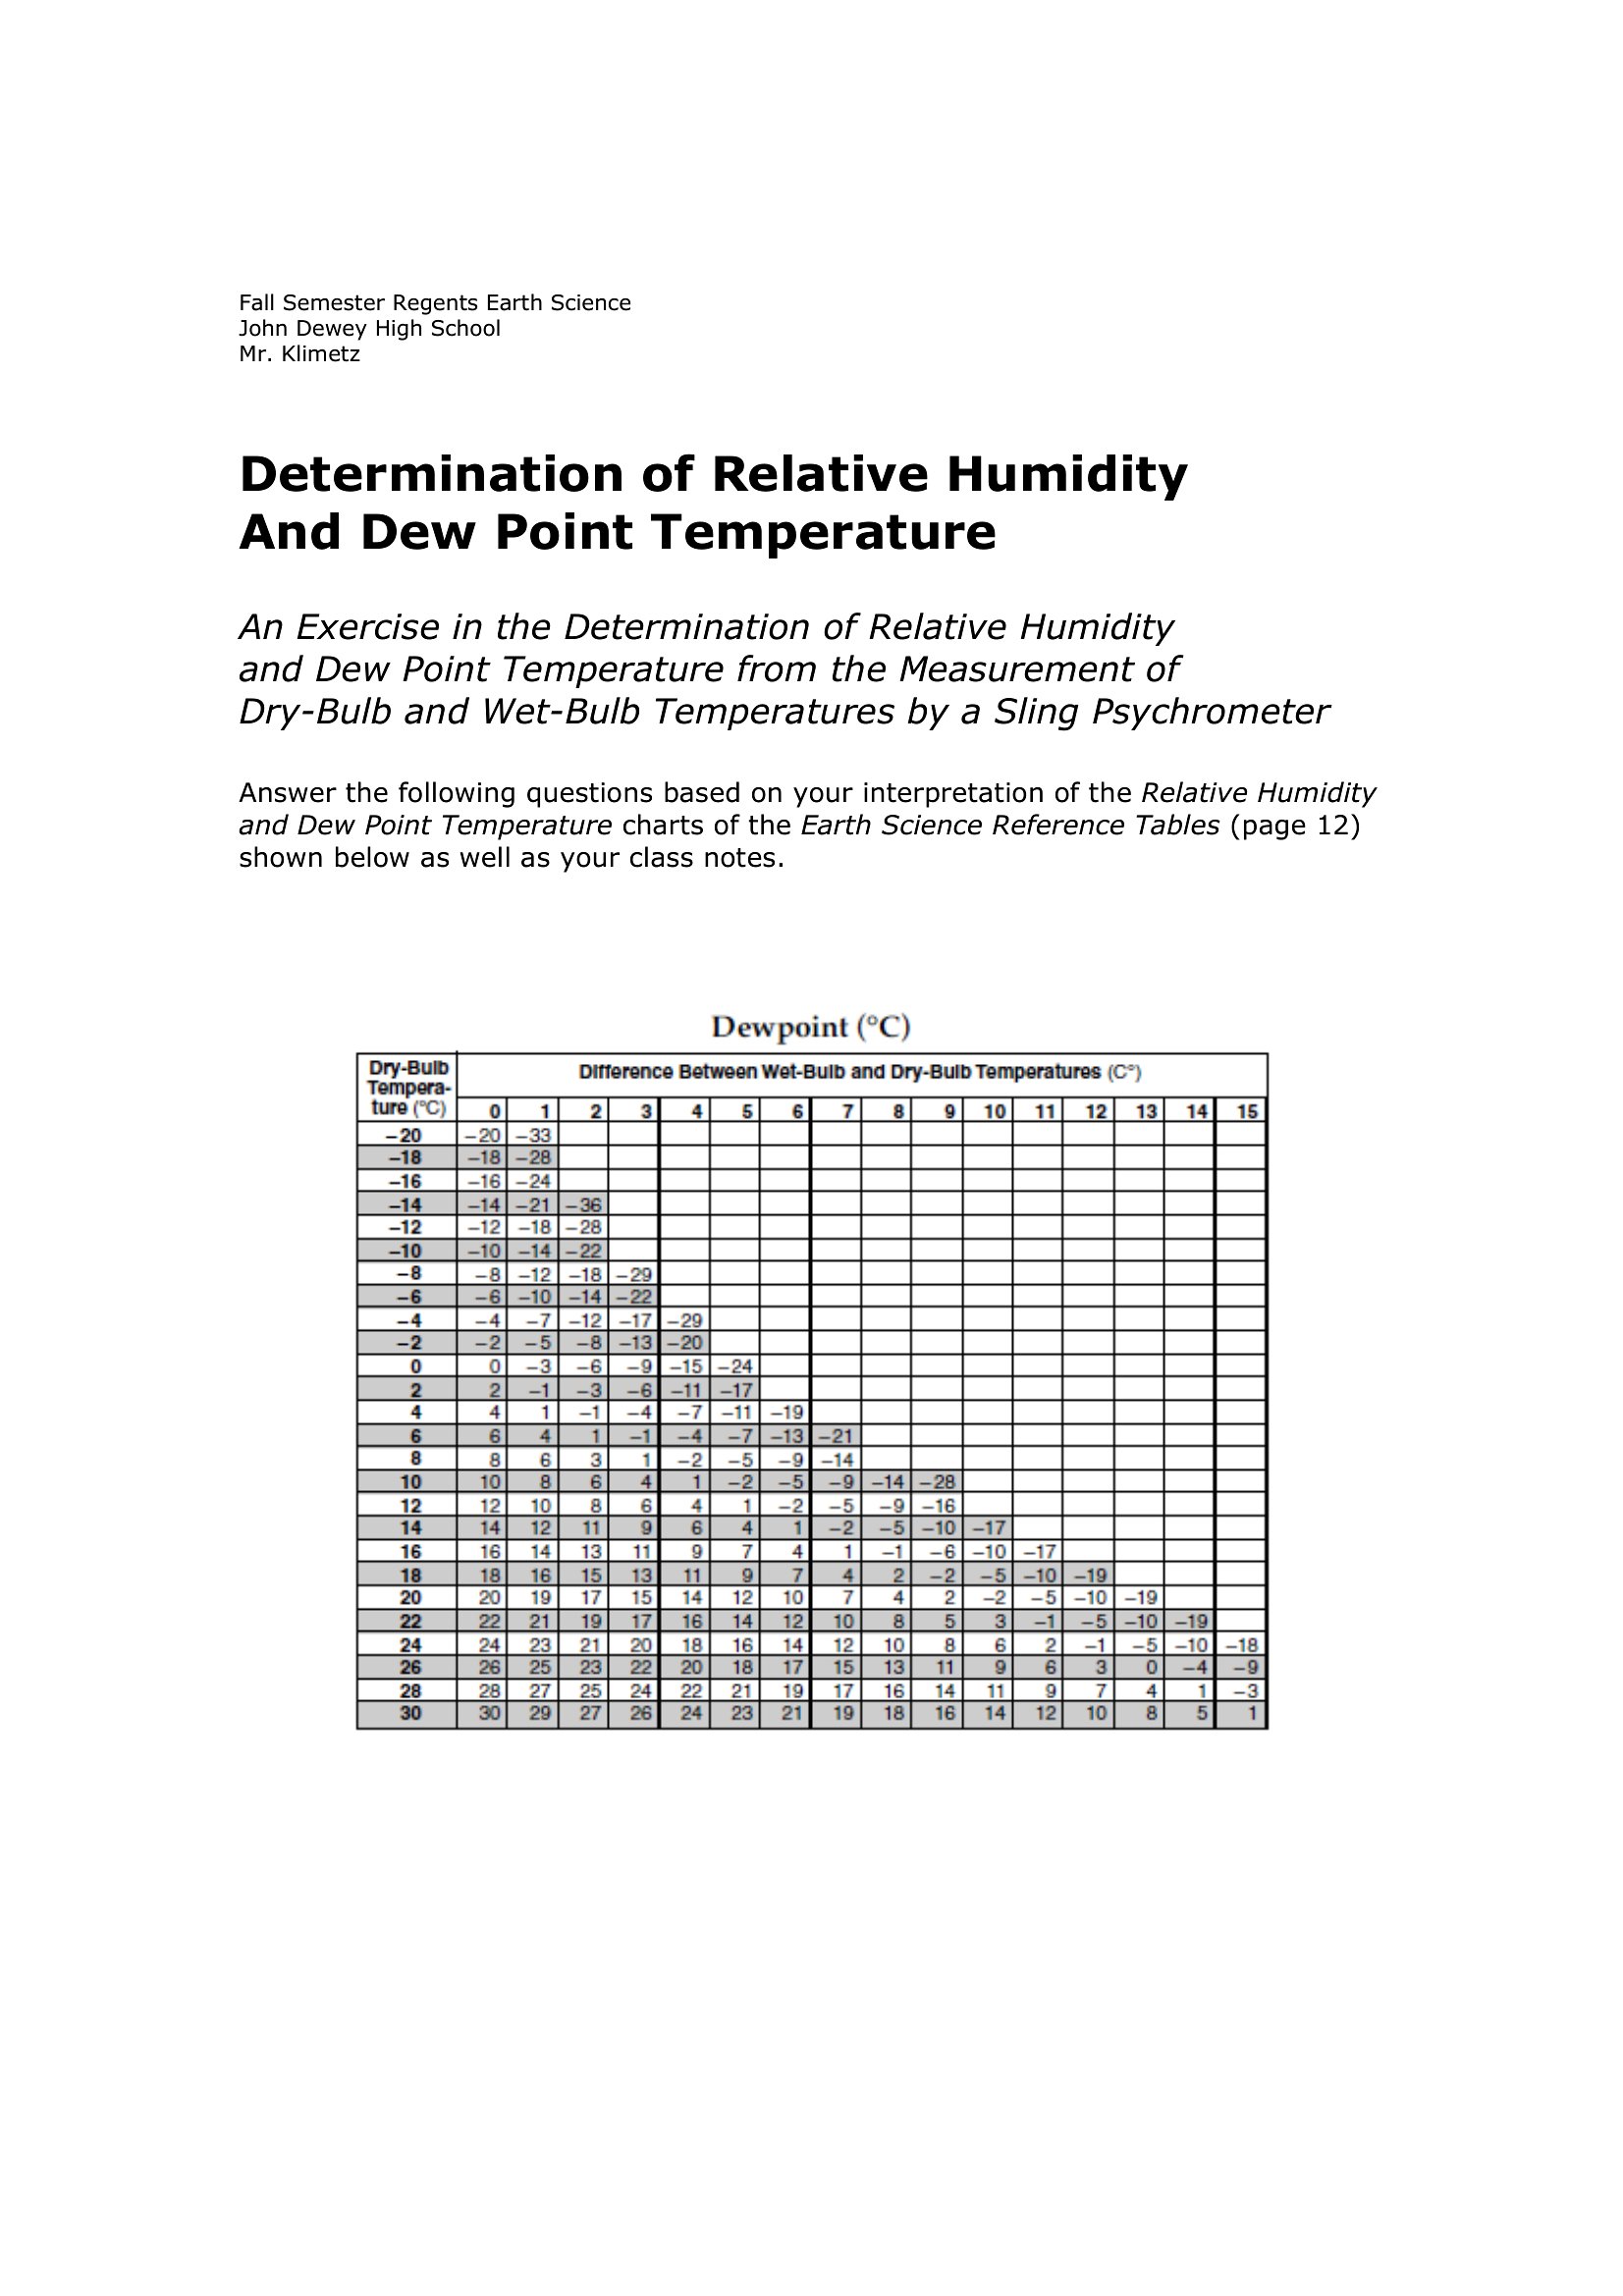
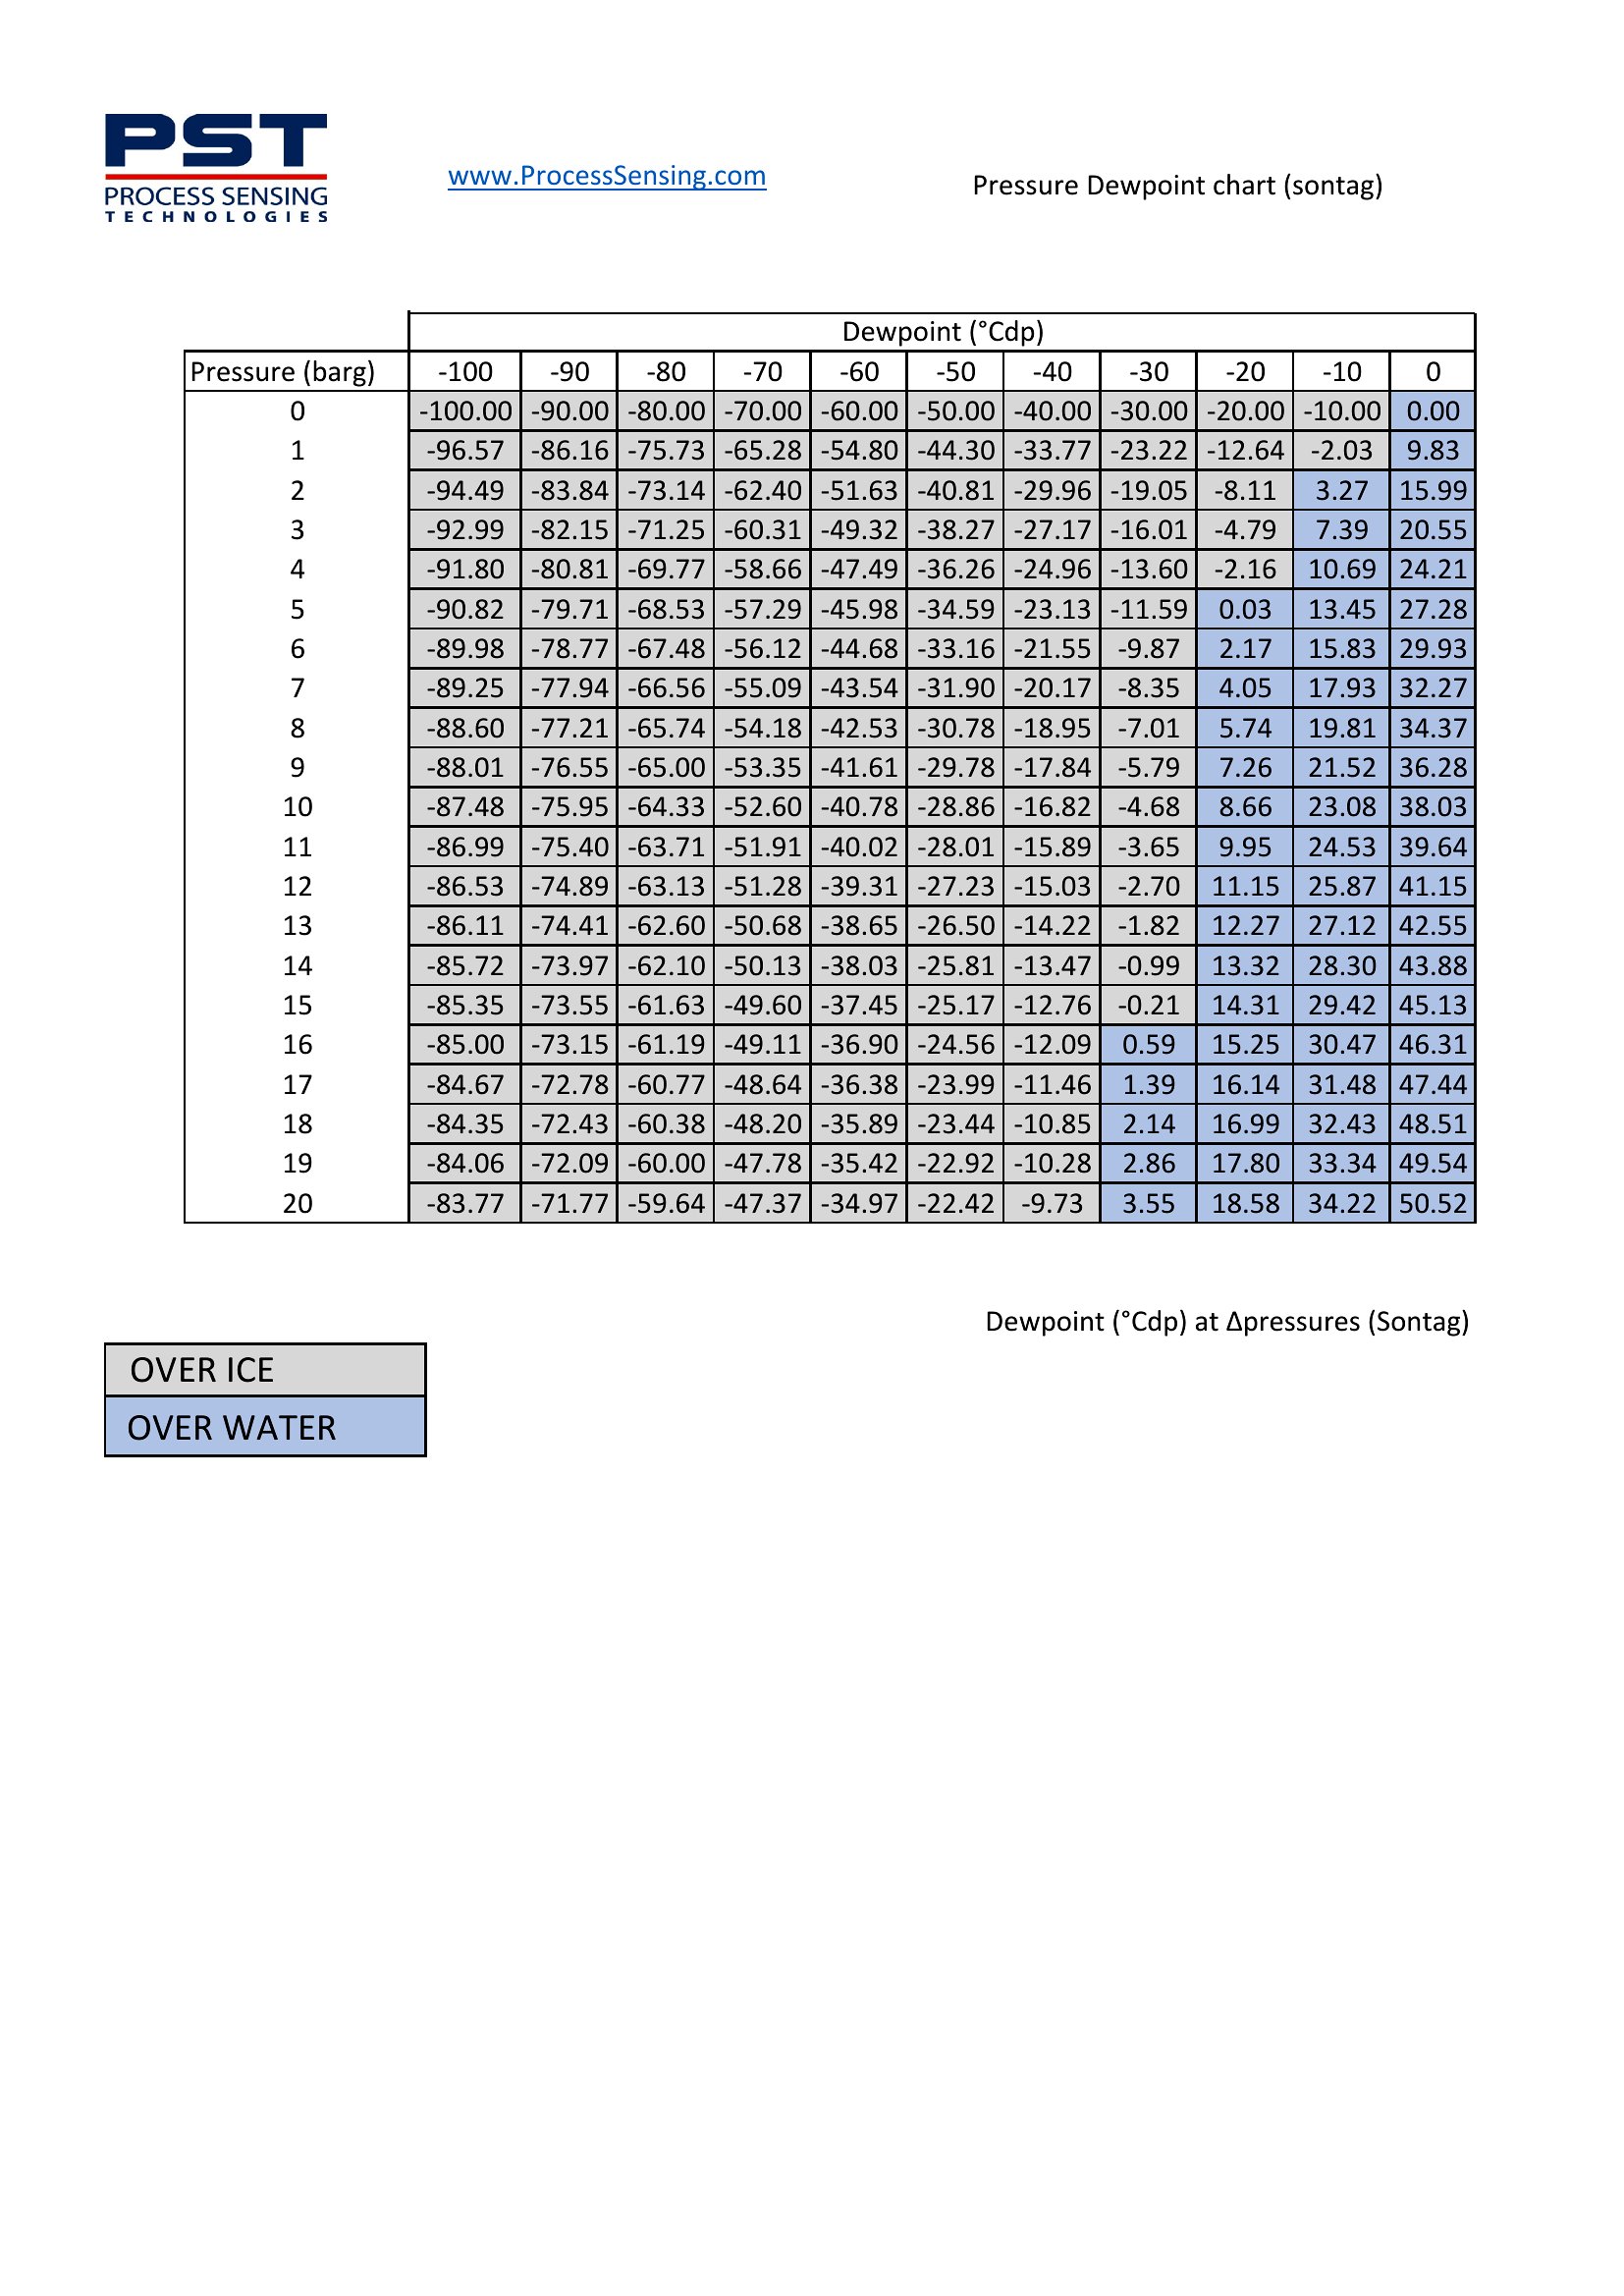
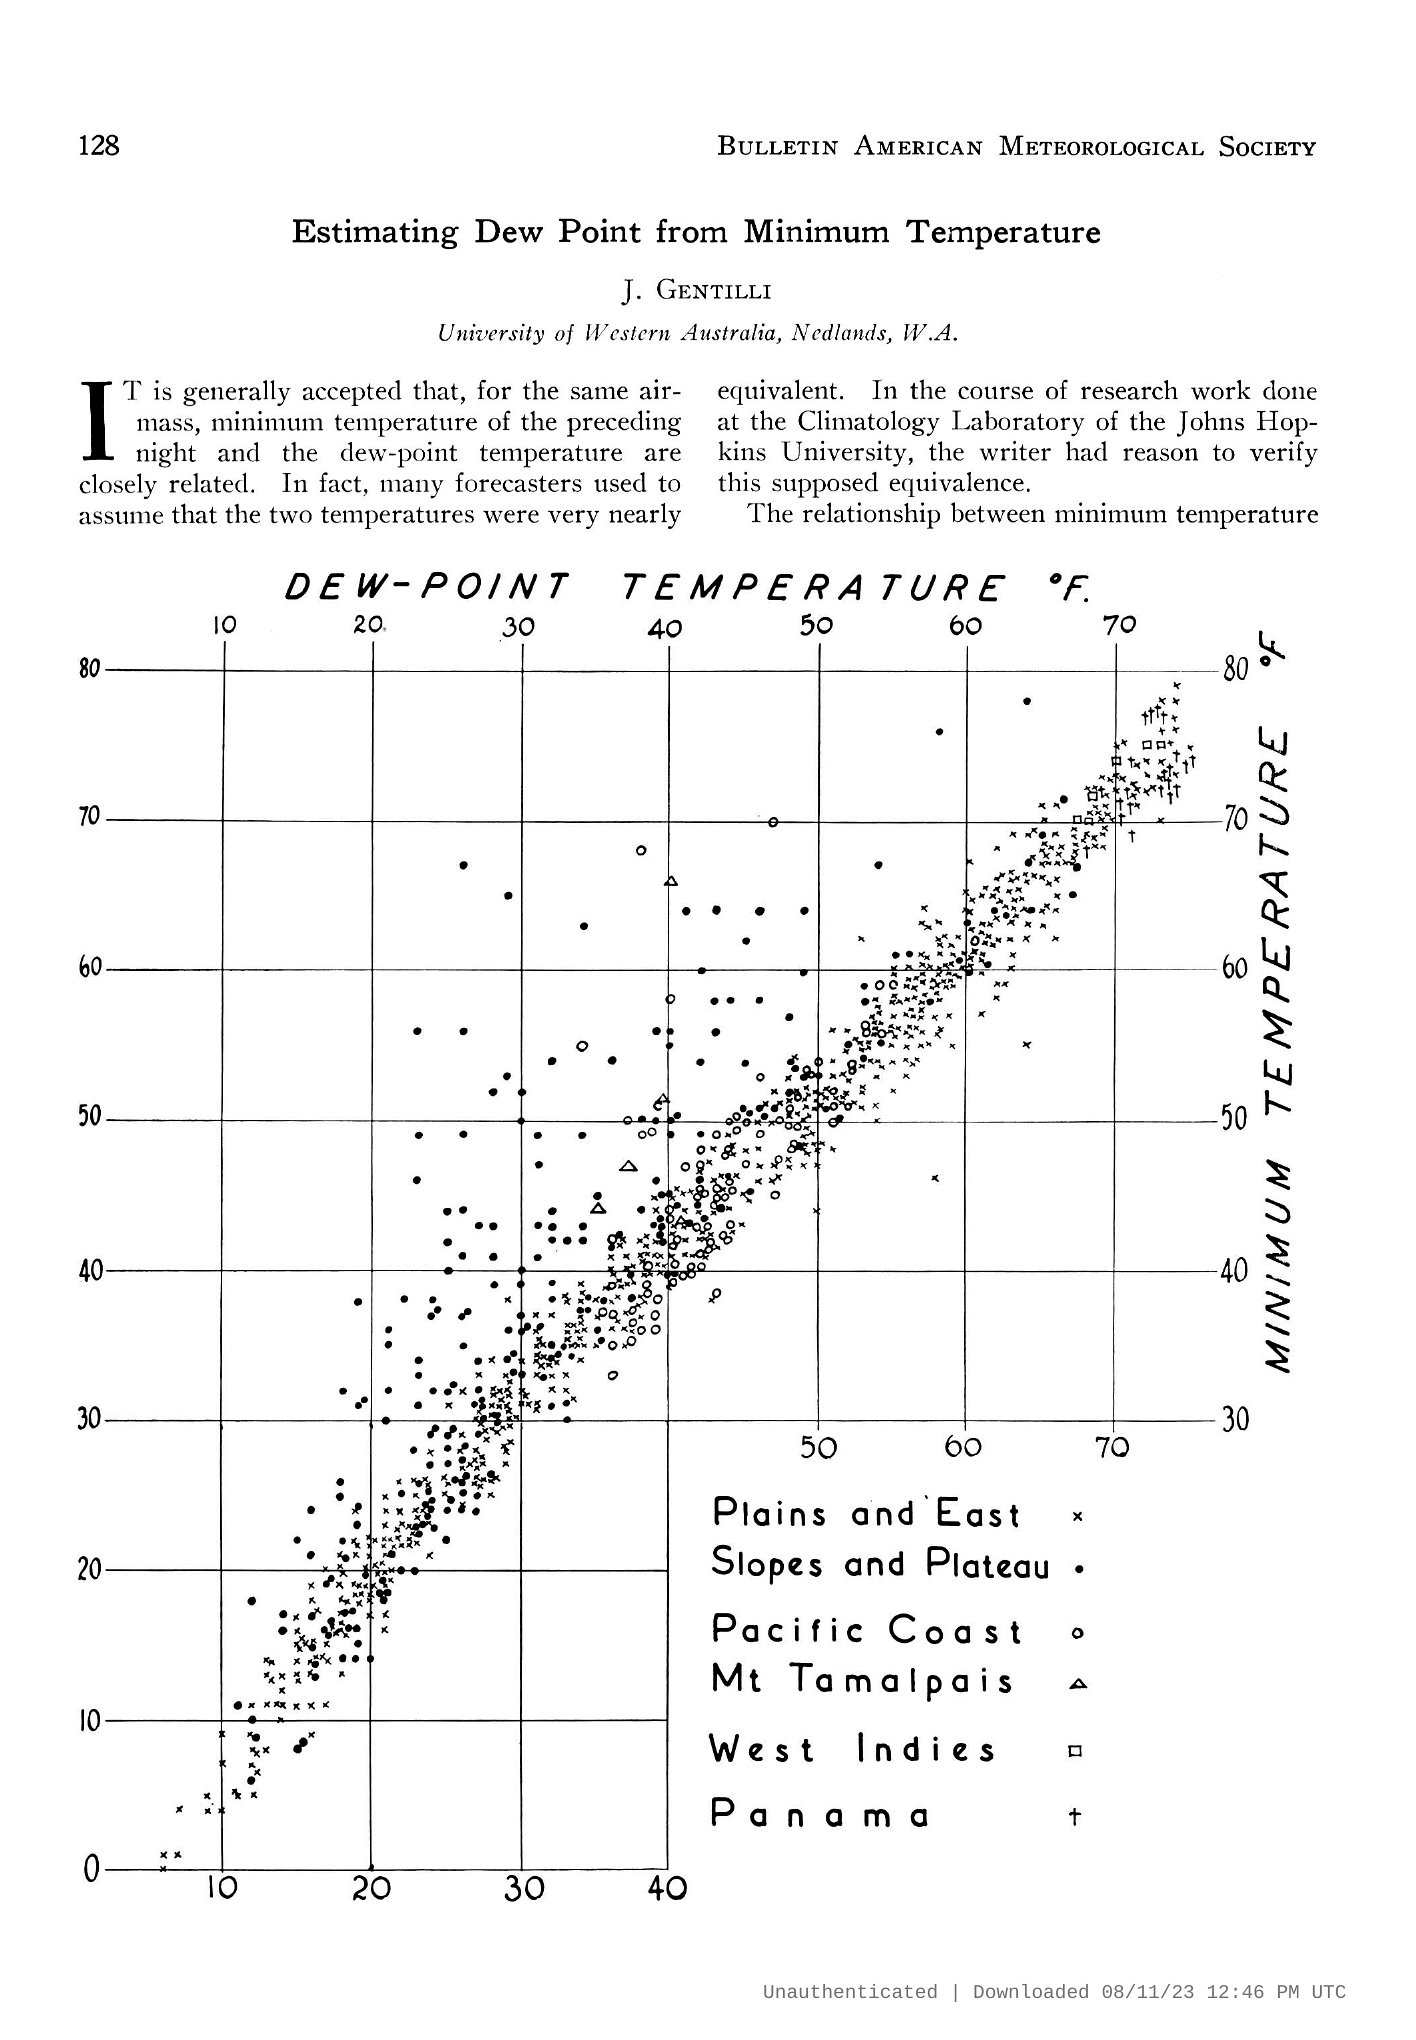
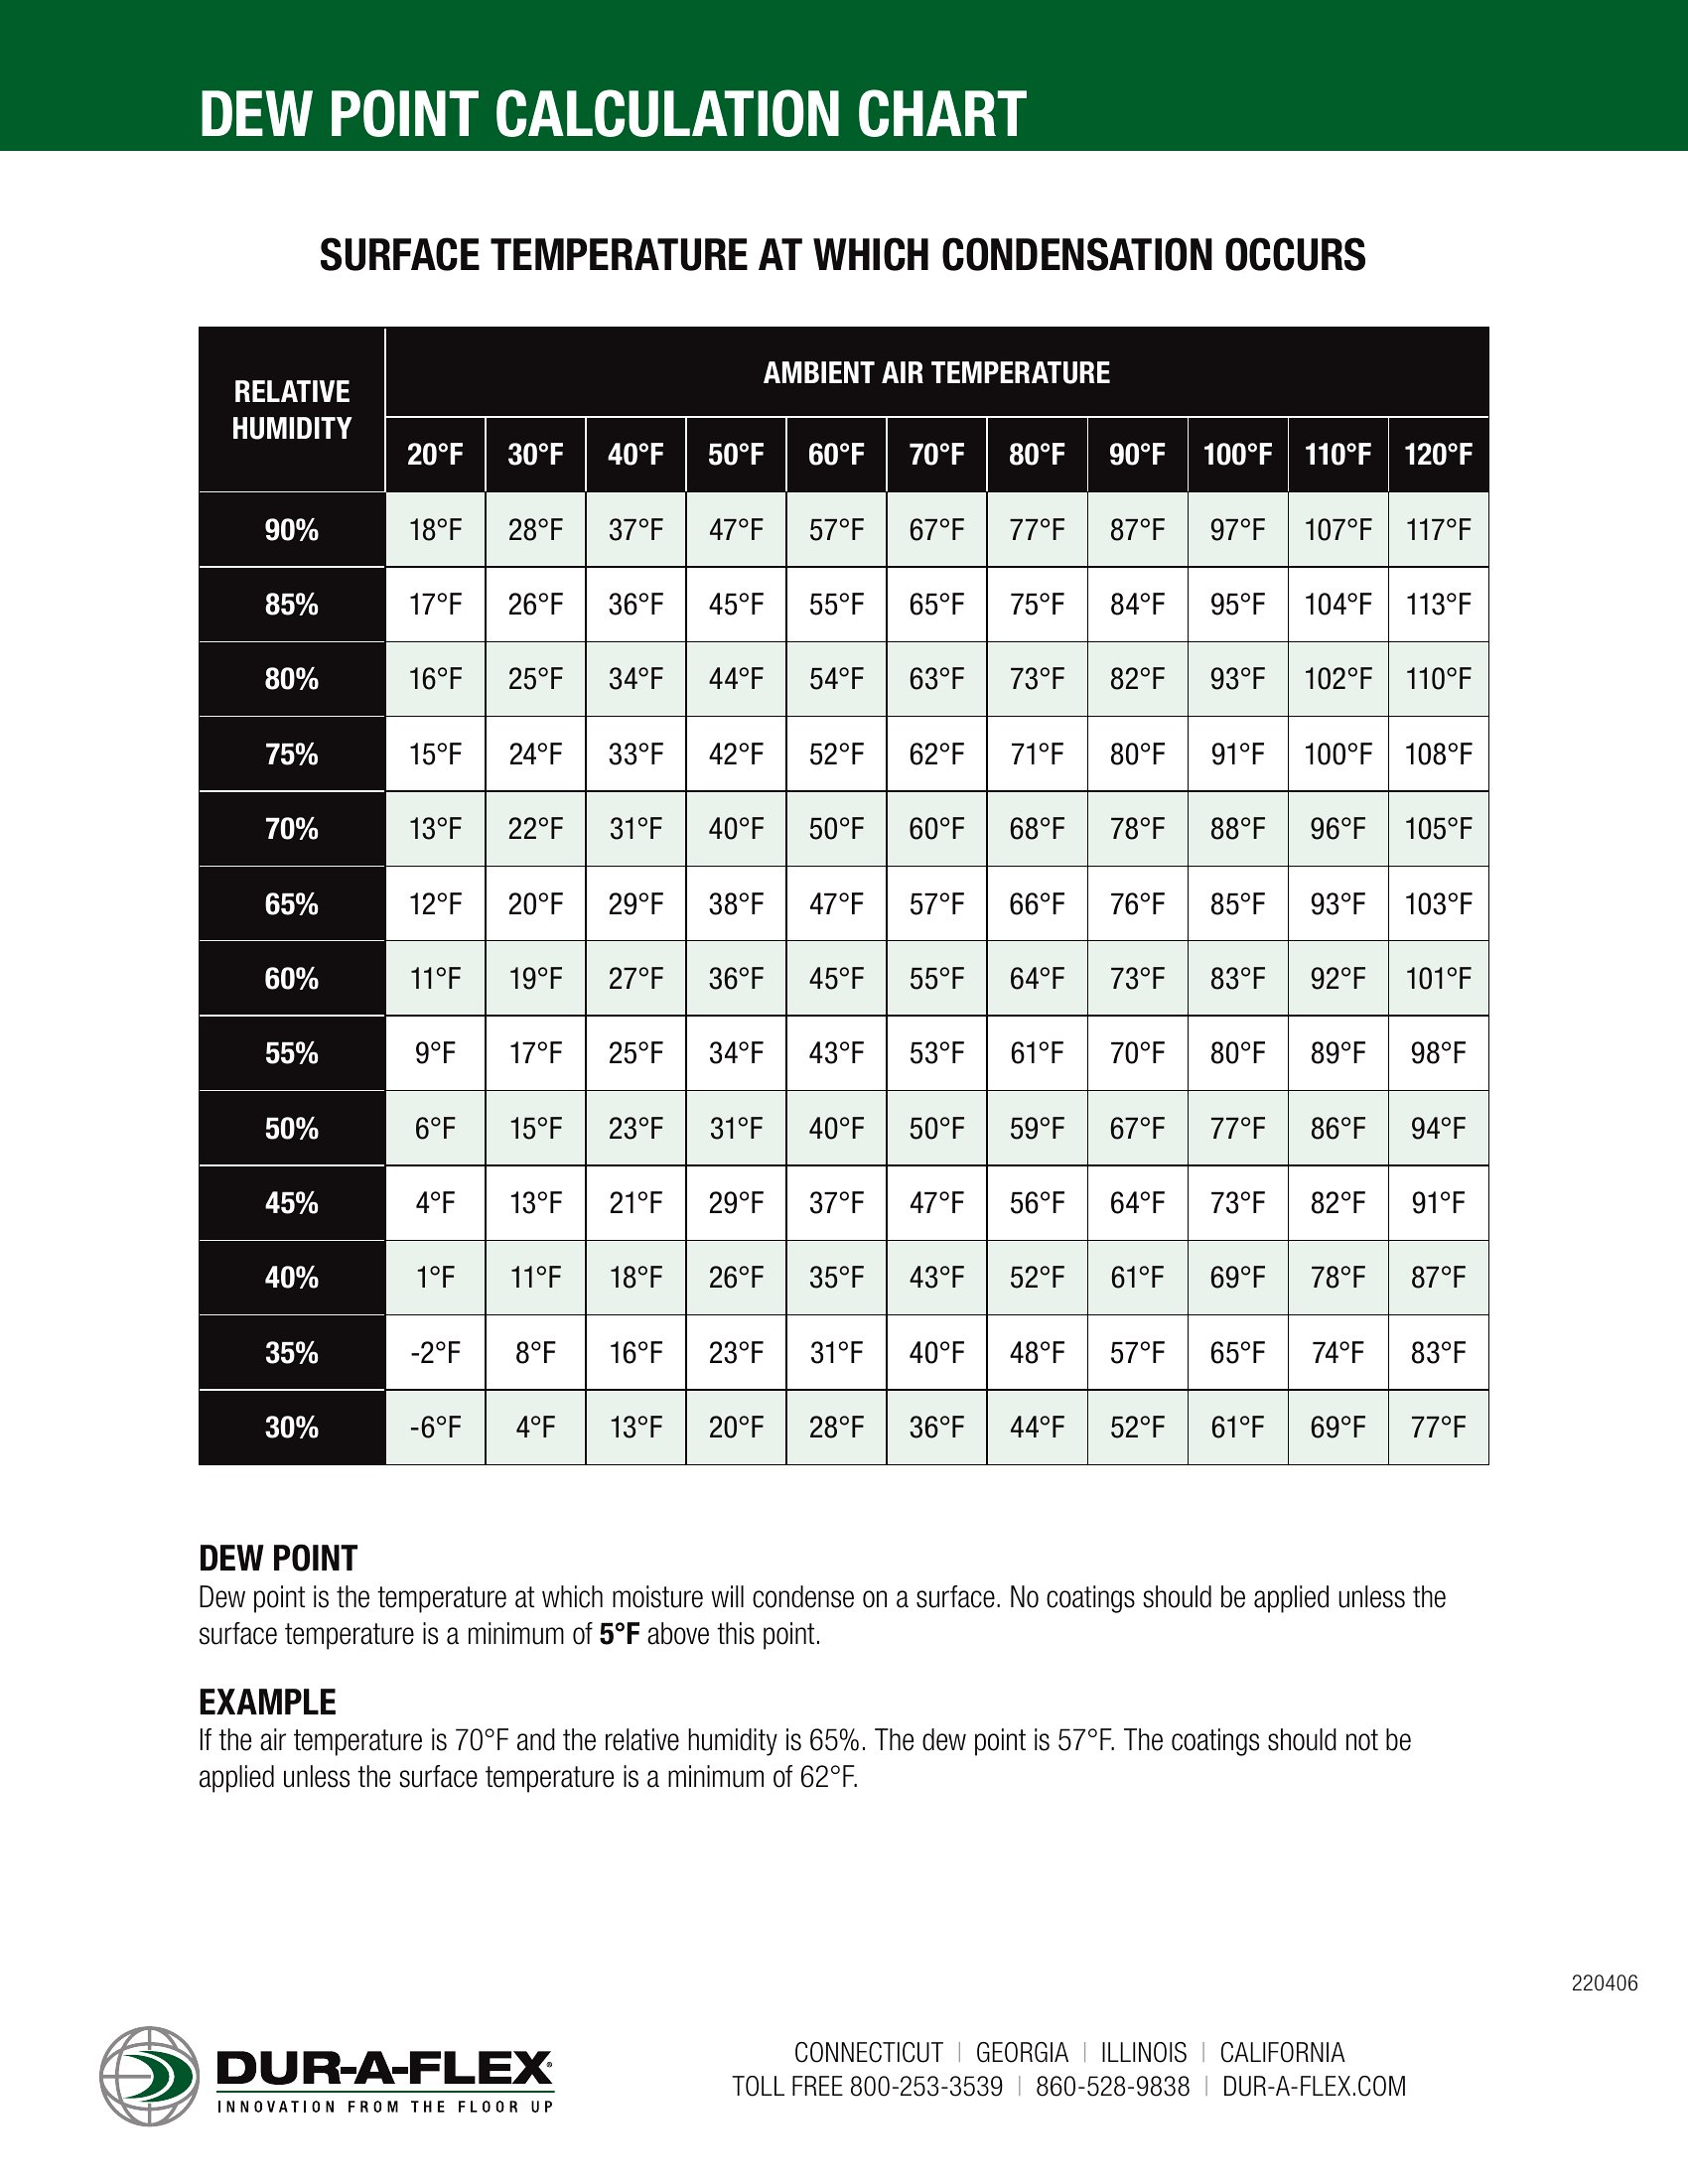
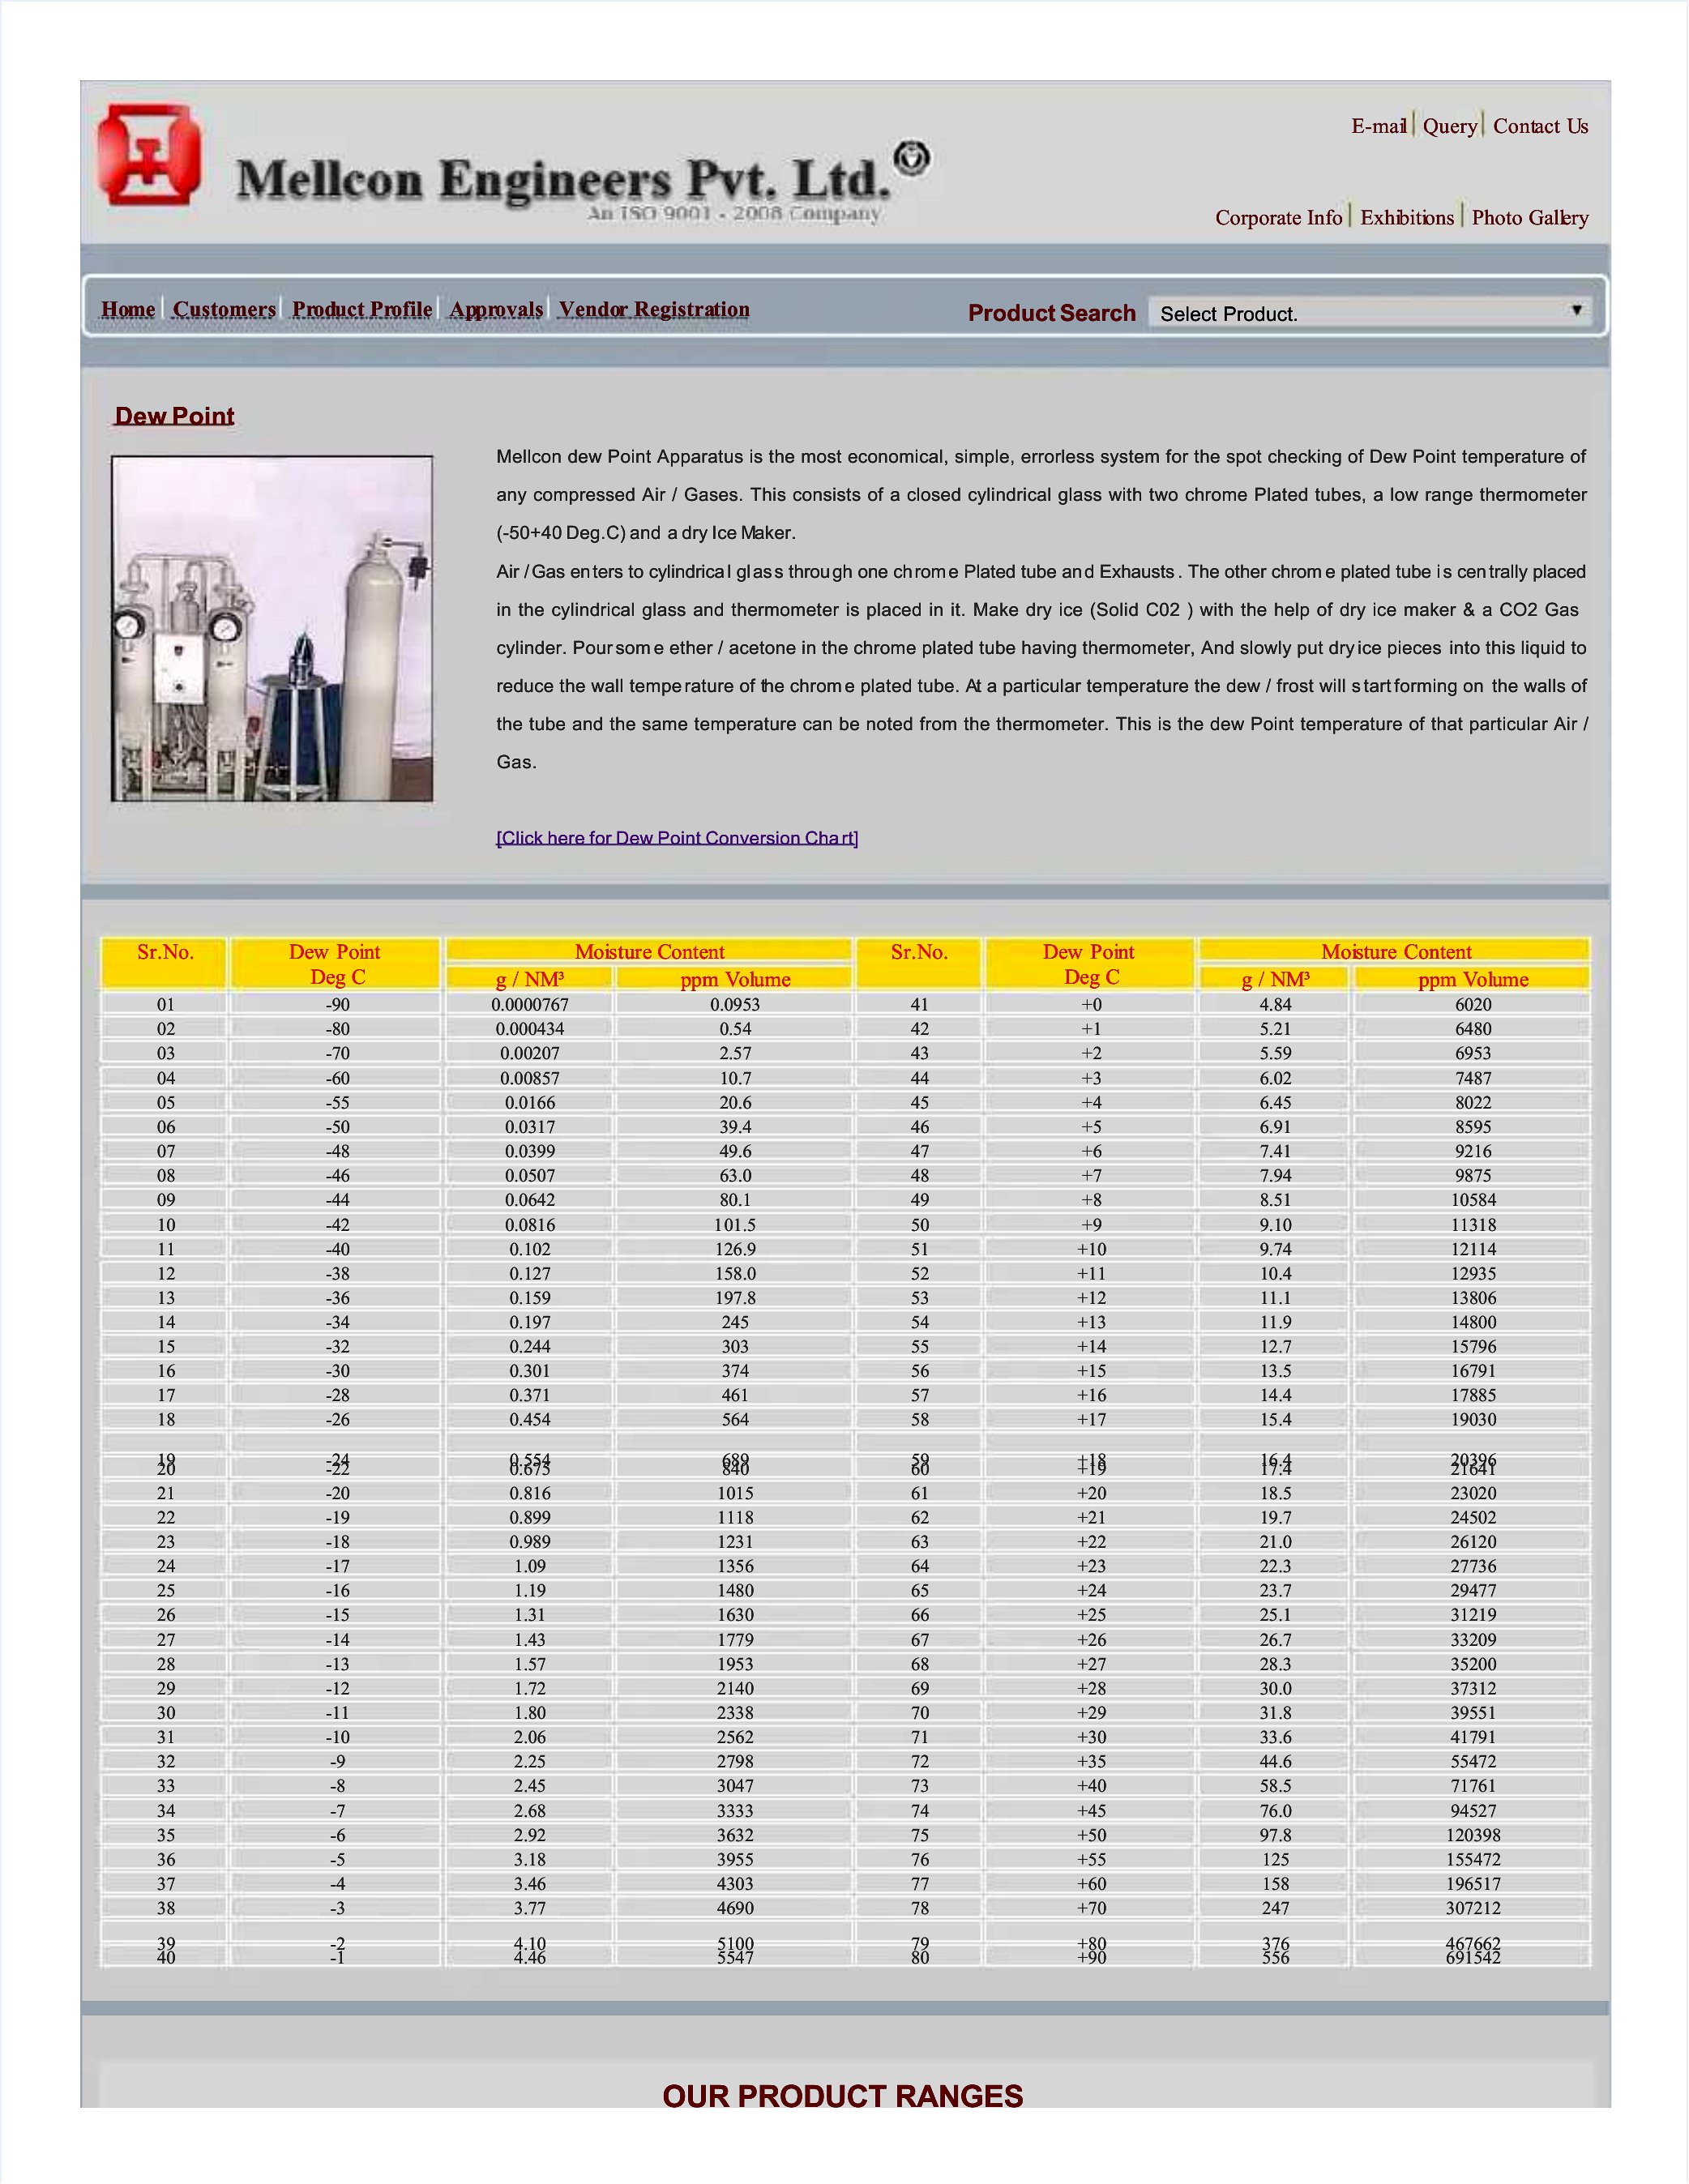
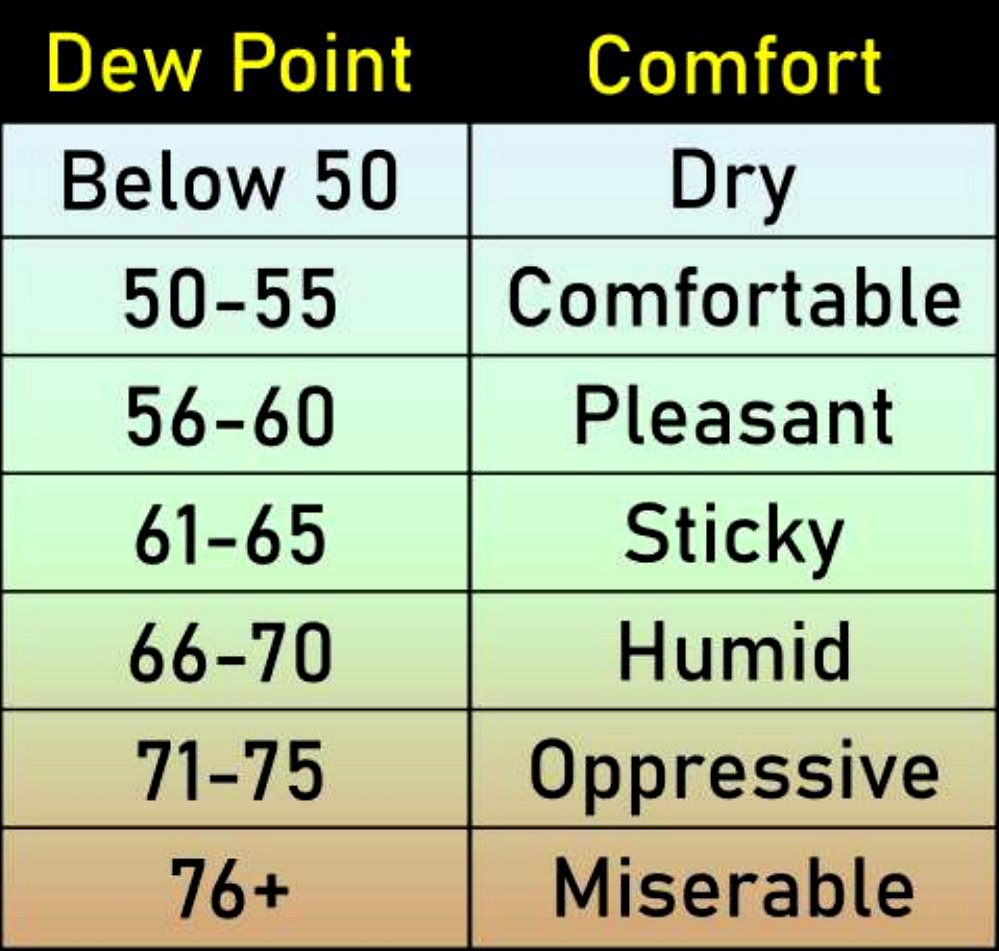
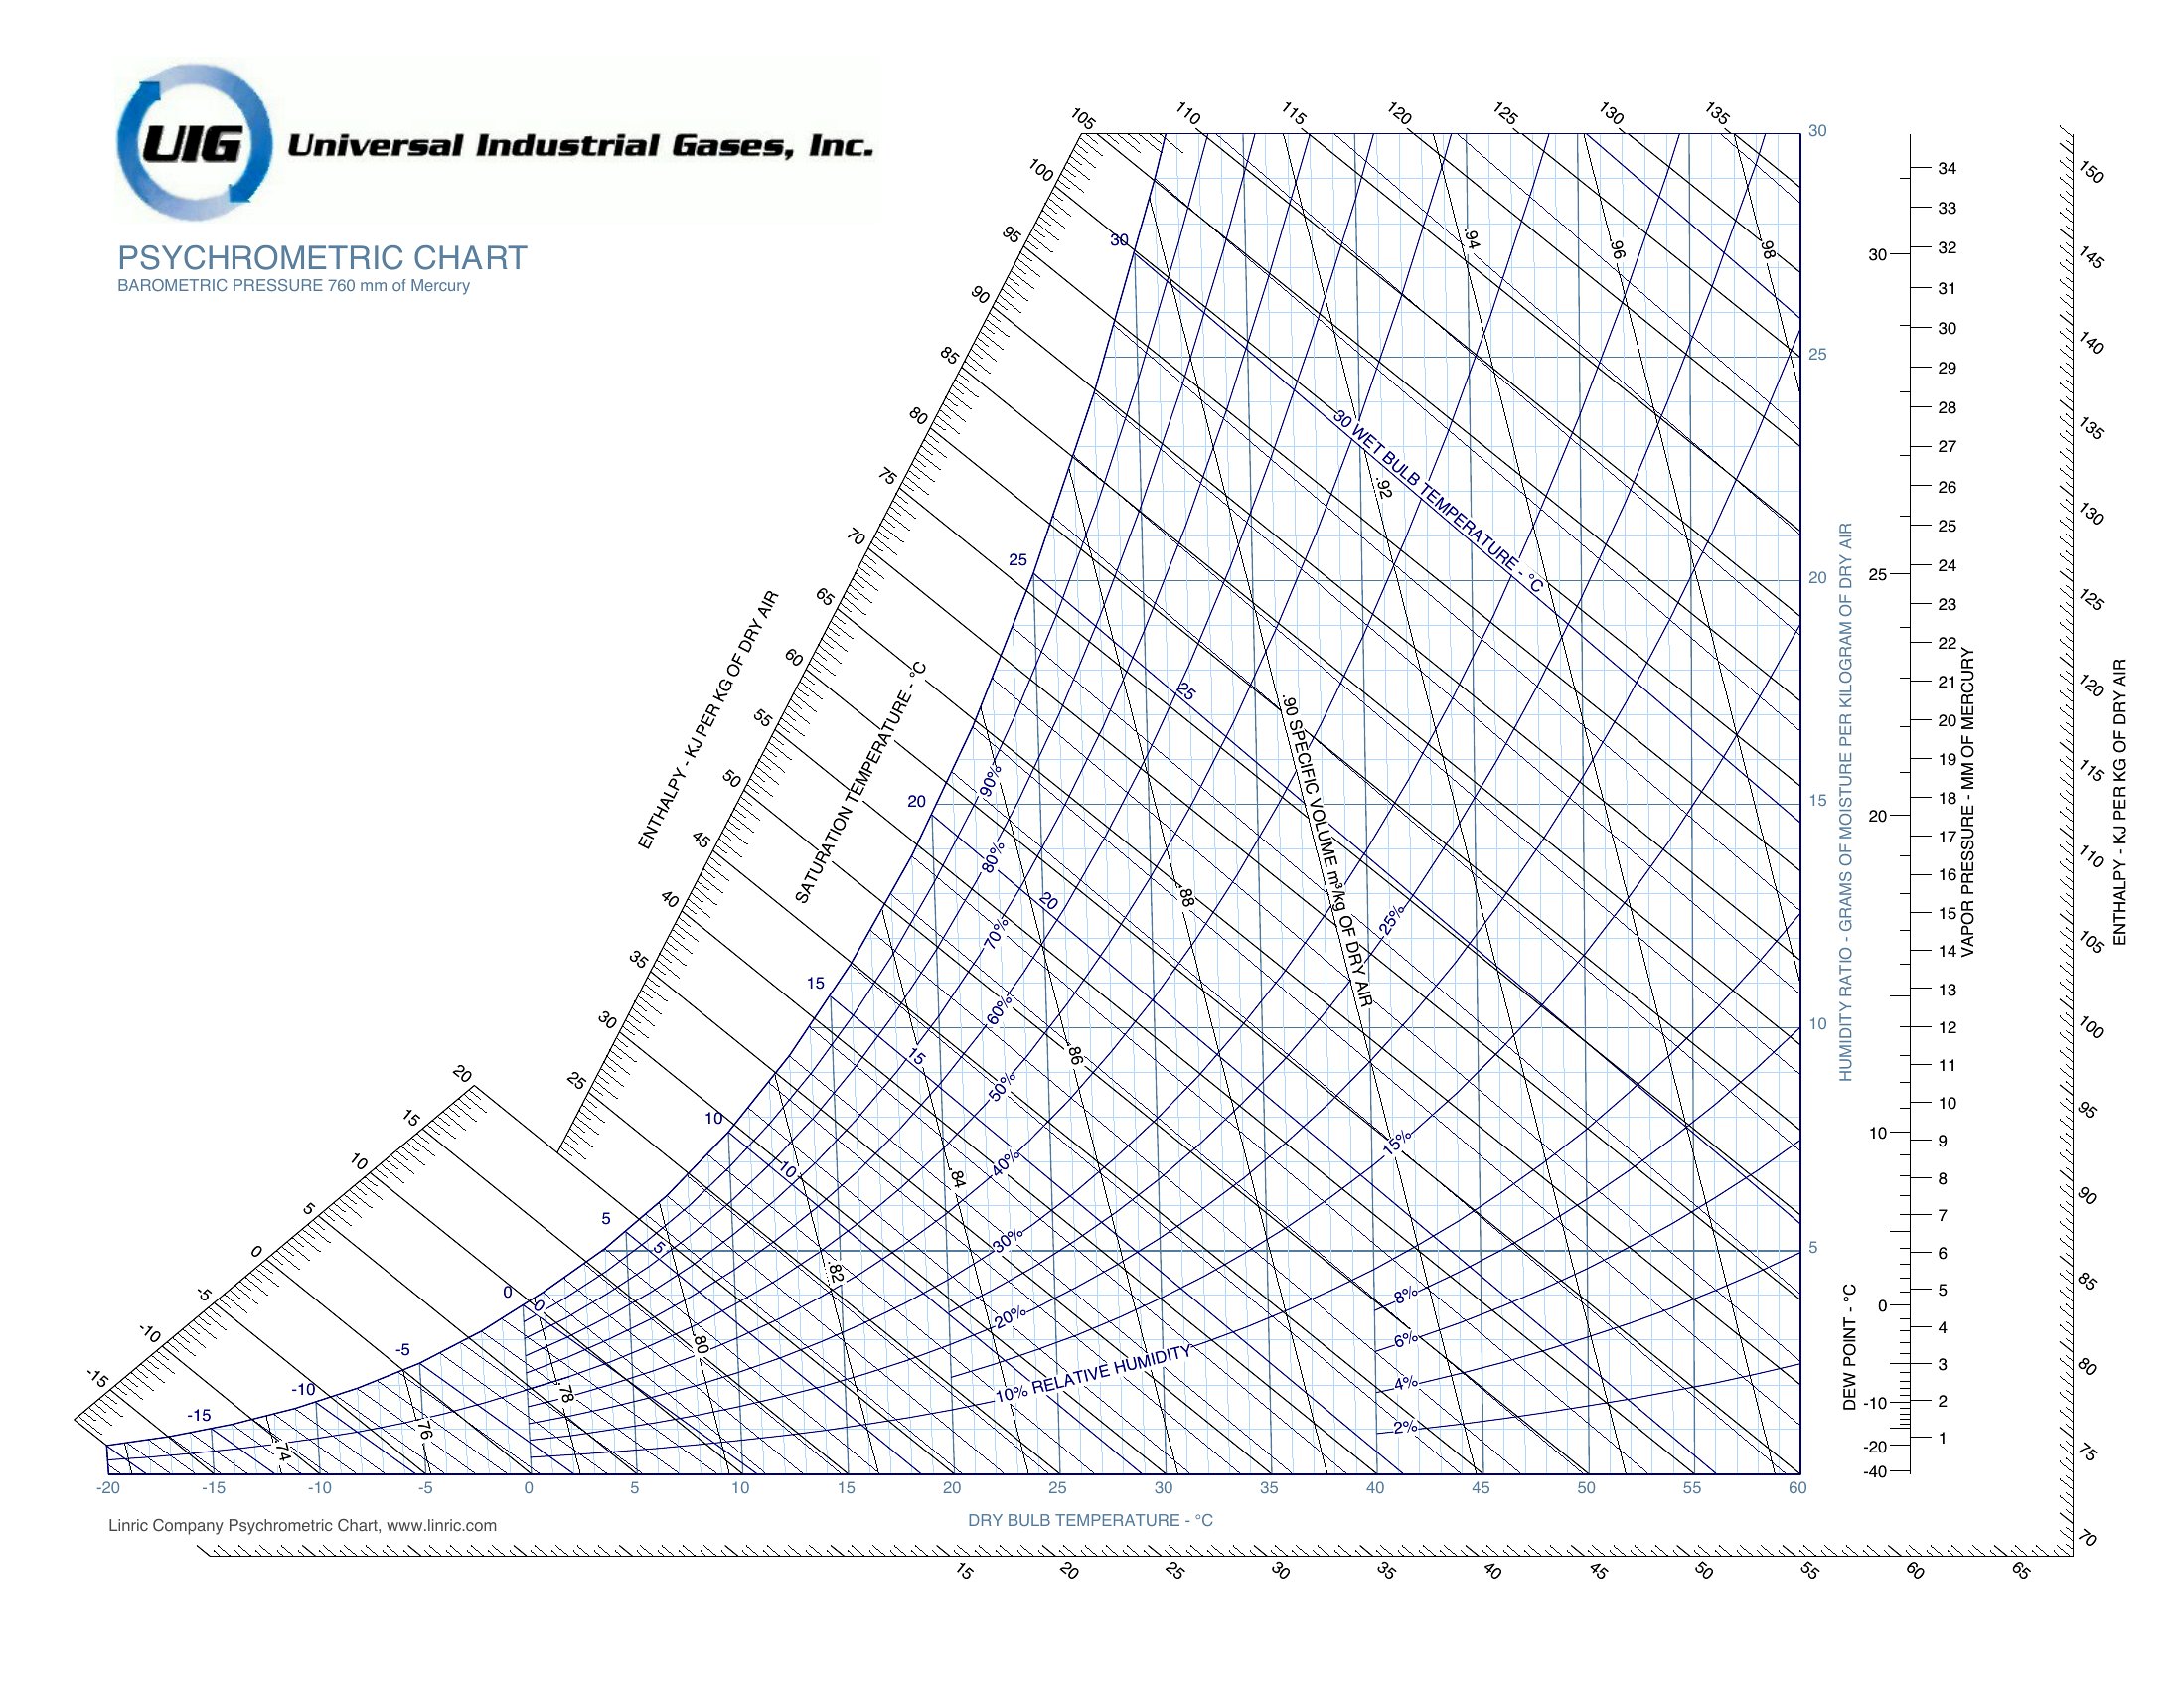
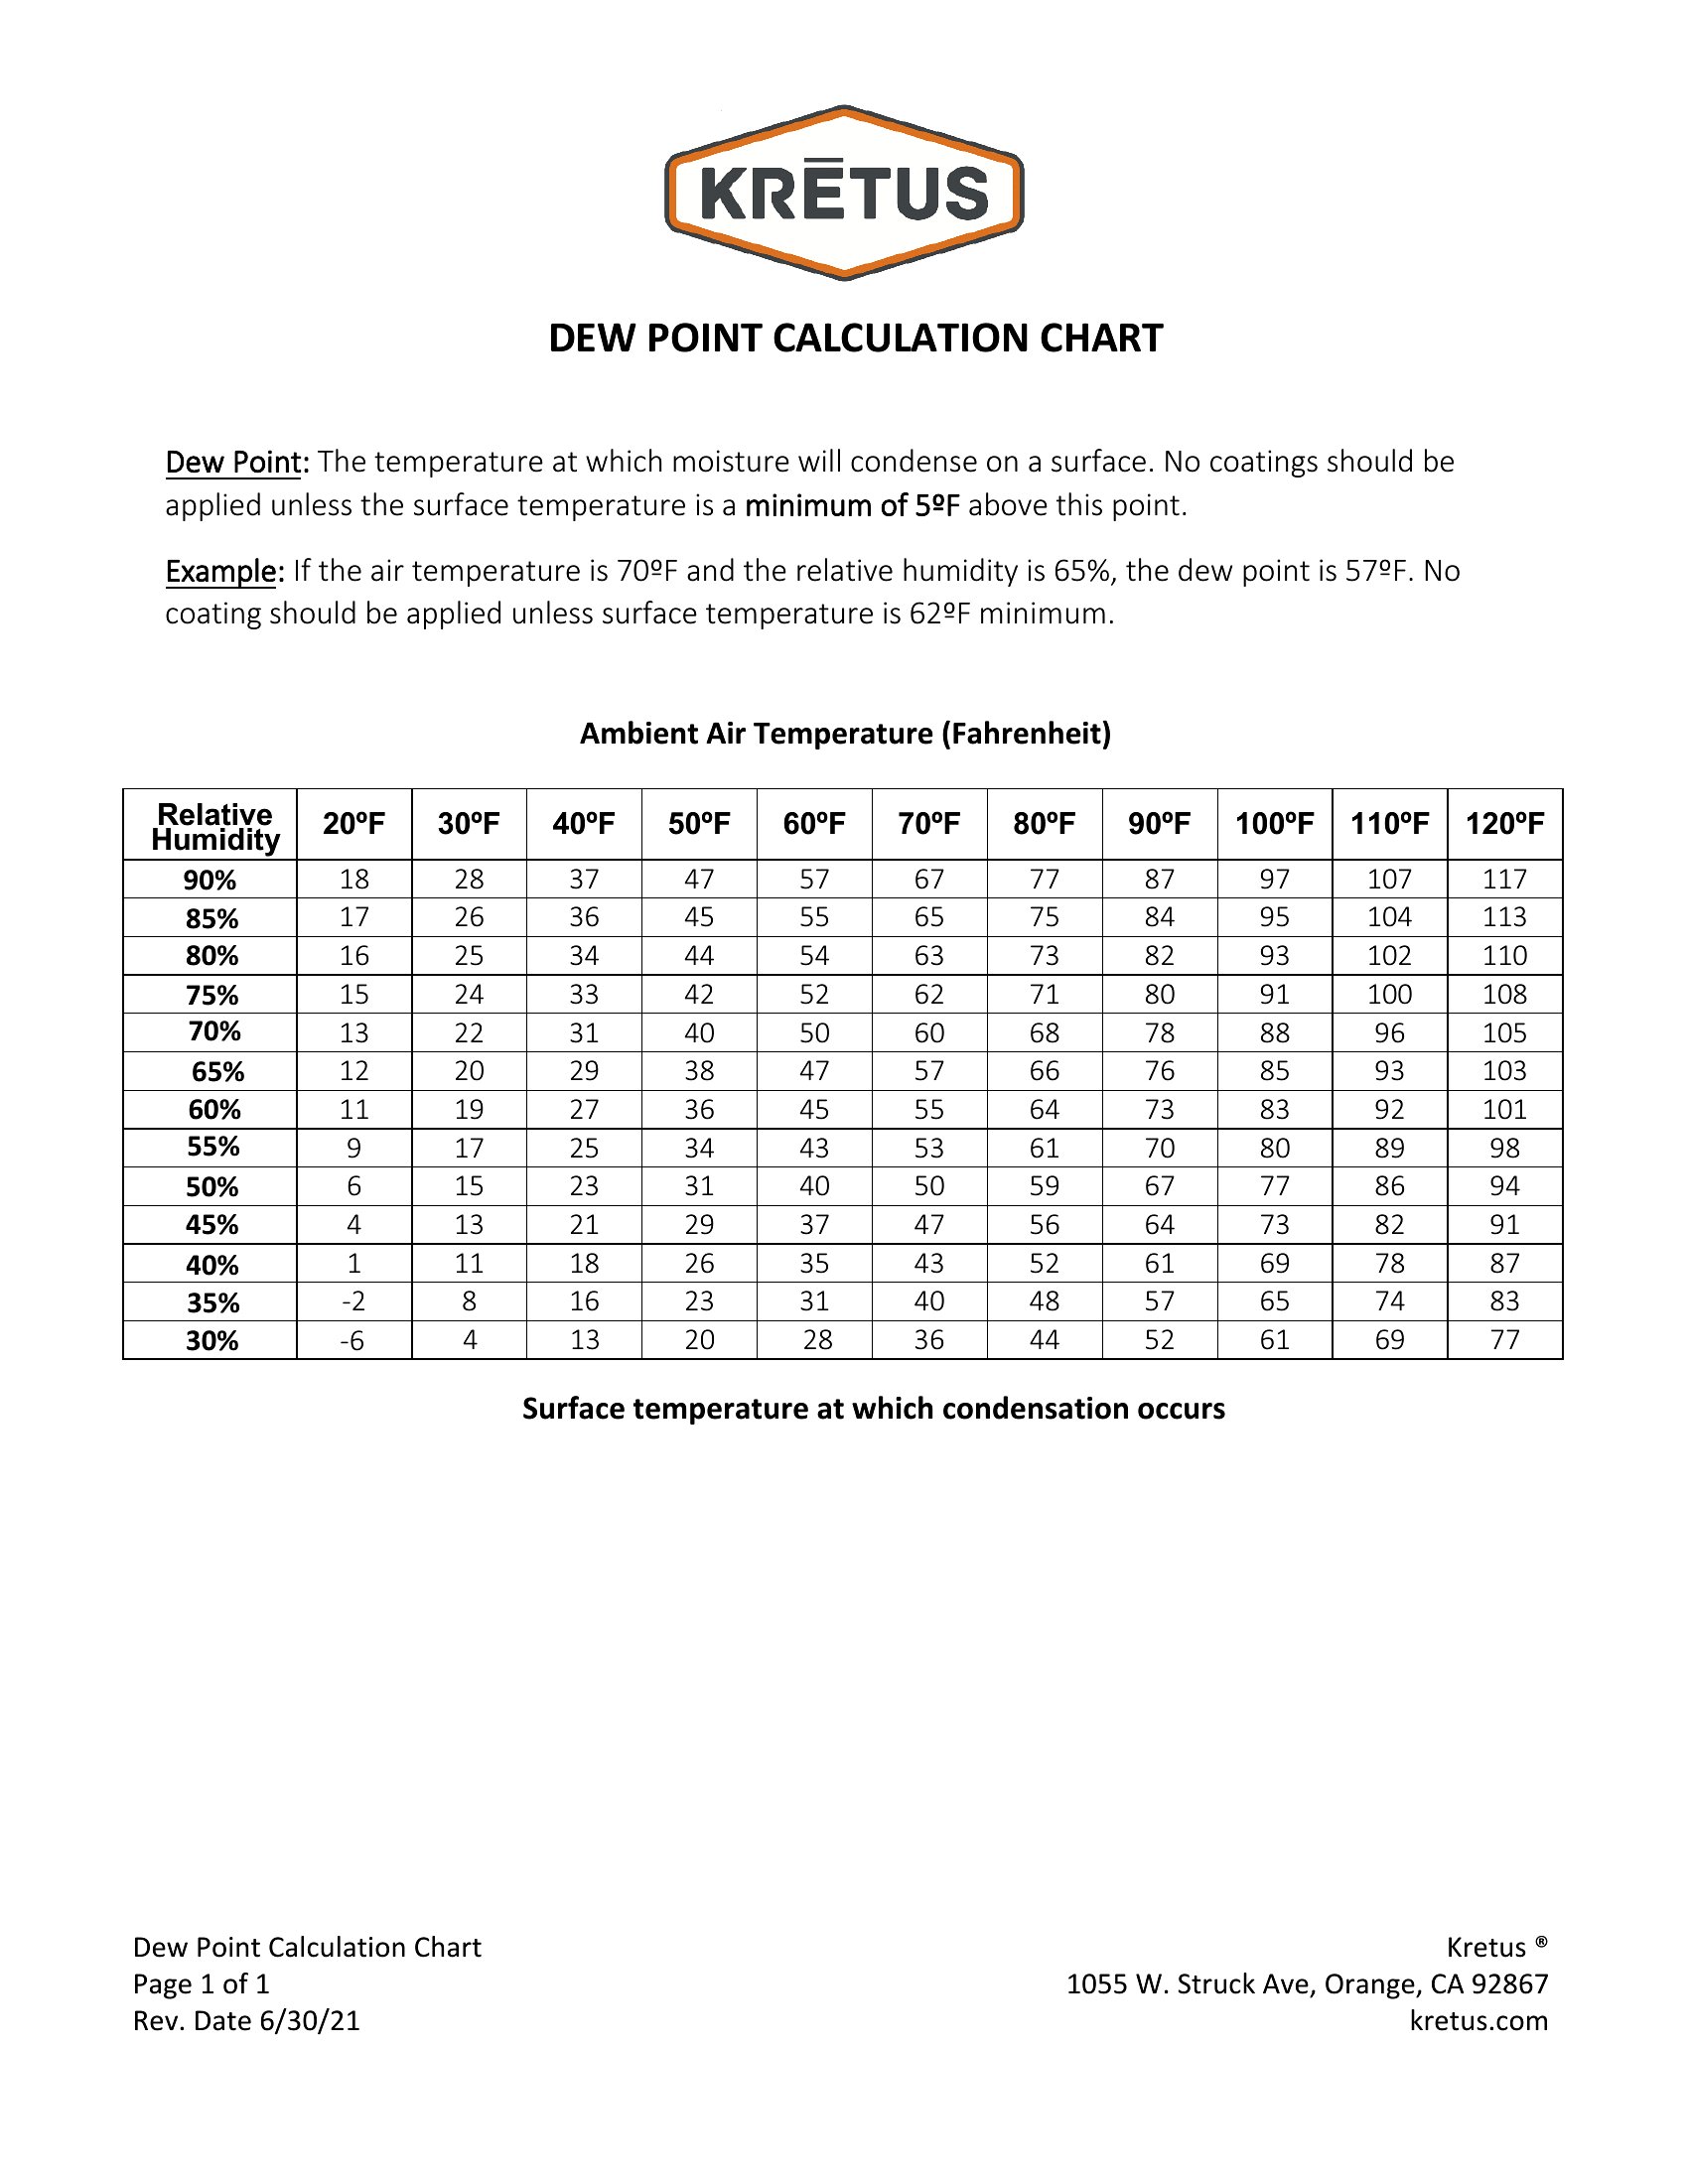
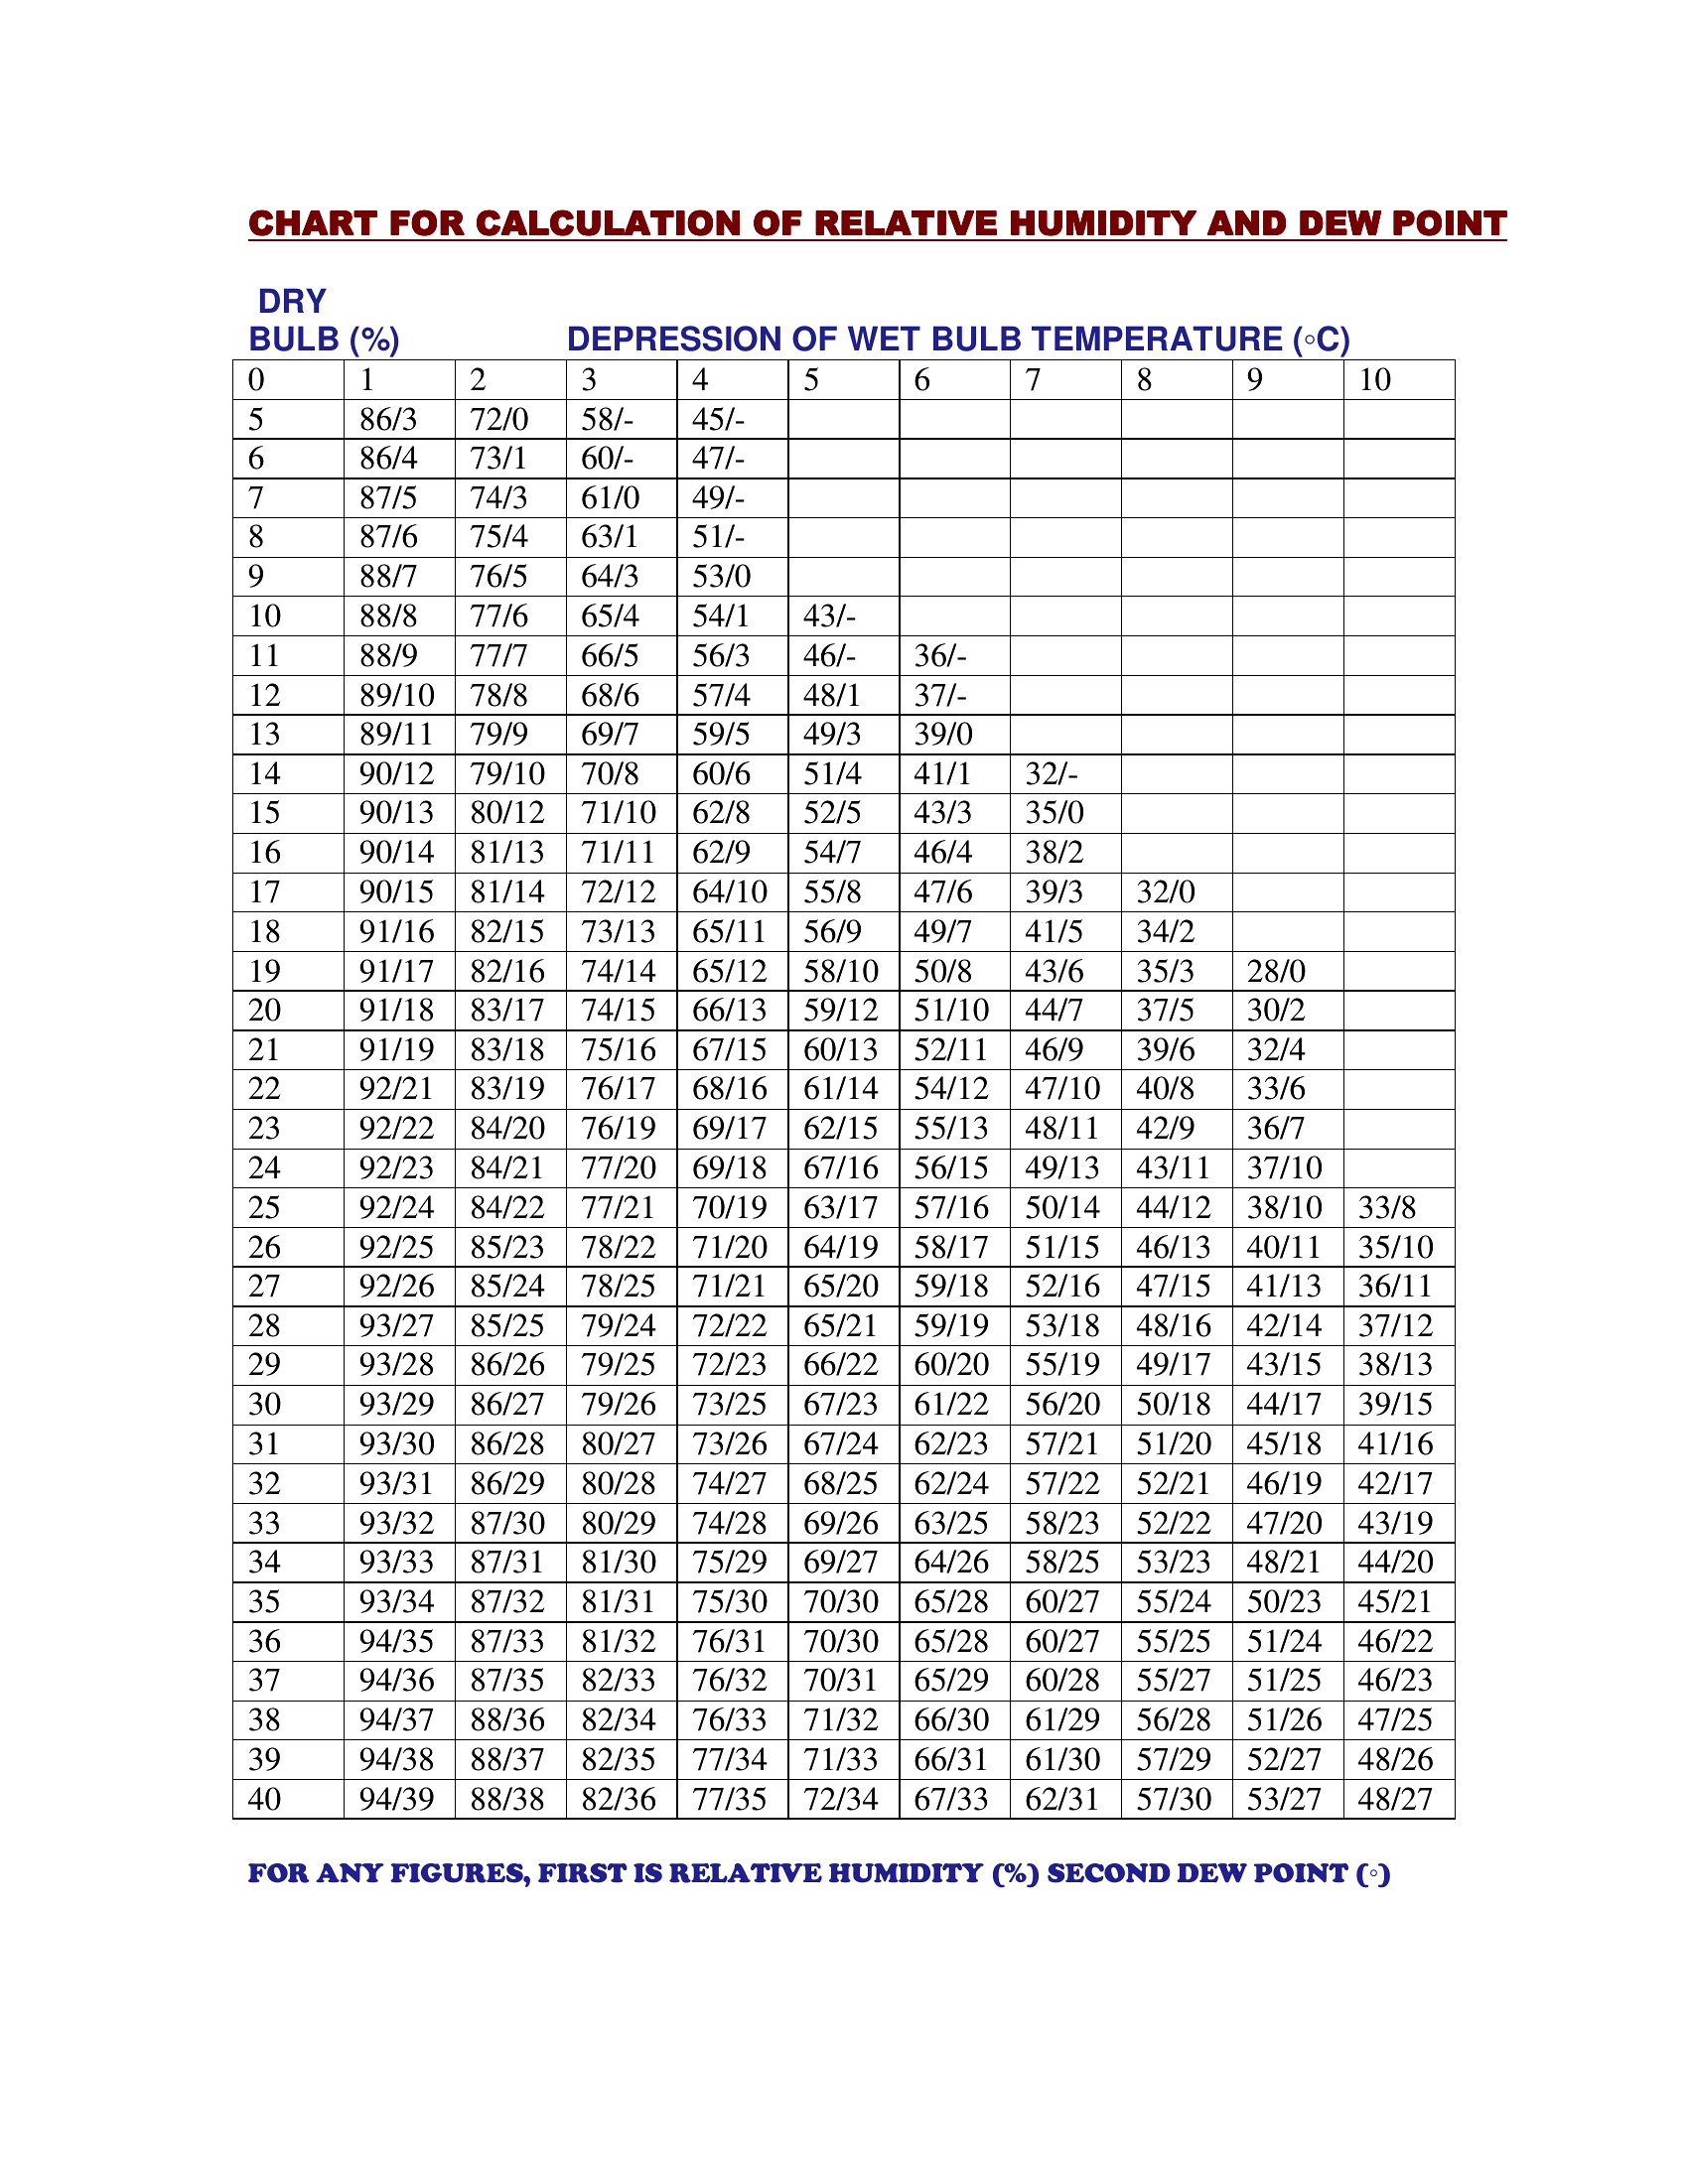
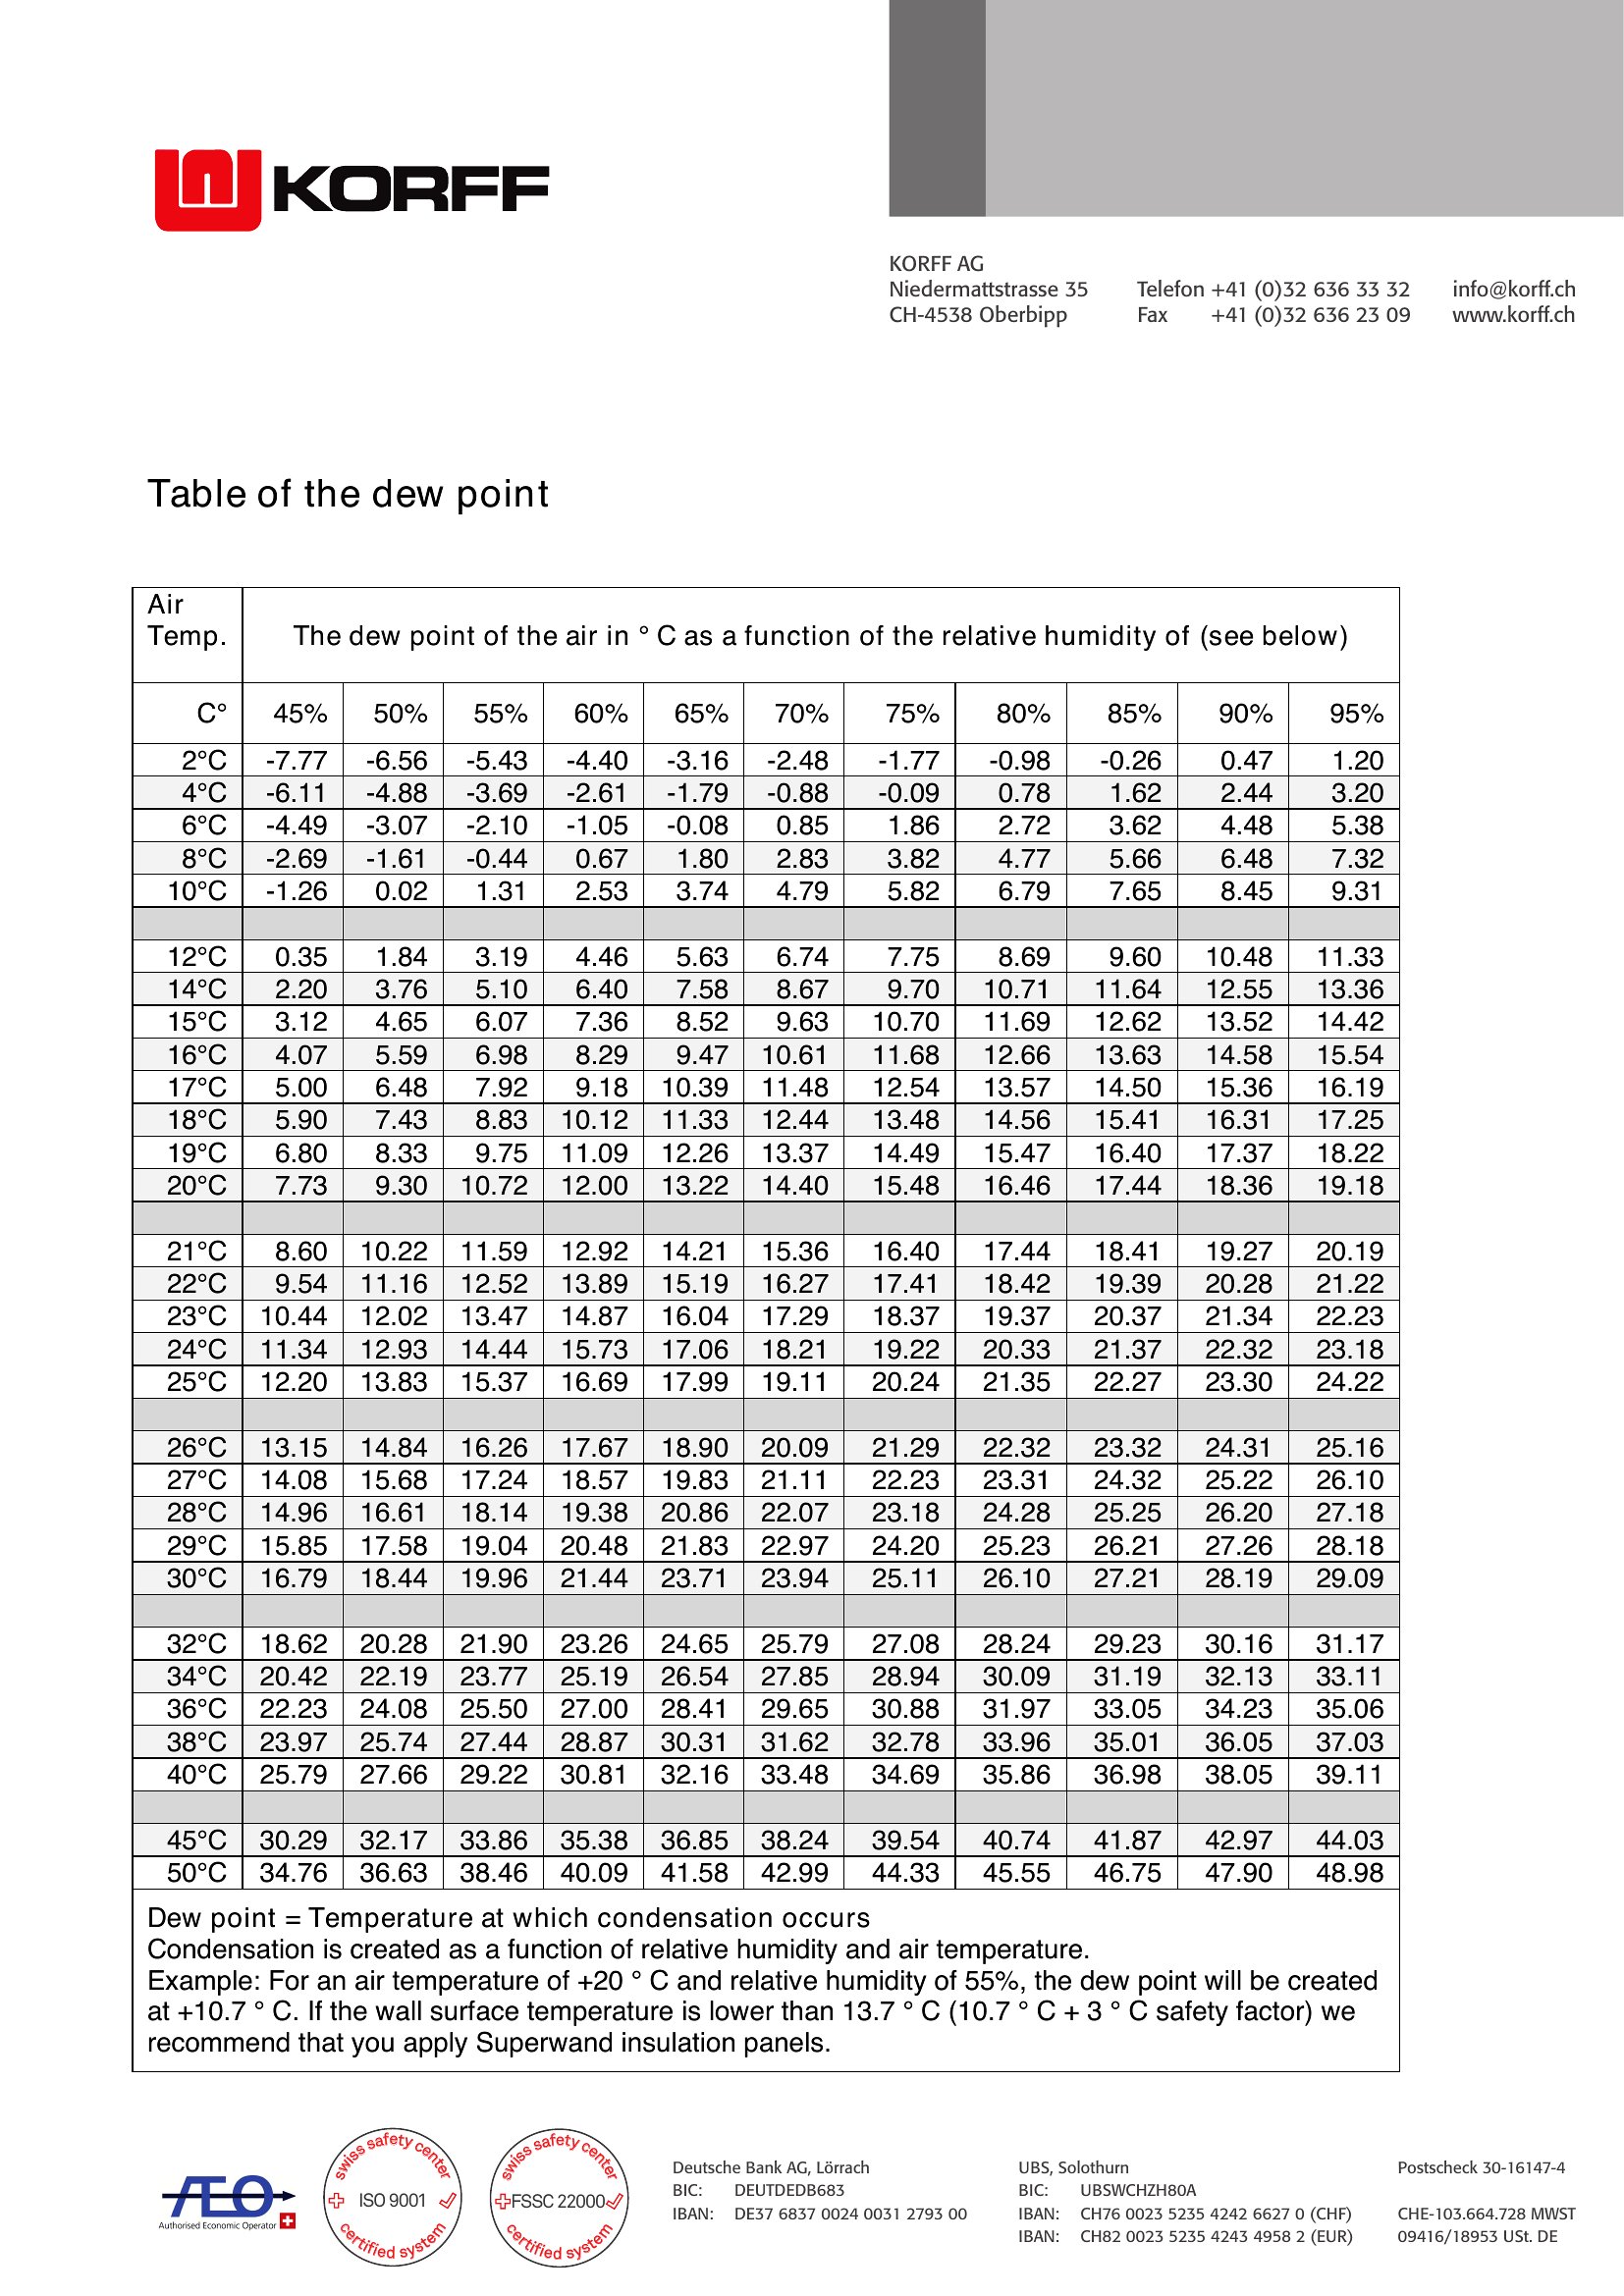
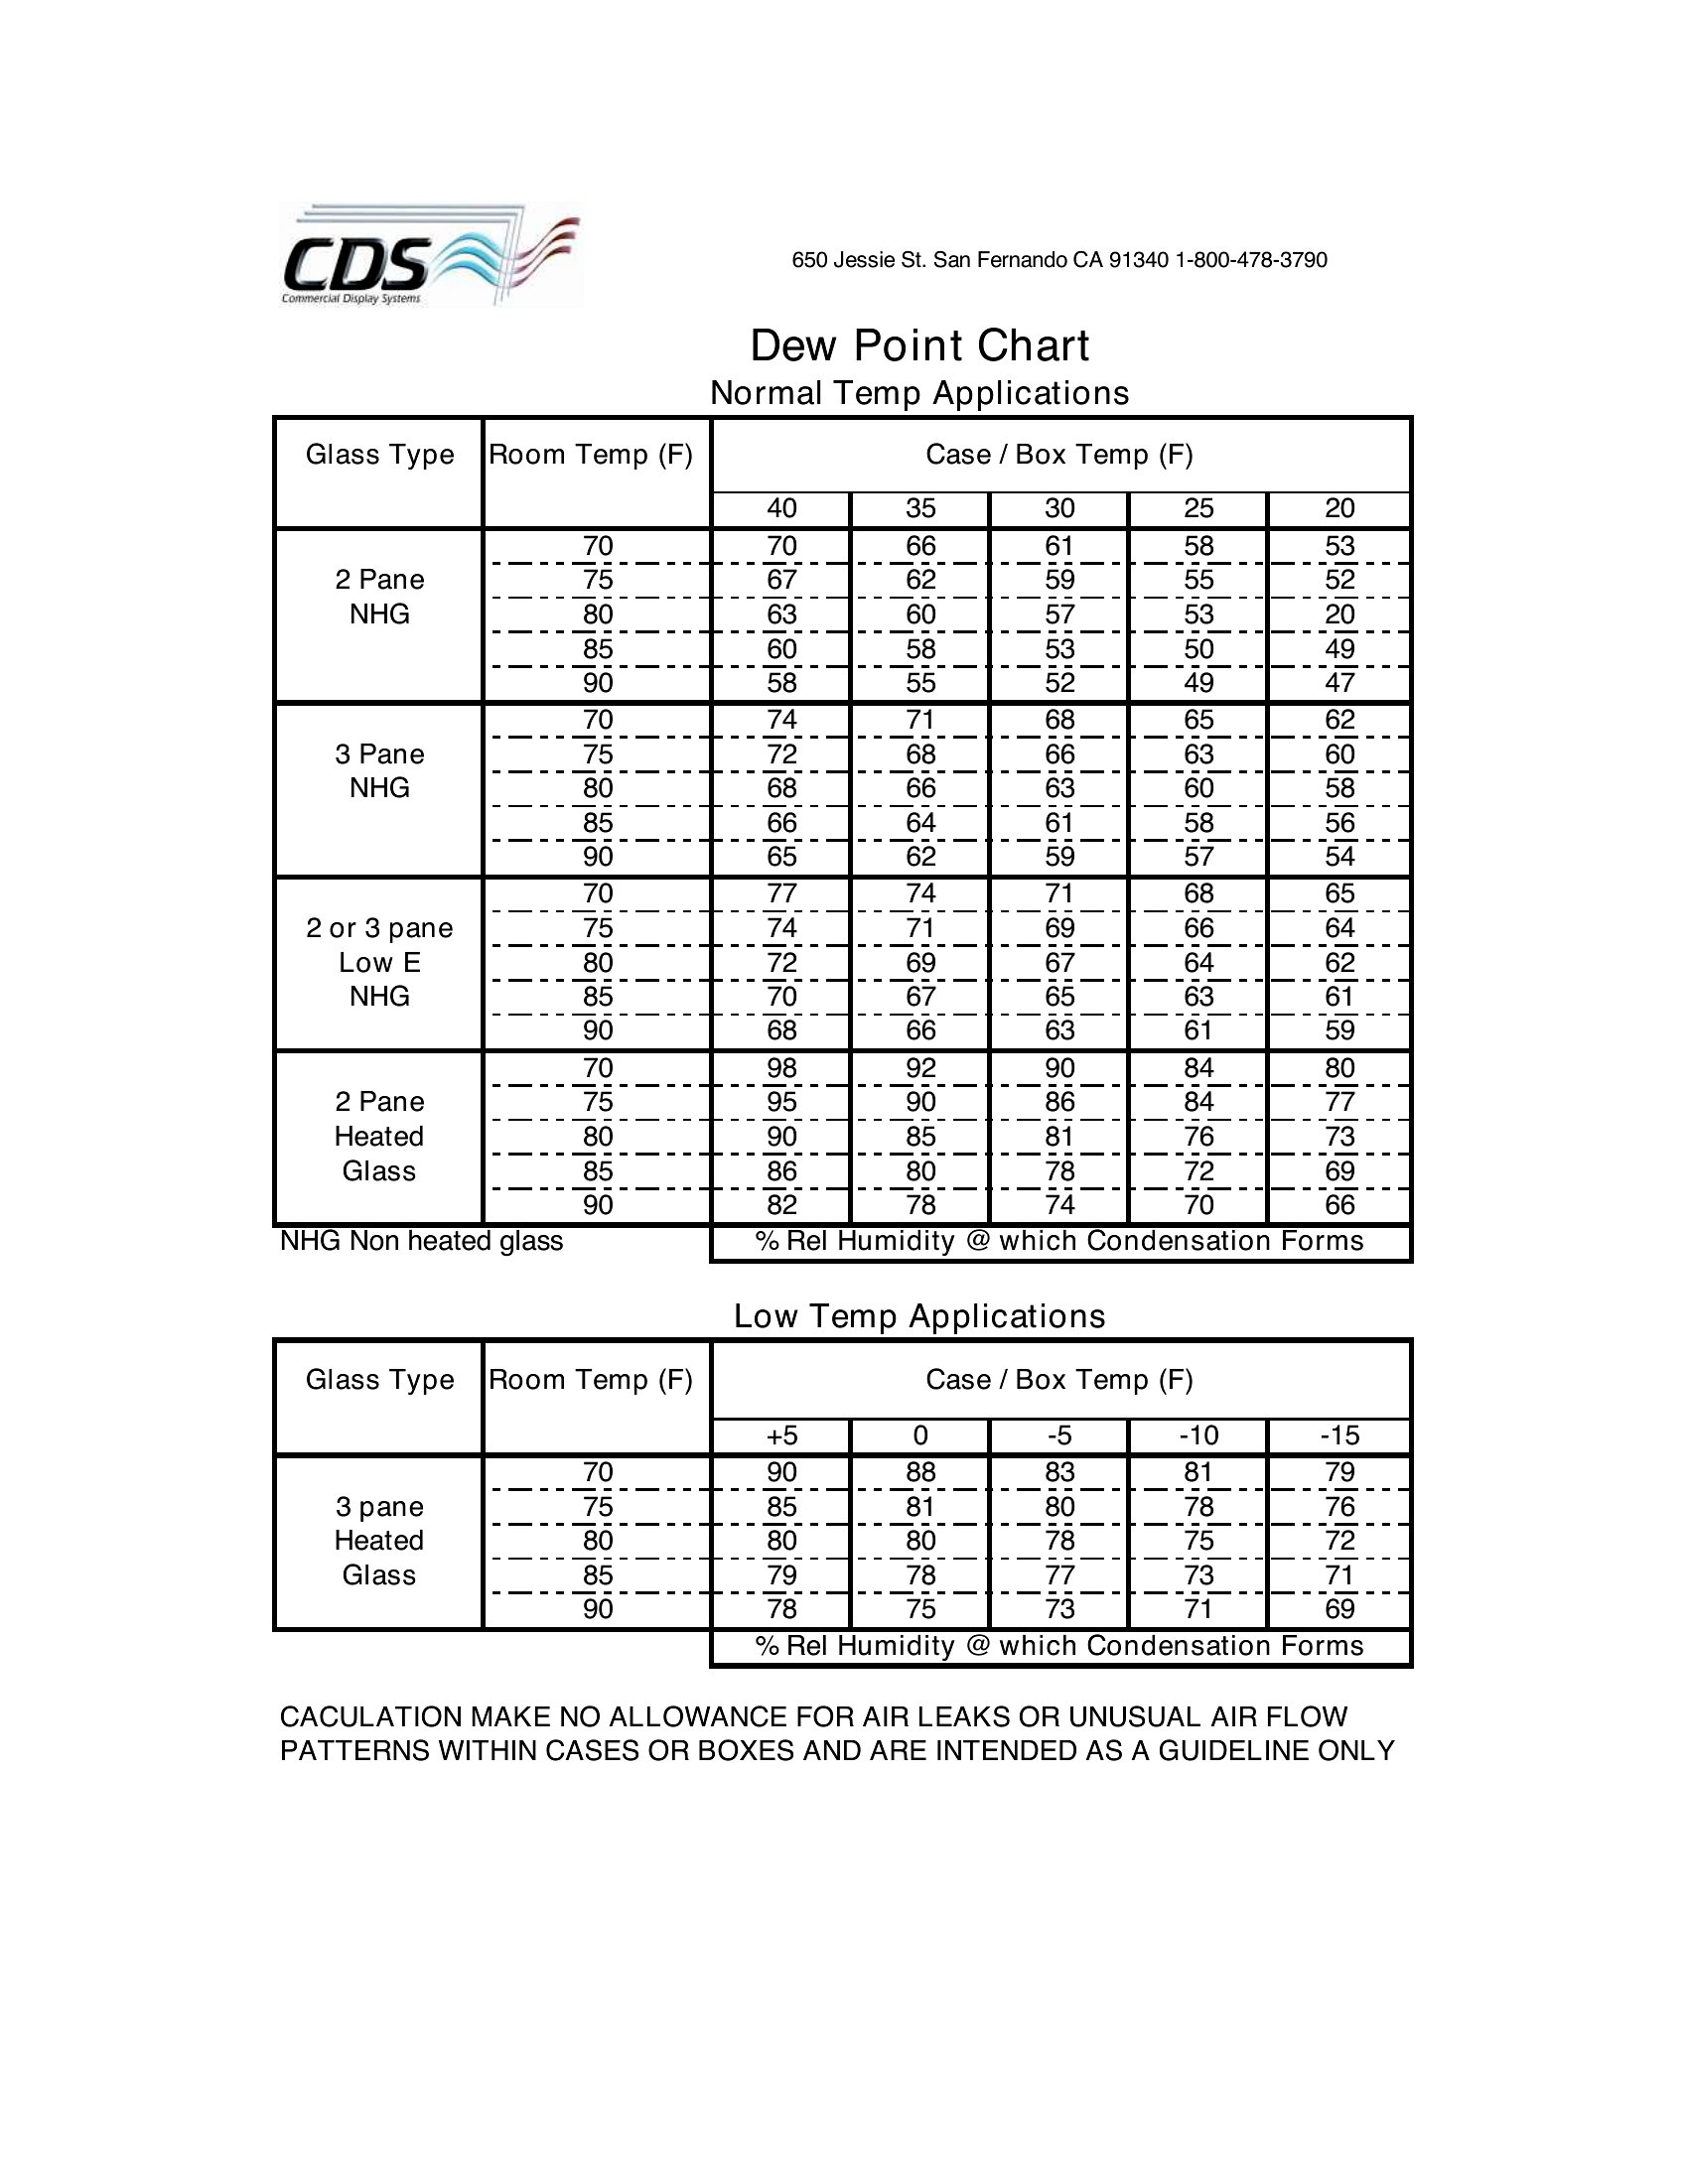
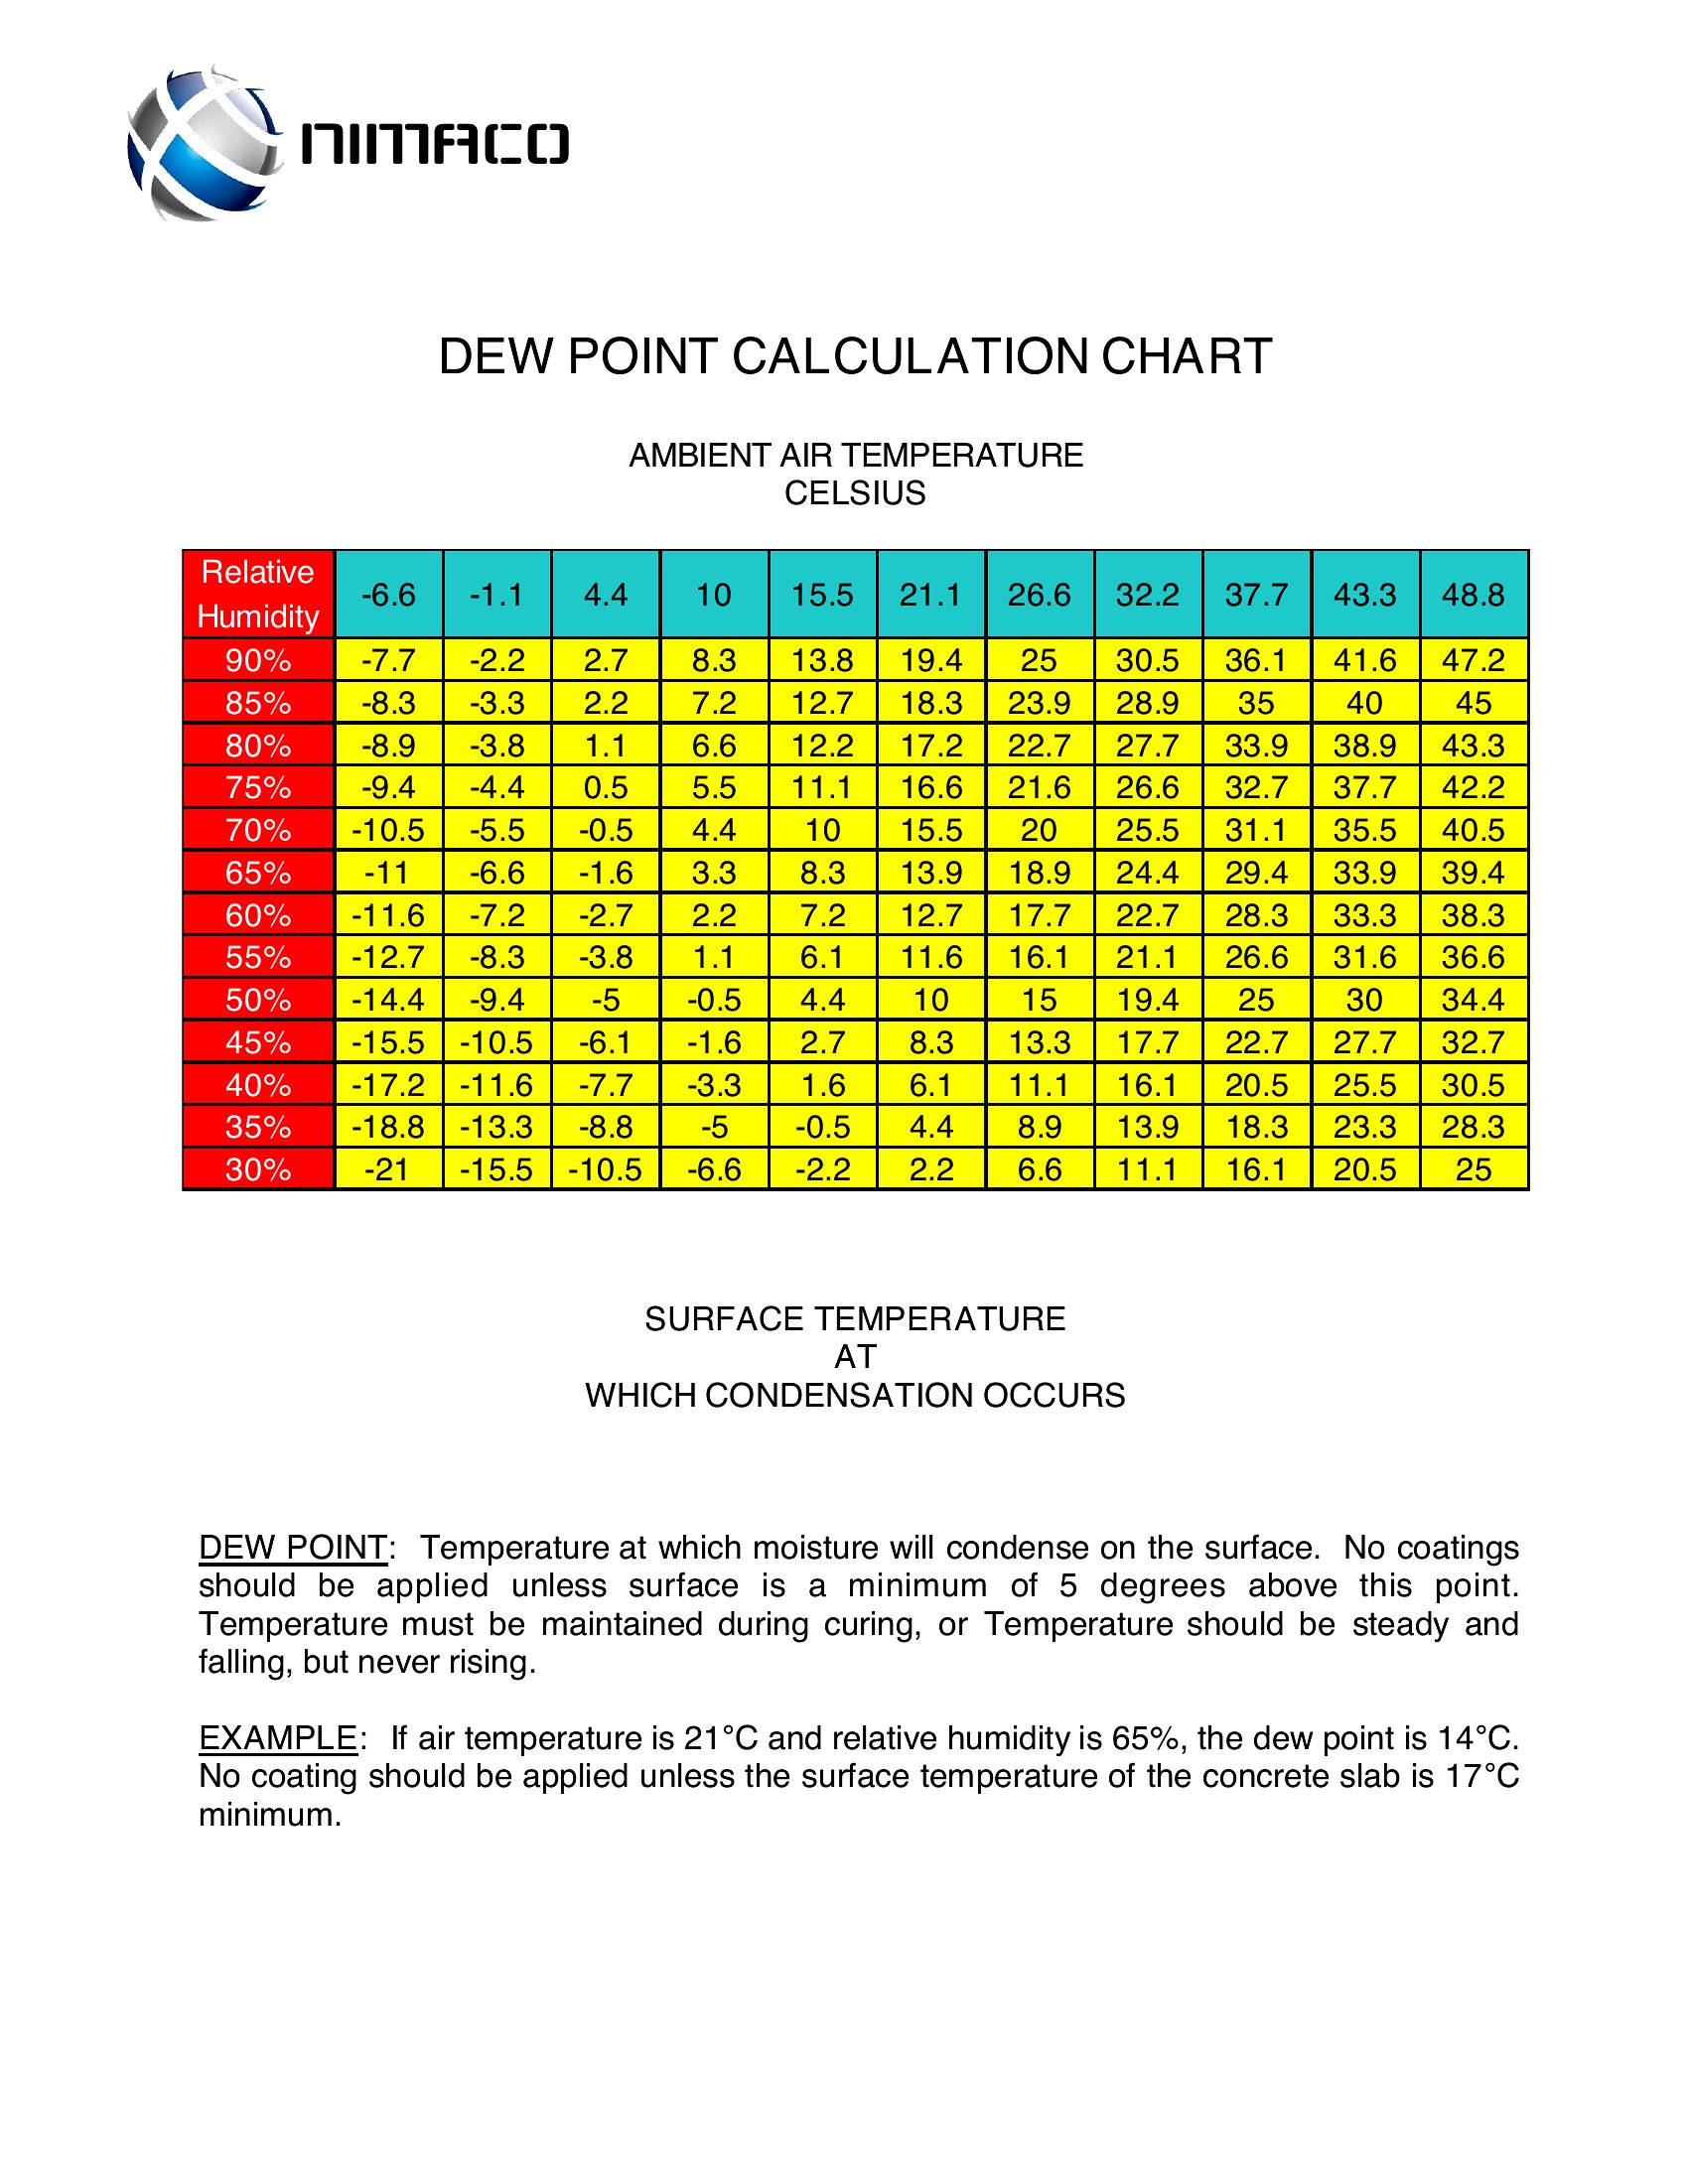
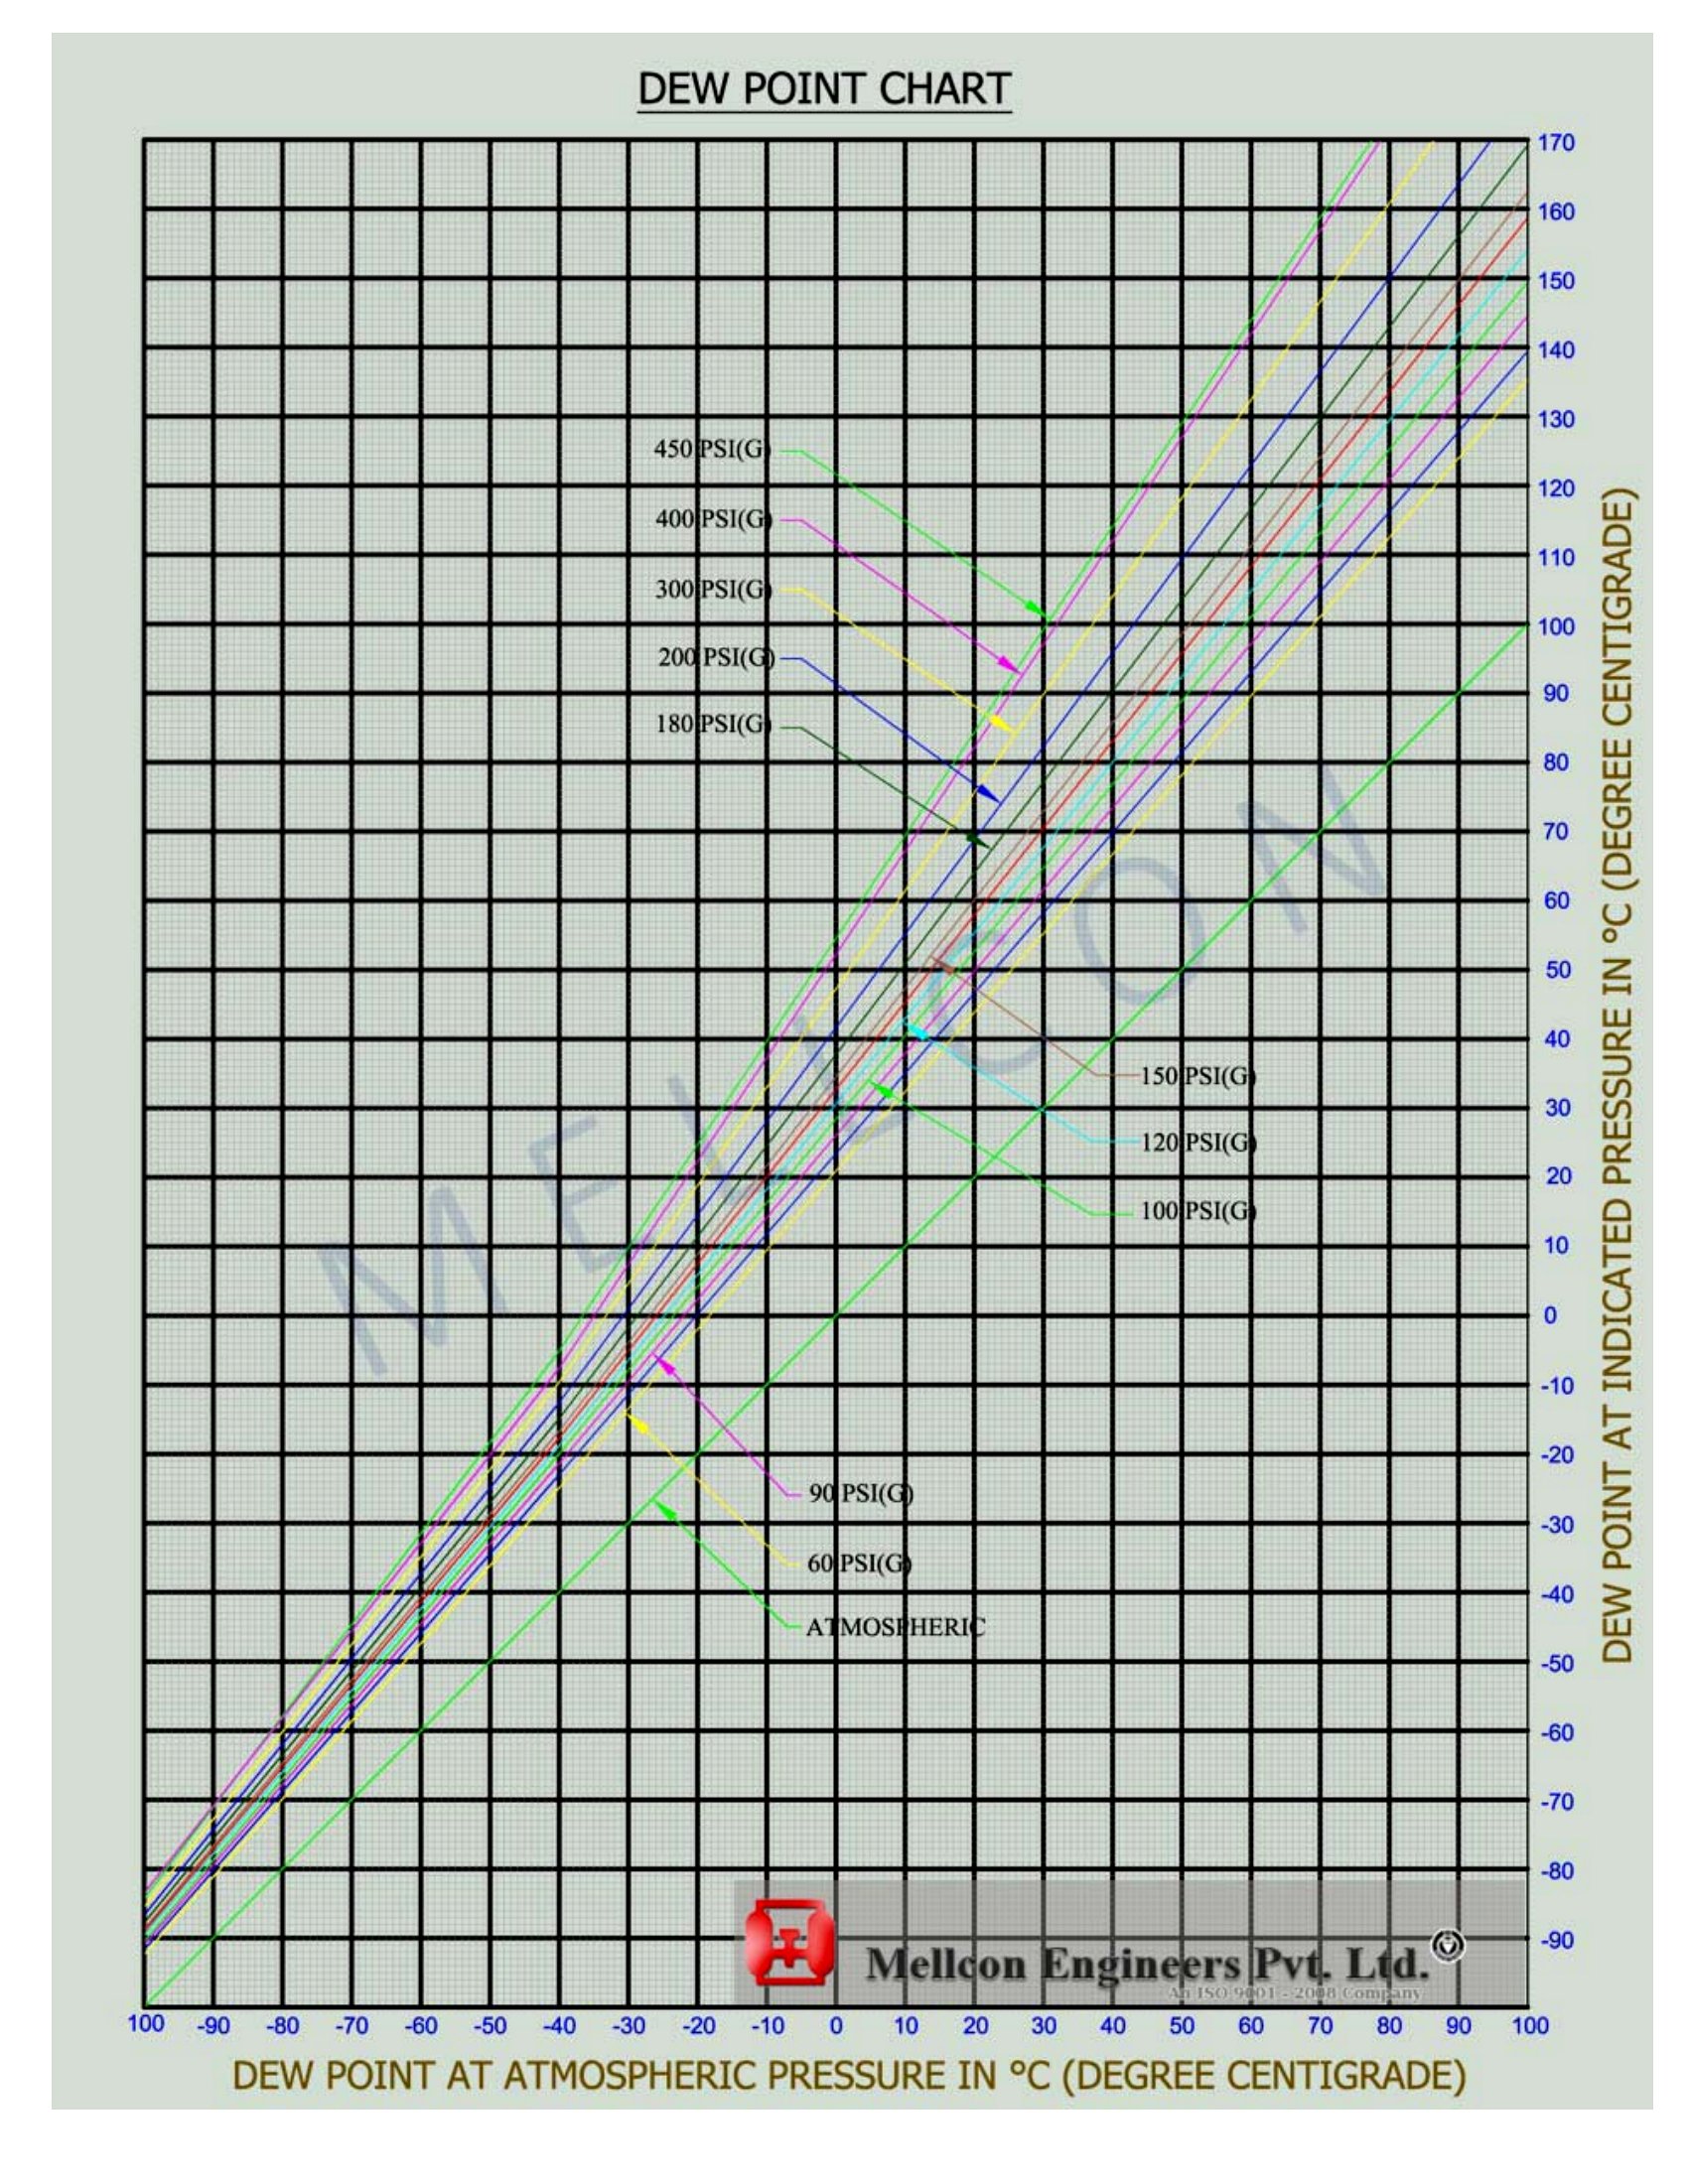
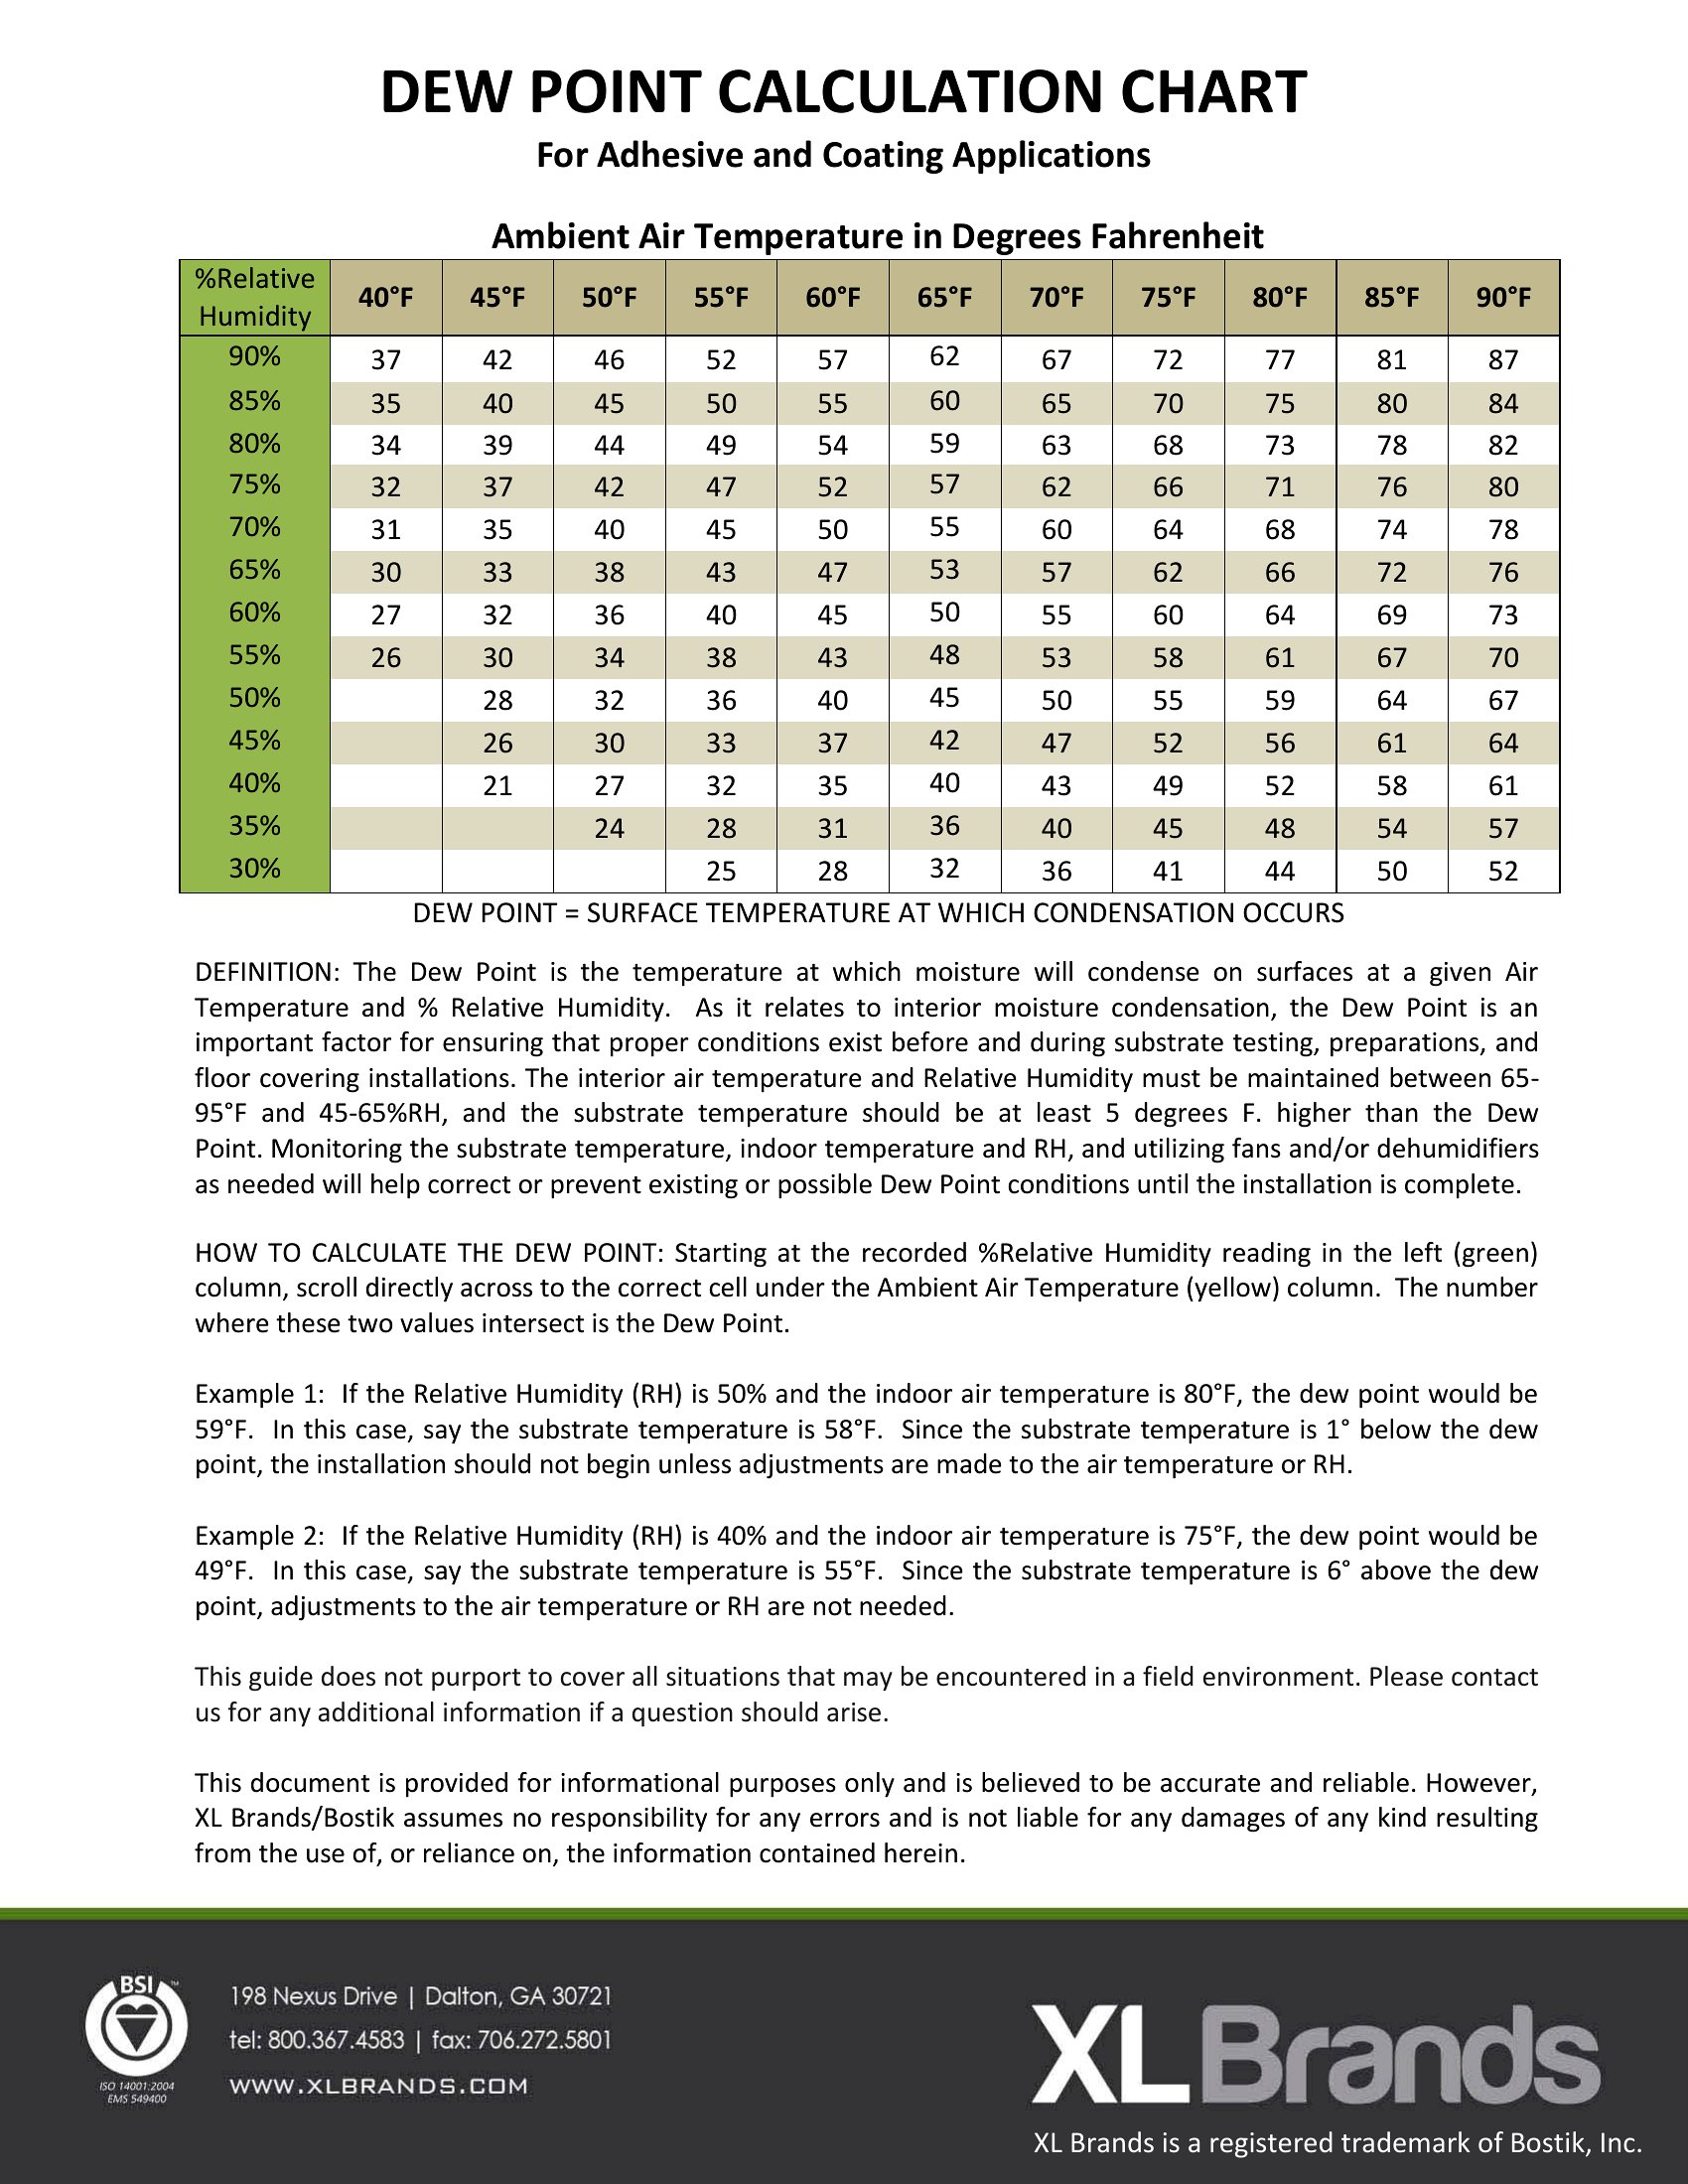
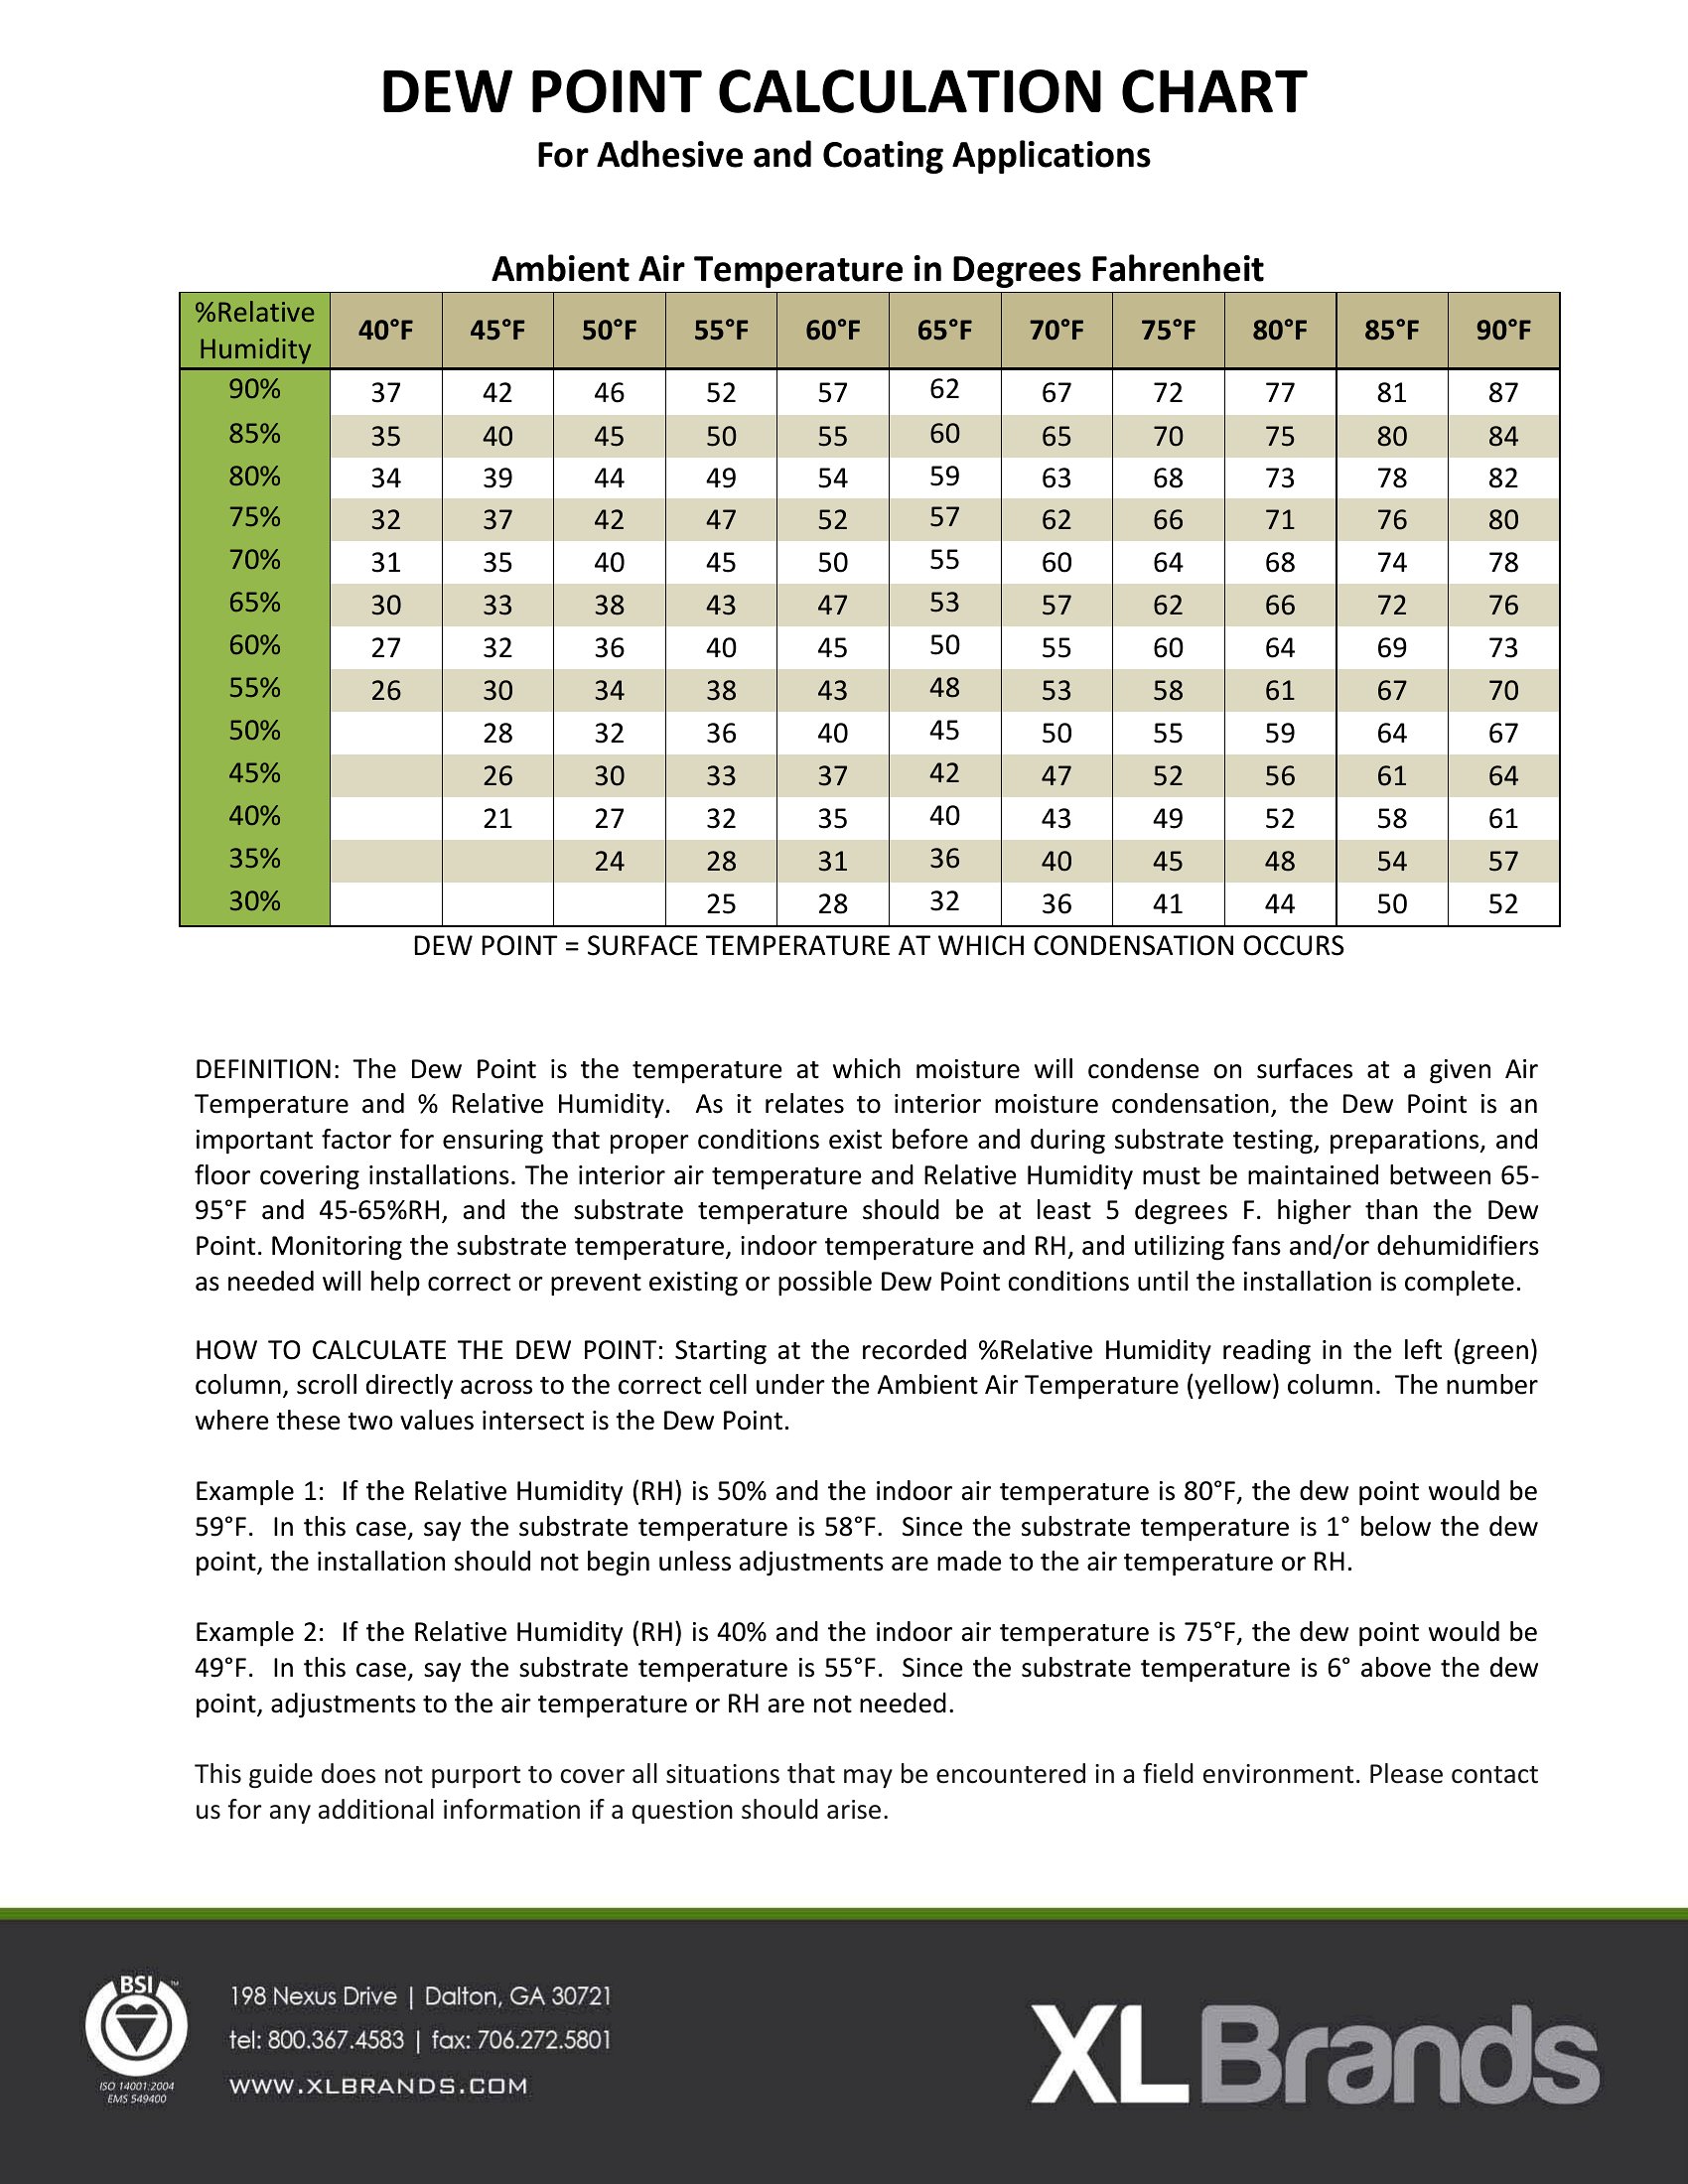
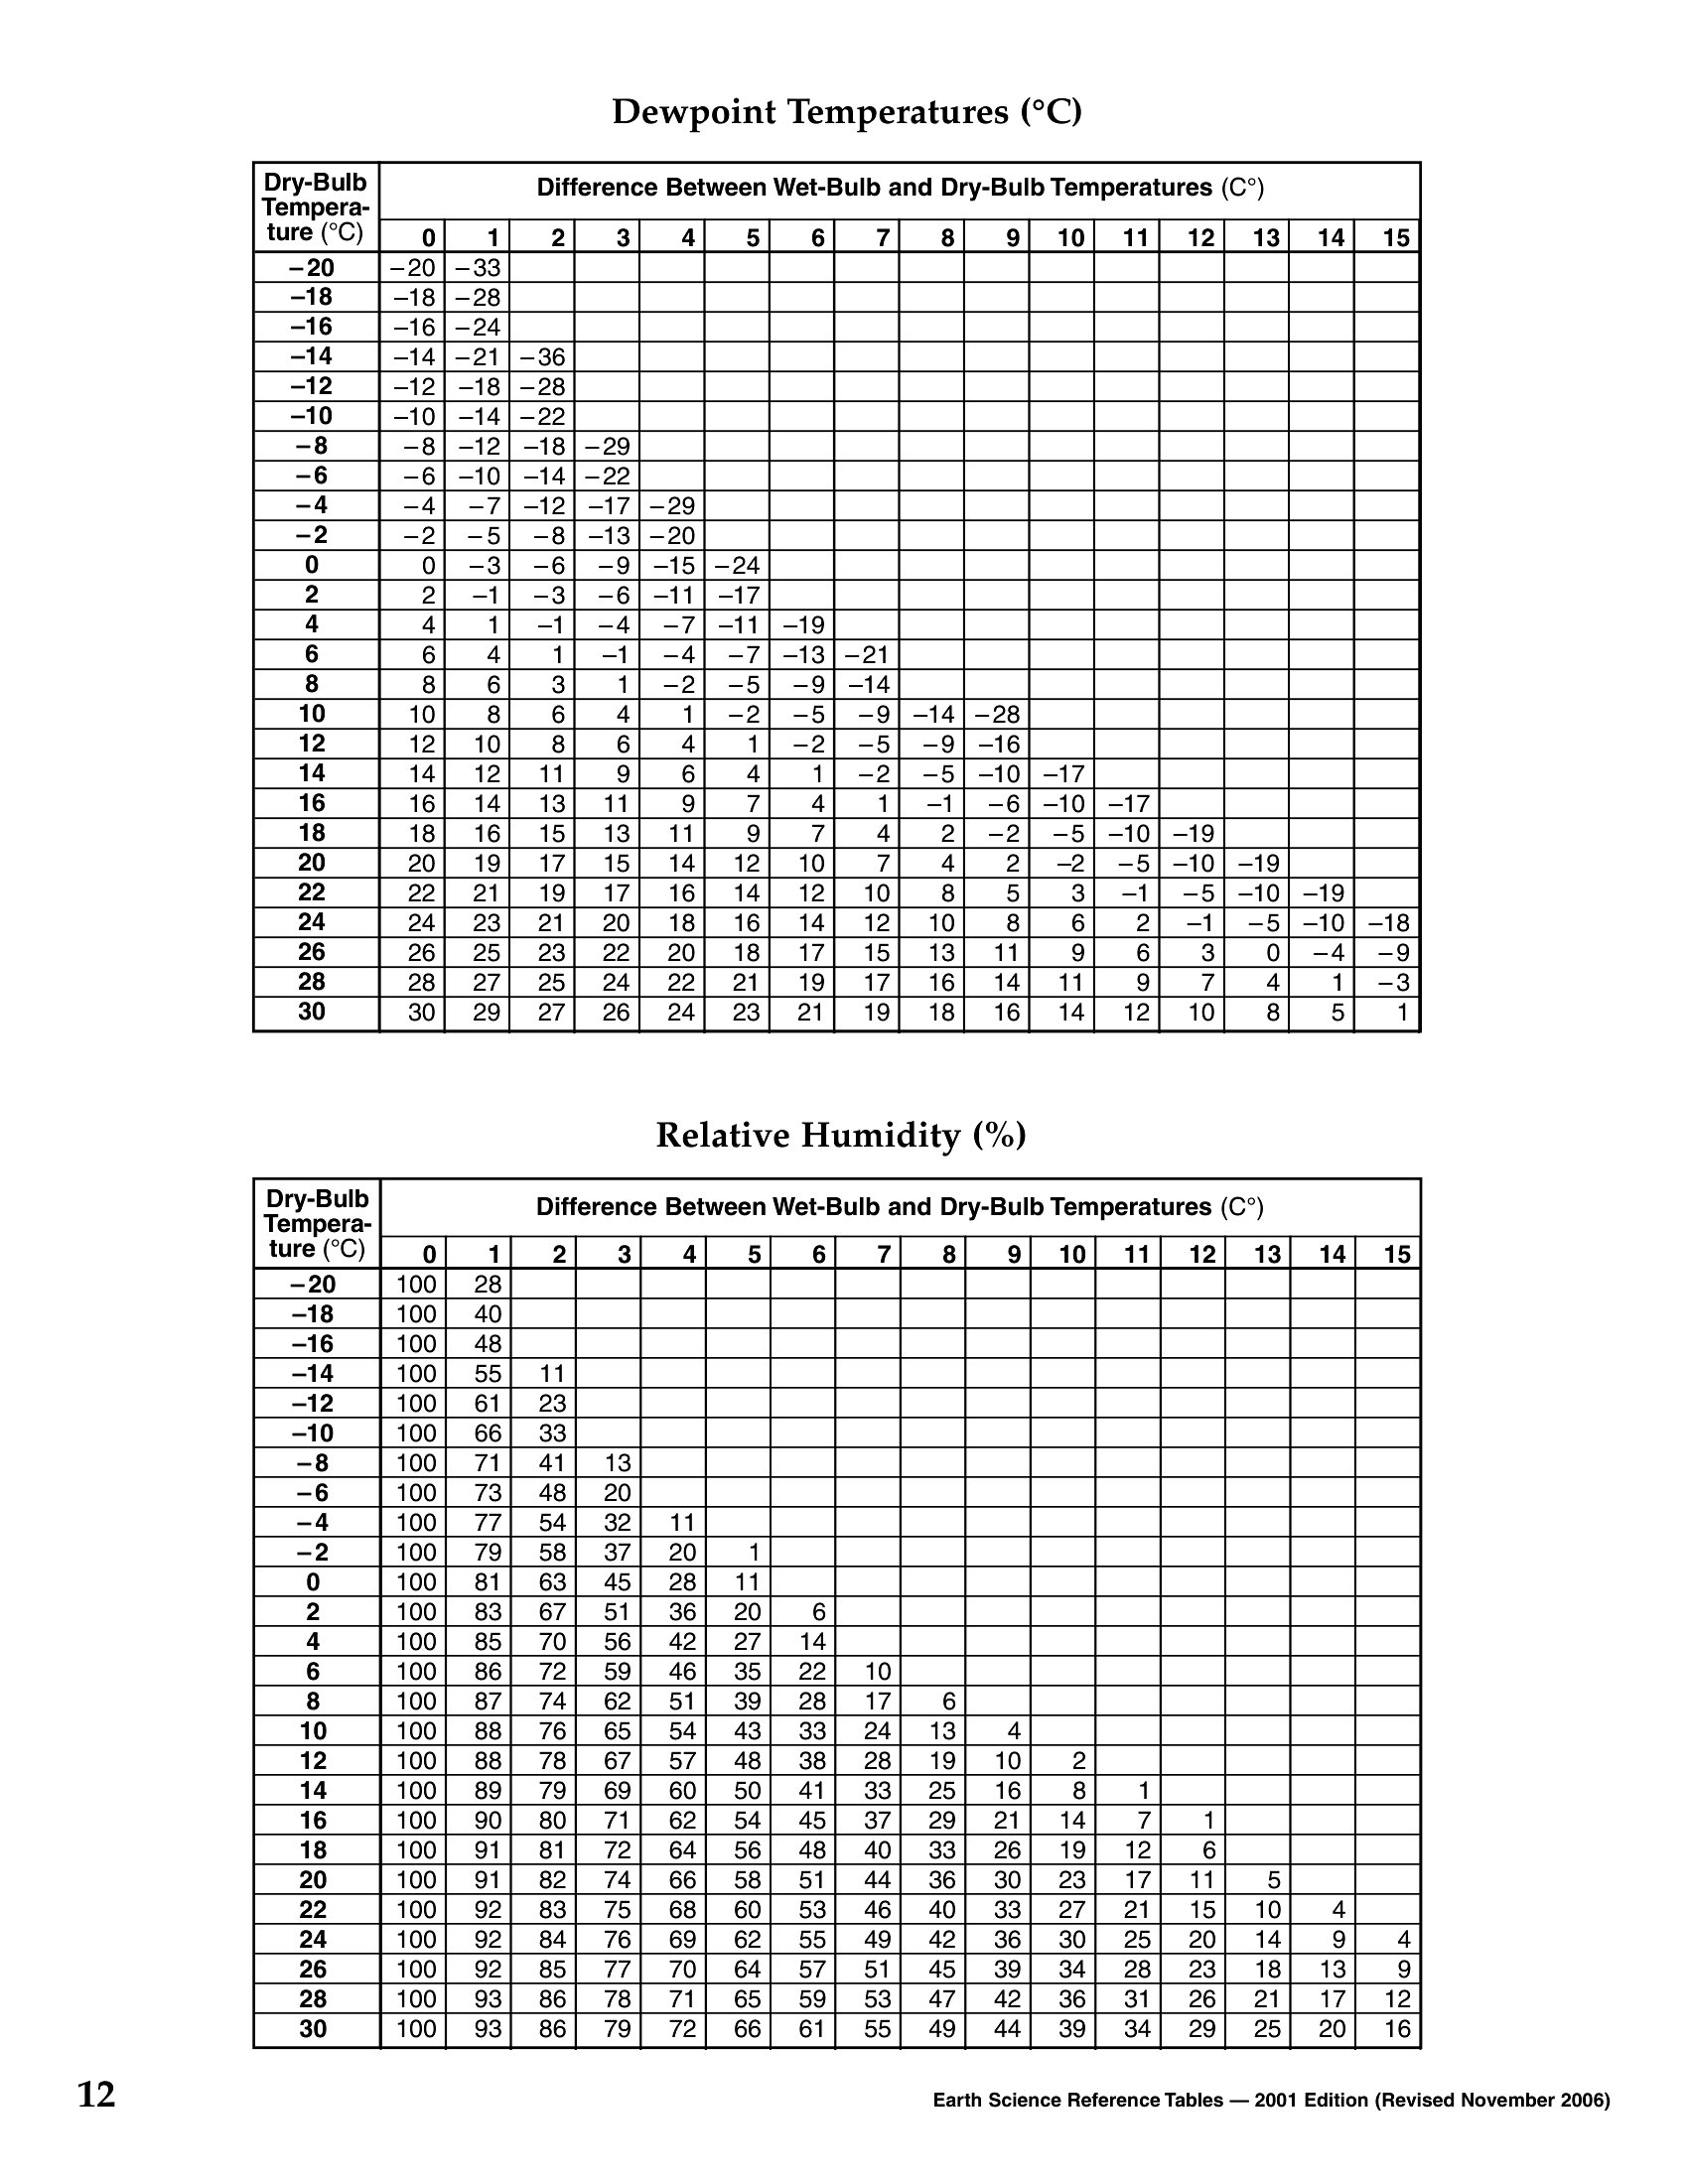
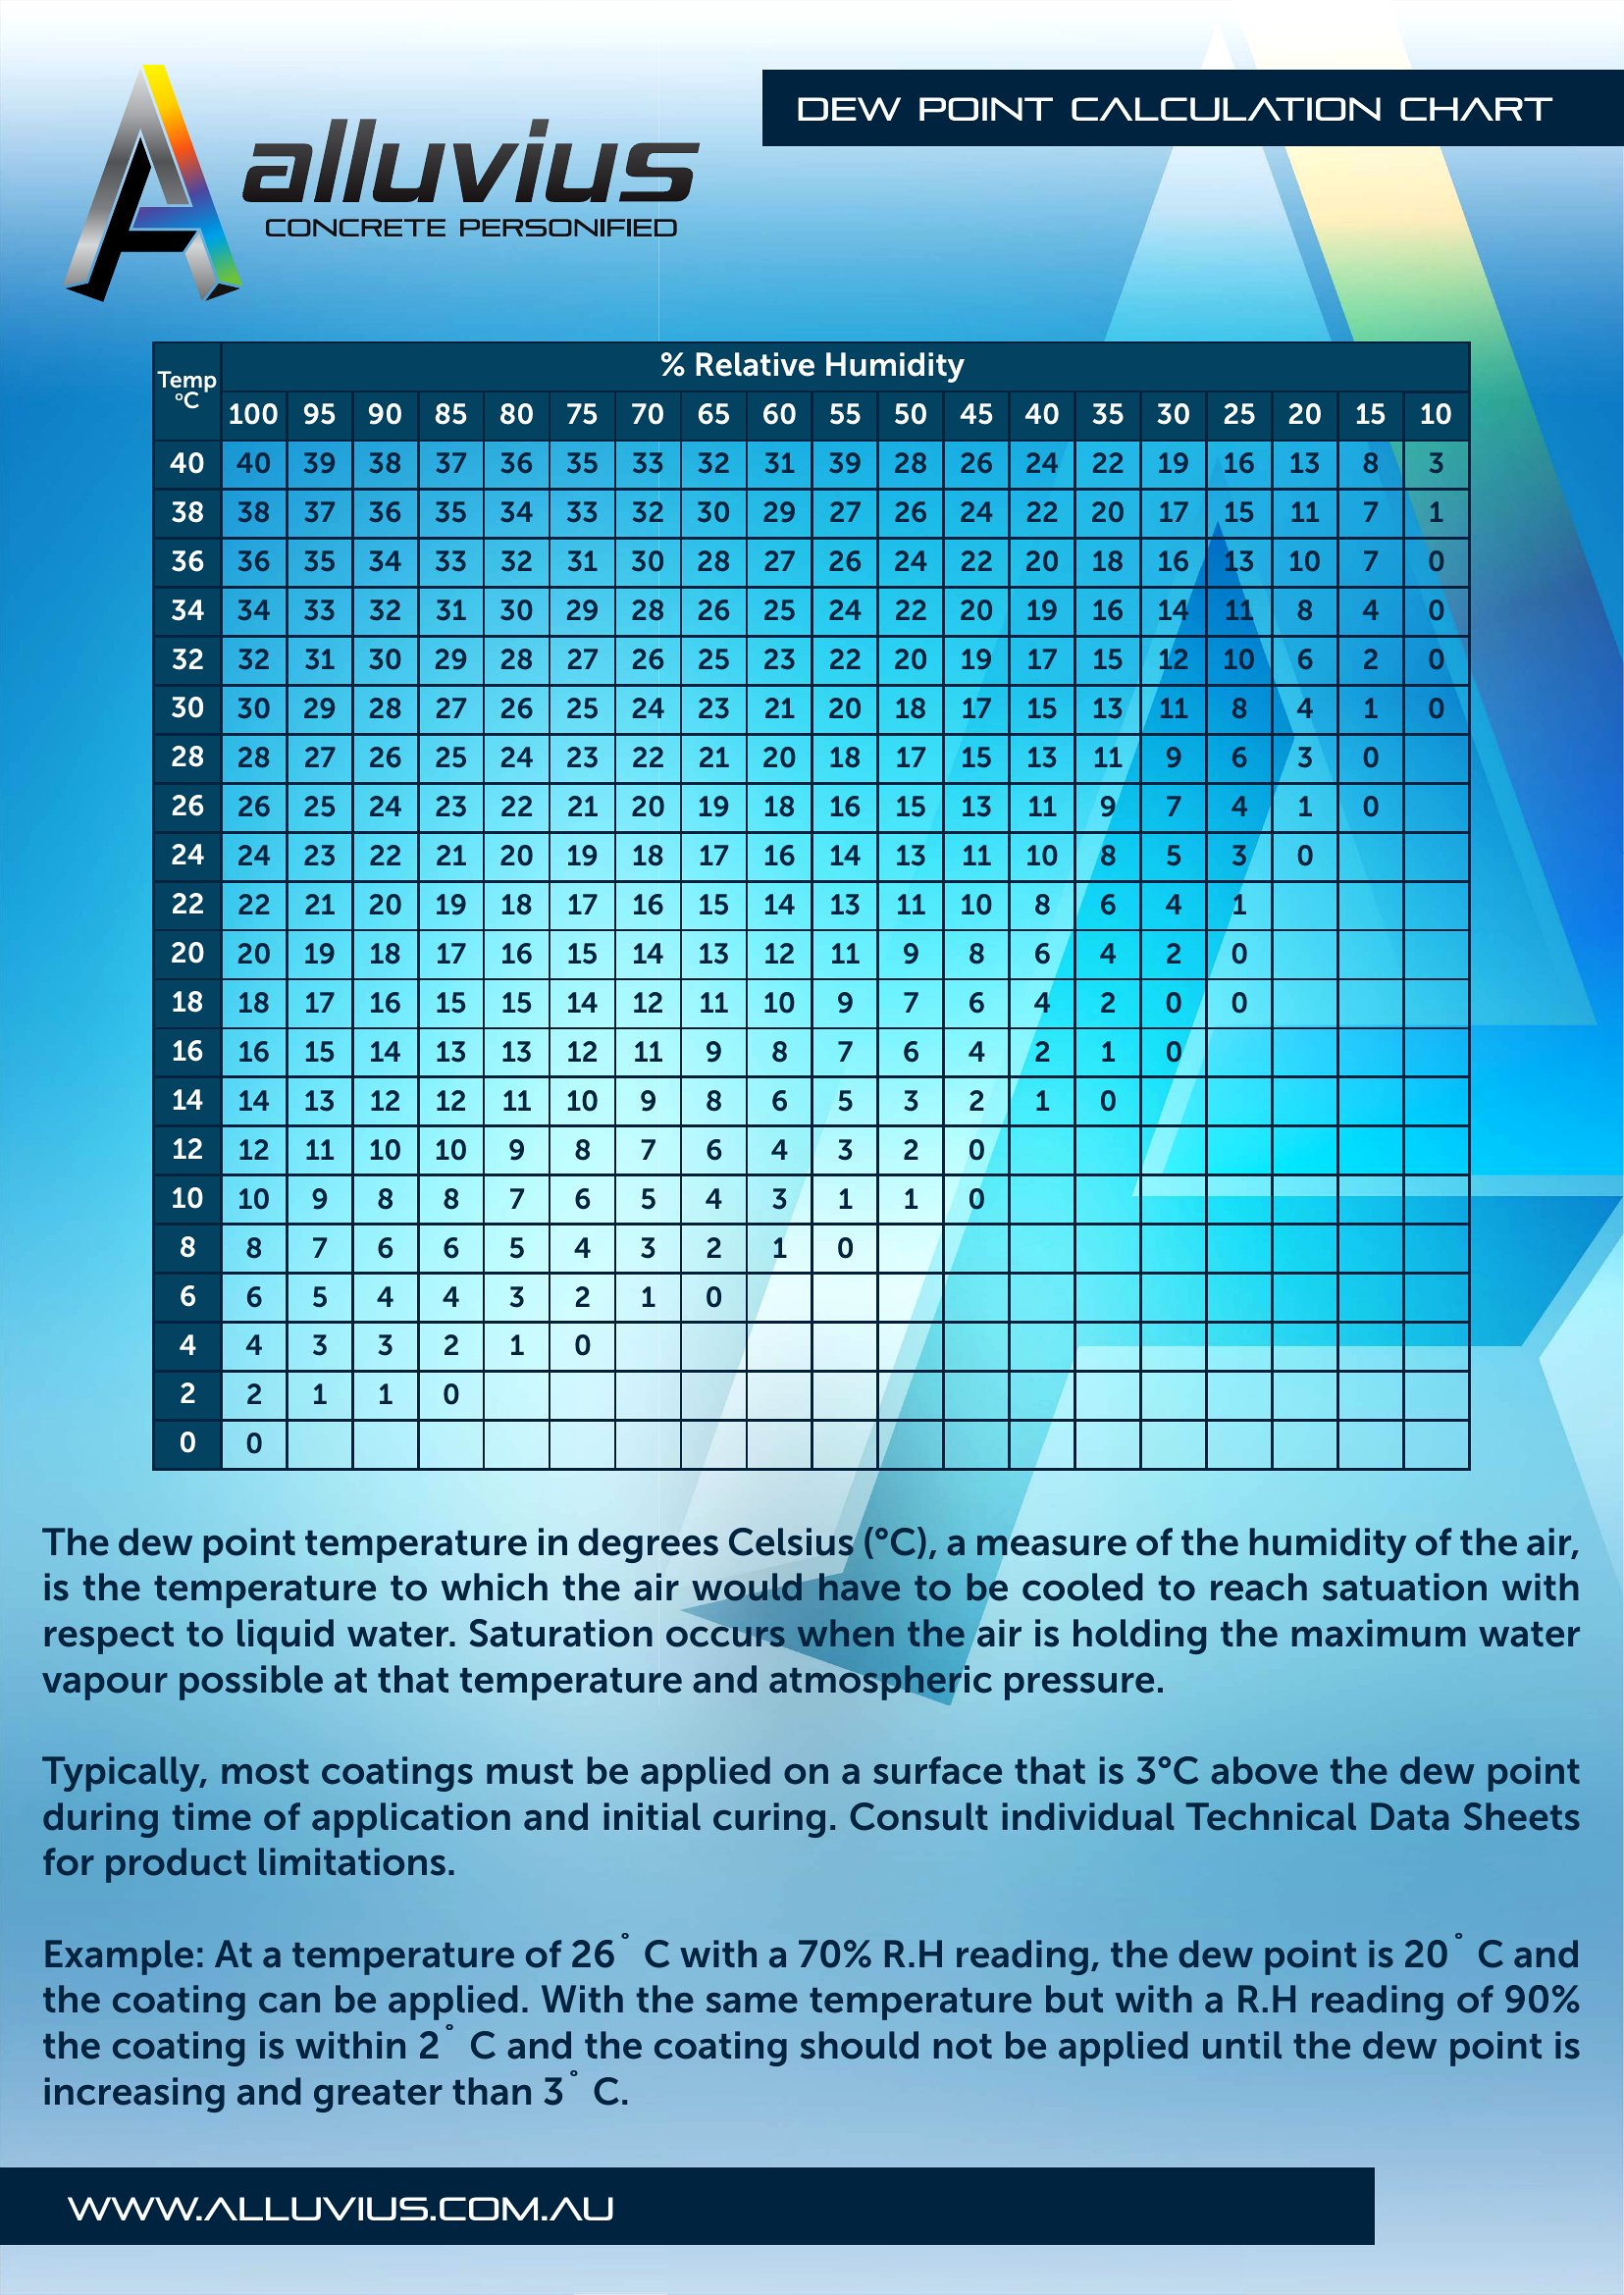
Dew point tells you when moisture in the air will start to condense, which matters whether you're running an HVAC system, storing crops, or checking conditions on a job site. This set of 36 charts lets you cross-reference temperature and relative humidity to read the dew point at a glance, no calculator needed. Technicians, facility managers, and students studying psychrometrics can keep an accurate reference close instead of redoing the math.

Every chart comes as a print-ready PDF, clean enough to read from across a room when it's pinned to a wall or tucked into a service binder. The grids are laid out so the numbers stay legible even at a quick glance. Choose the range that matches your work and print it for the shop, classroom, or field kit.

When to use this Dew Point Charts template

  • HVAC technicians troubleshooting moisture buildup in ductwork or equipment rooms use these charts to instantly check if condensation risks exist during system operation—no complex calculations needed on-site.
  • Agricultural storage facility managers cross-reference warehouse temperatures and humidity readings to adjust ventilation and prevent spoilage in grain, seed, or produce storage areas.
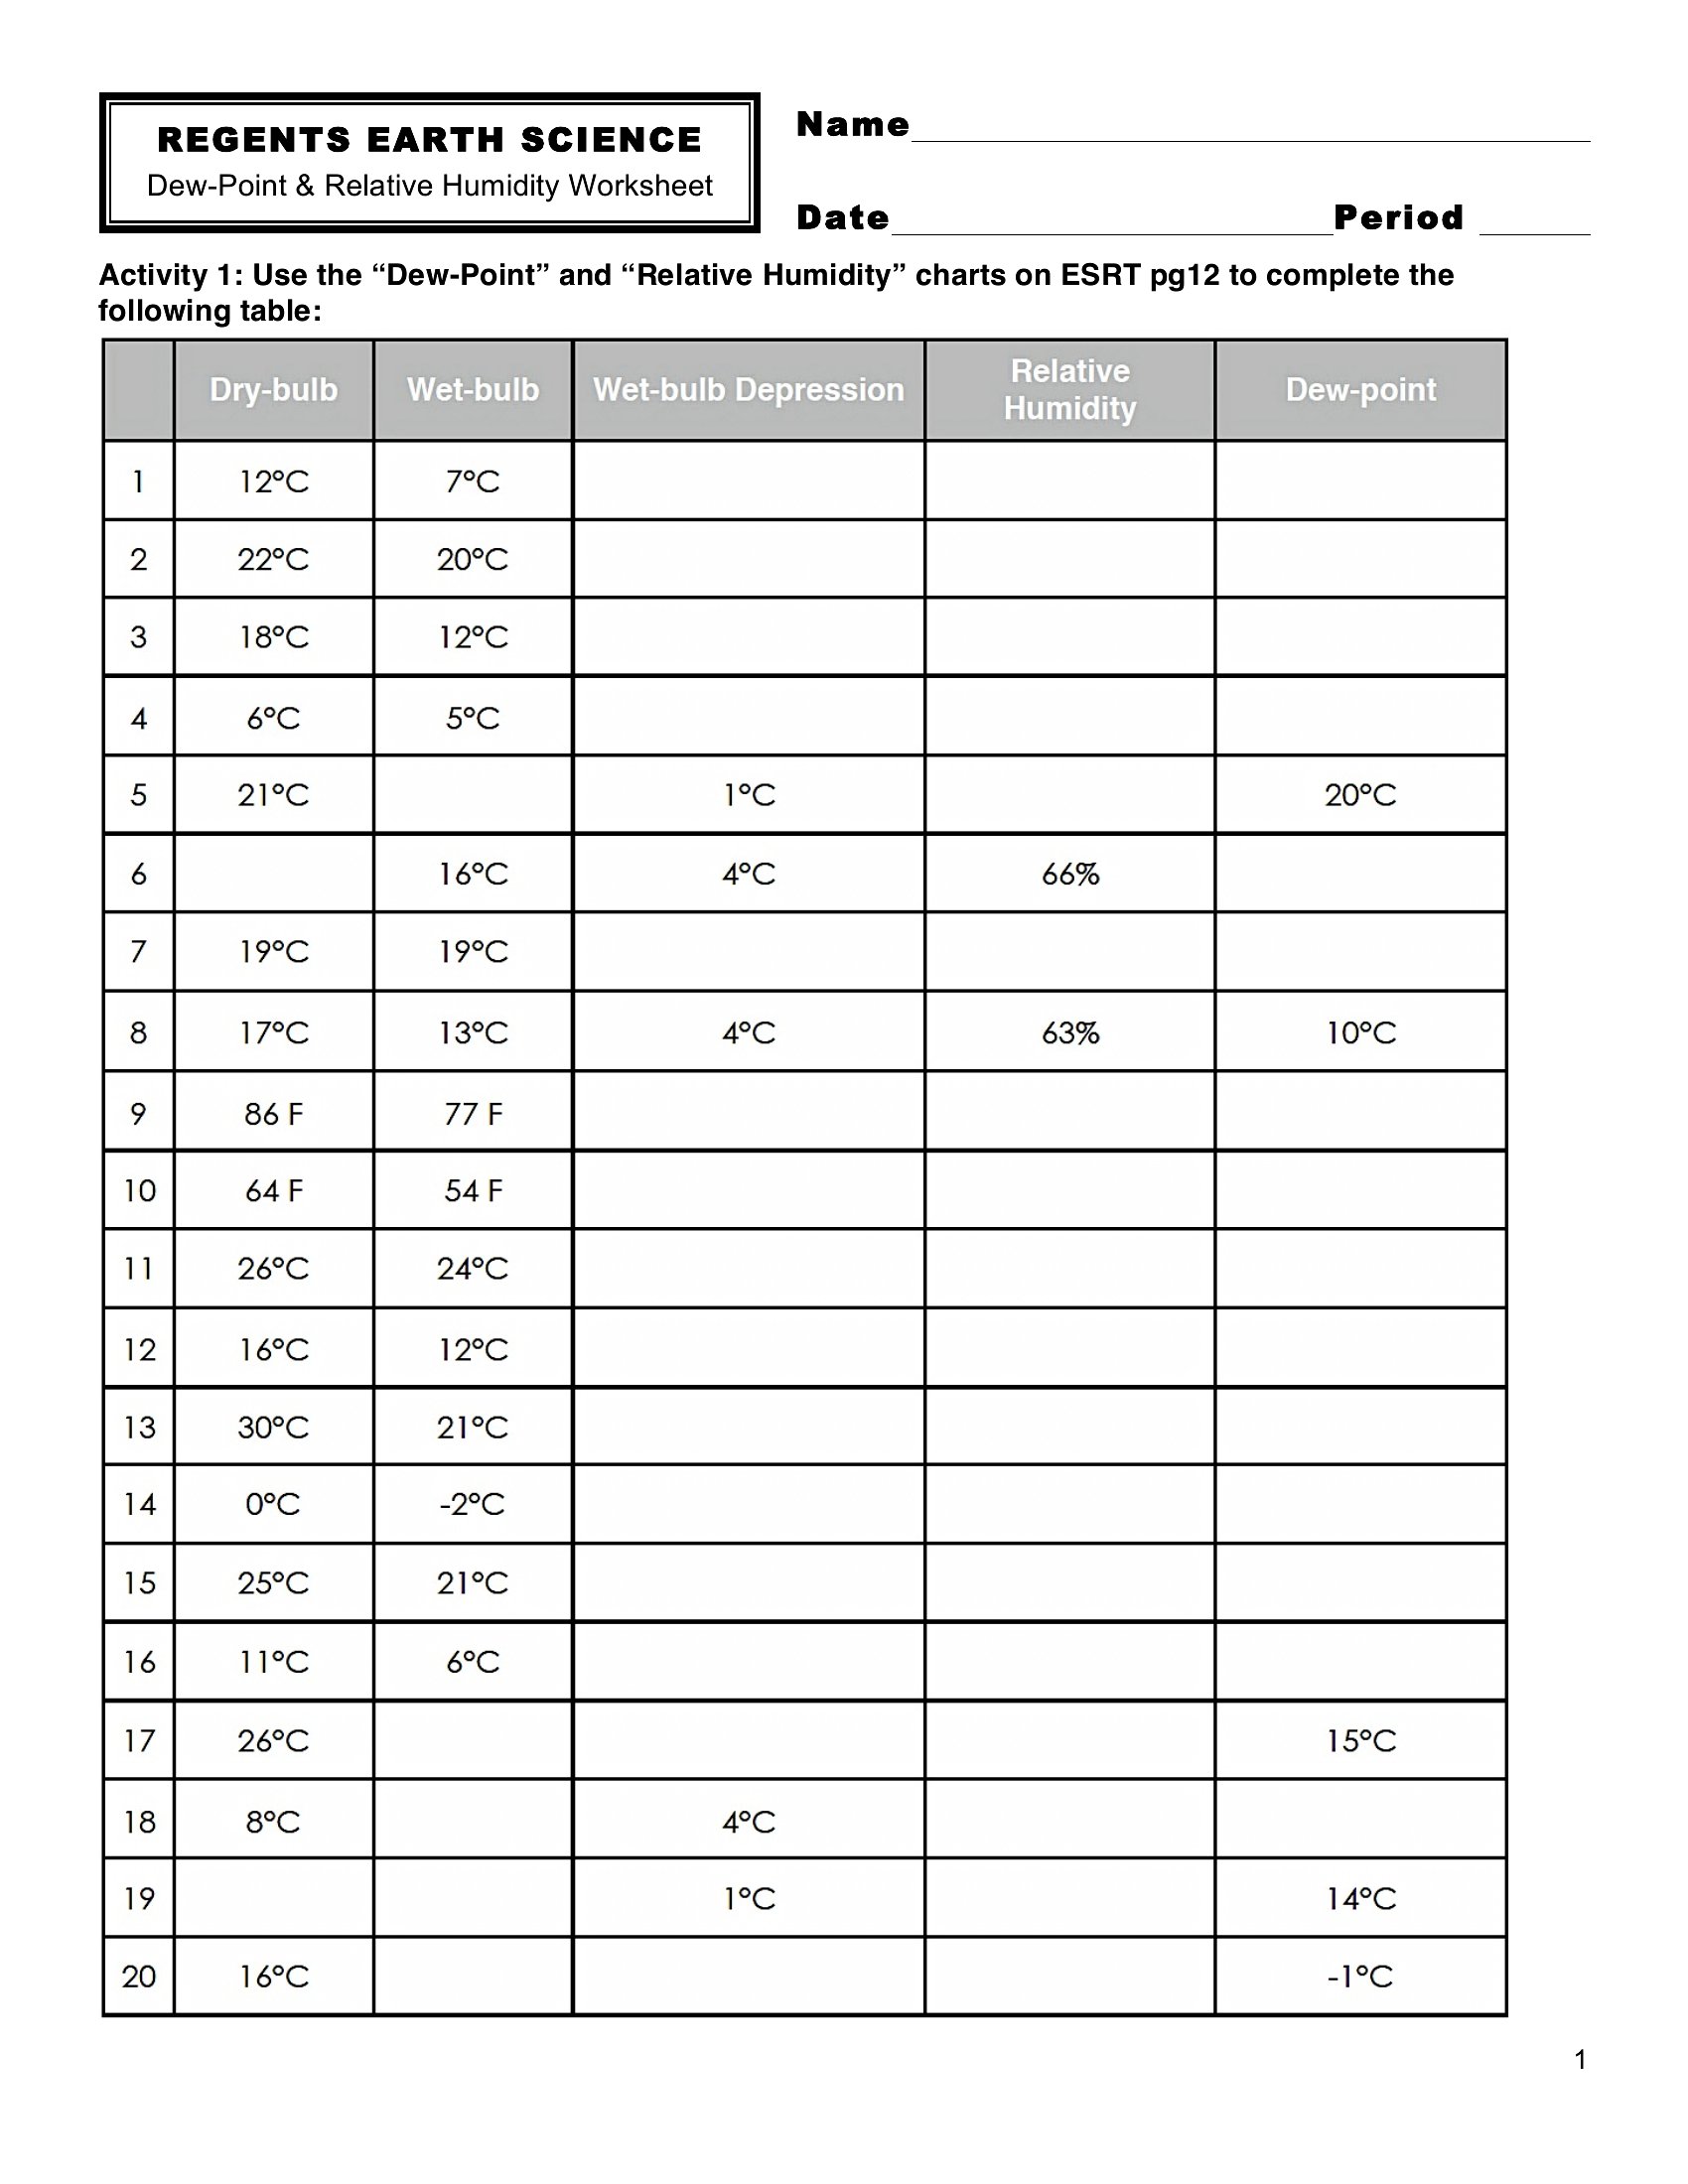
  • Students in meteorology or mechanical engineering labs compare dew point charts to field measurements to validate real-world psychrometric experiments or verify textbook examples without calculator errors.
  • Construction site foremen print and laminate these charts near work zones to quickly assess whether morning dew or high humidity will delay exterior painting, concrete pouring, or roofing projects.

Which format should I download?

PDF

PDF is the only format here—ideal for durability and ease of printing. Use the charts as-is for quick reference in field conditions where digital tools aren’t available. Laminate them for write-in notes on job sites or study them on-site. The non-editable format ensures accuracy for critical decisions like HVAC adjustments or humidity-sensitive tasks.

Choose from 36 Dew Point Charts Templates

How to use this Dew Point Charts template

Are these dew point charts accurate for extreme climates like deserts or tropical regions?

These charts cover the standard psychrometric range (0°F to 120°F / -18°C to 49°C), which works for most global conditions. For hyper-arid or ultra-wet environments, verify readings with a digital hygrometer for precision. The charts simplify cross-checking but shouldn’t replace calibrated instruments in research or industrial settings.

Can I use these to estimate indoor humidity risks for mold prevention in older buildings?

Yes, but pair them with a thermometer and hygrometer. Note that indoor air often has lower airflow than outdoor readings, so dew points may be slightly higher than charts suggest. Use the data to spot when relative humidity nears 60%, a common tipping point for mold growth in poorly ventilated spaces.

How do I adjust for altitude if I’m working at high elevations, like in mountain facilities?

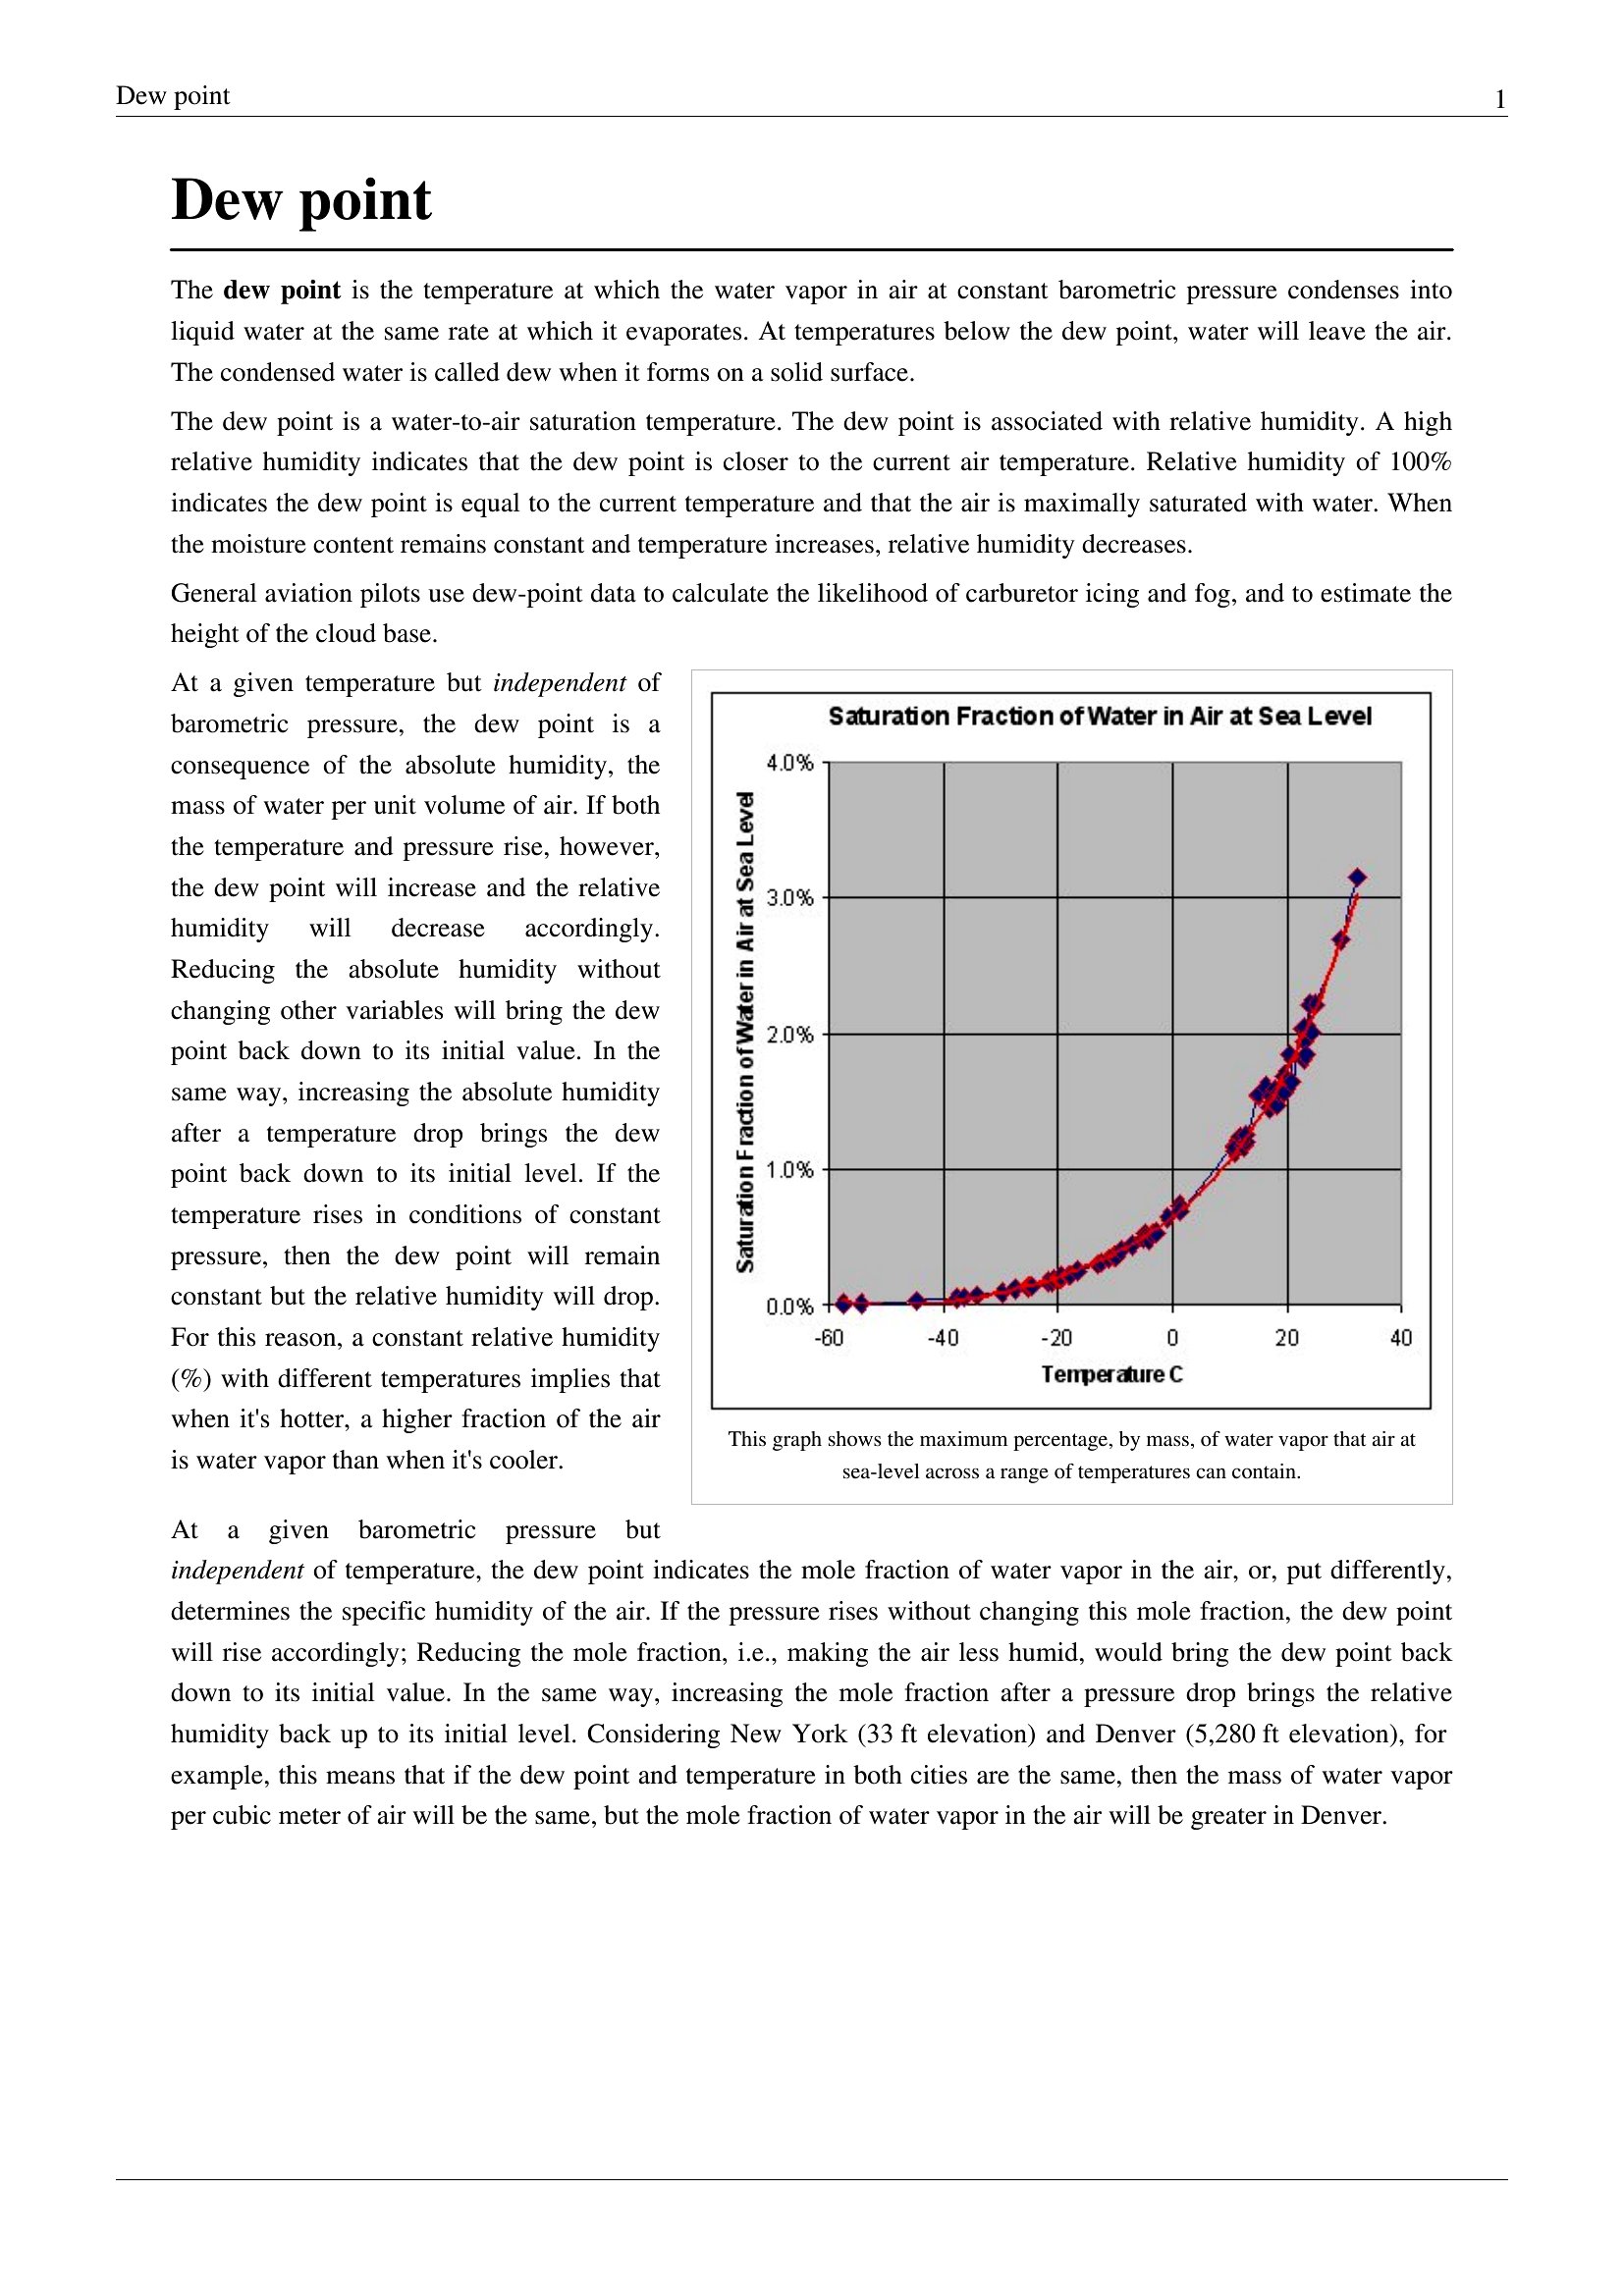
These charts assume sea-level atmospheric pressure. At elevations above 5,000 feet, dew point readings may be 2–5% lower due to reduced air density. For critical applications, consult psychrometric charts adjusted for your specific altitude or factor in a small correction downward when interpreting the values.

Comments

Join the conversation

Sign in to share your thoughts and leave a comment on this resource.

Newsletter

Get Weekly Design Updates

Join our community to receive curated resources and inspiration.

Weekly Tips Resources Early Access

We respect your privacy. Confirmation email required. Privacy Policy