Free Printable Dew Point Charts (PDF)
Data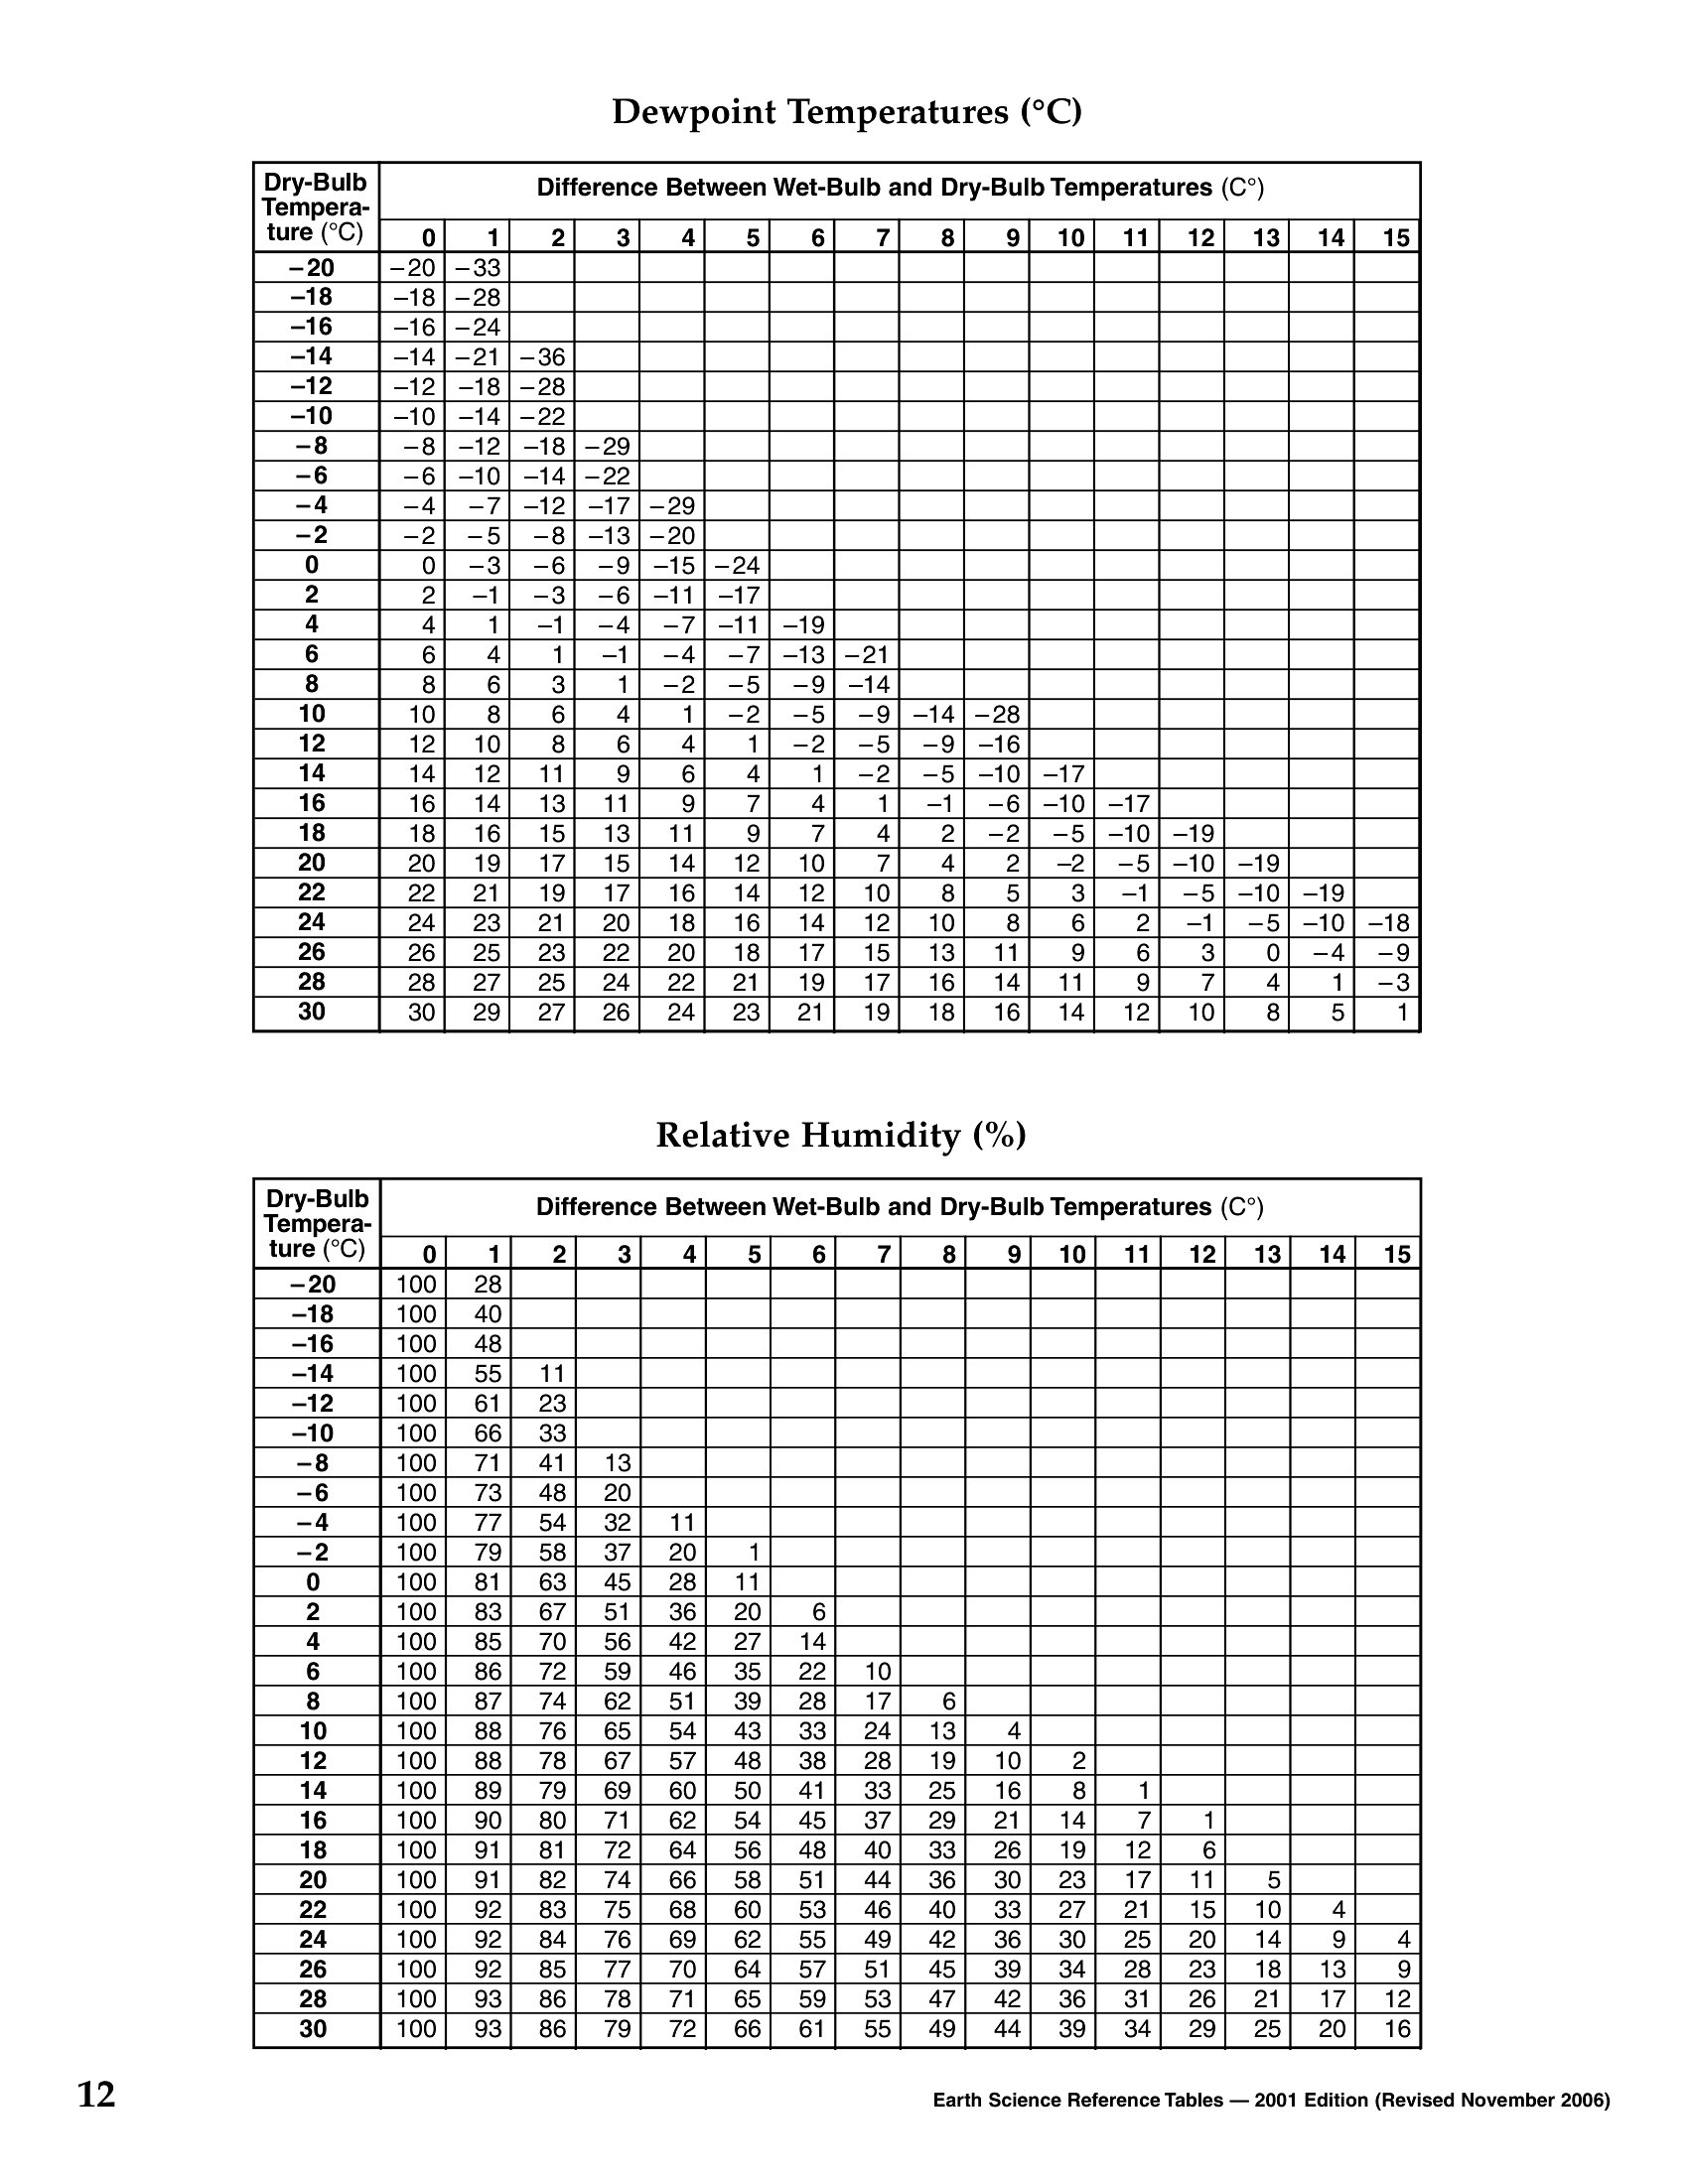
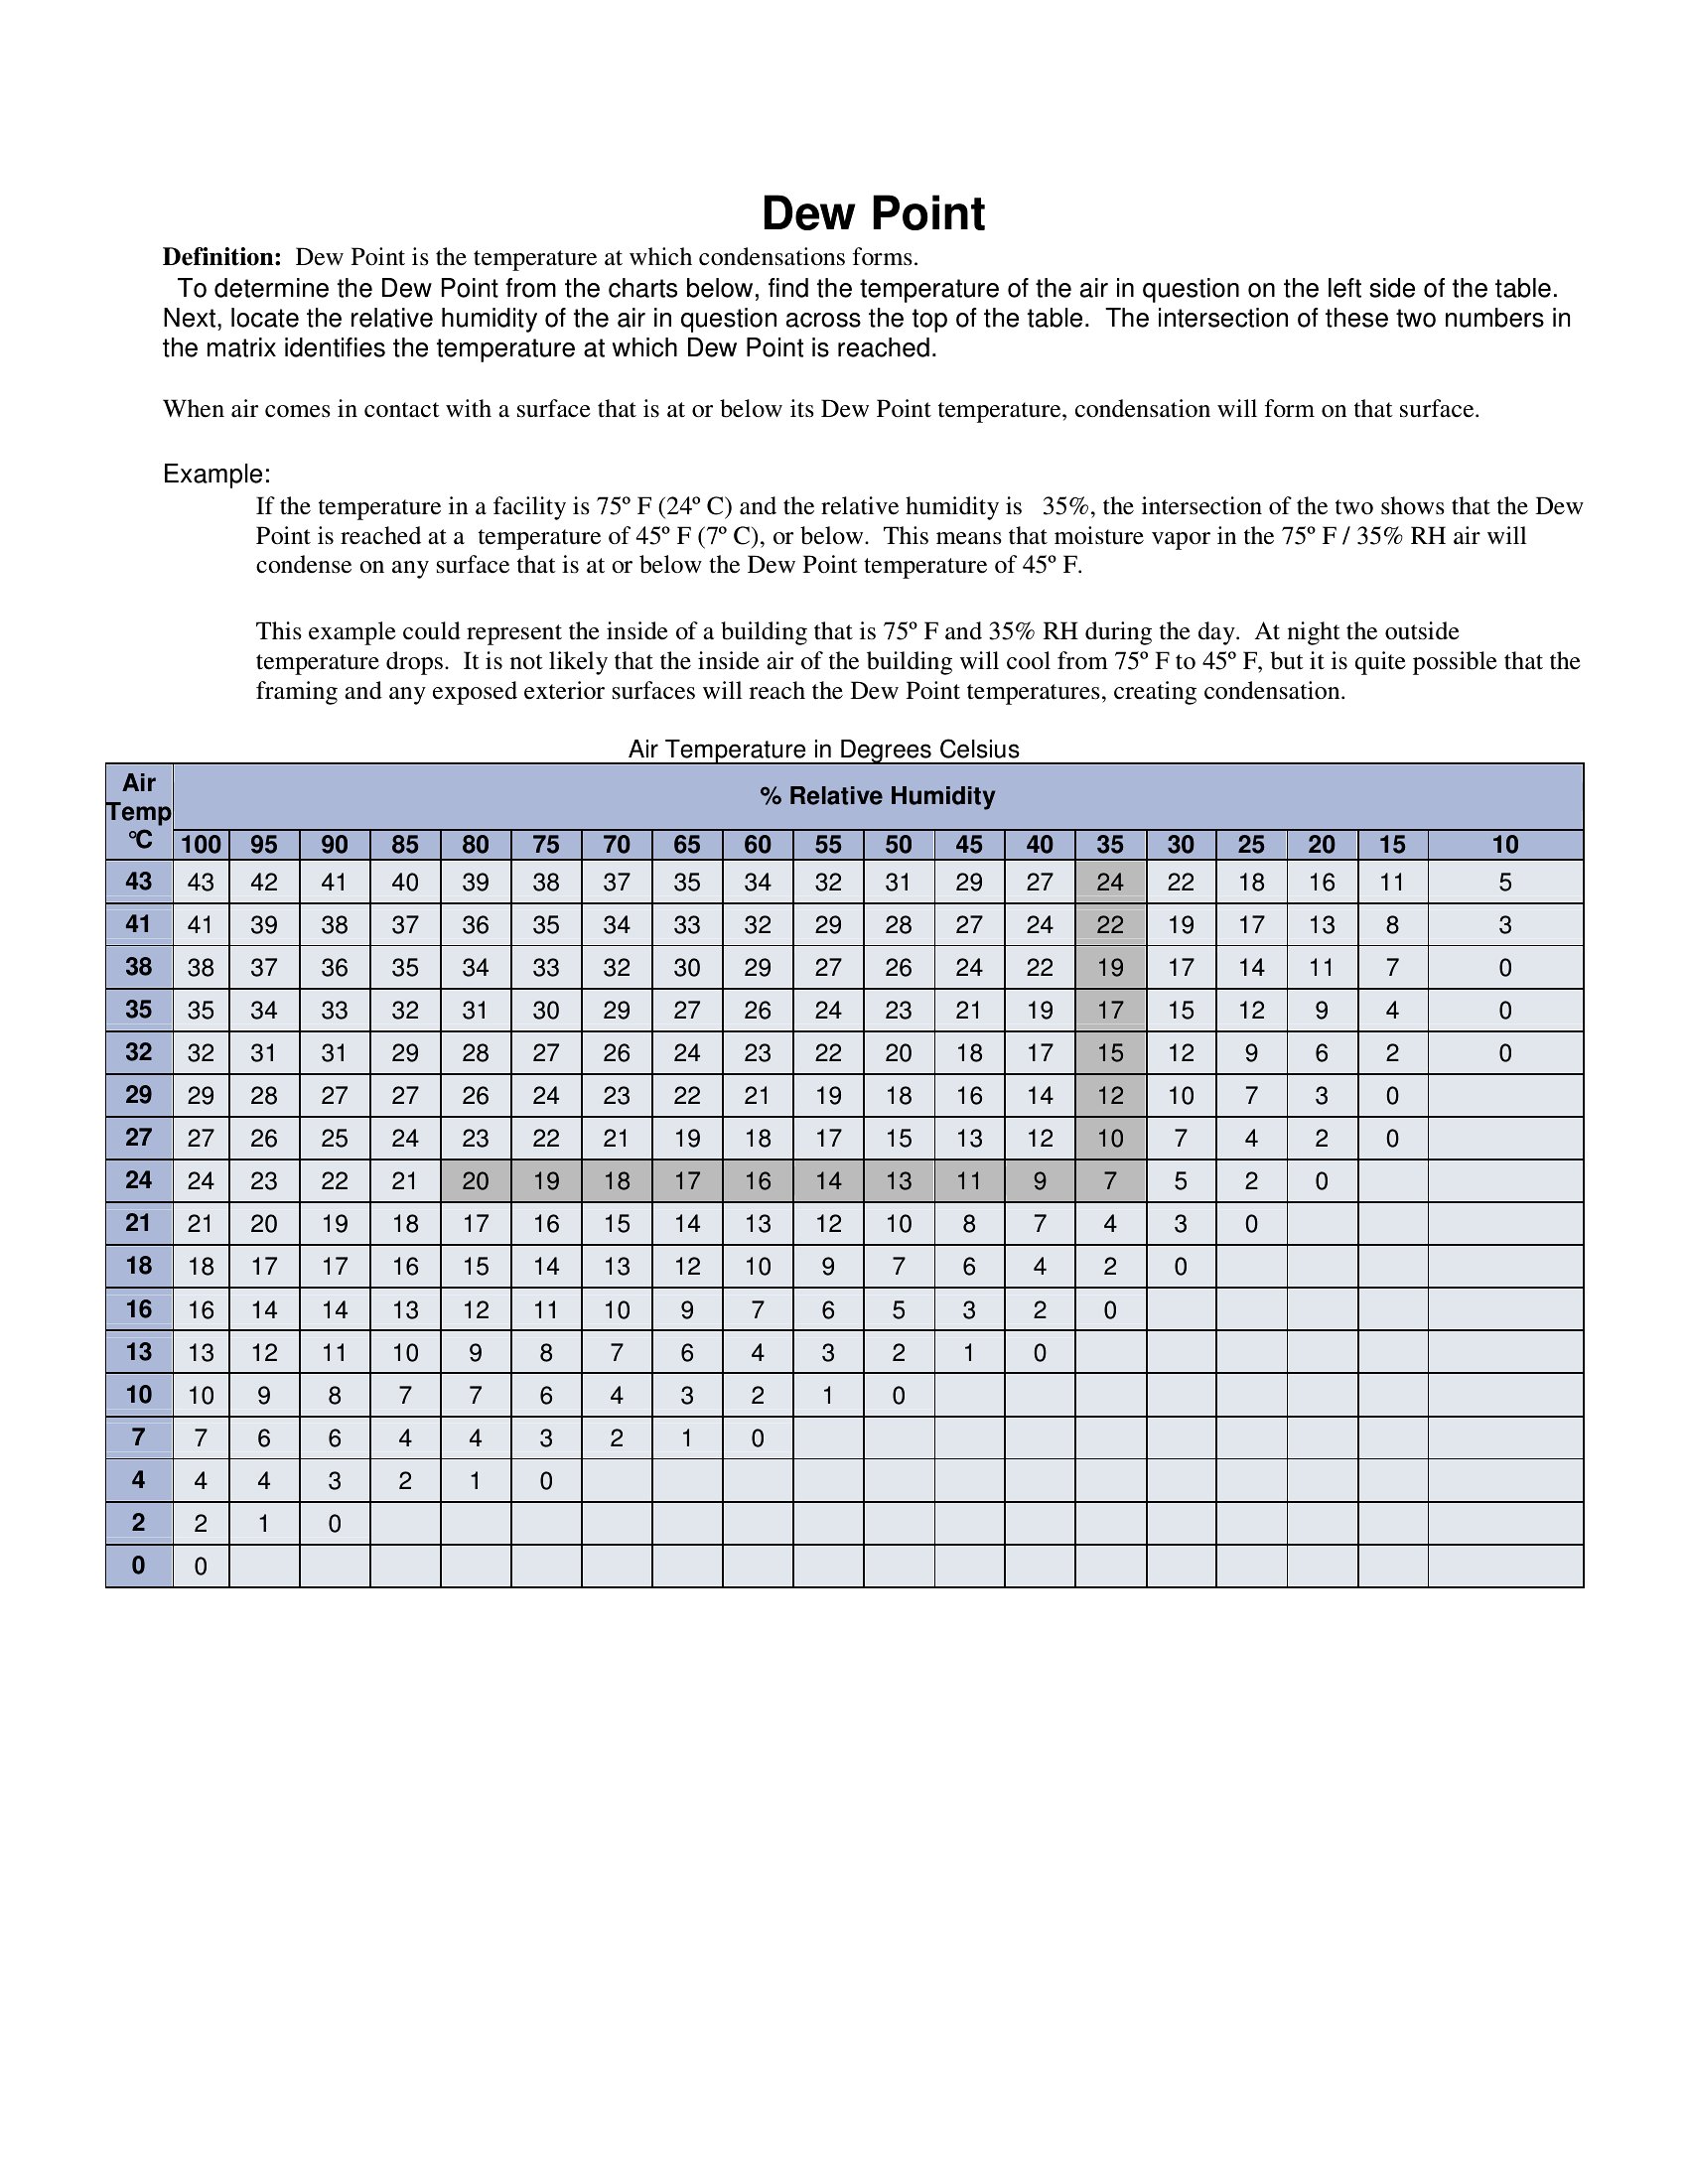
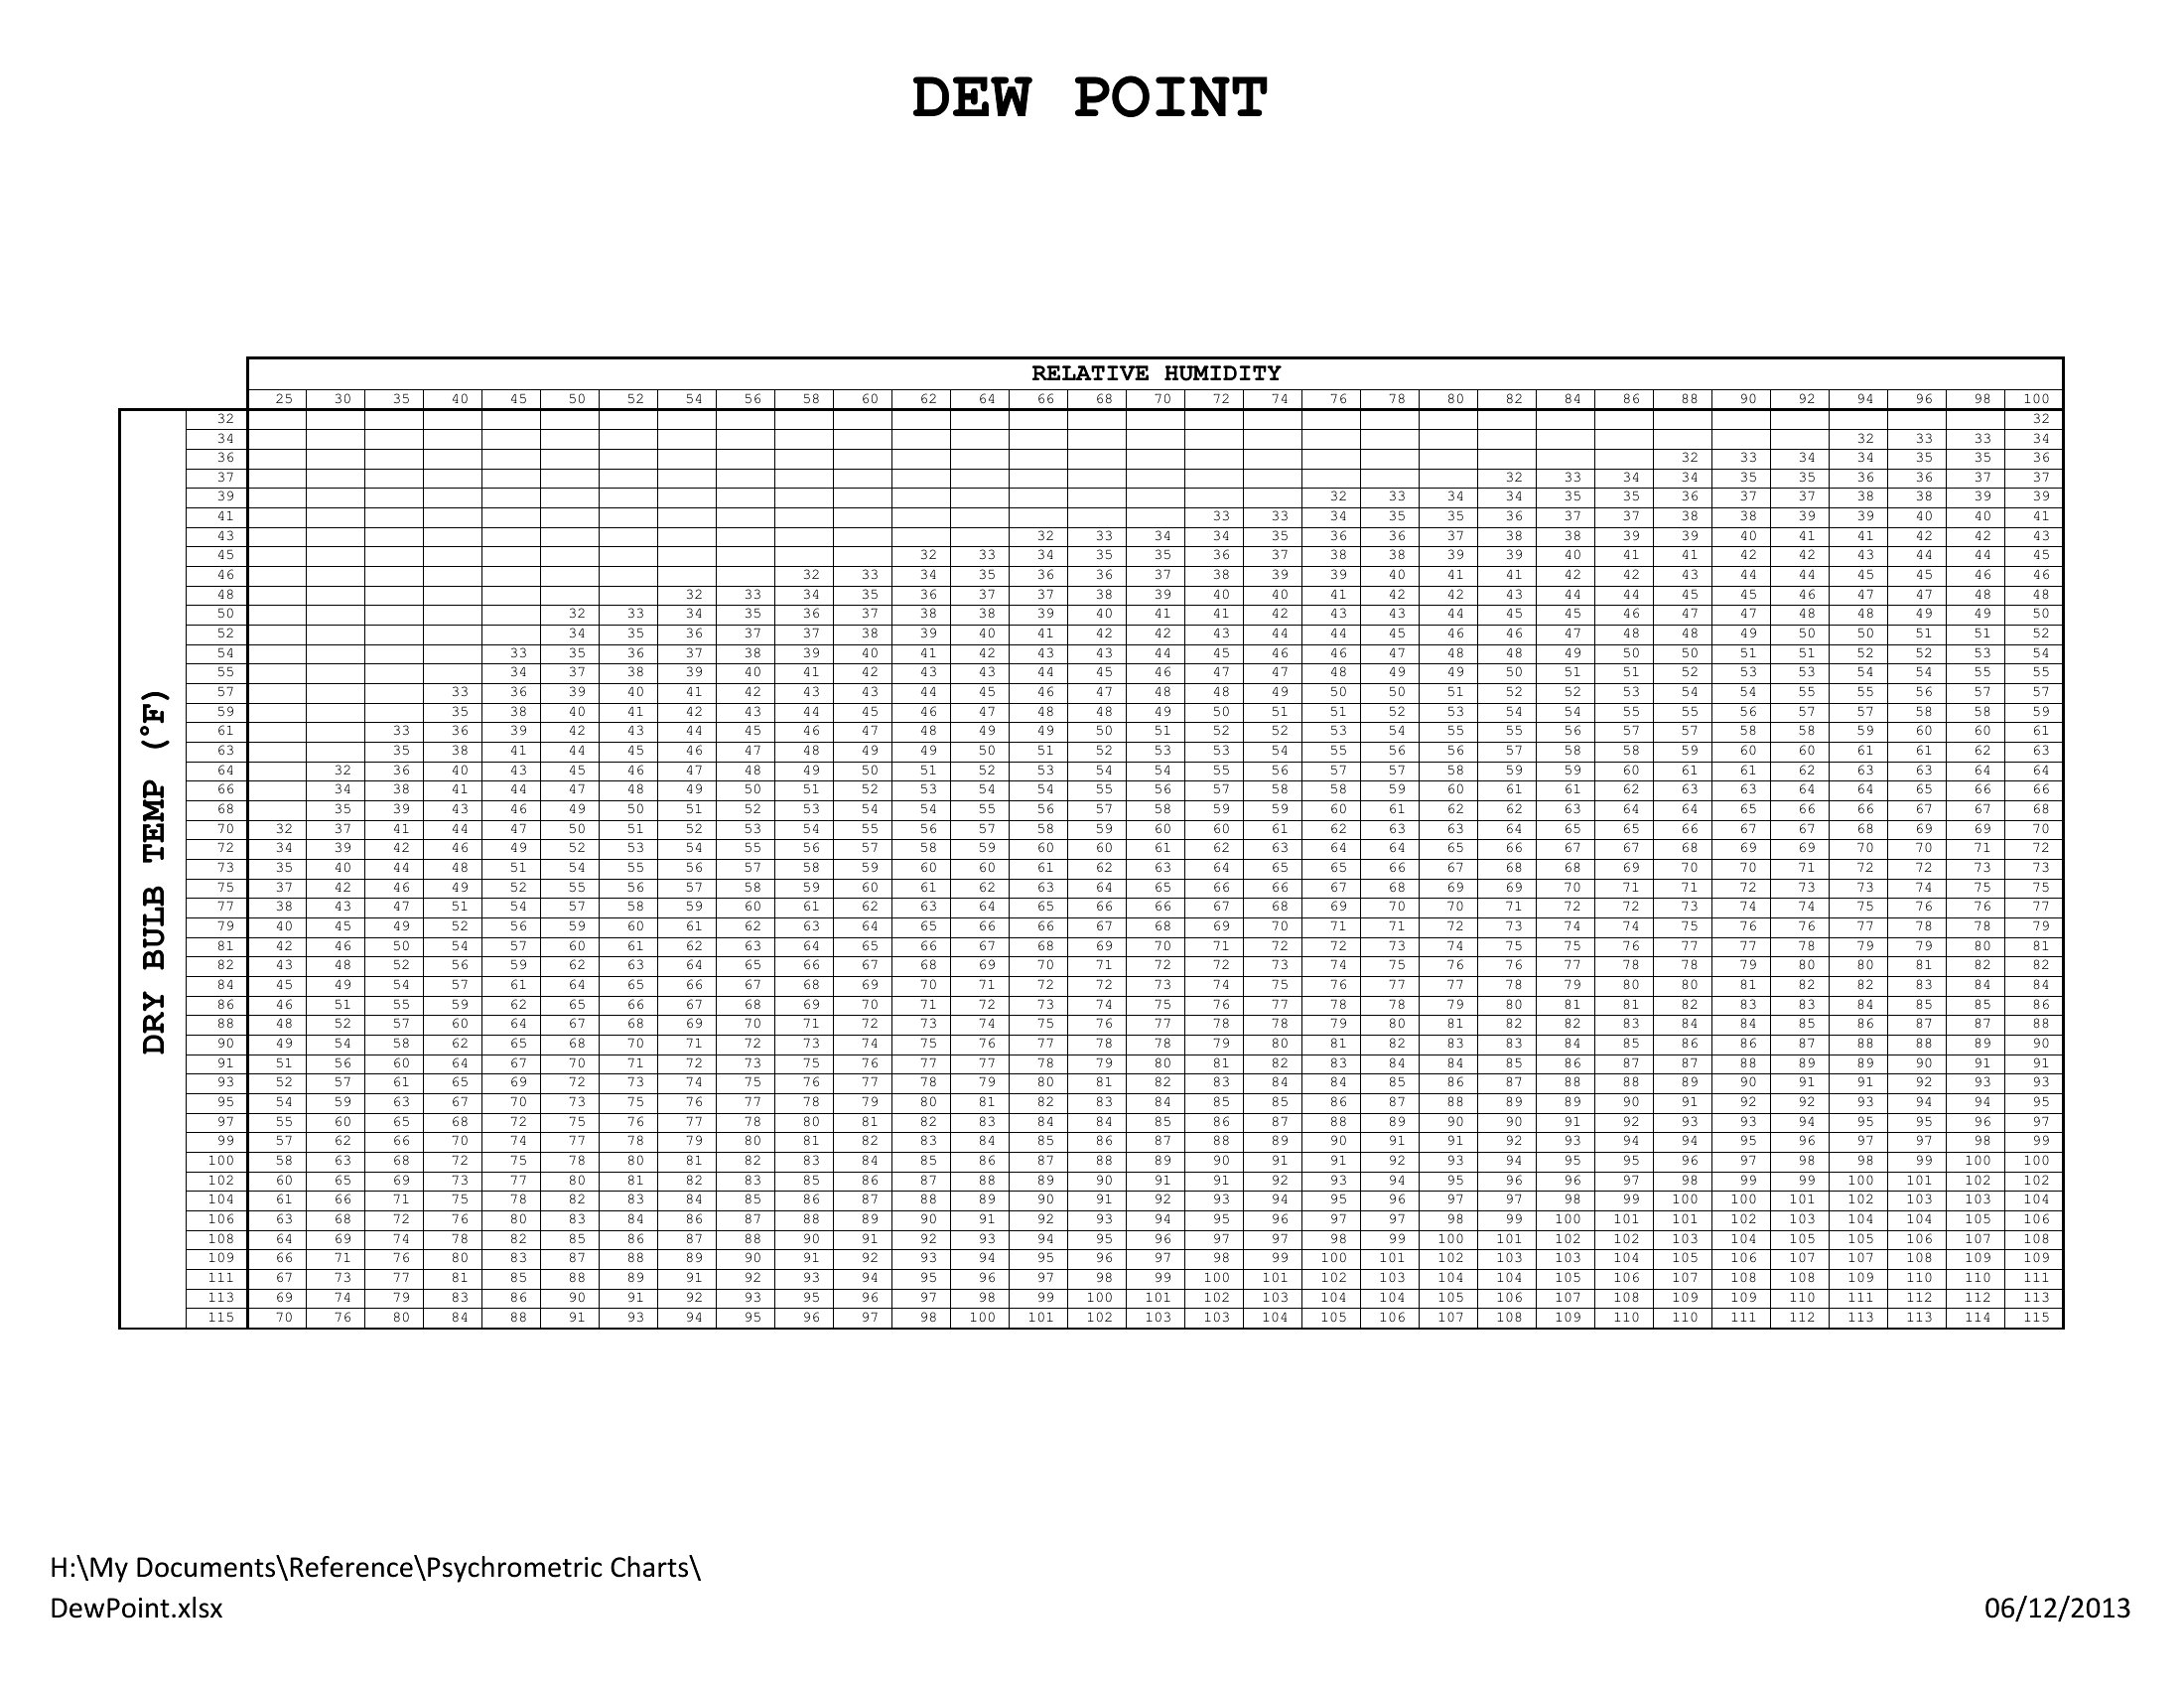
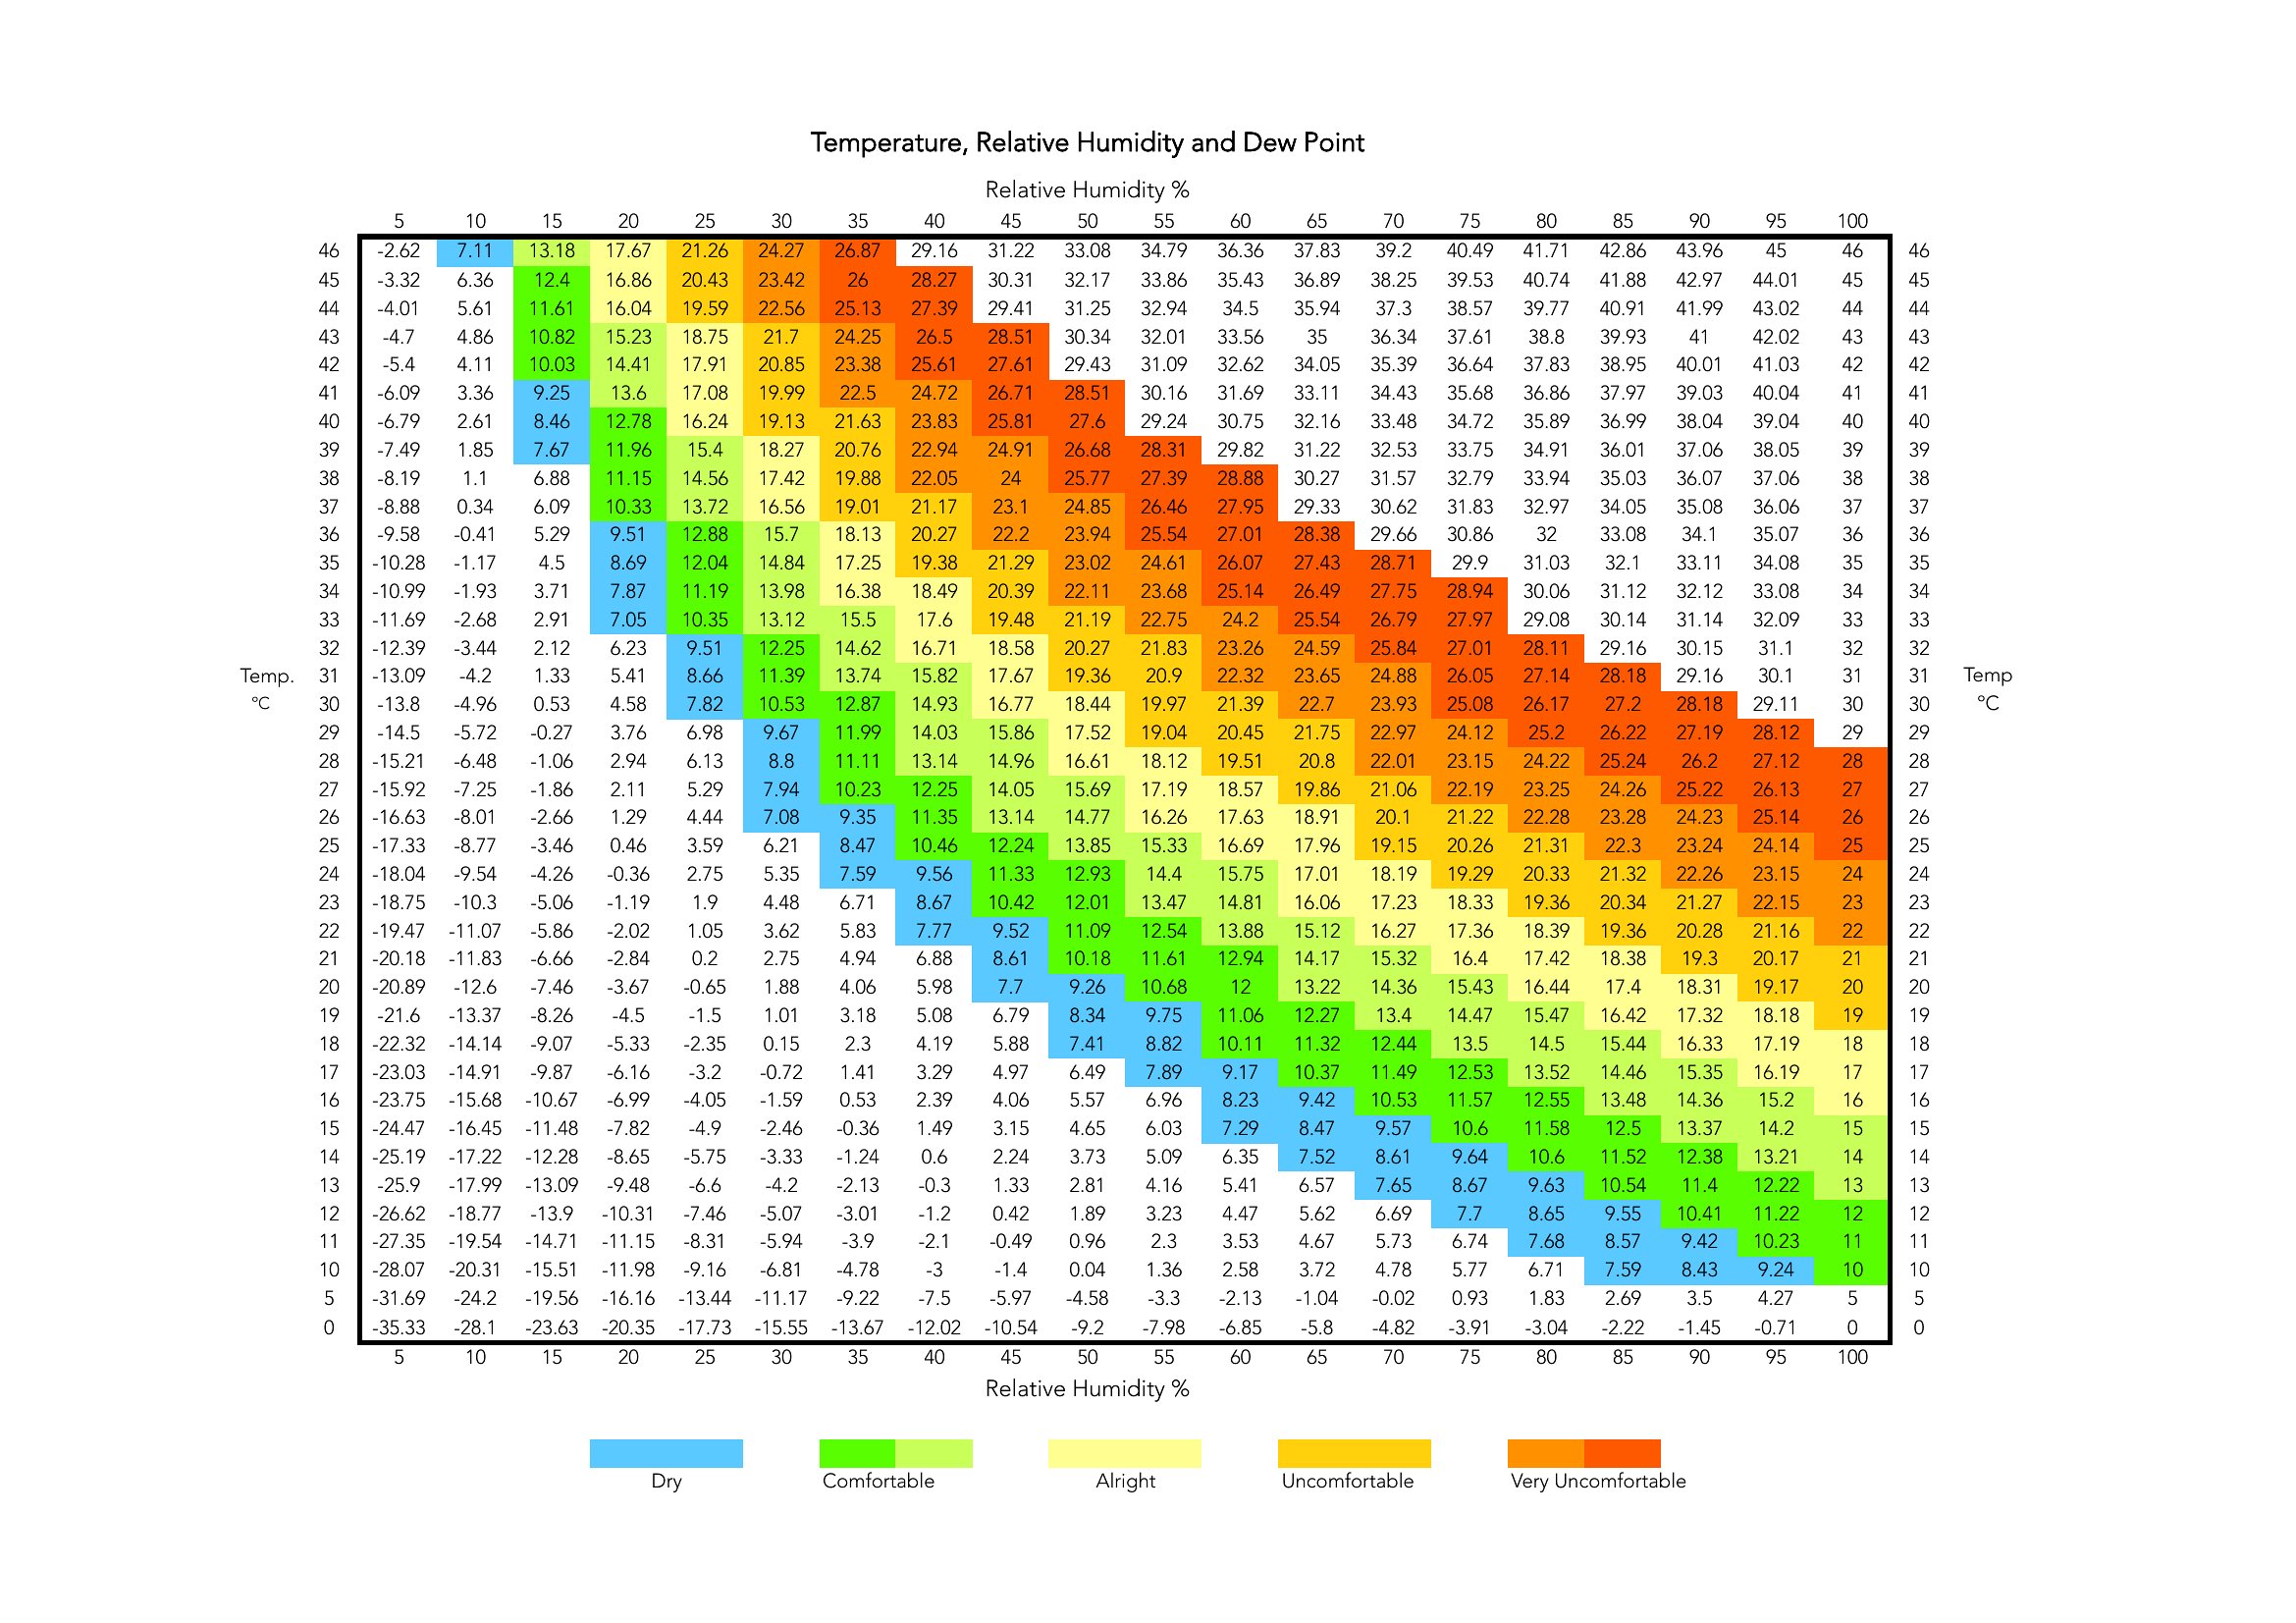
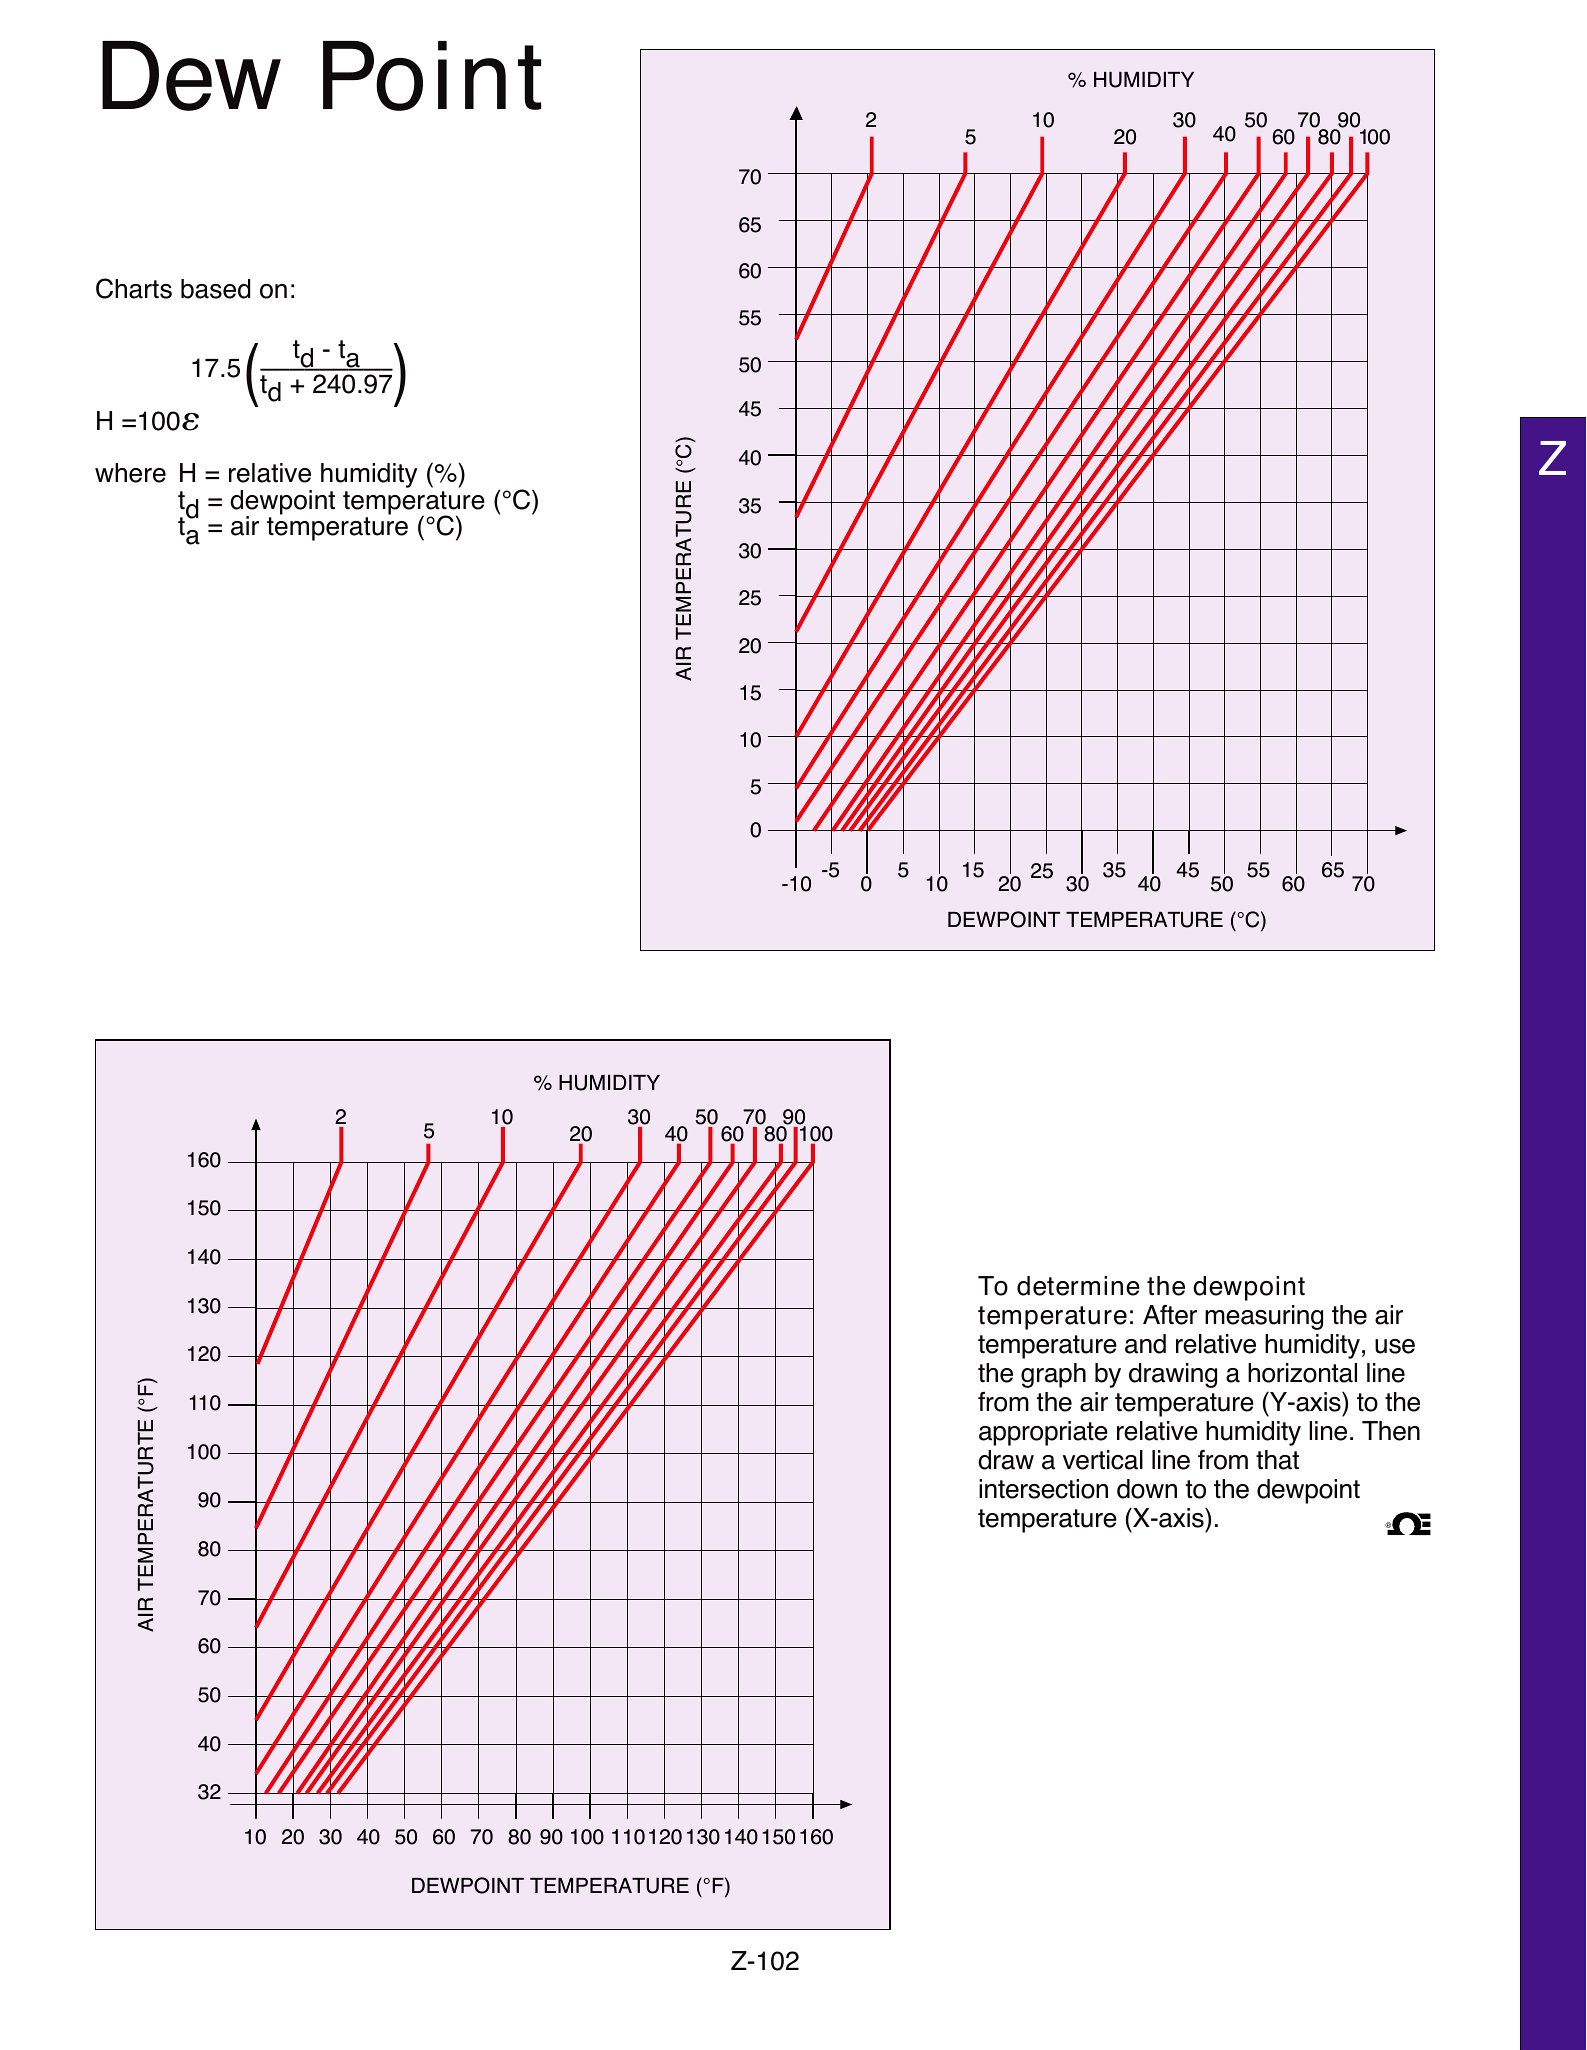
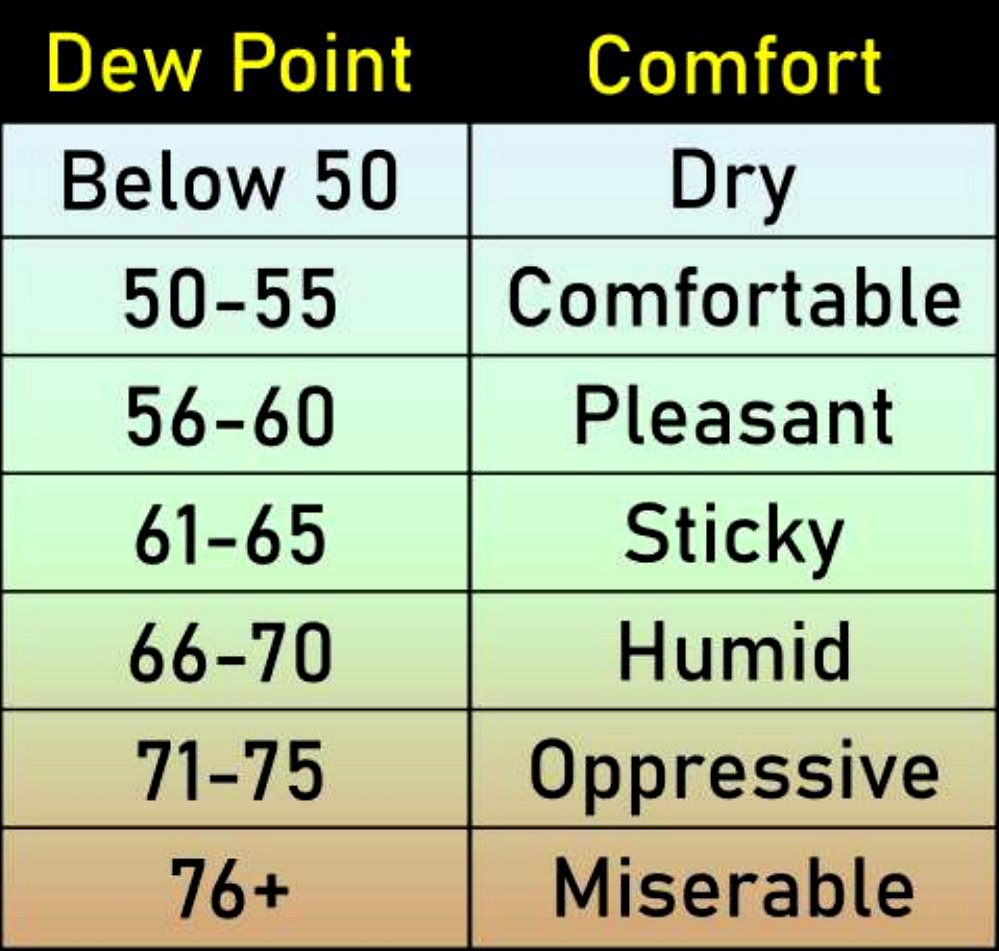
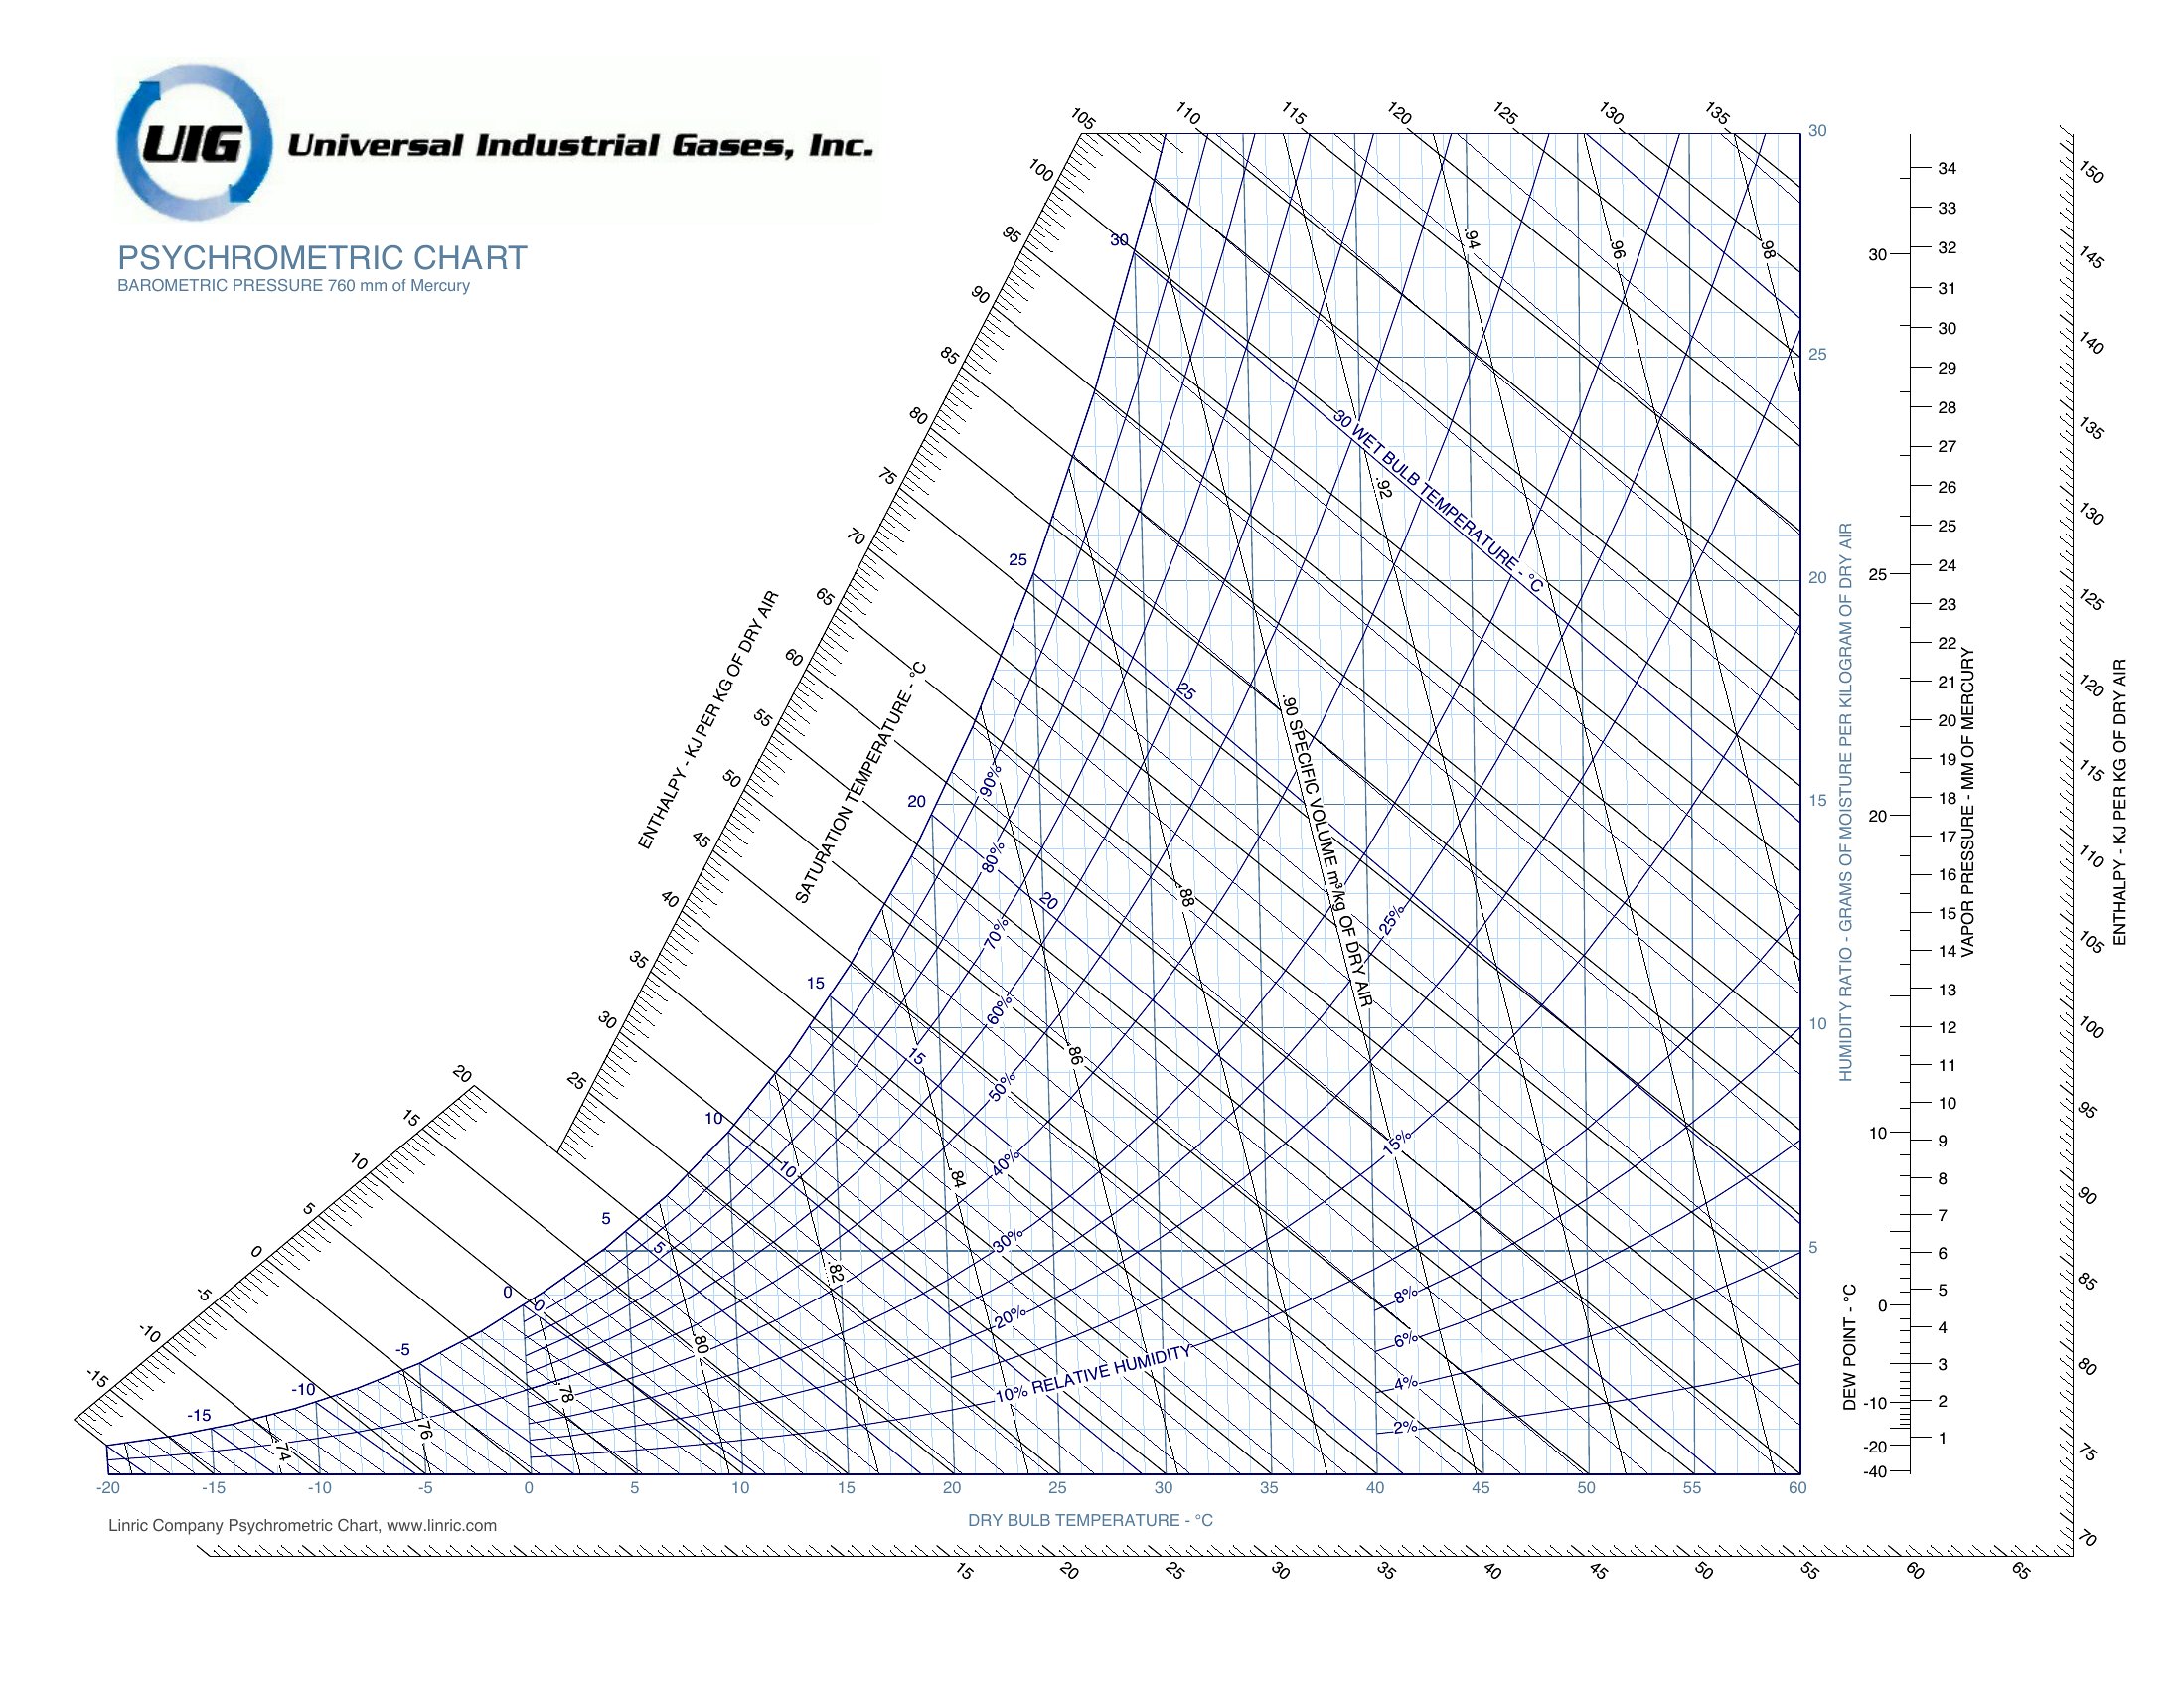
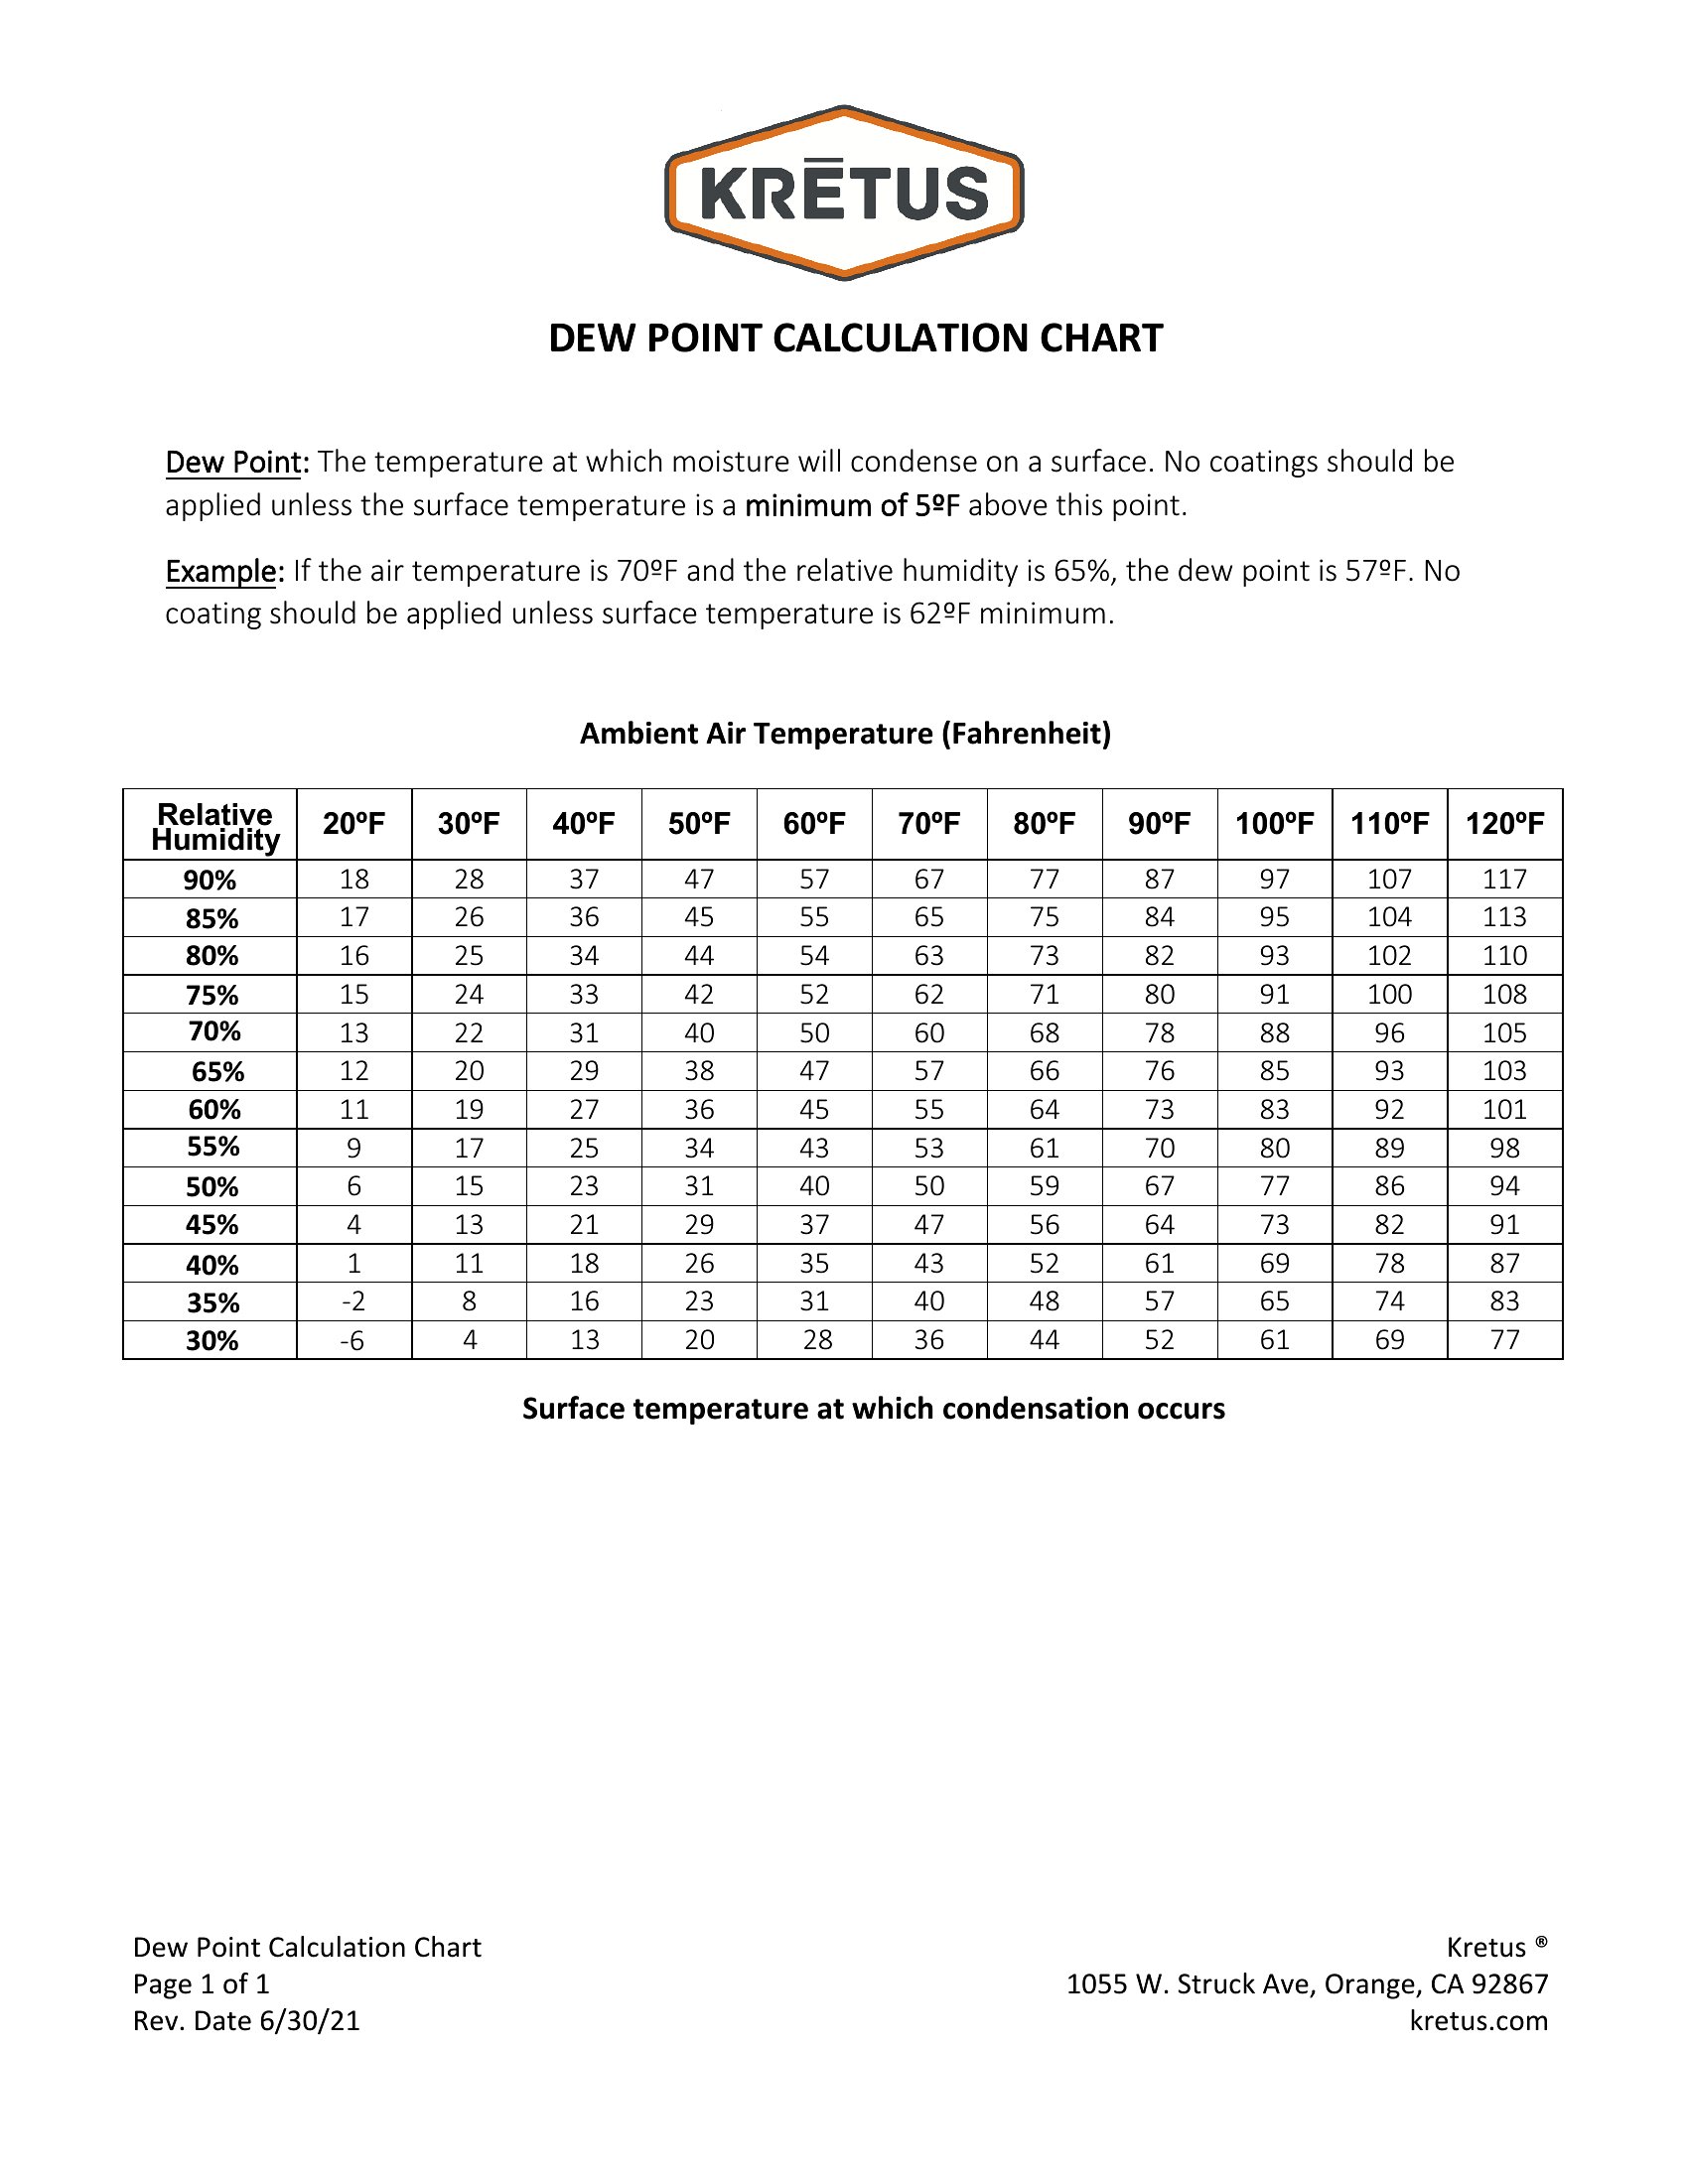
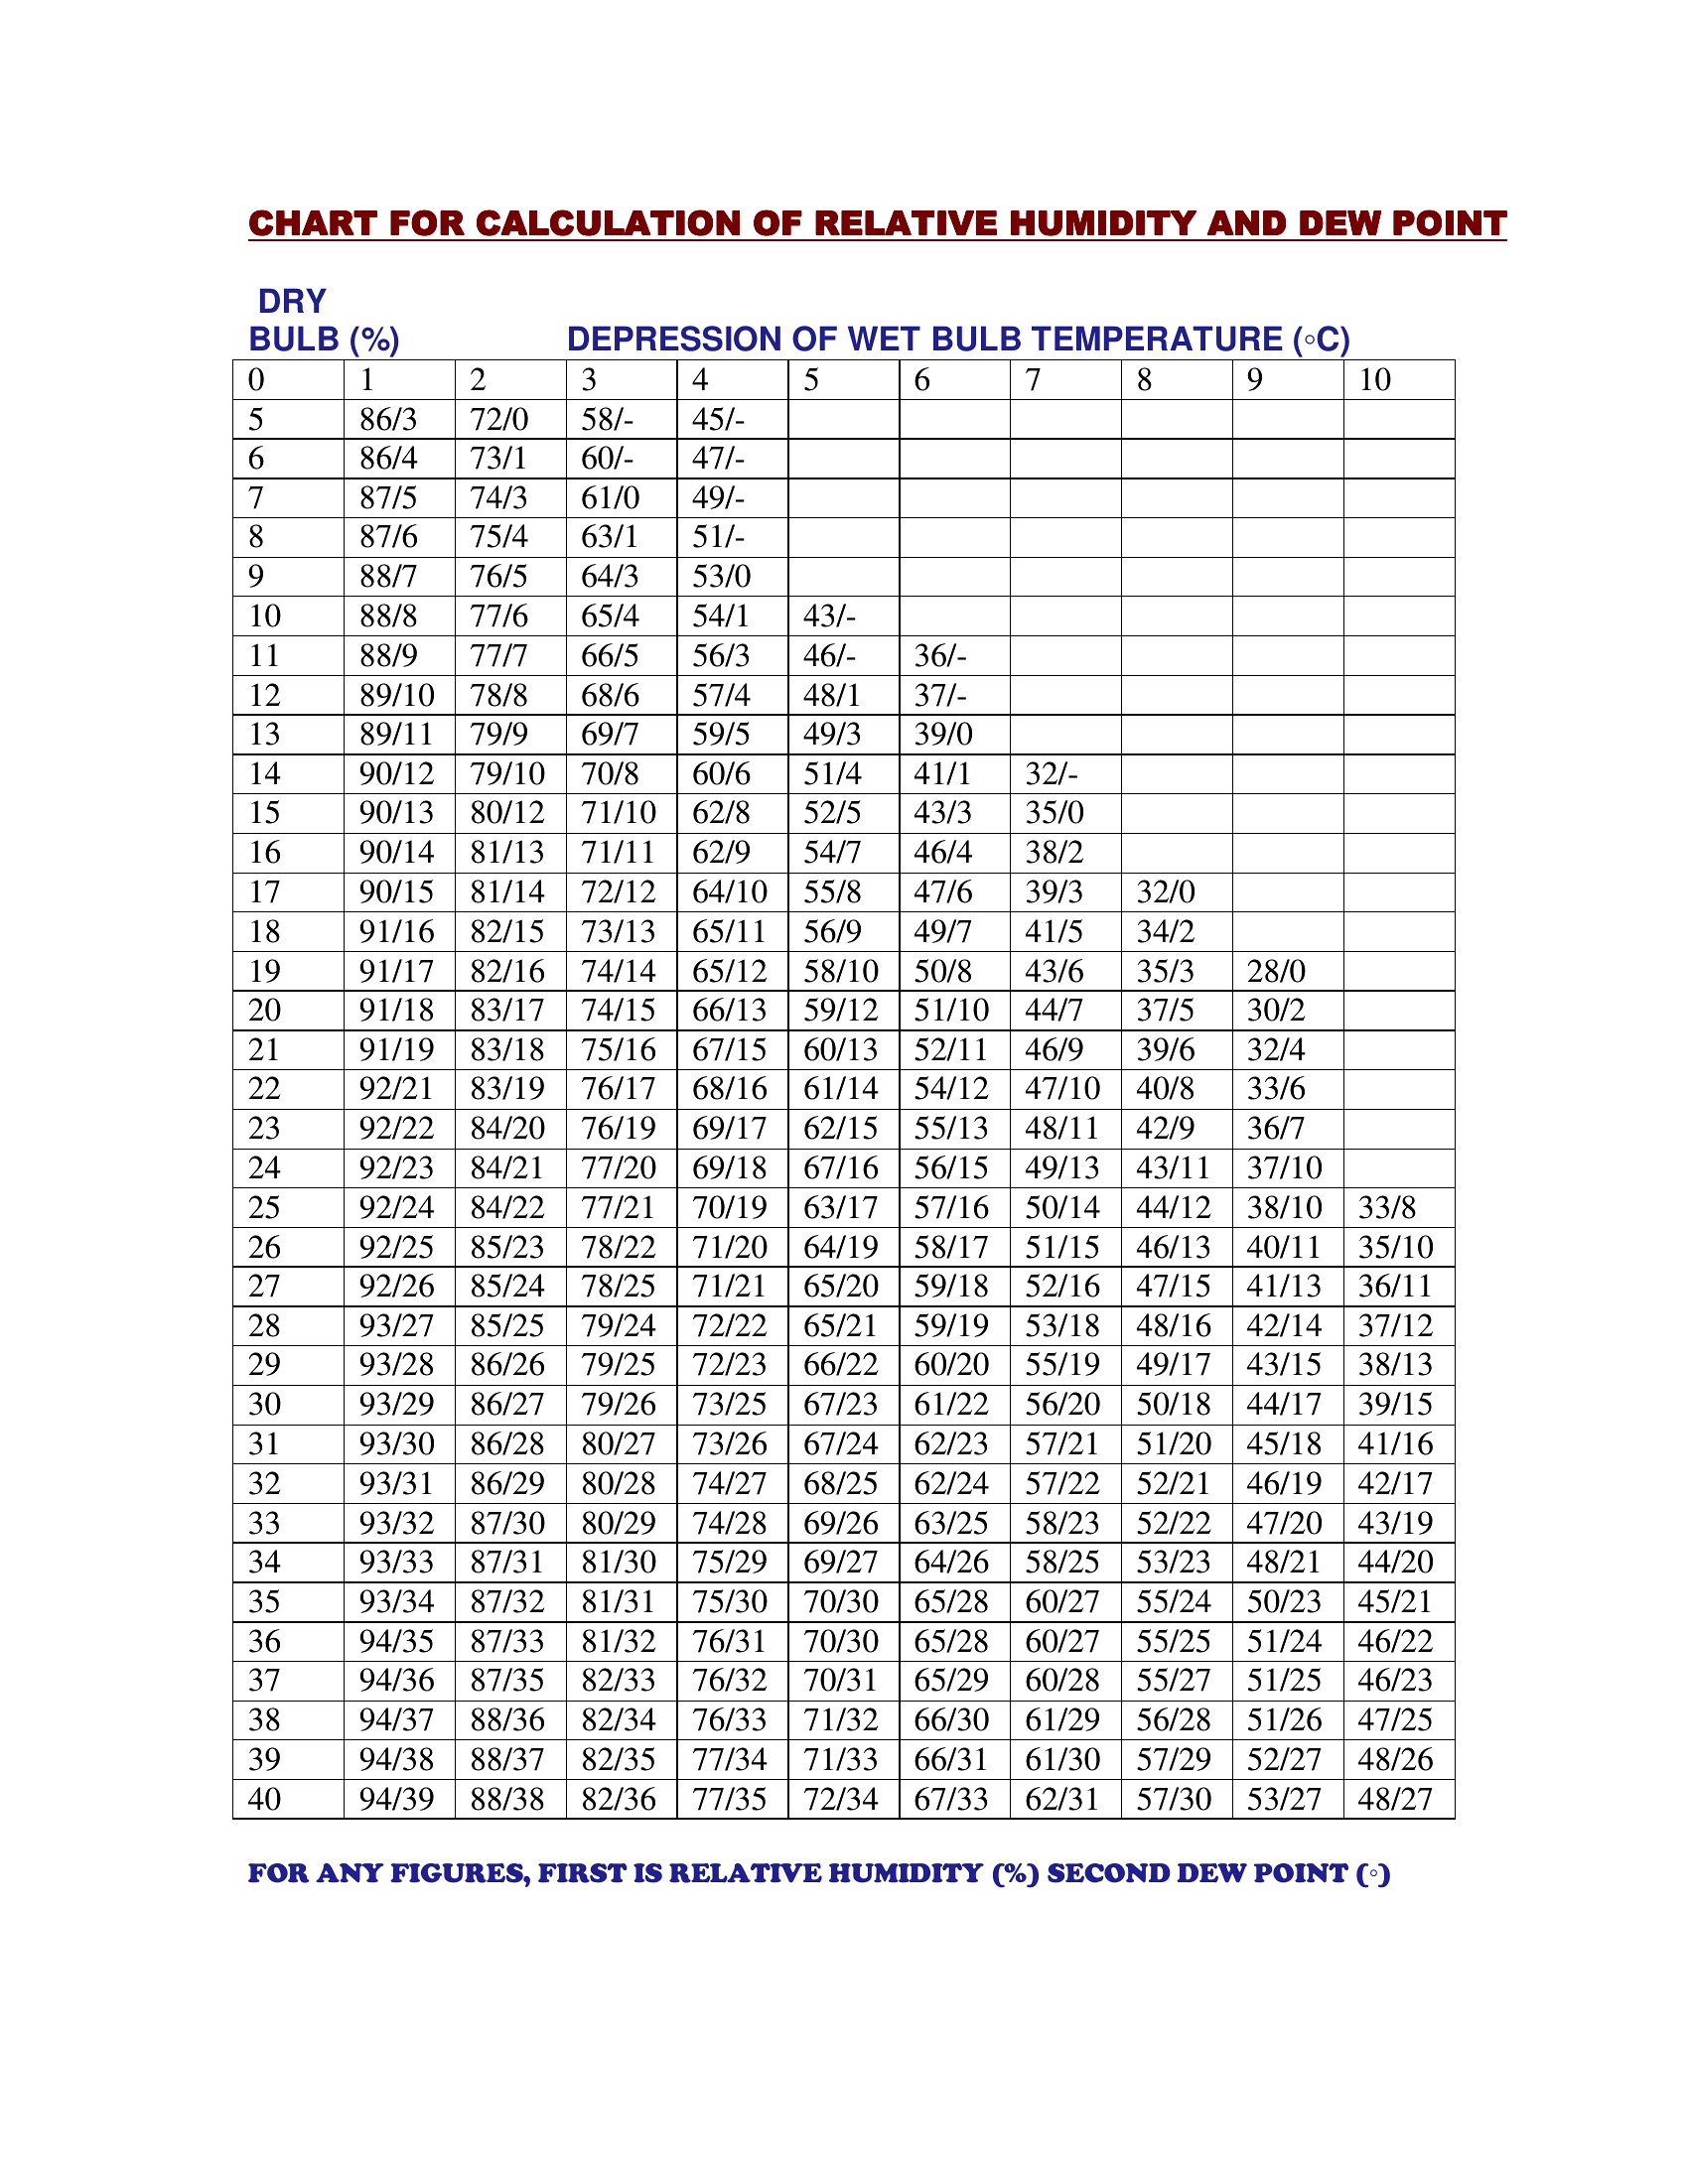
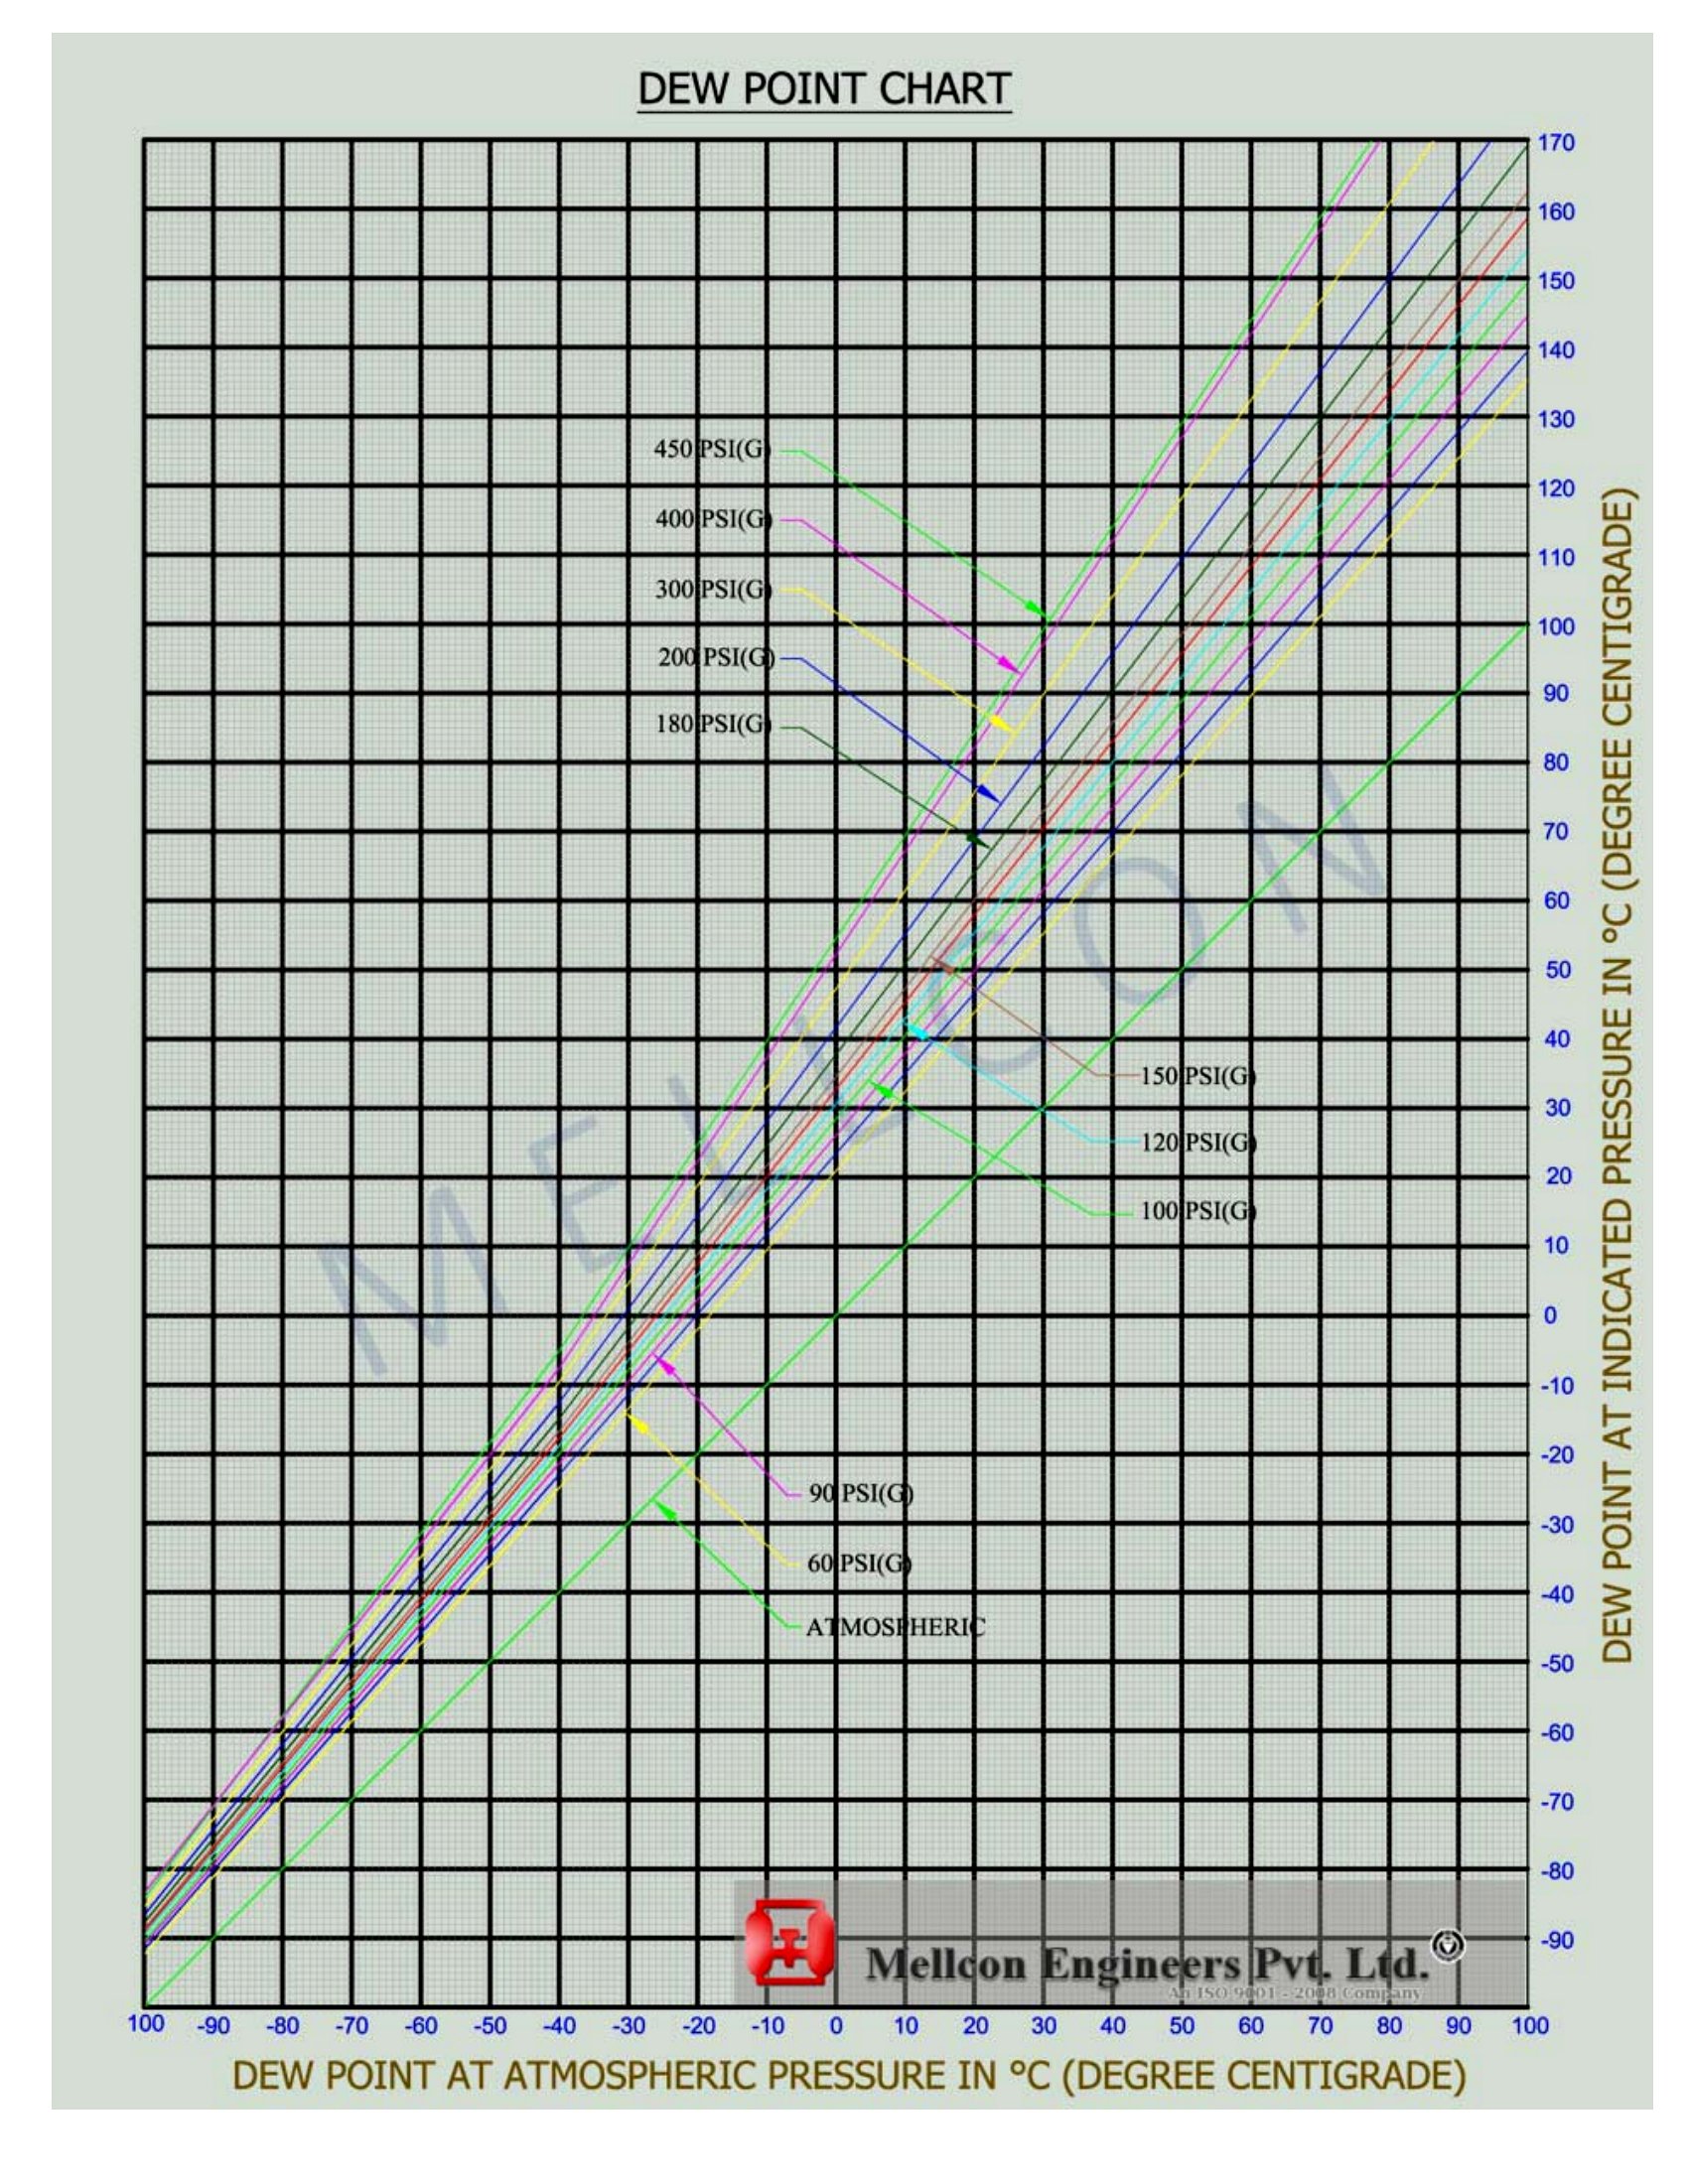
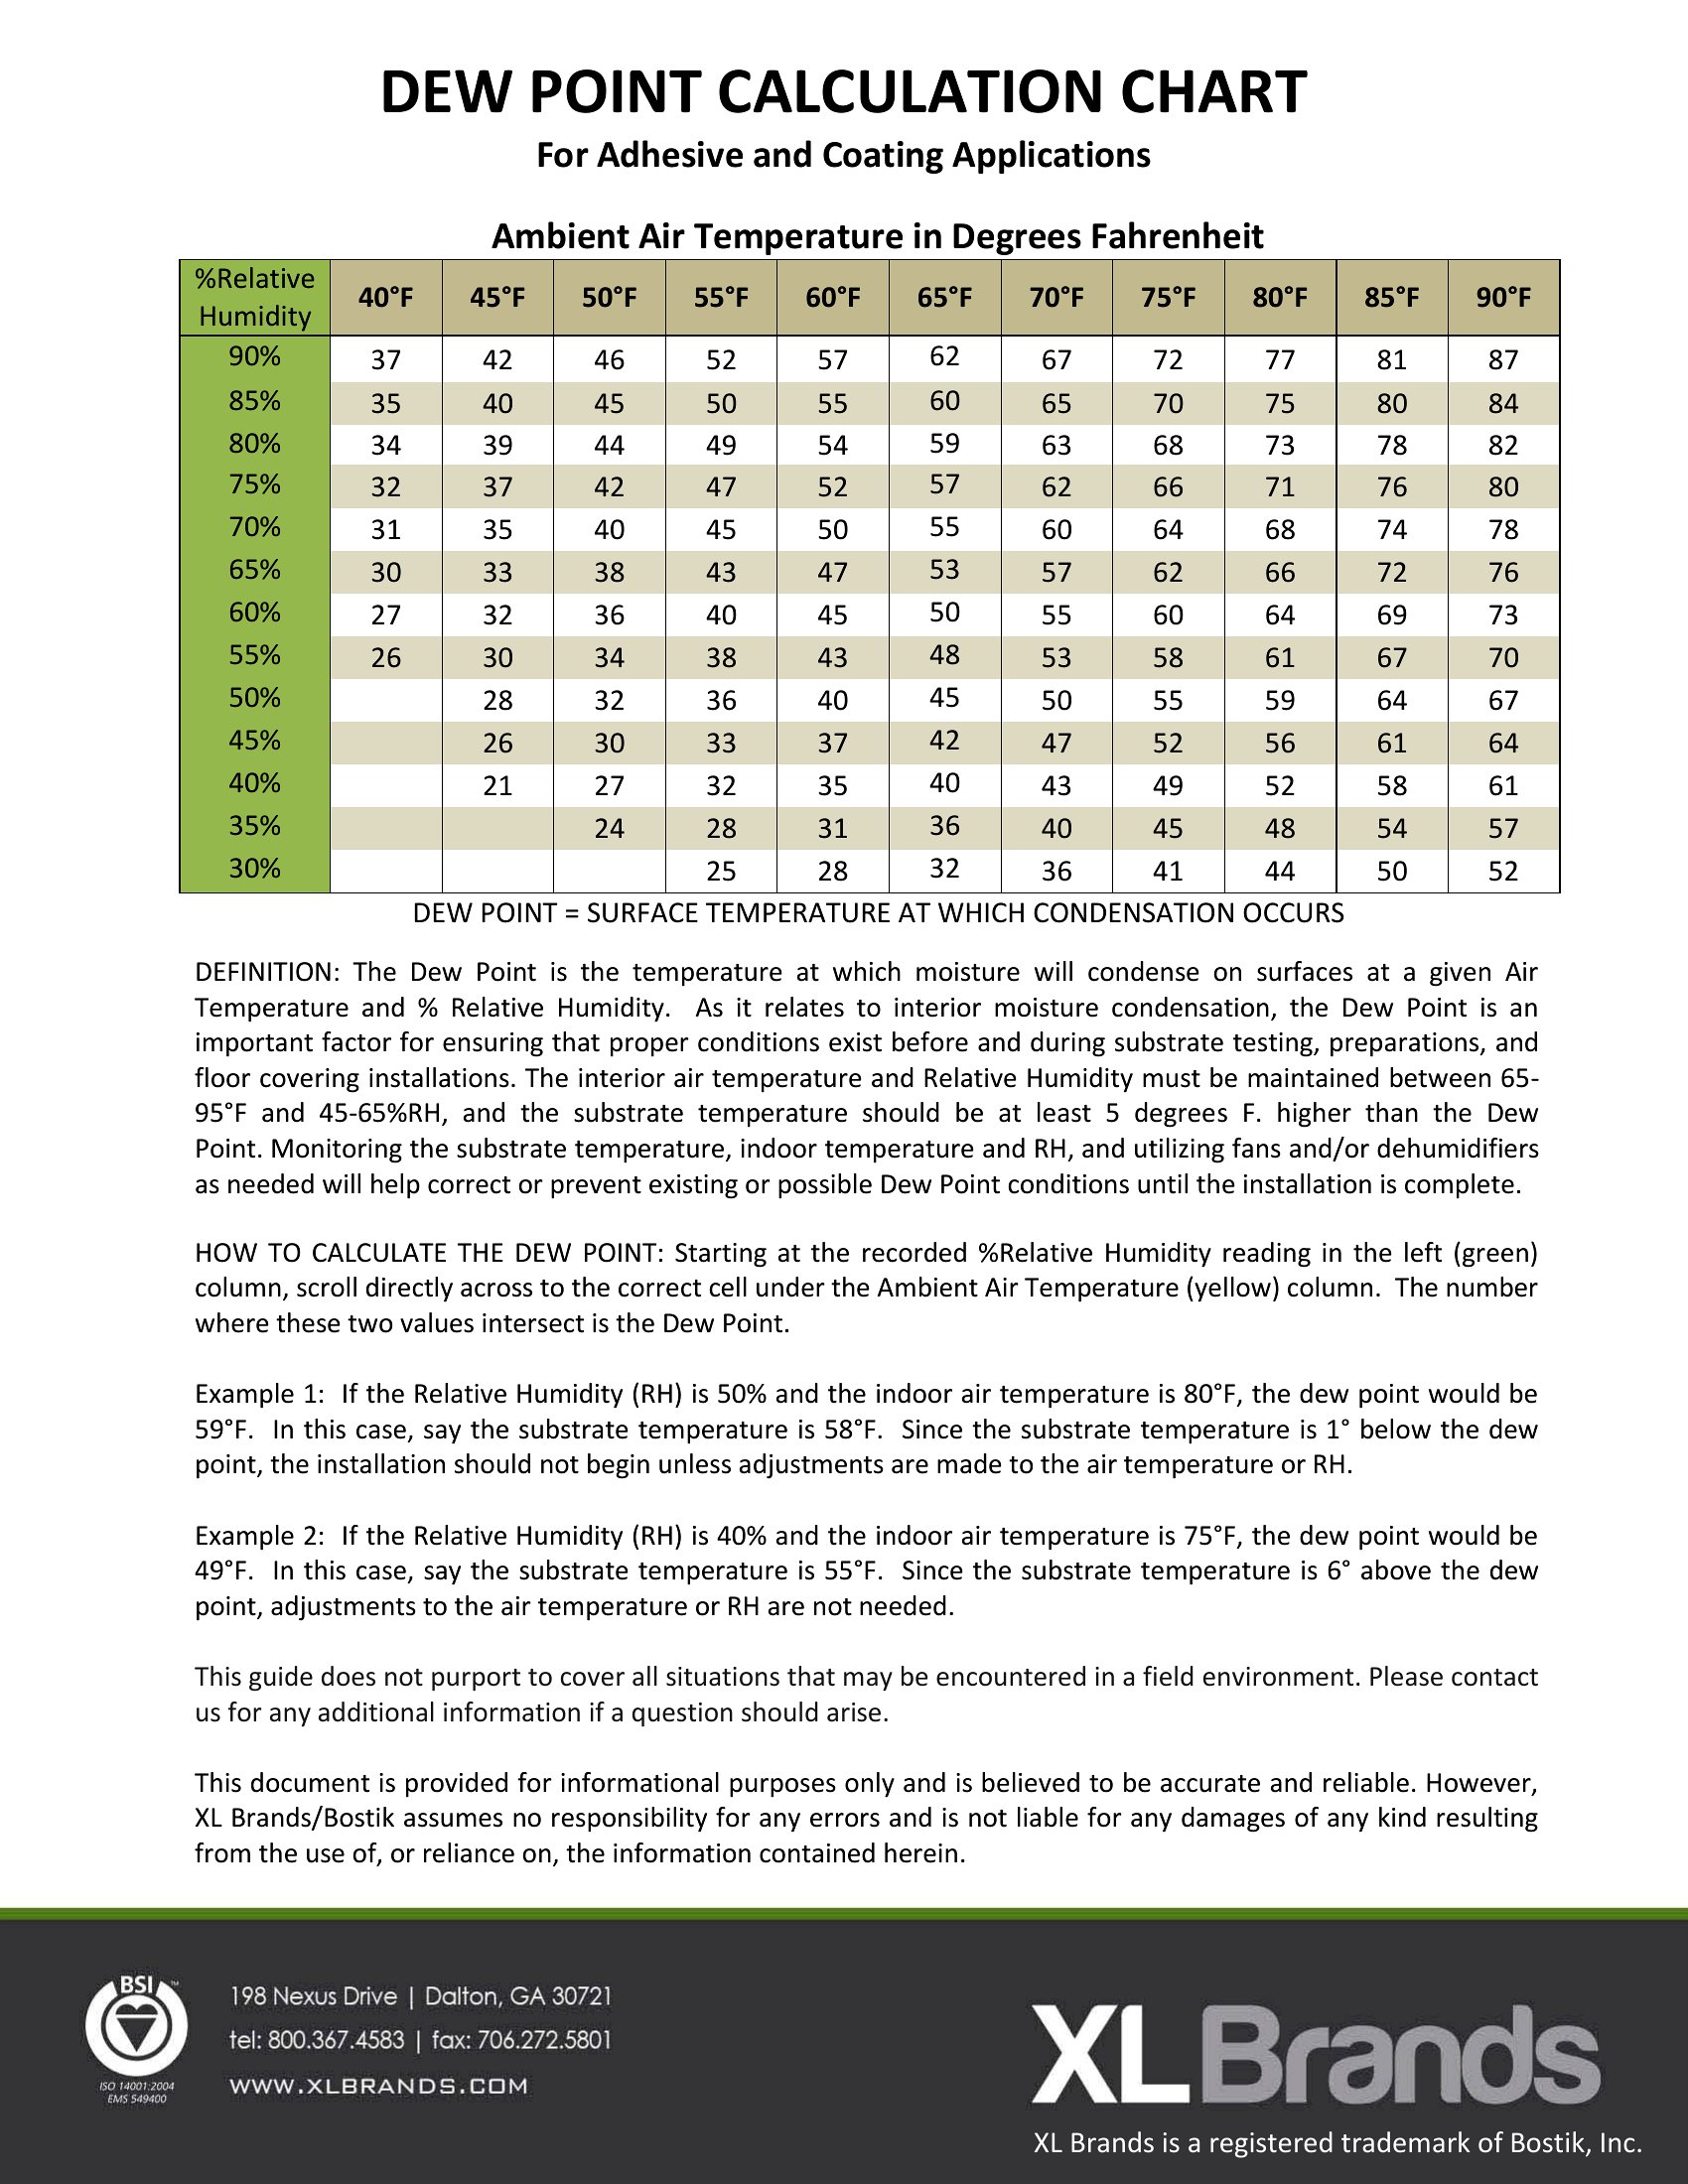
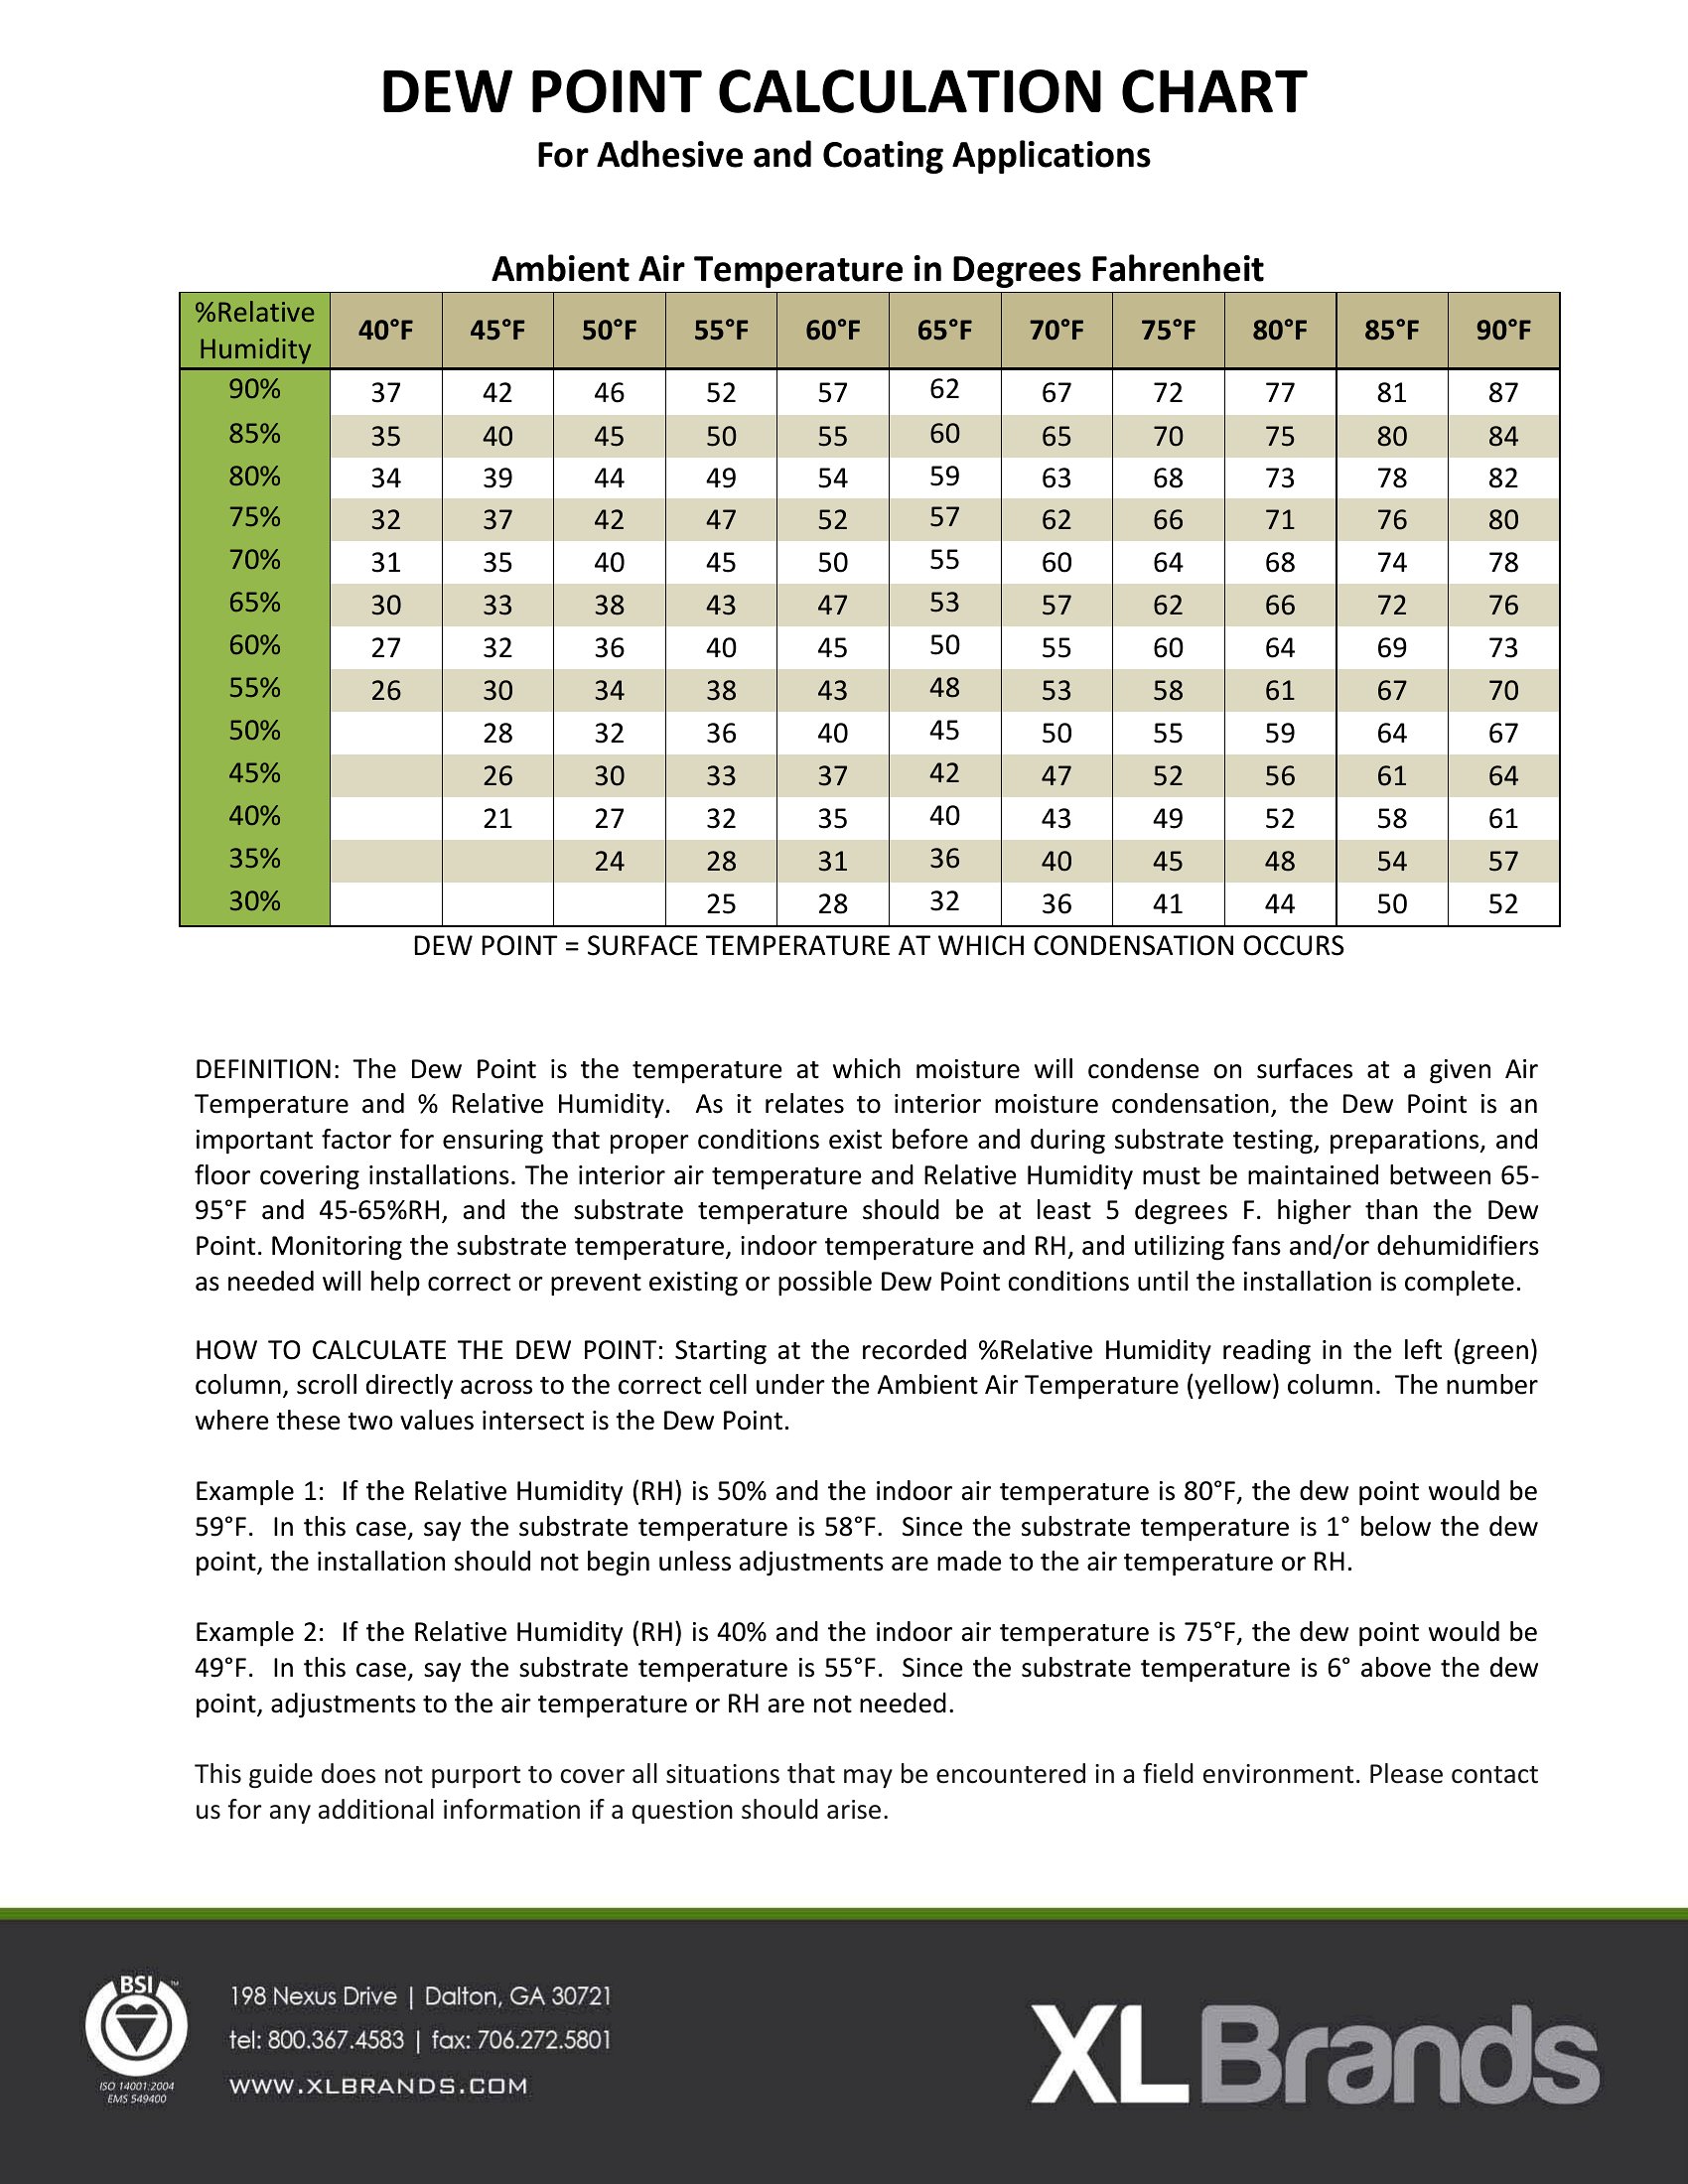
FAQ
Are these dew point charts accurate for extreme climates like deserts or tropical regions?
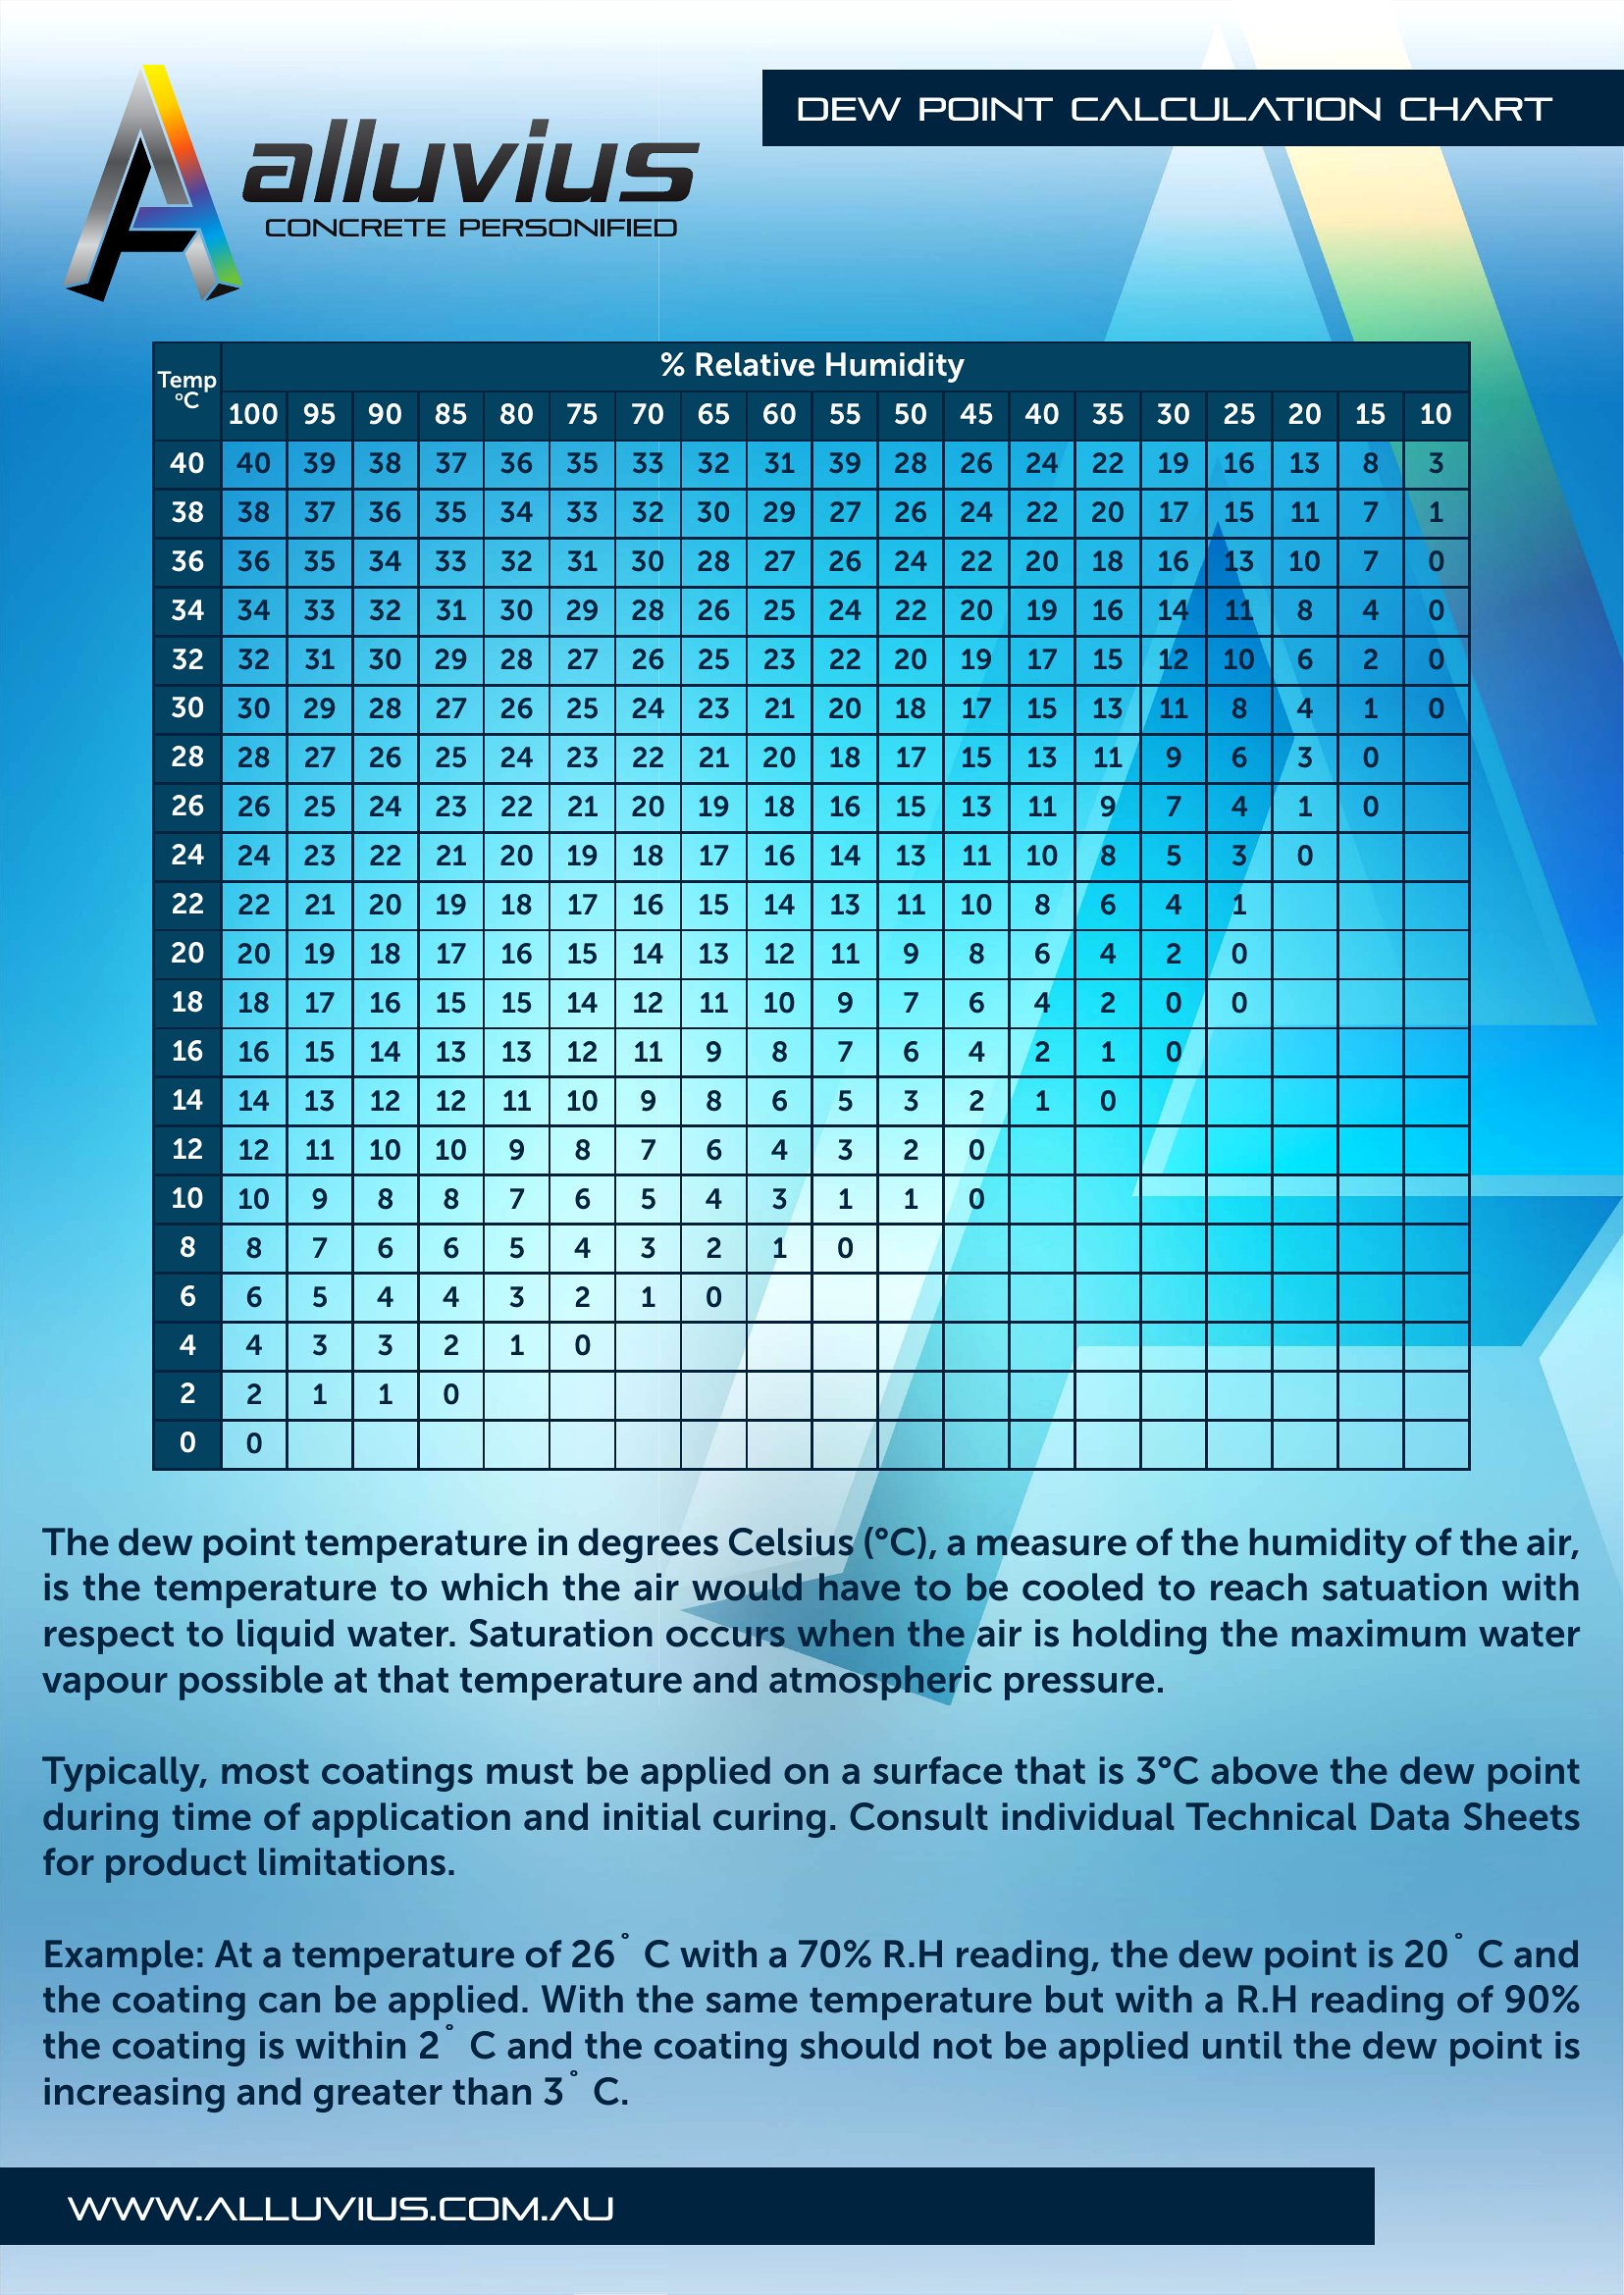
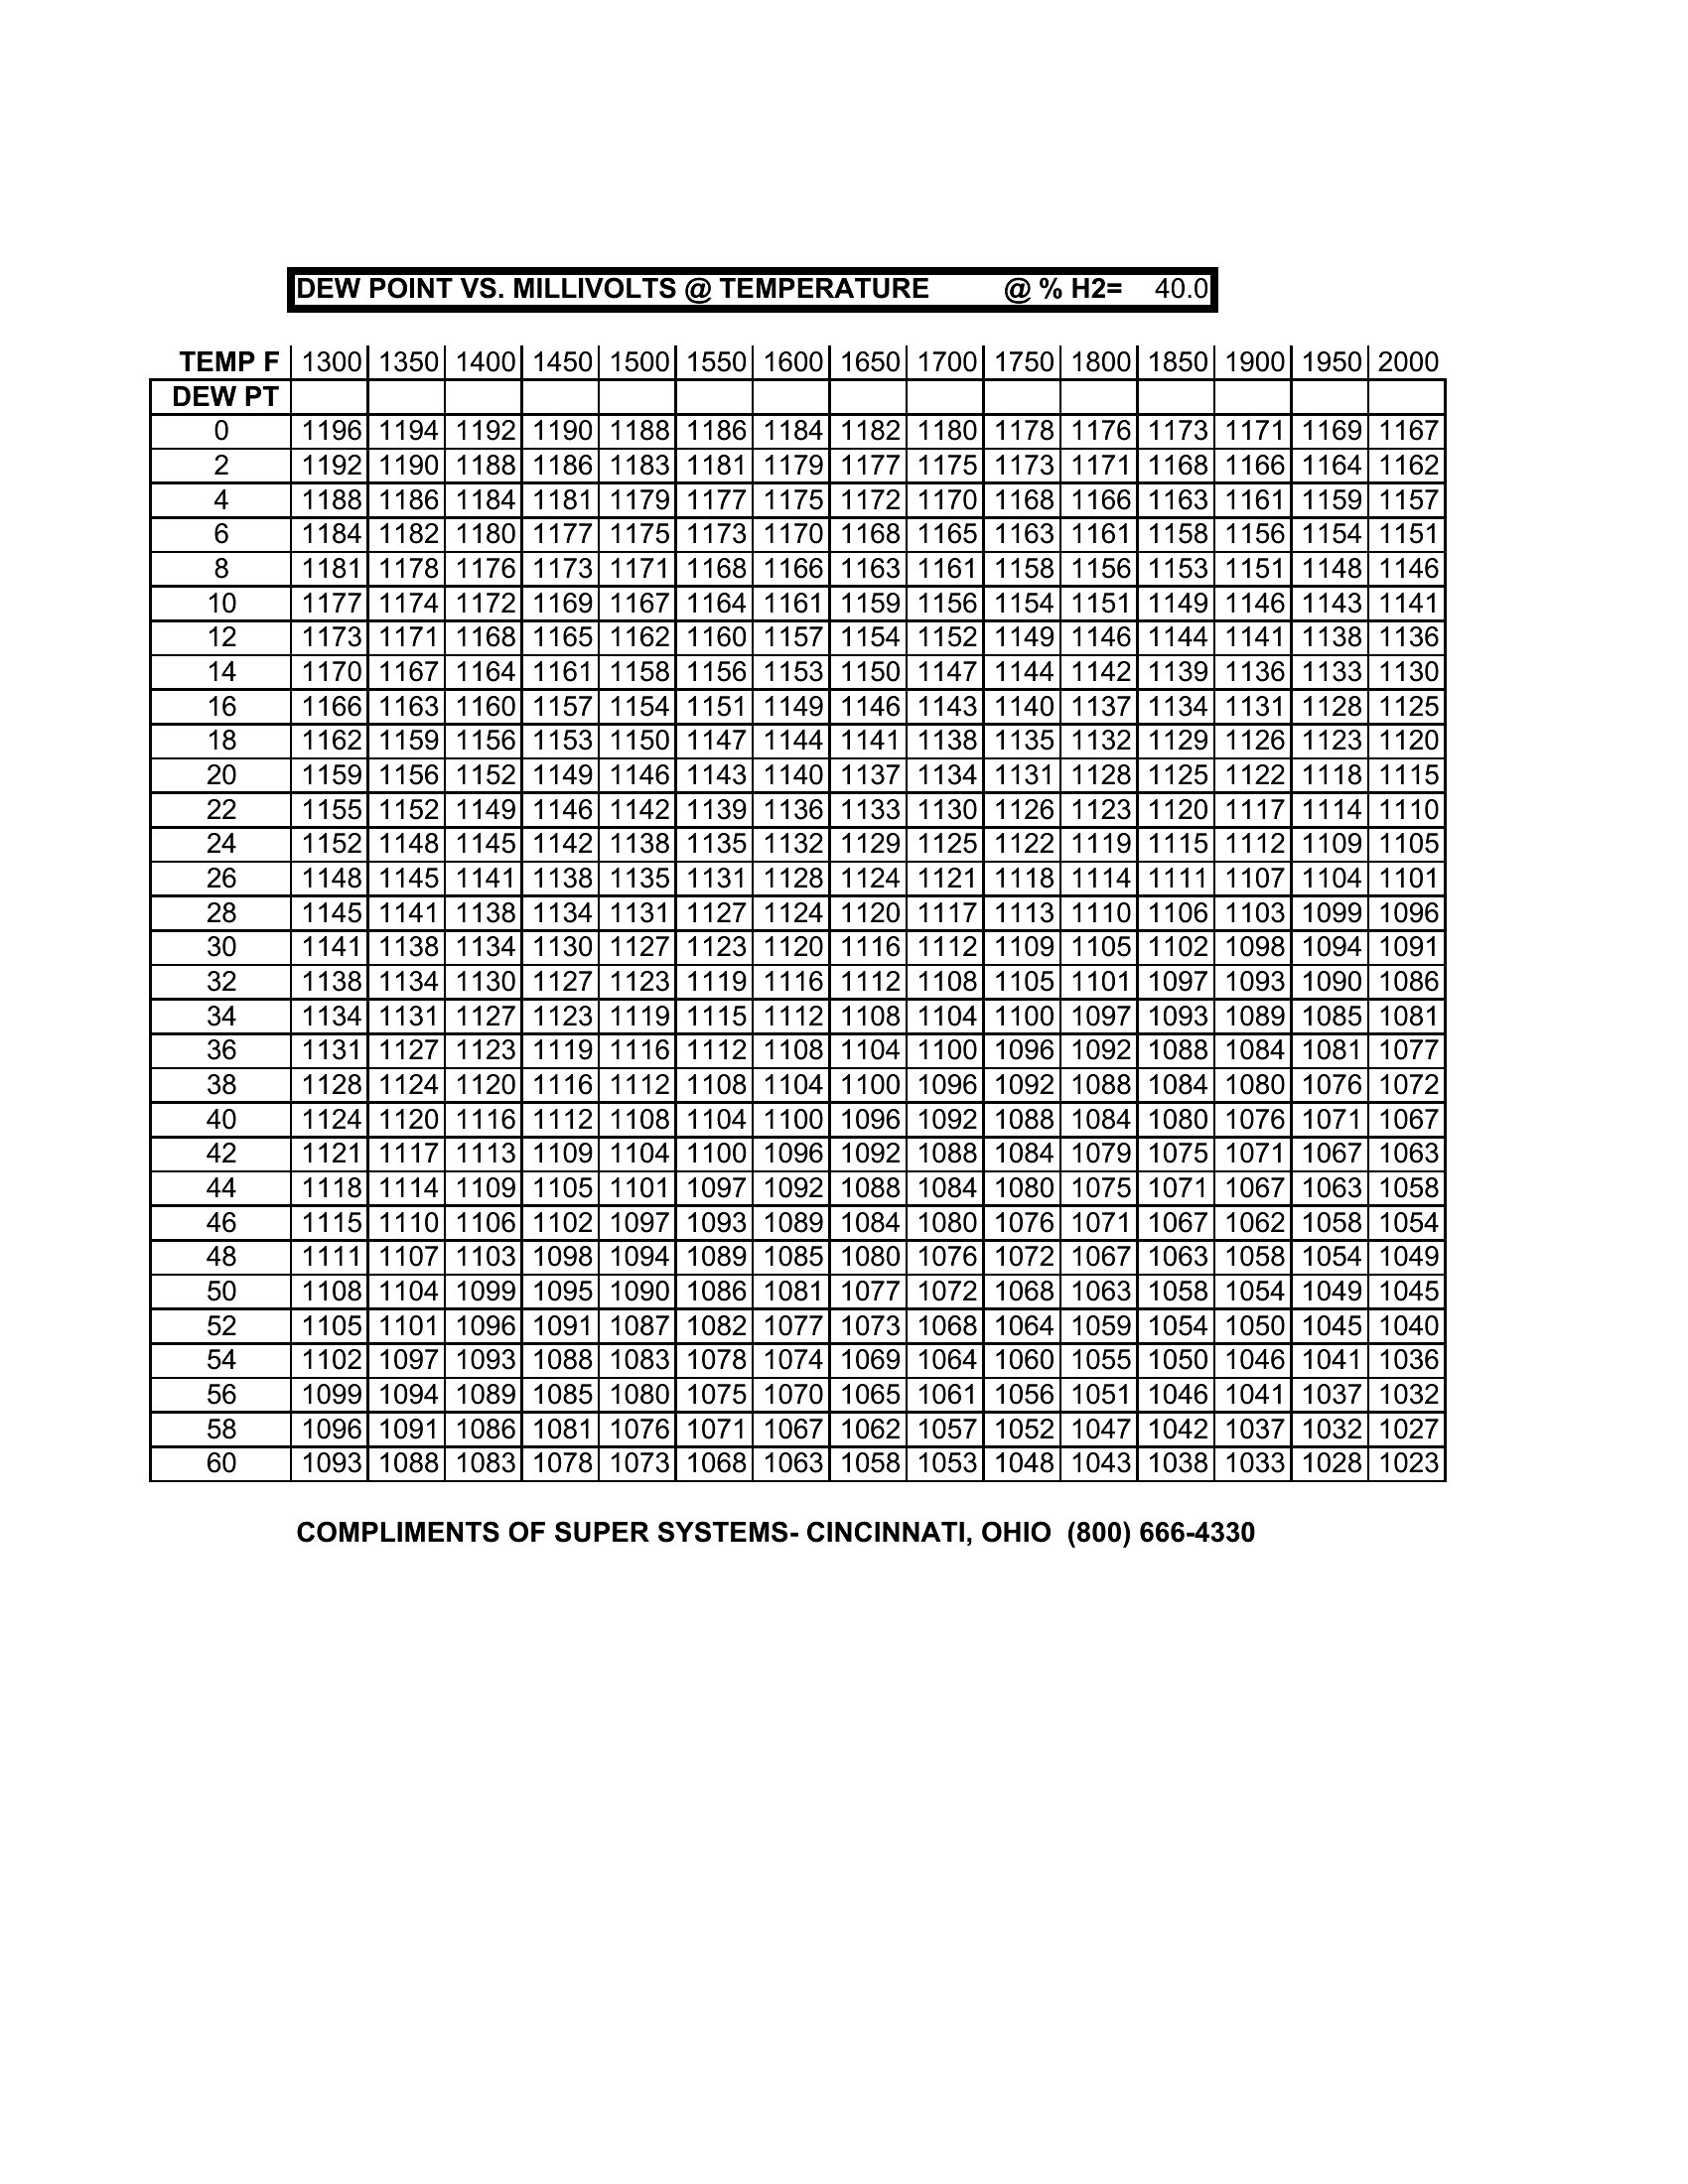
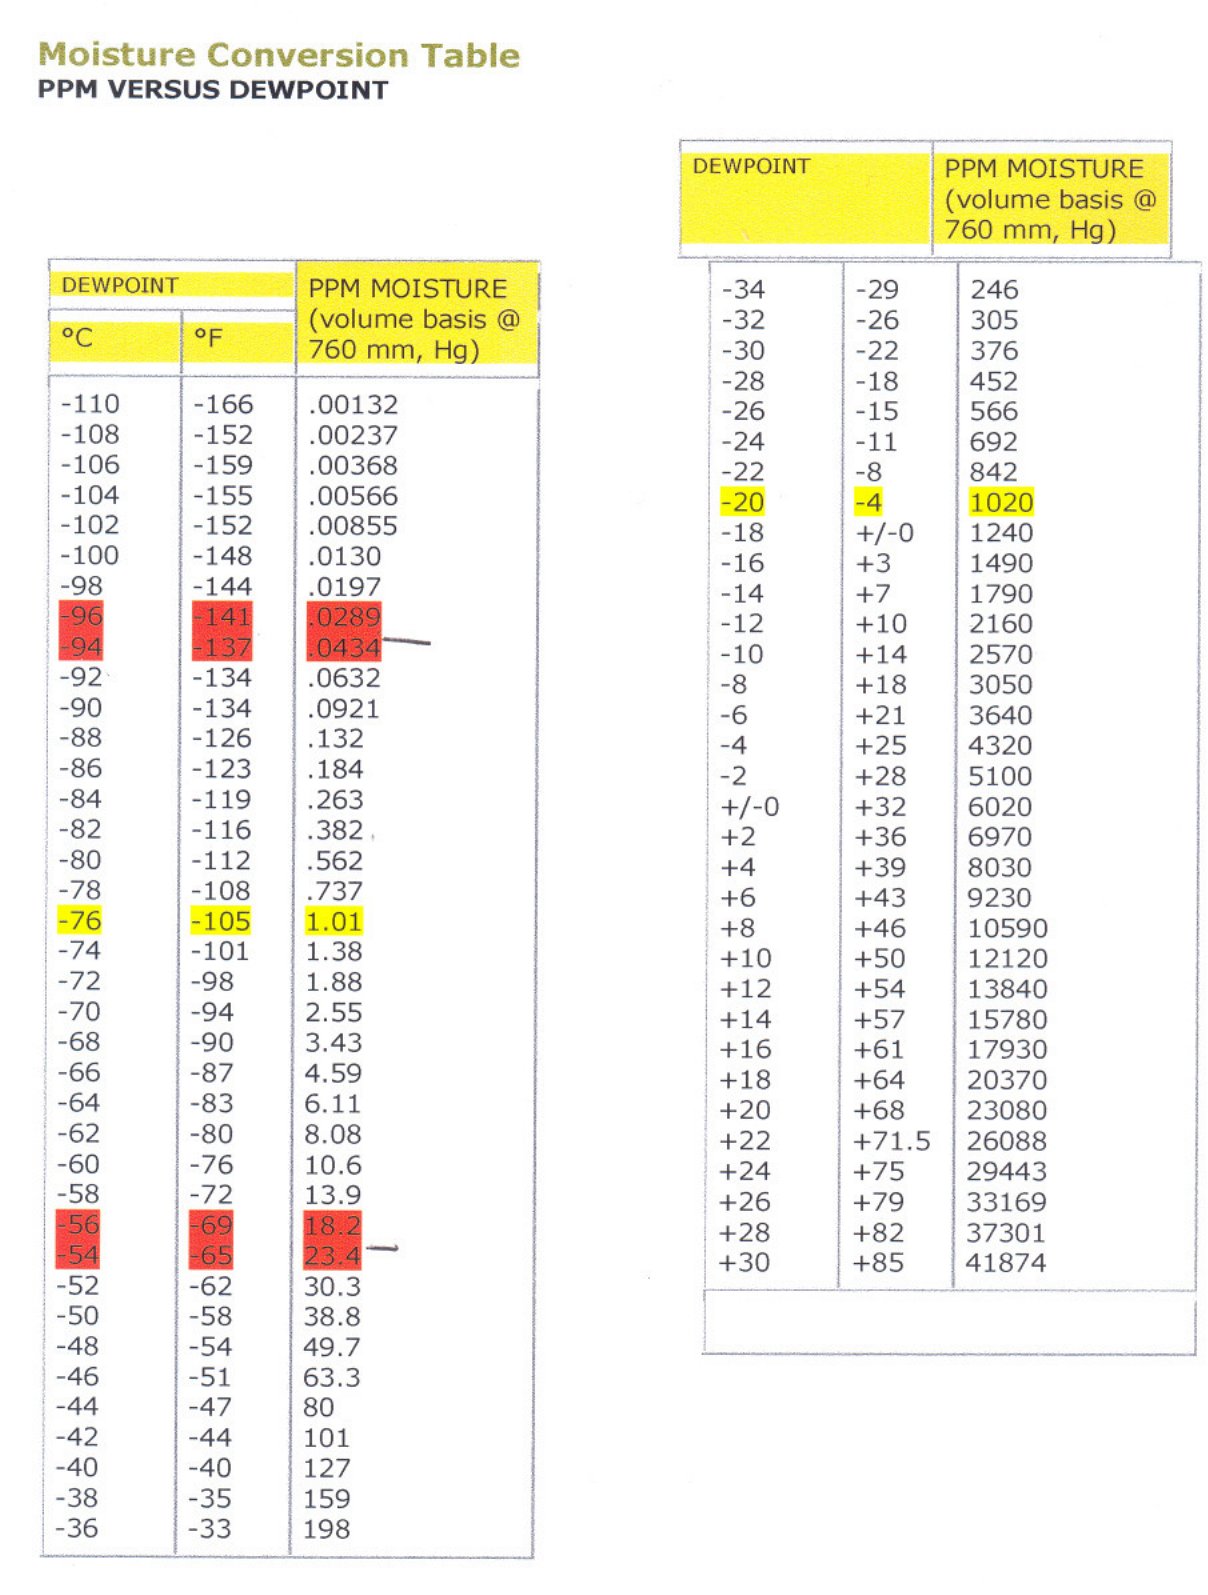
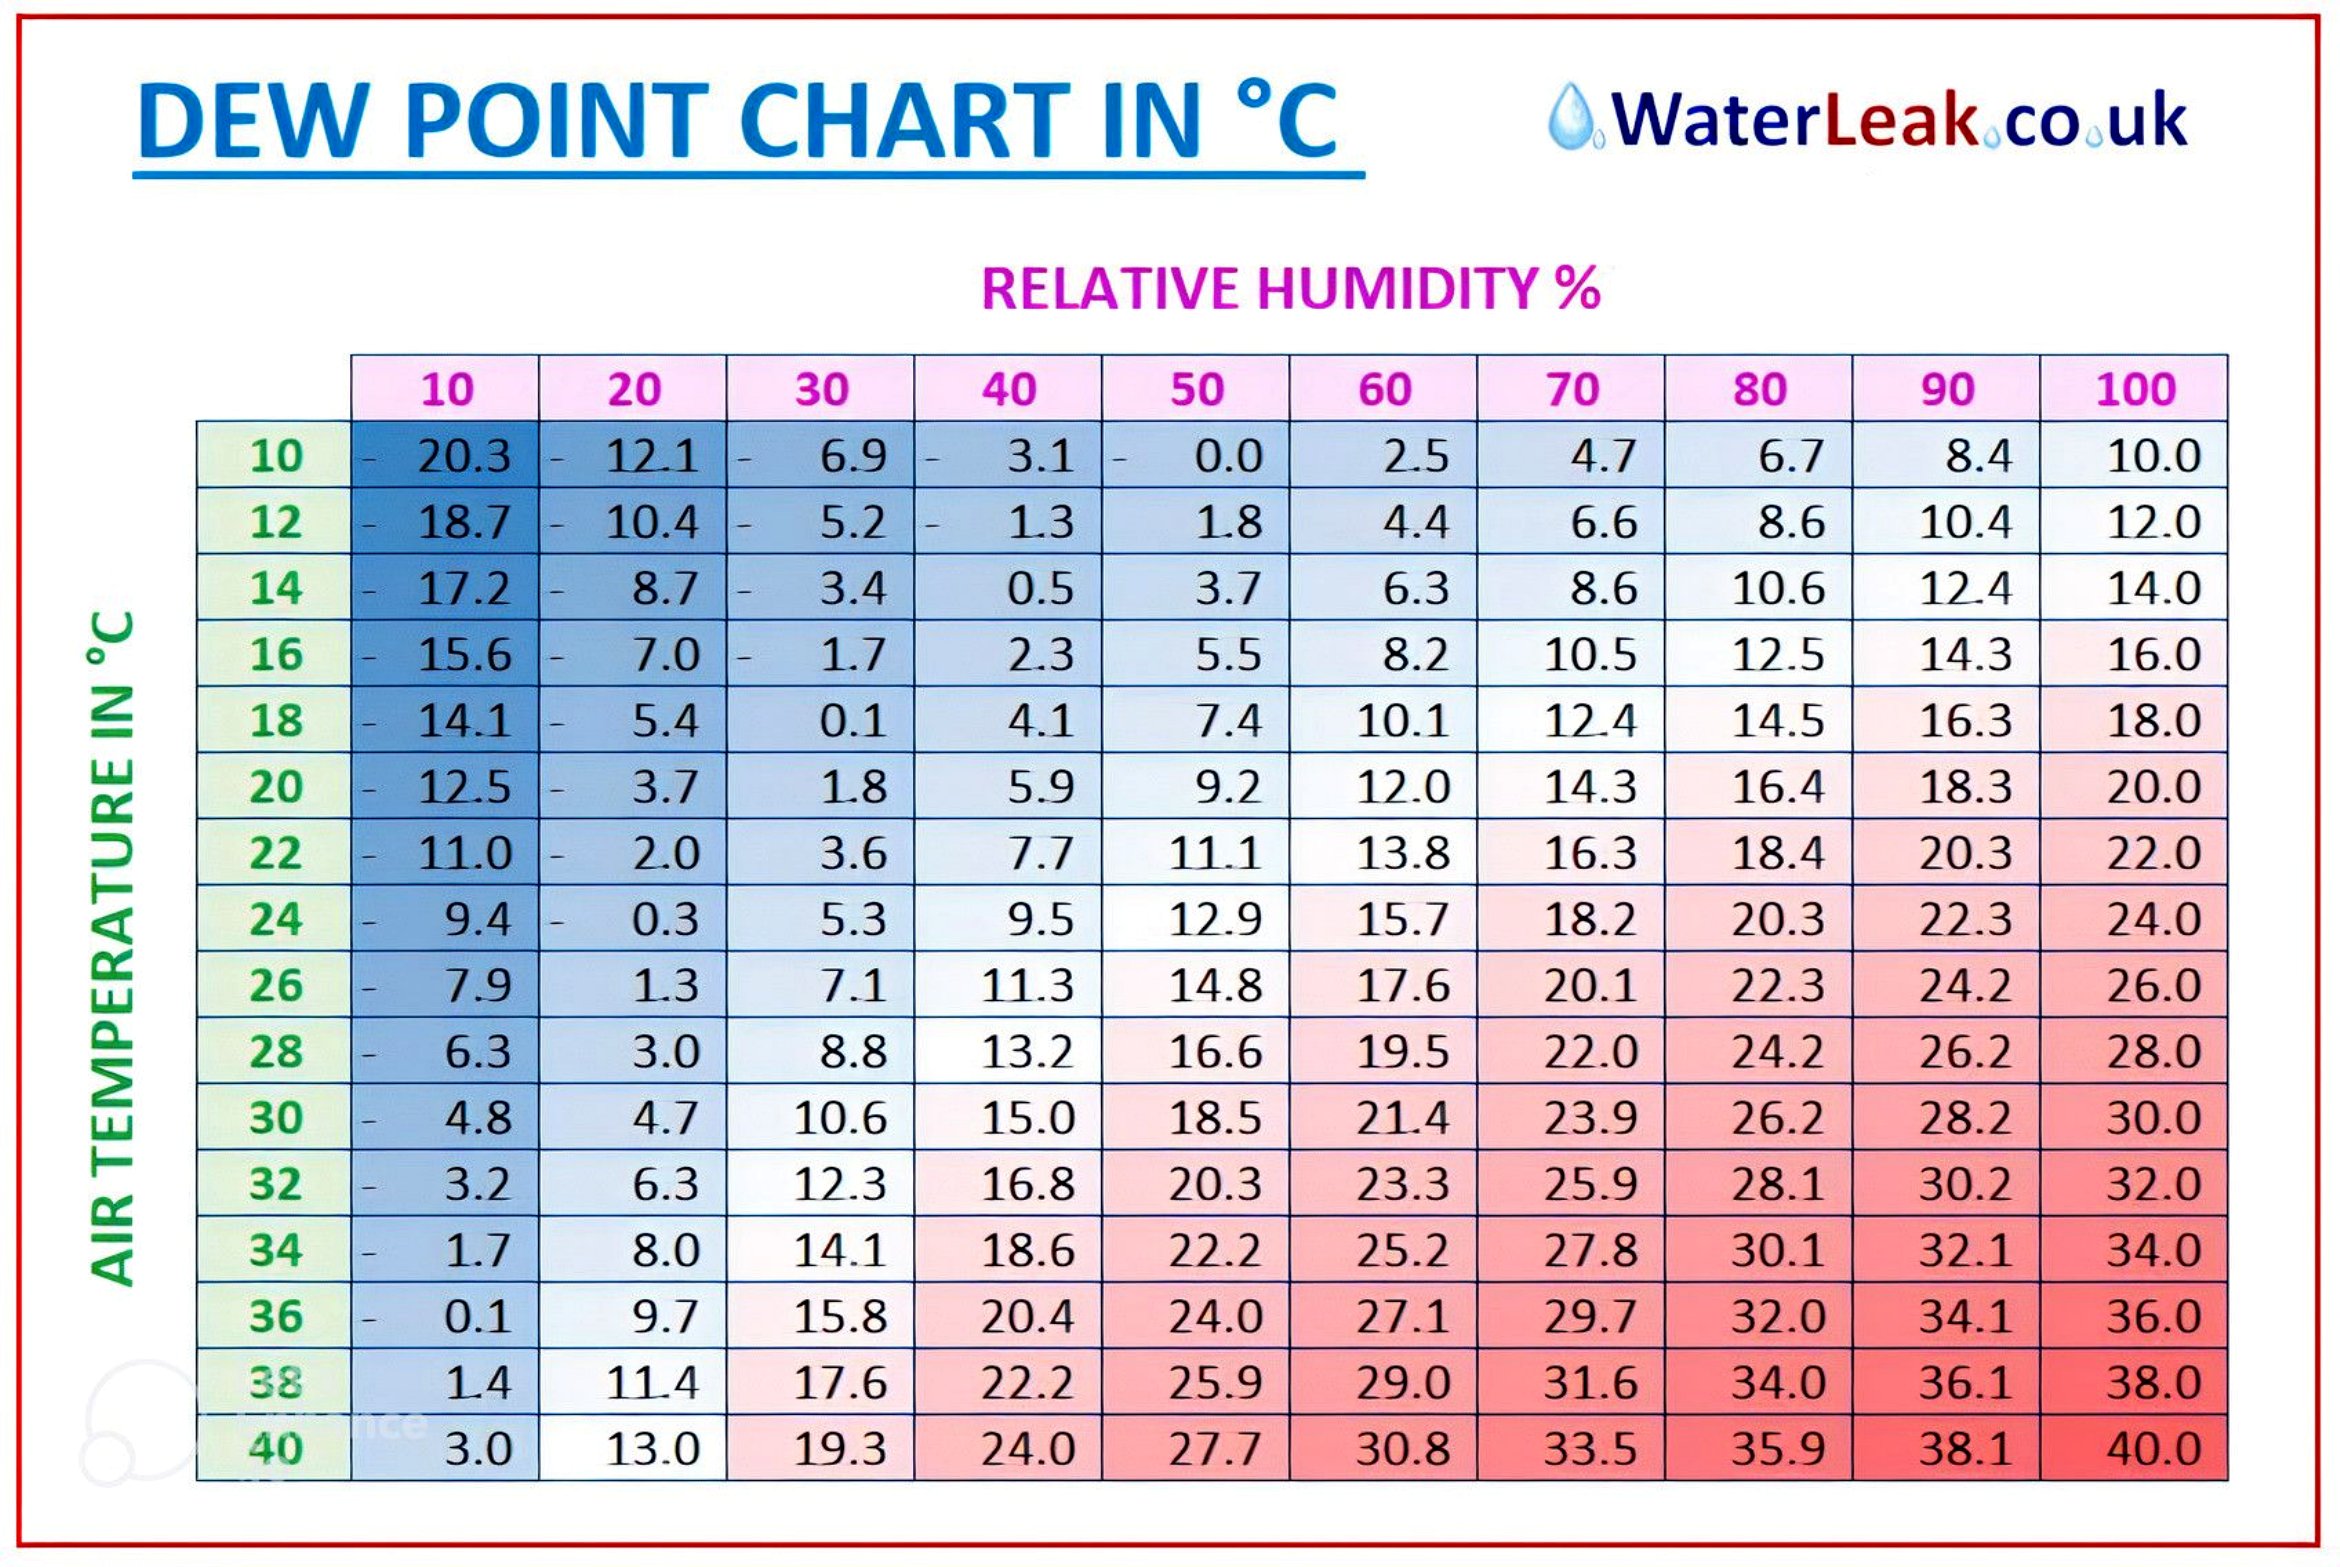
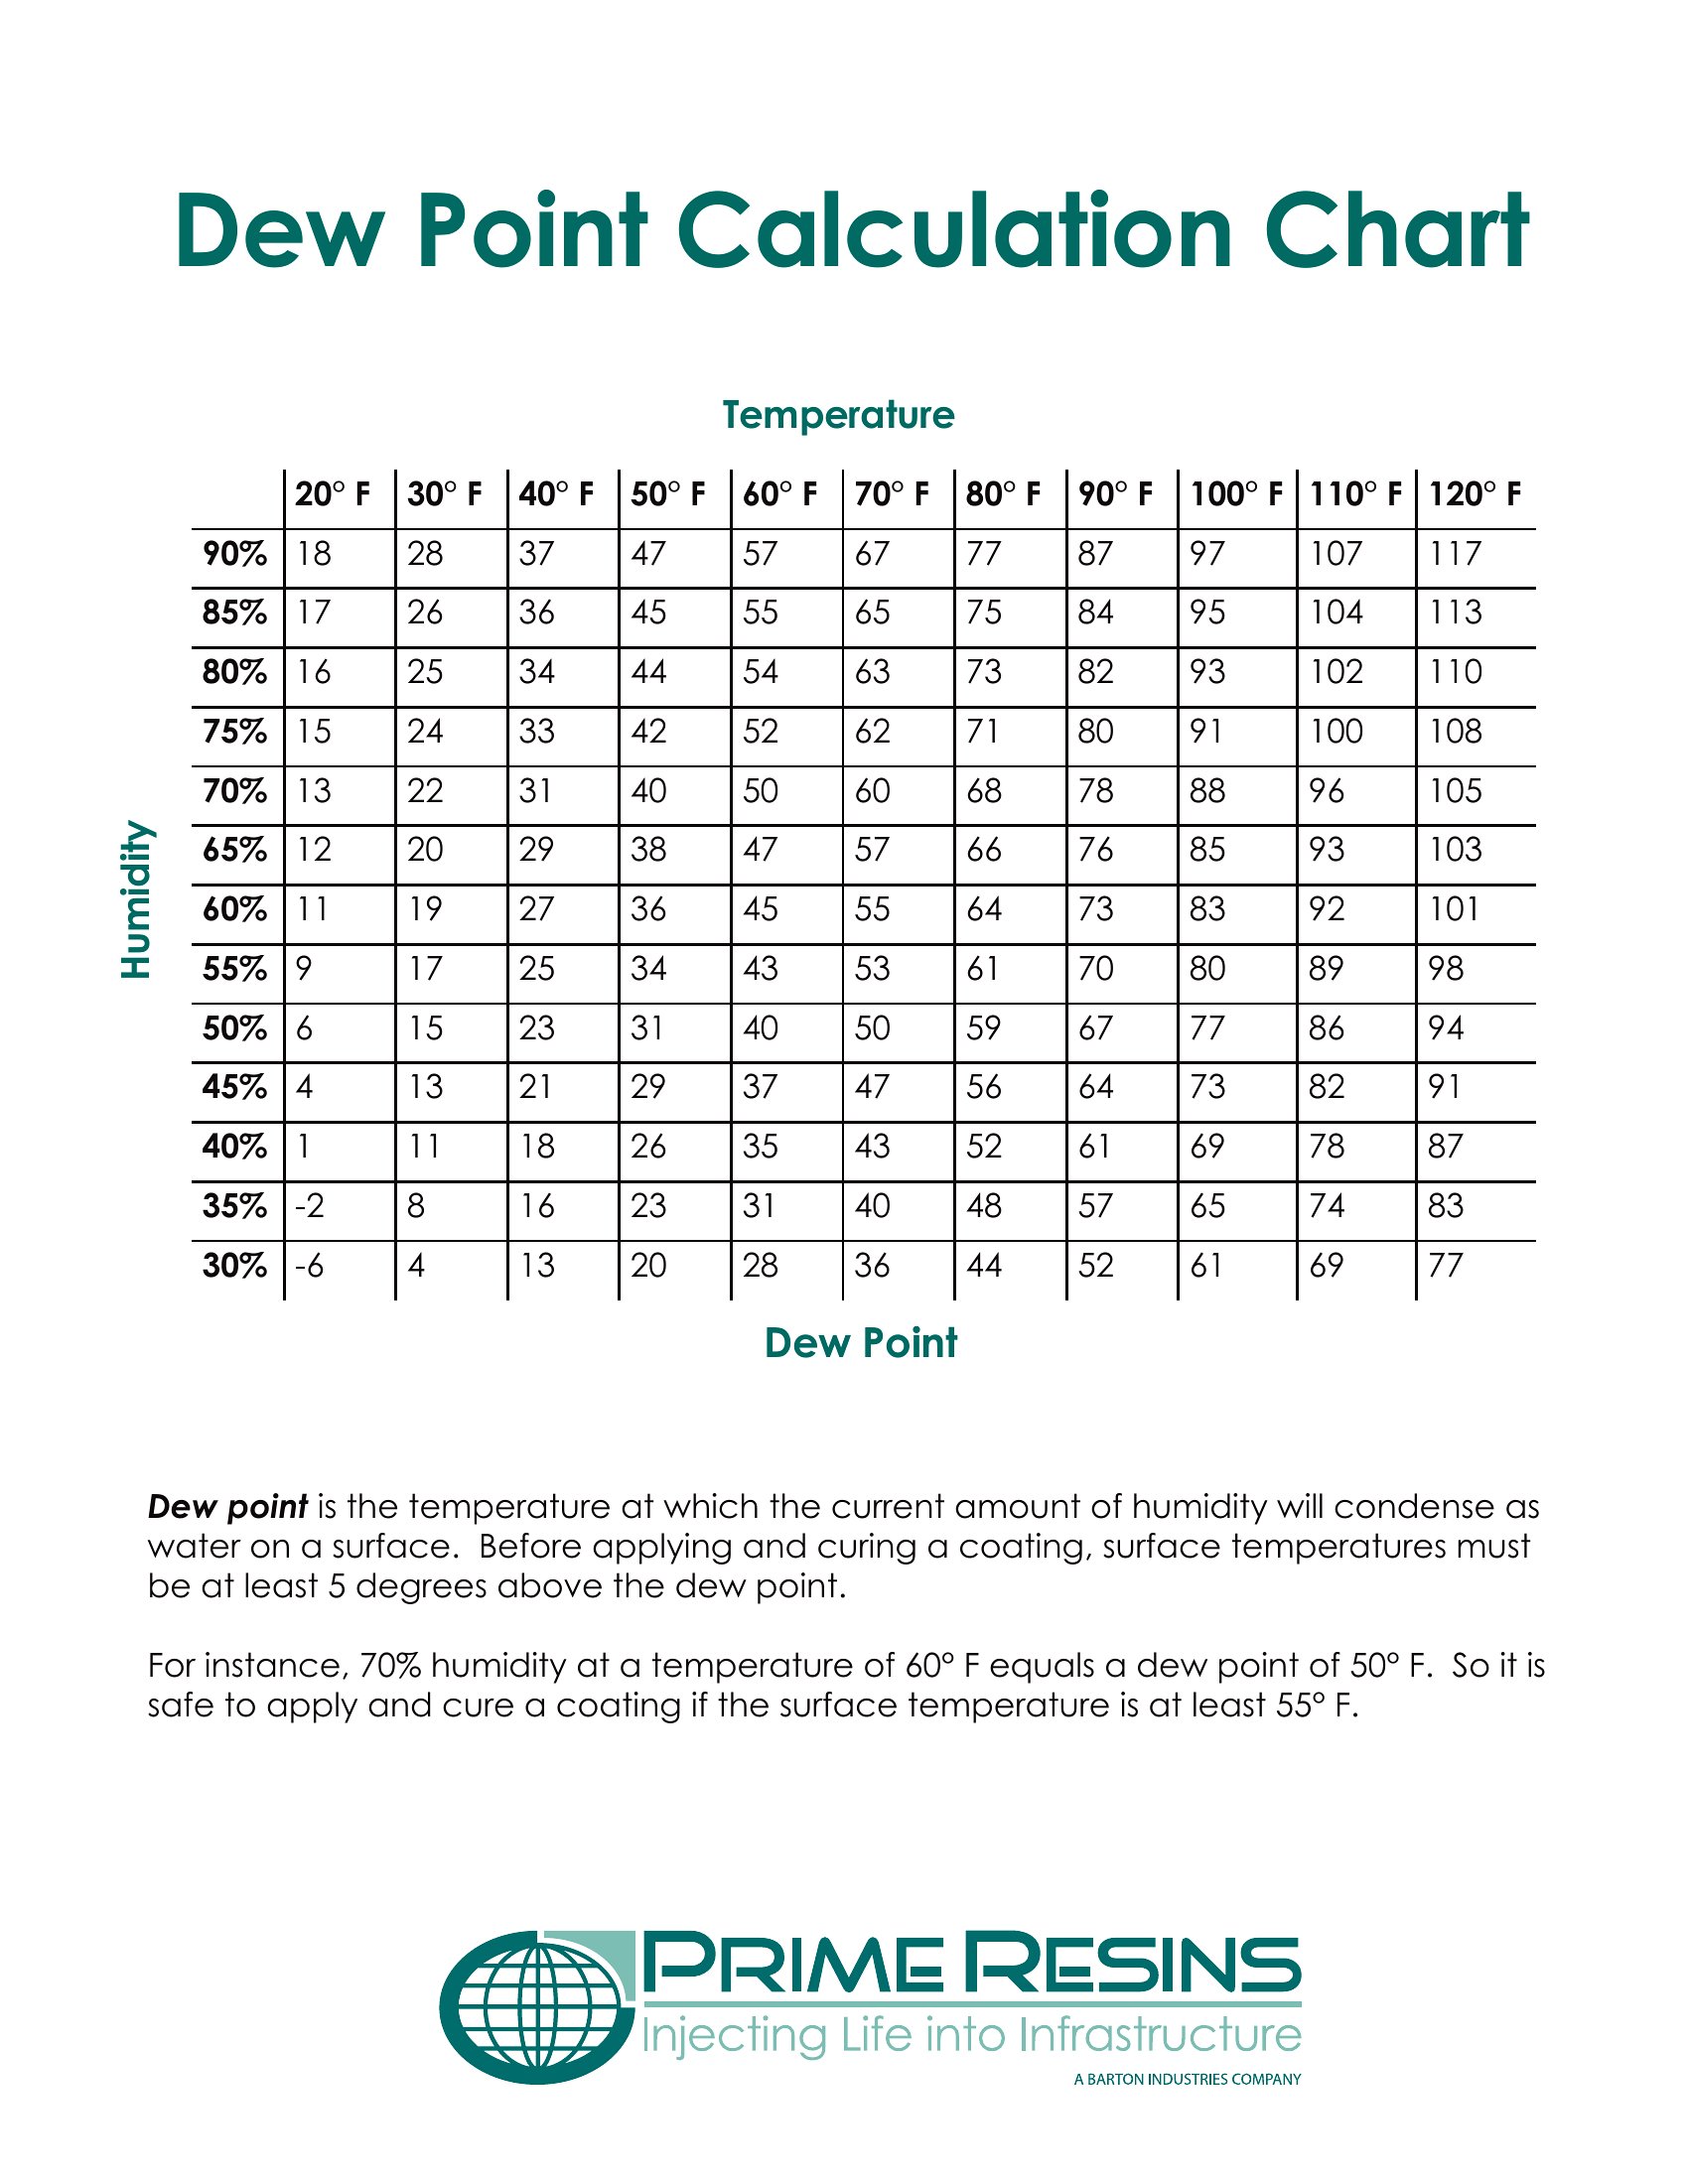
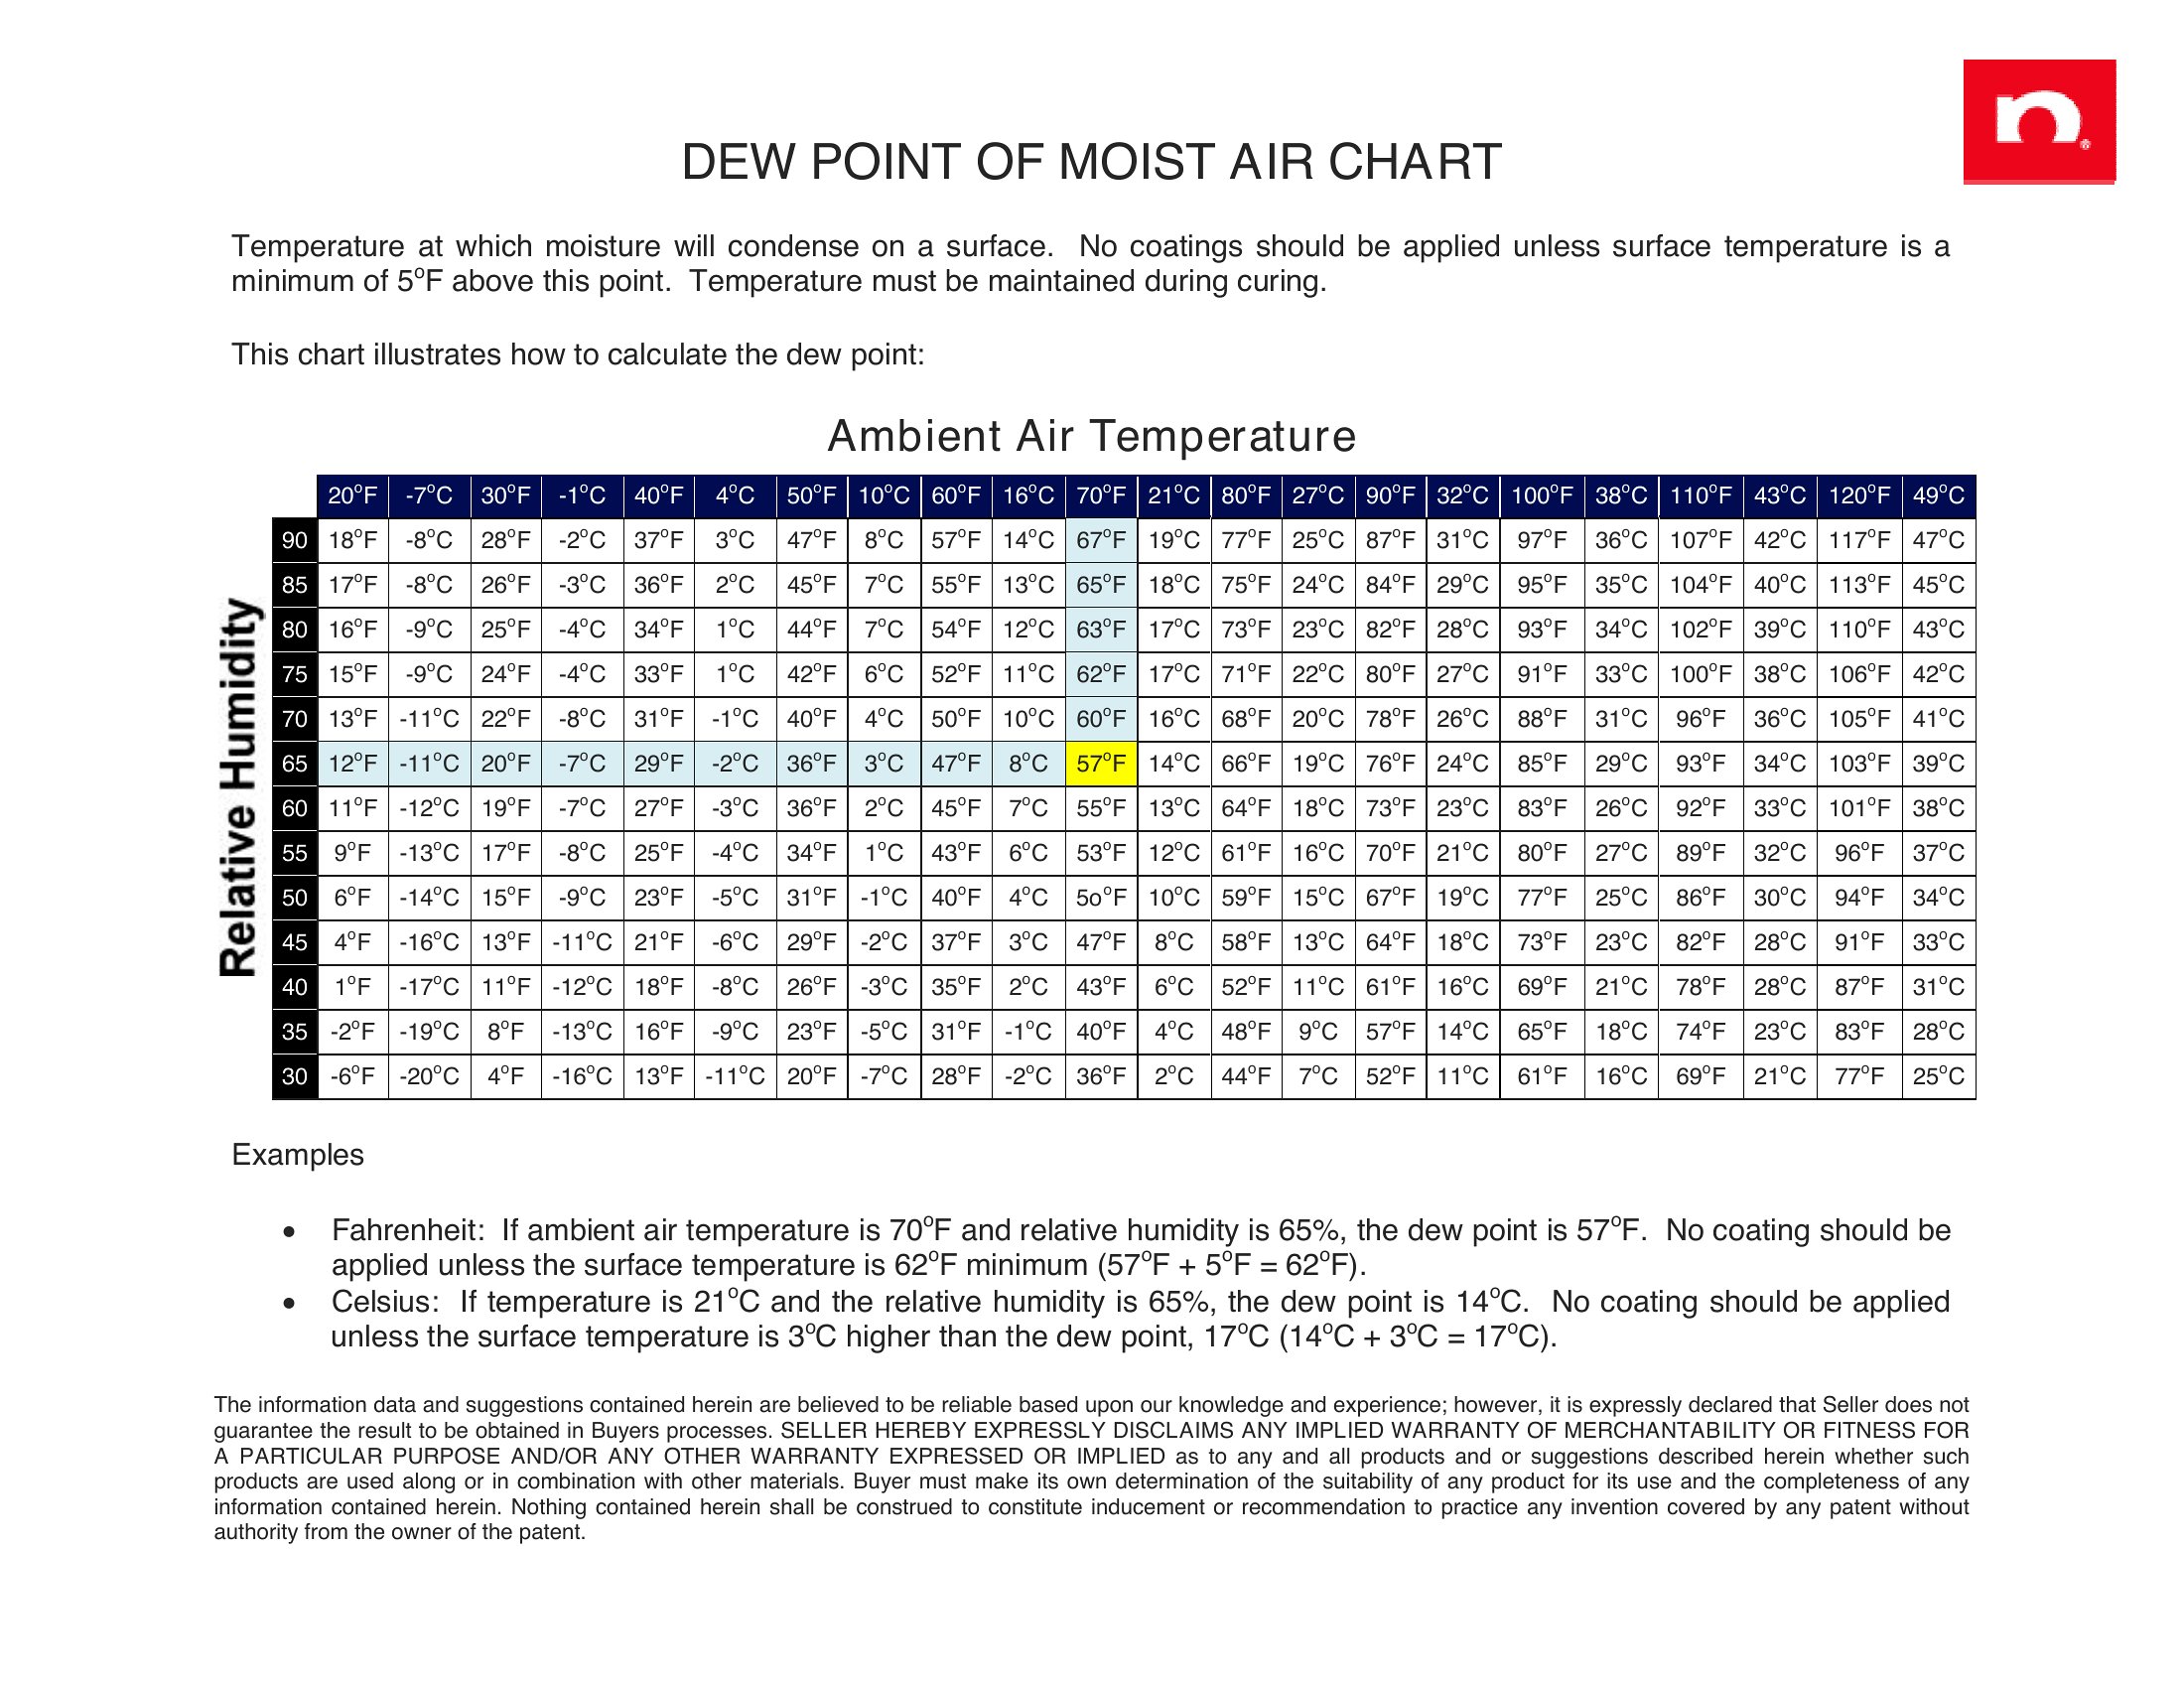
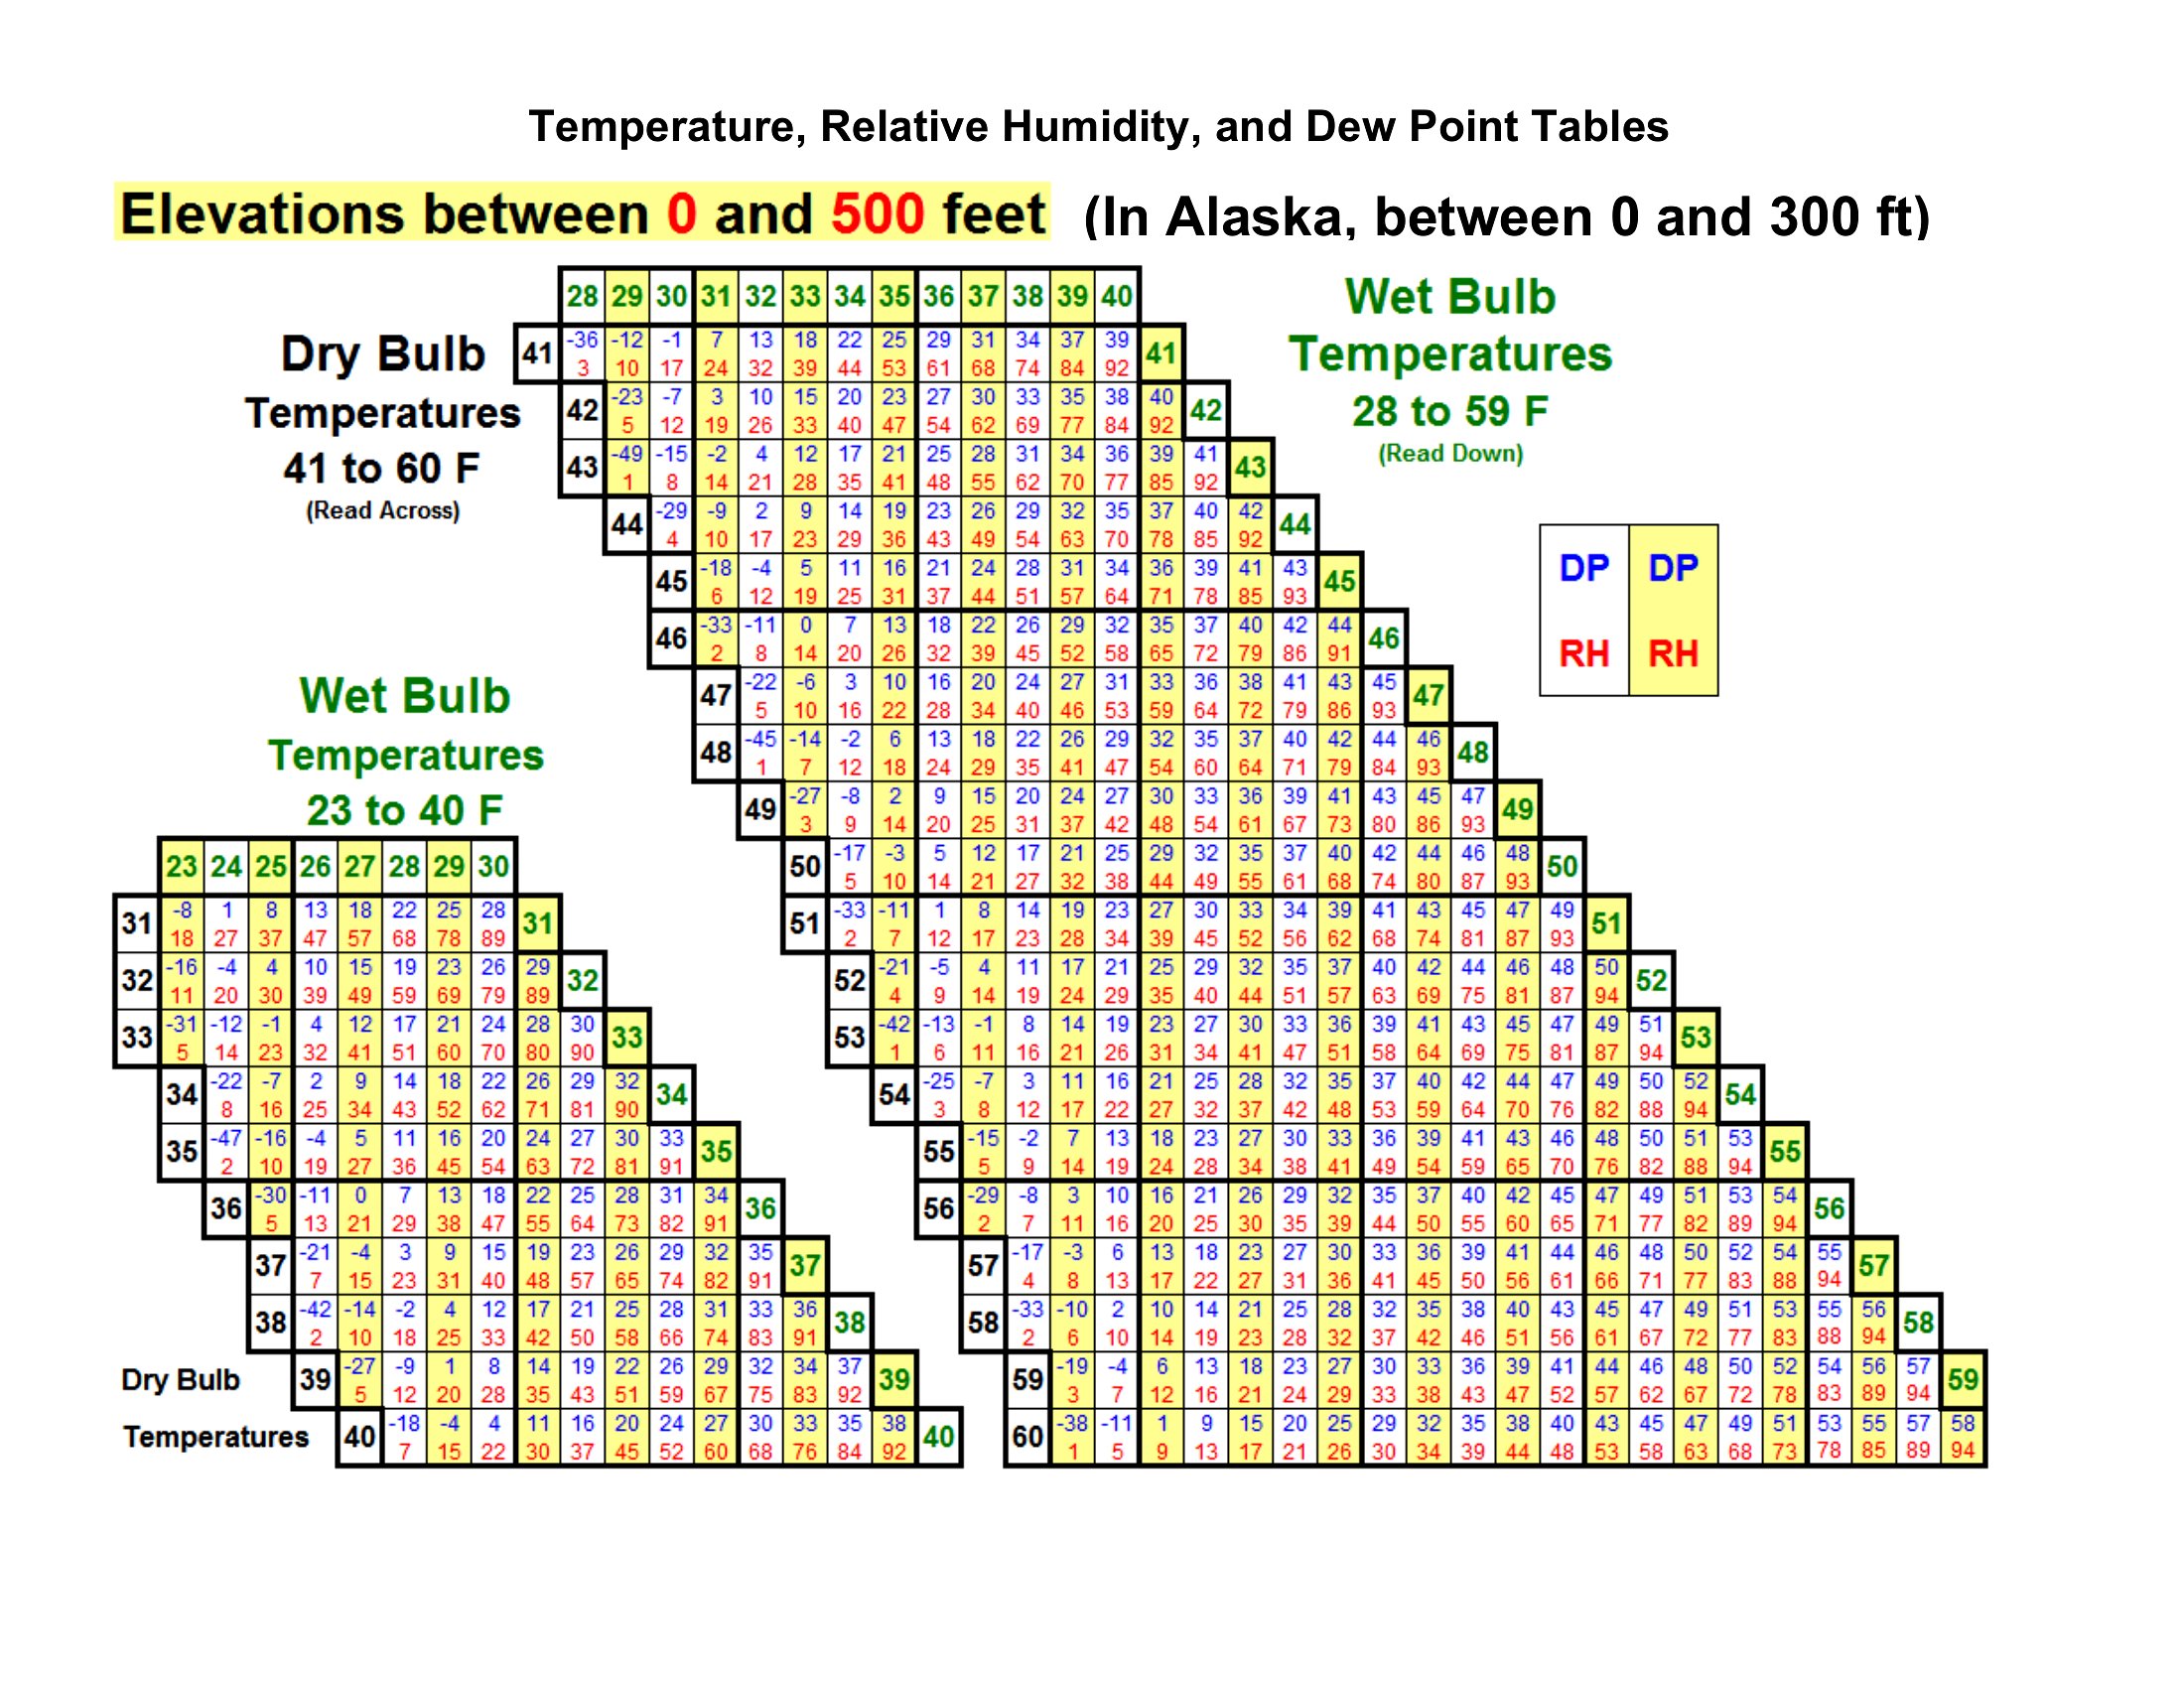
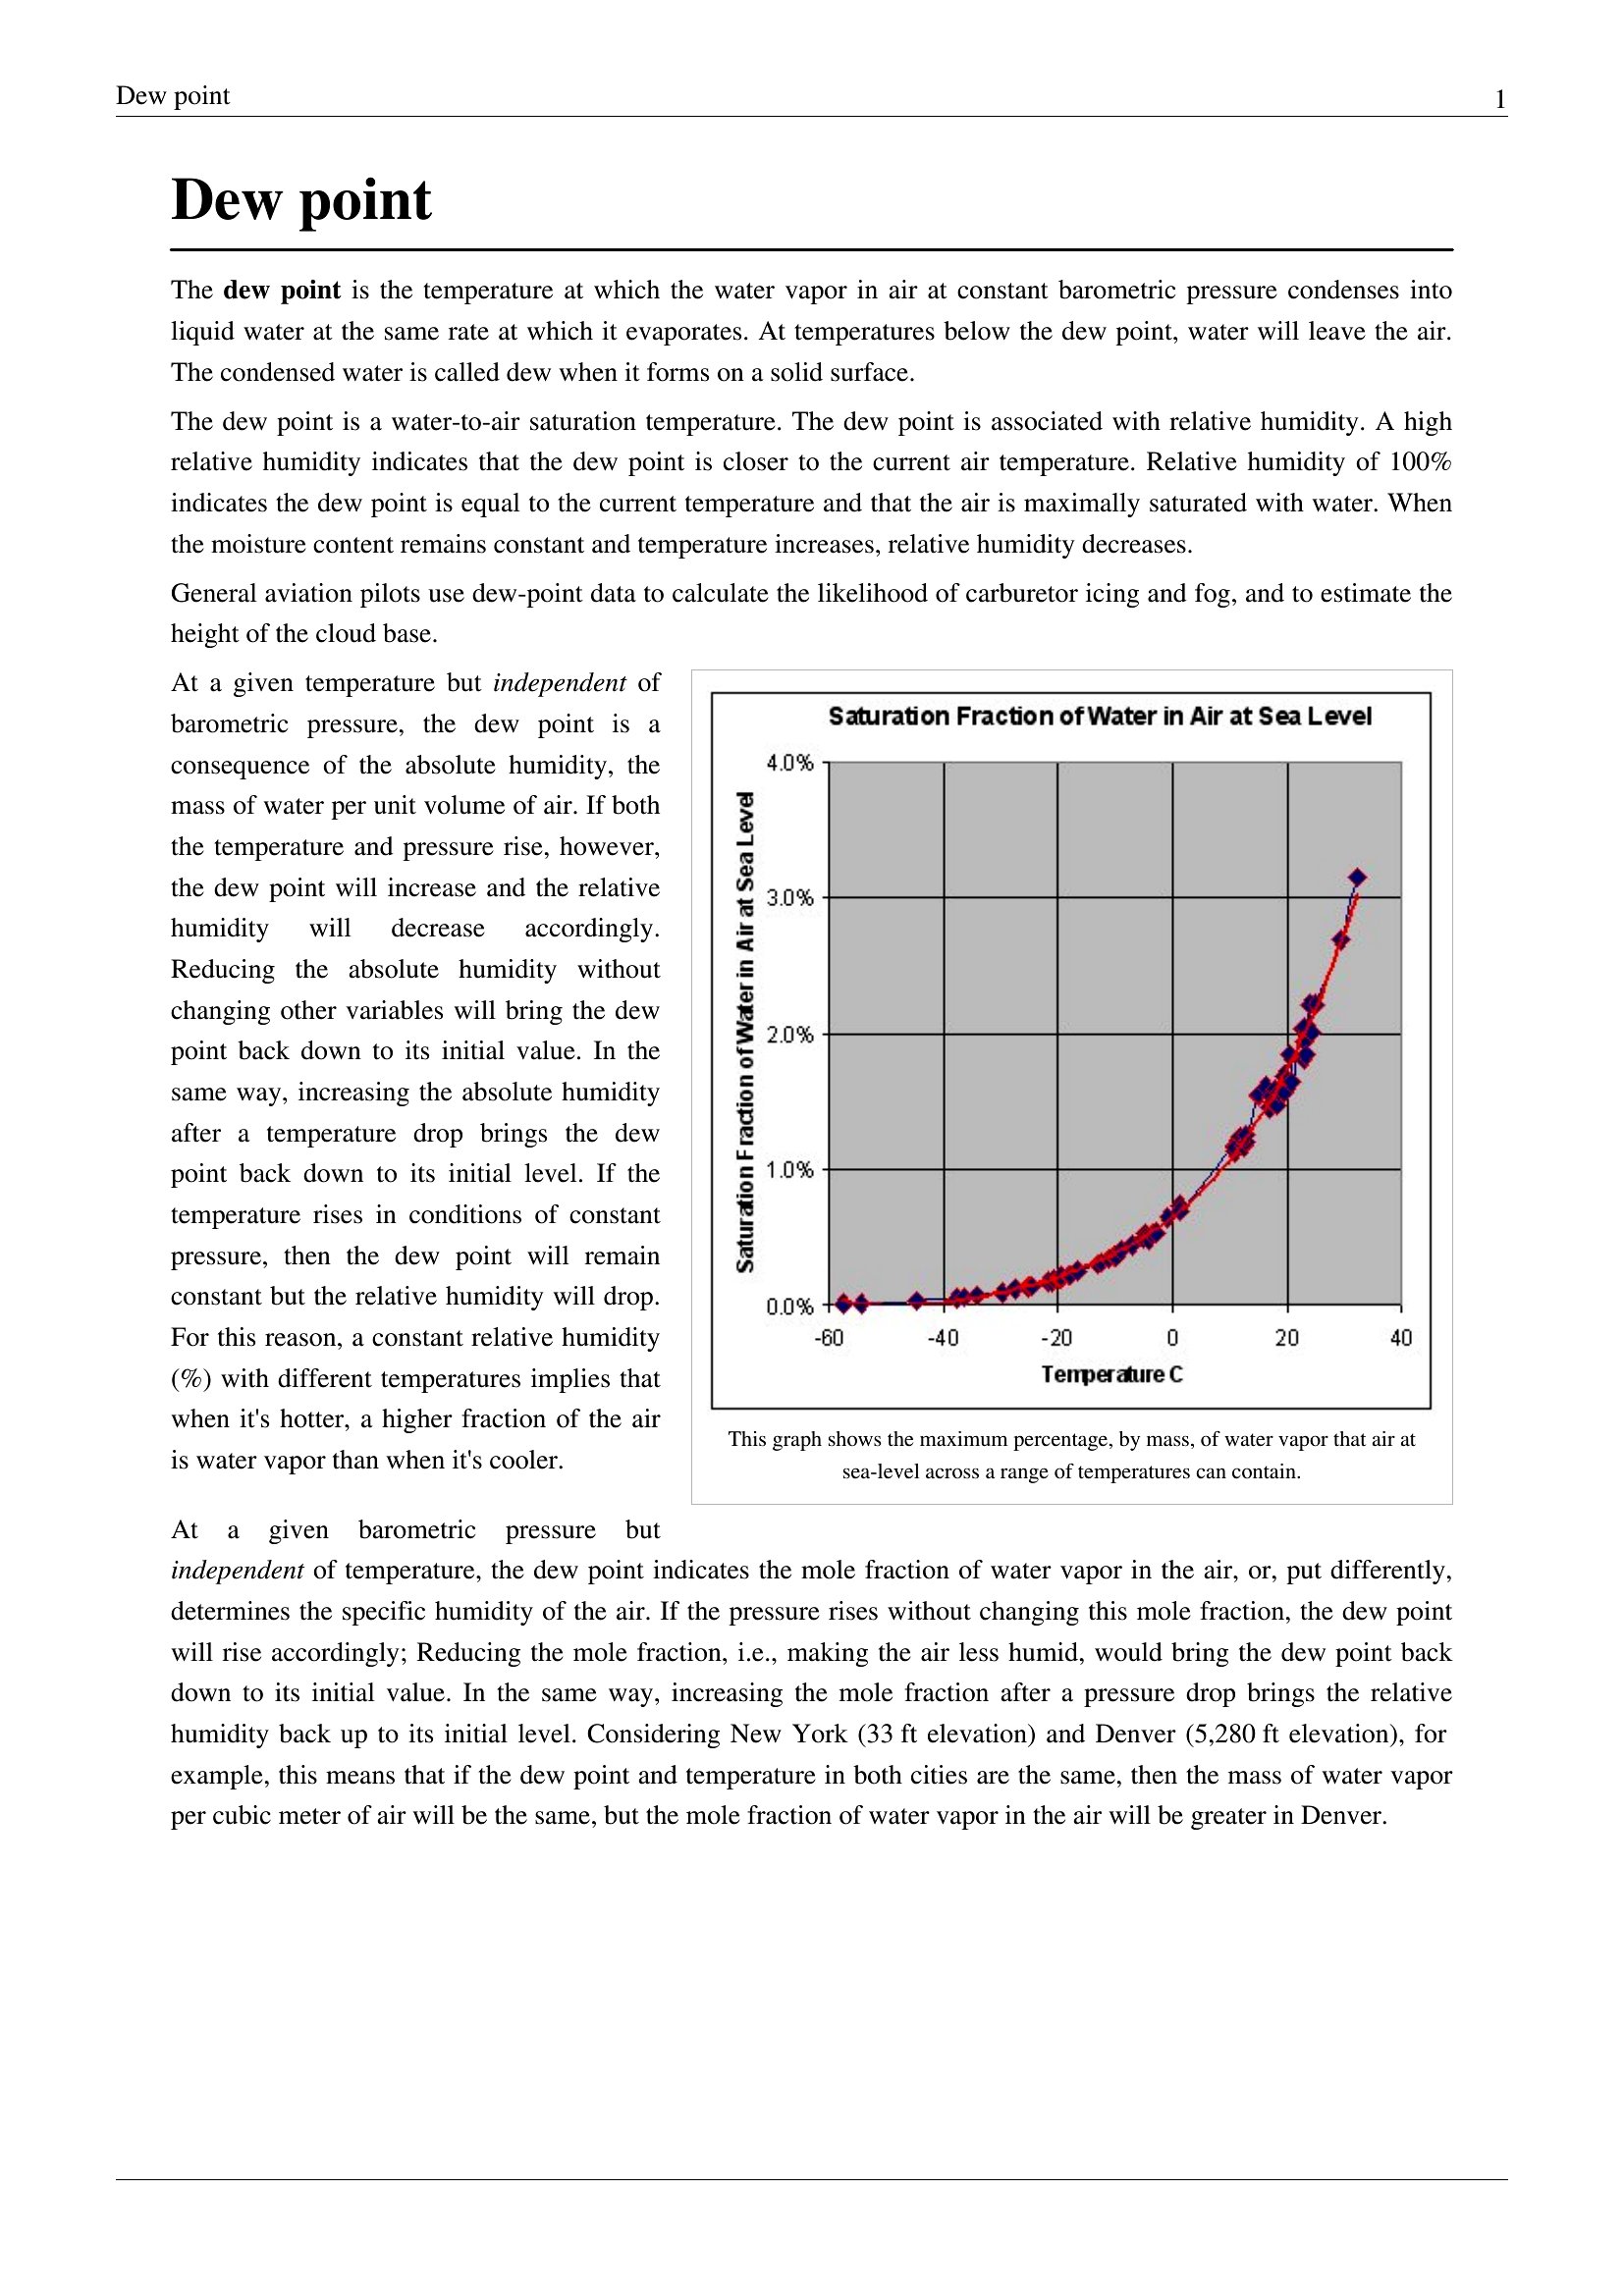
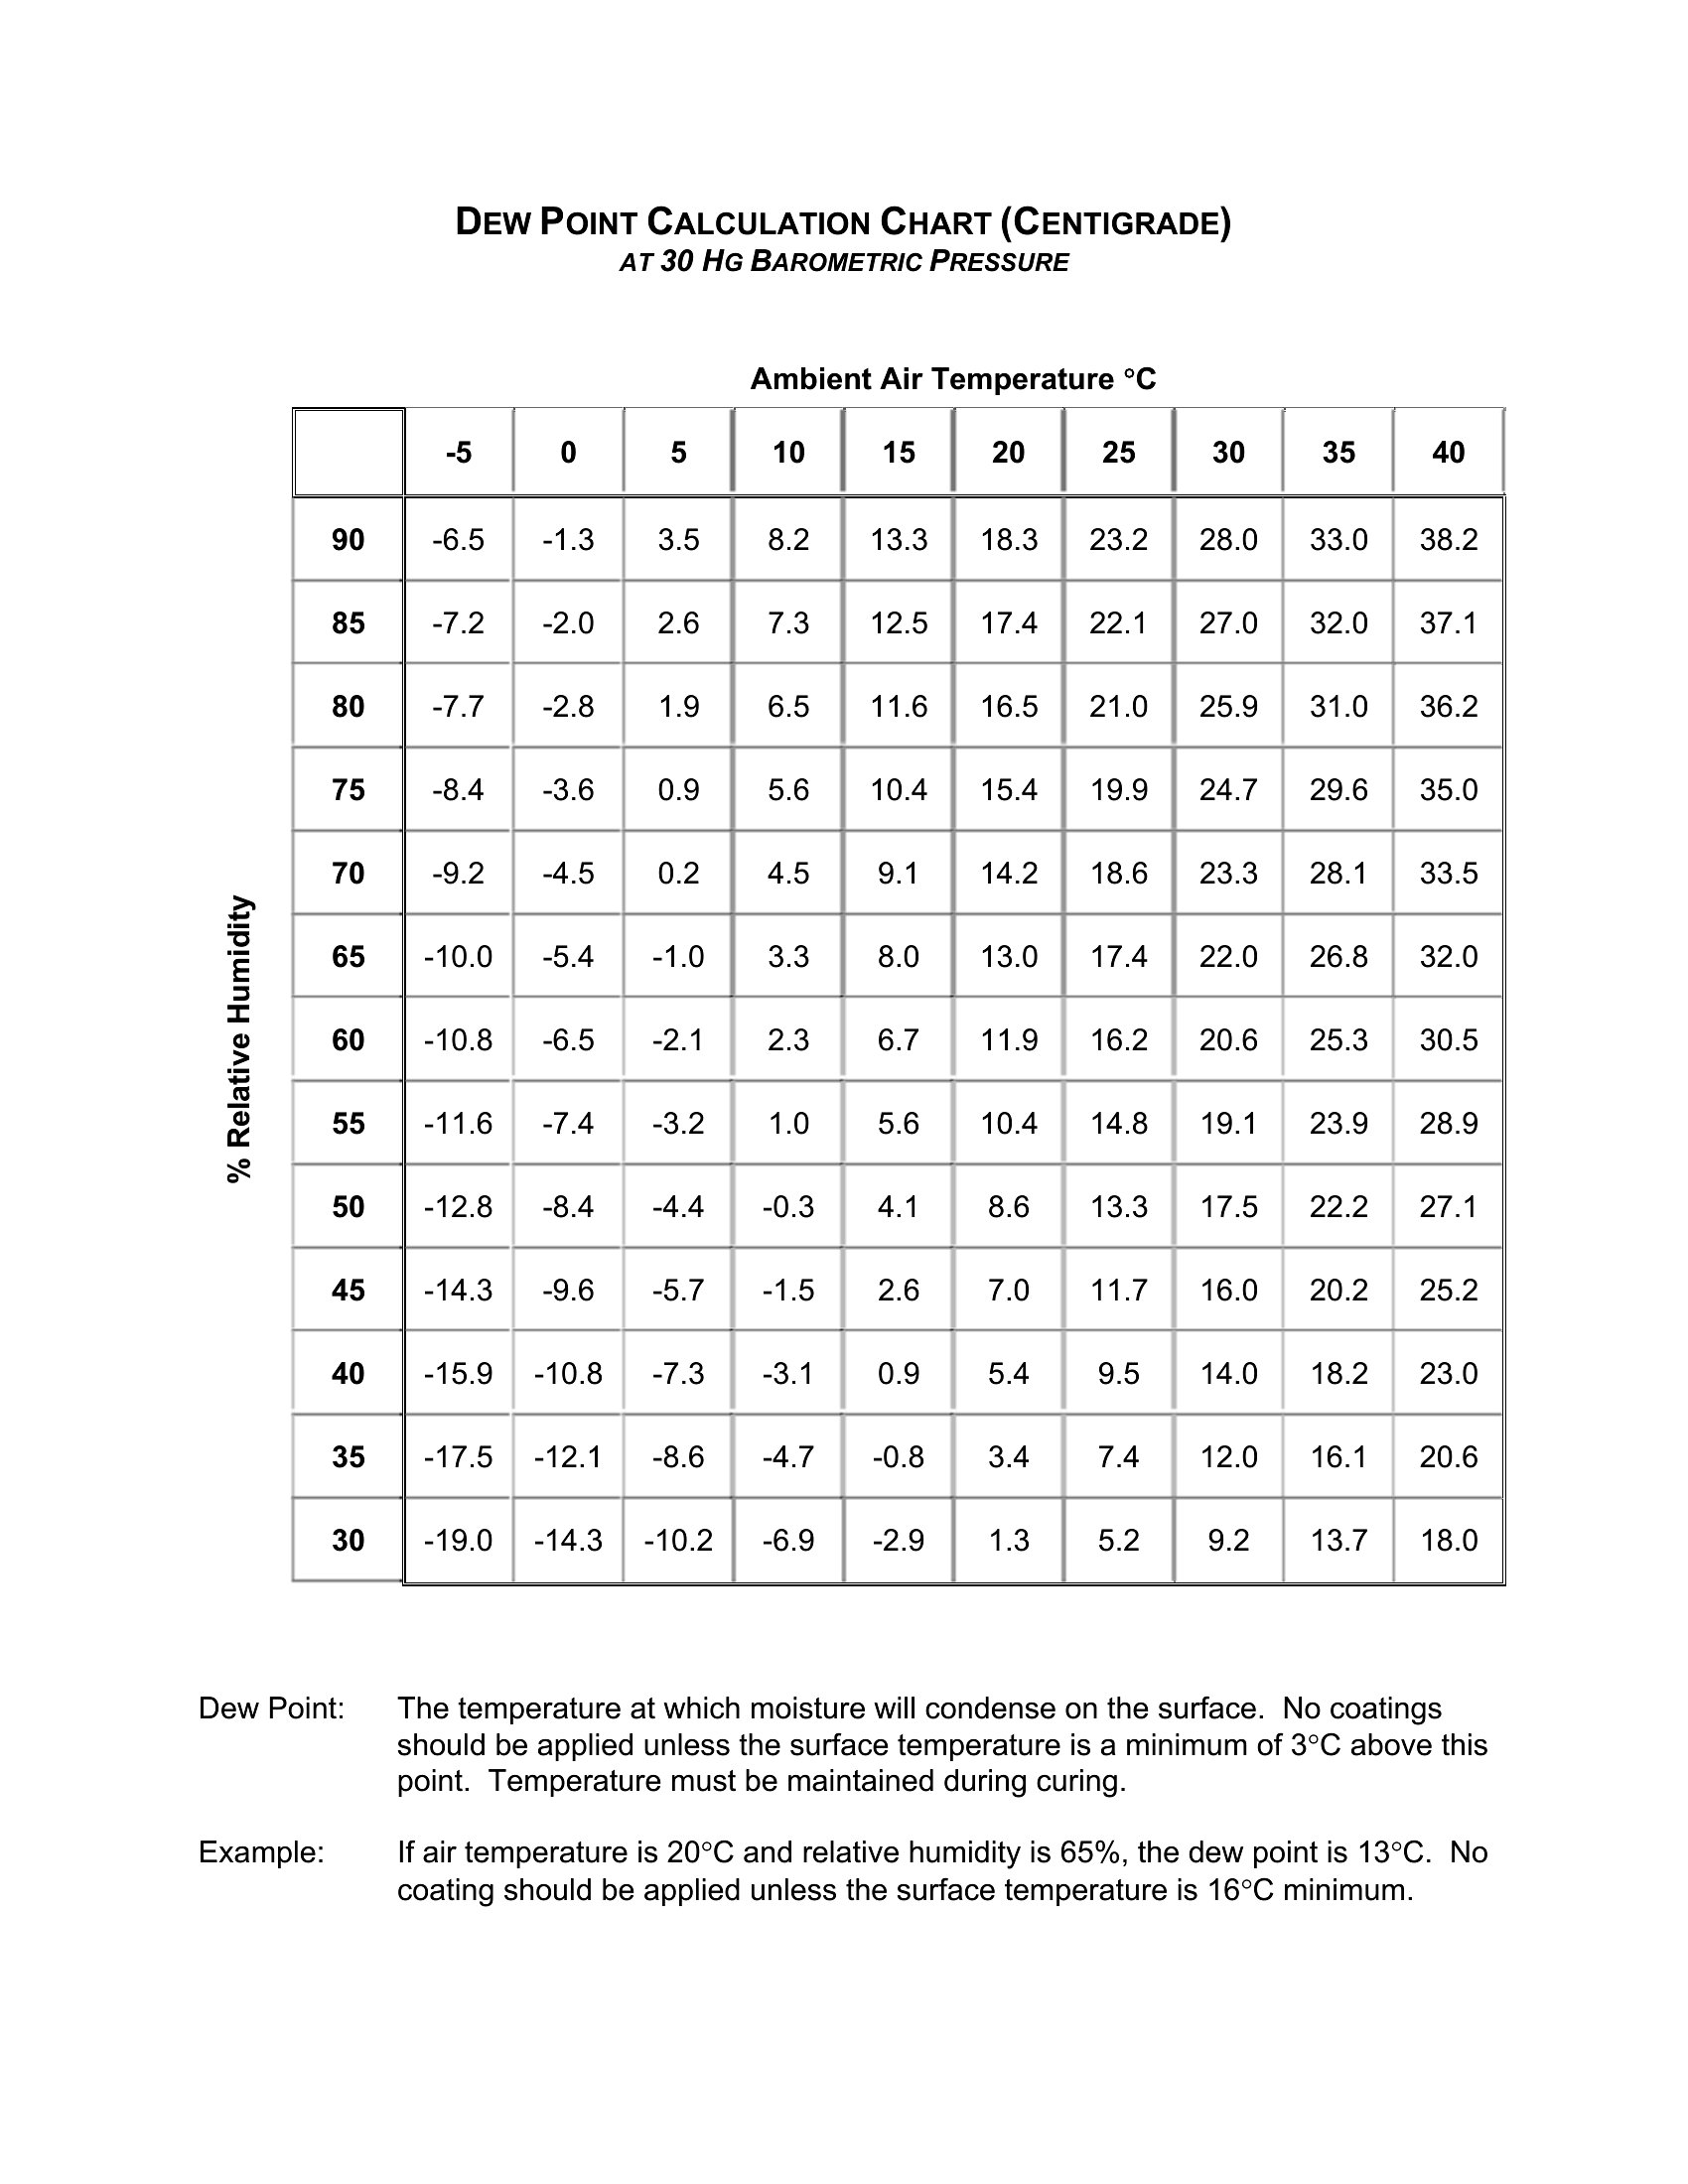
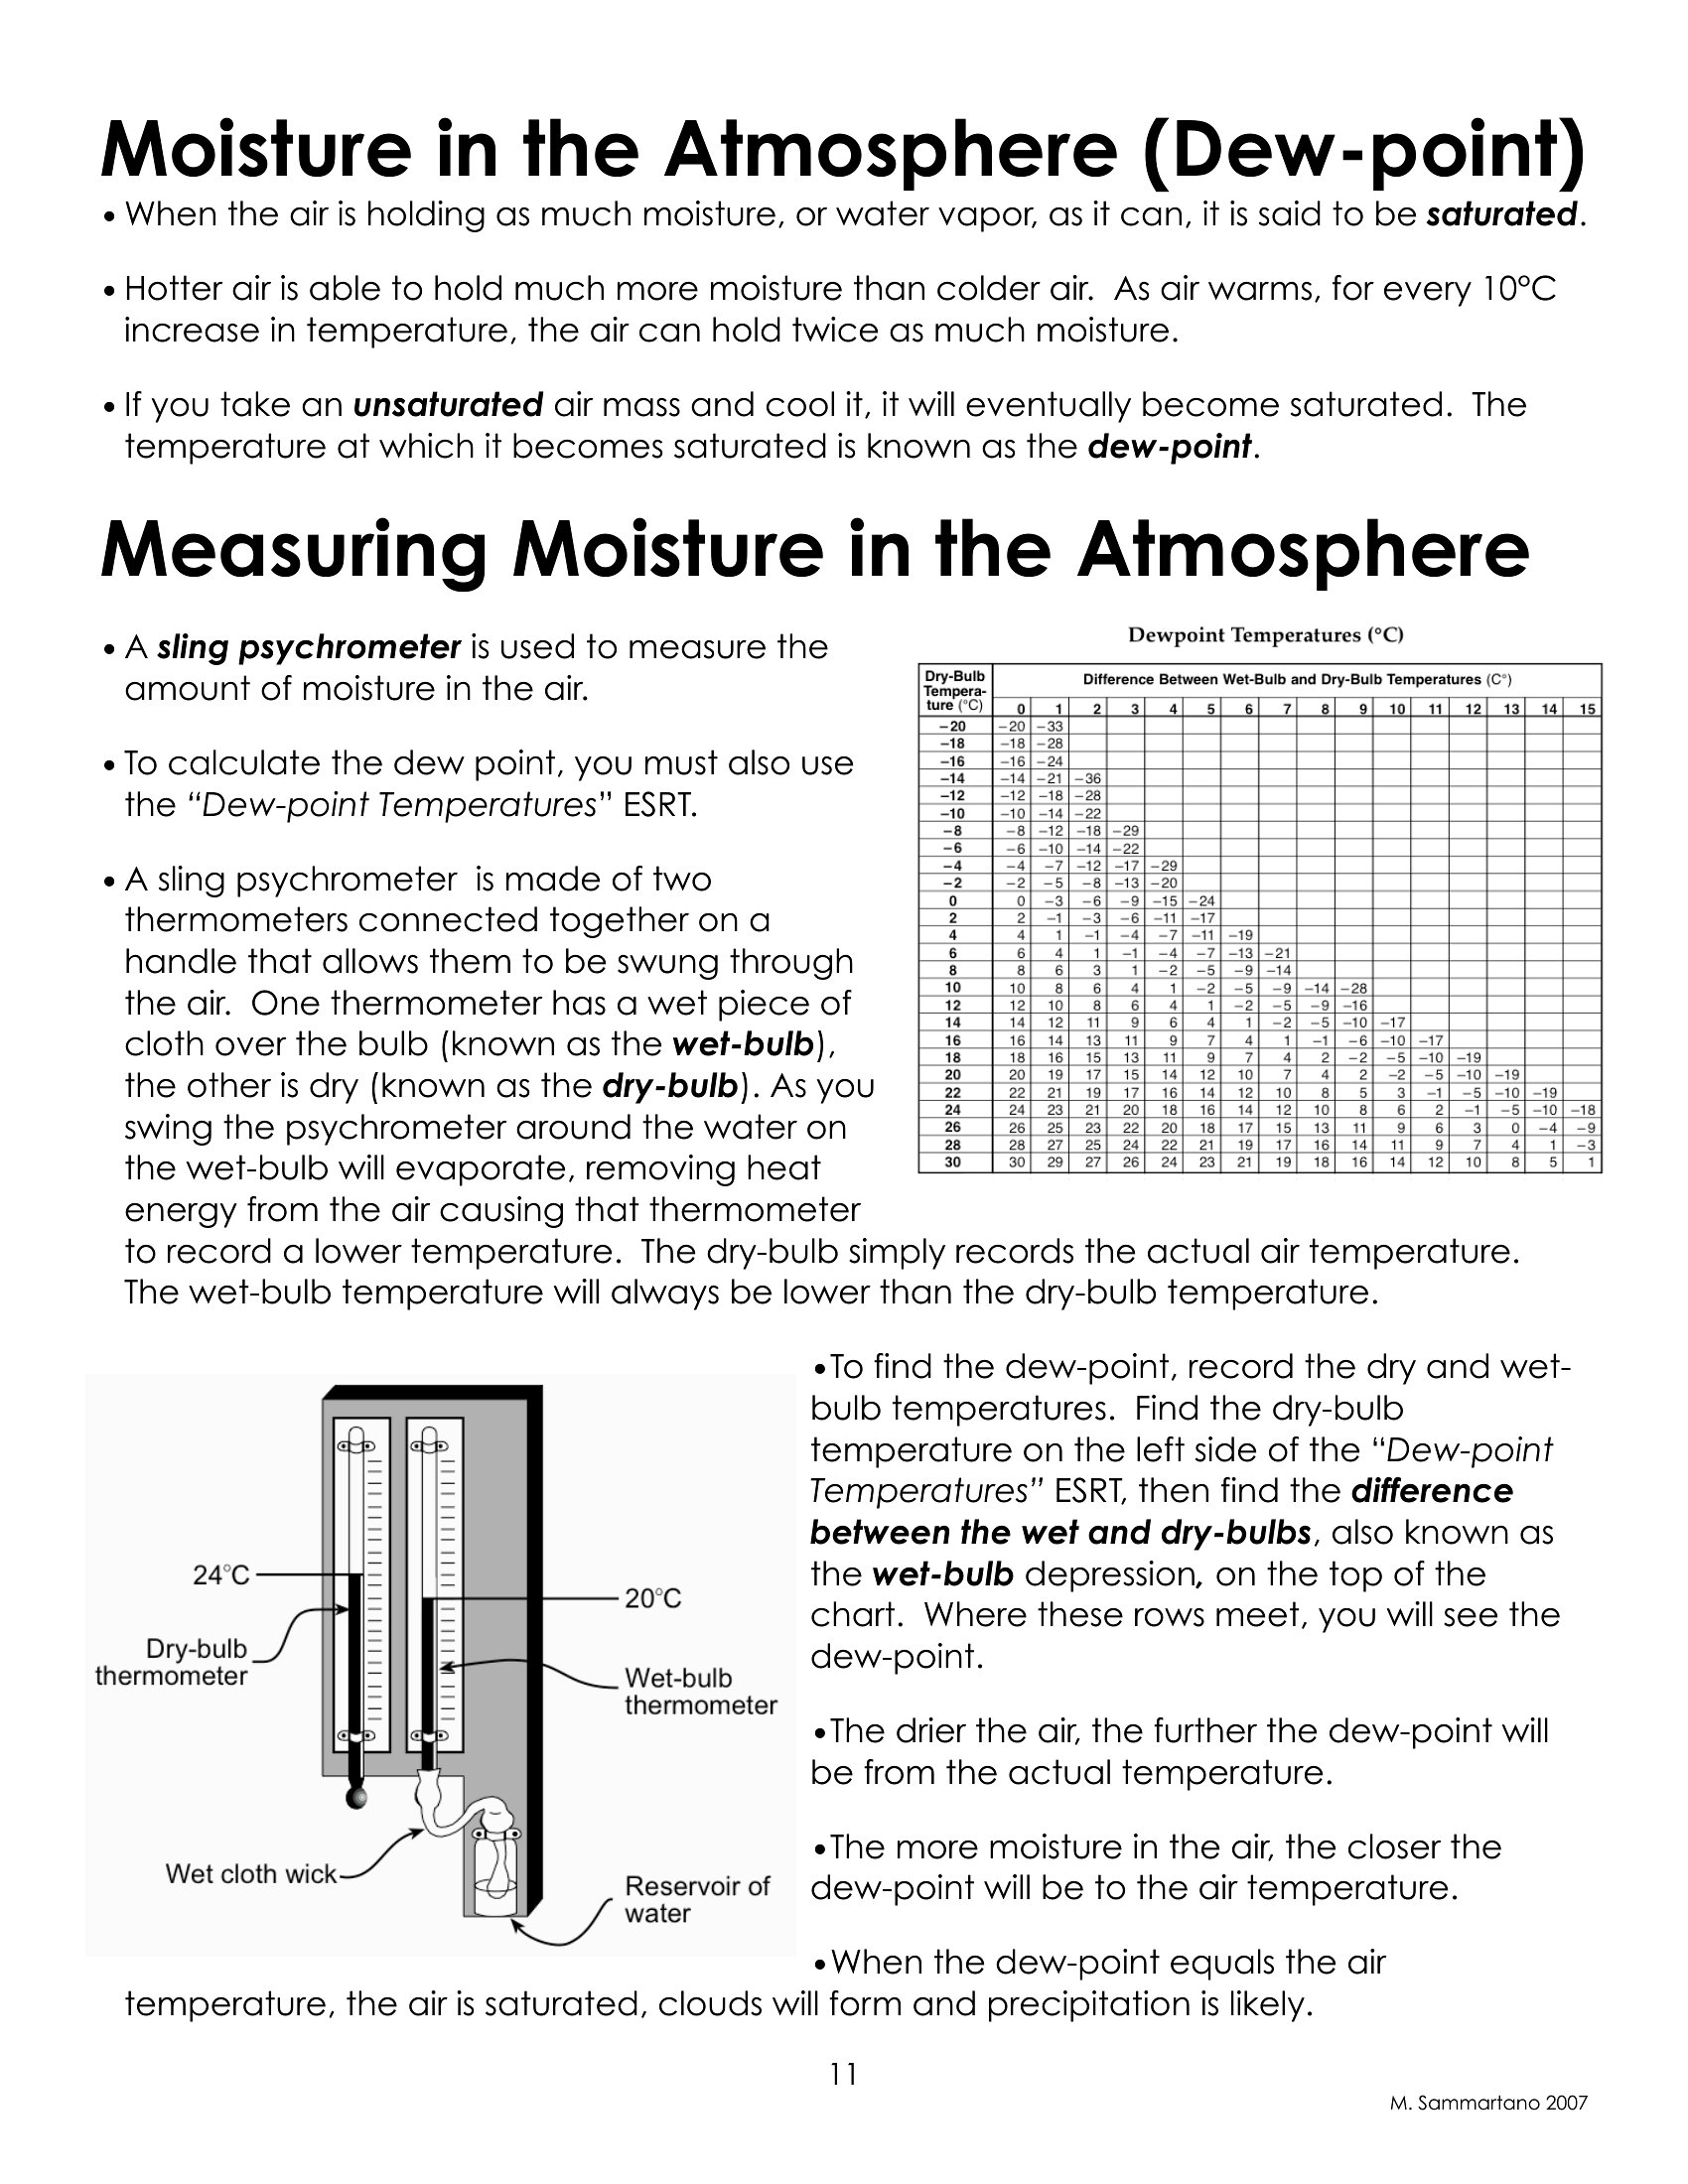
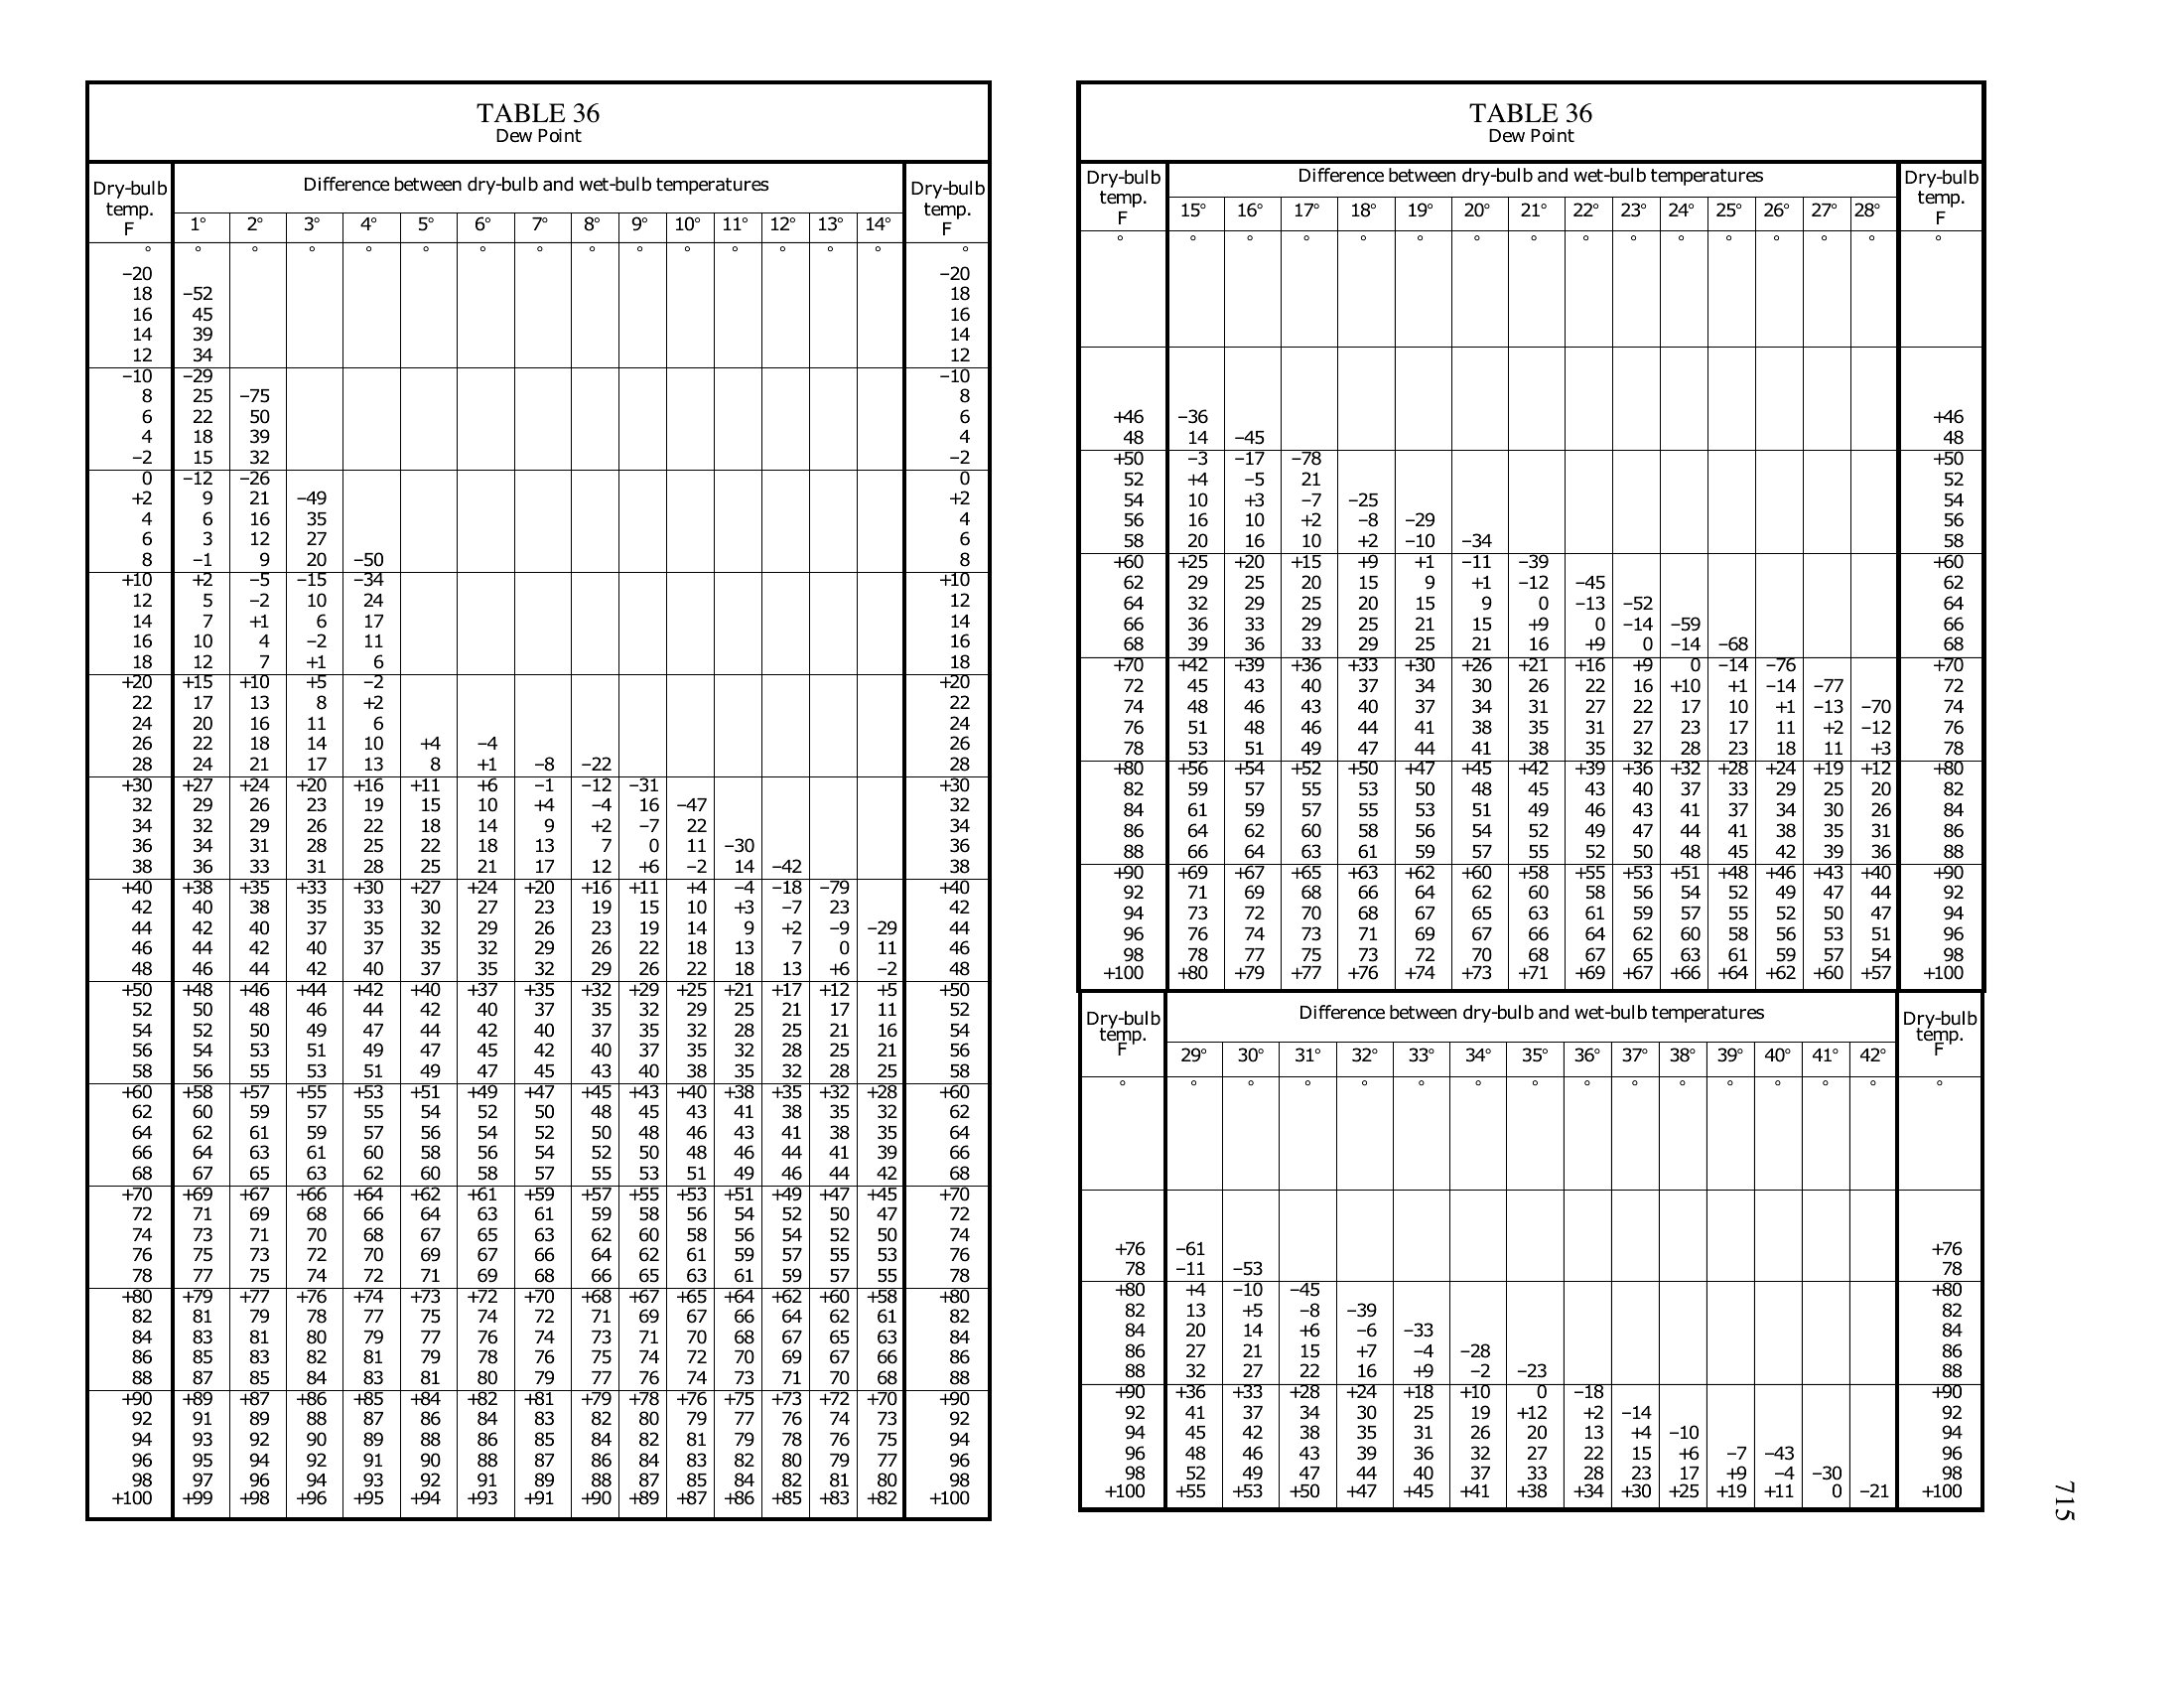
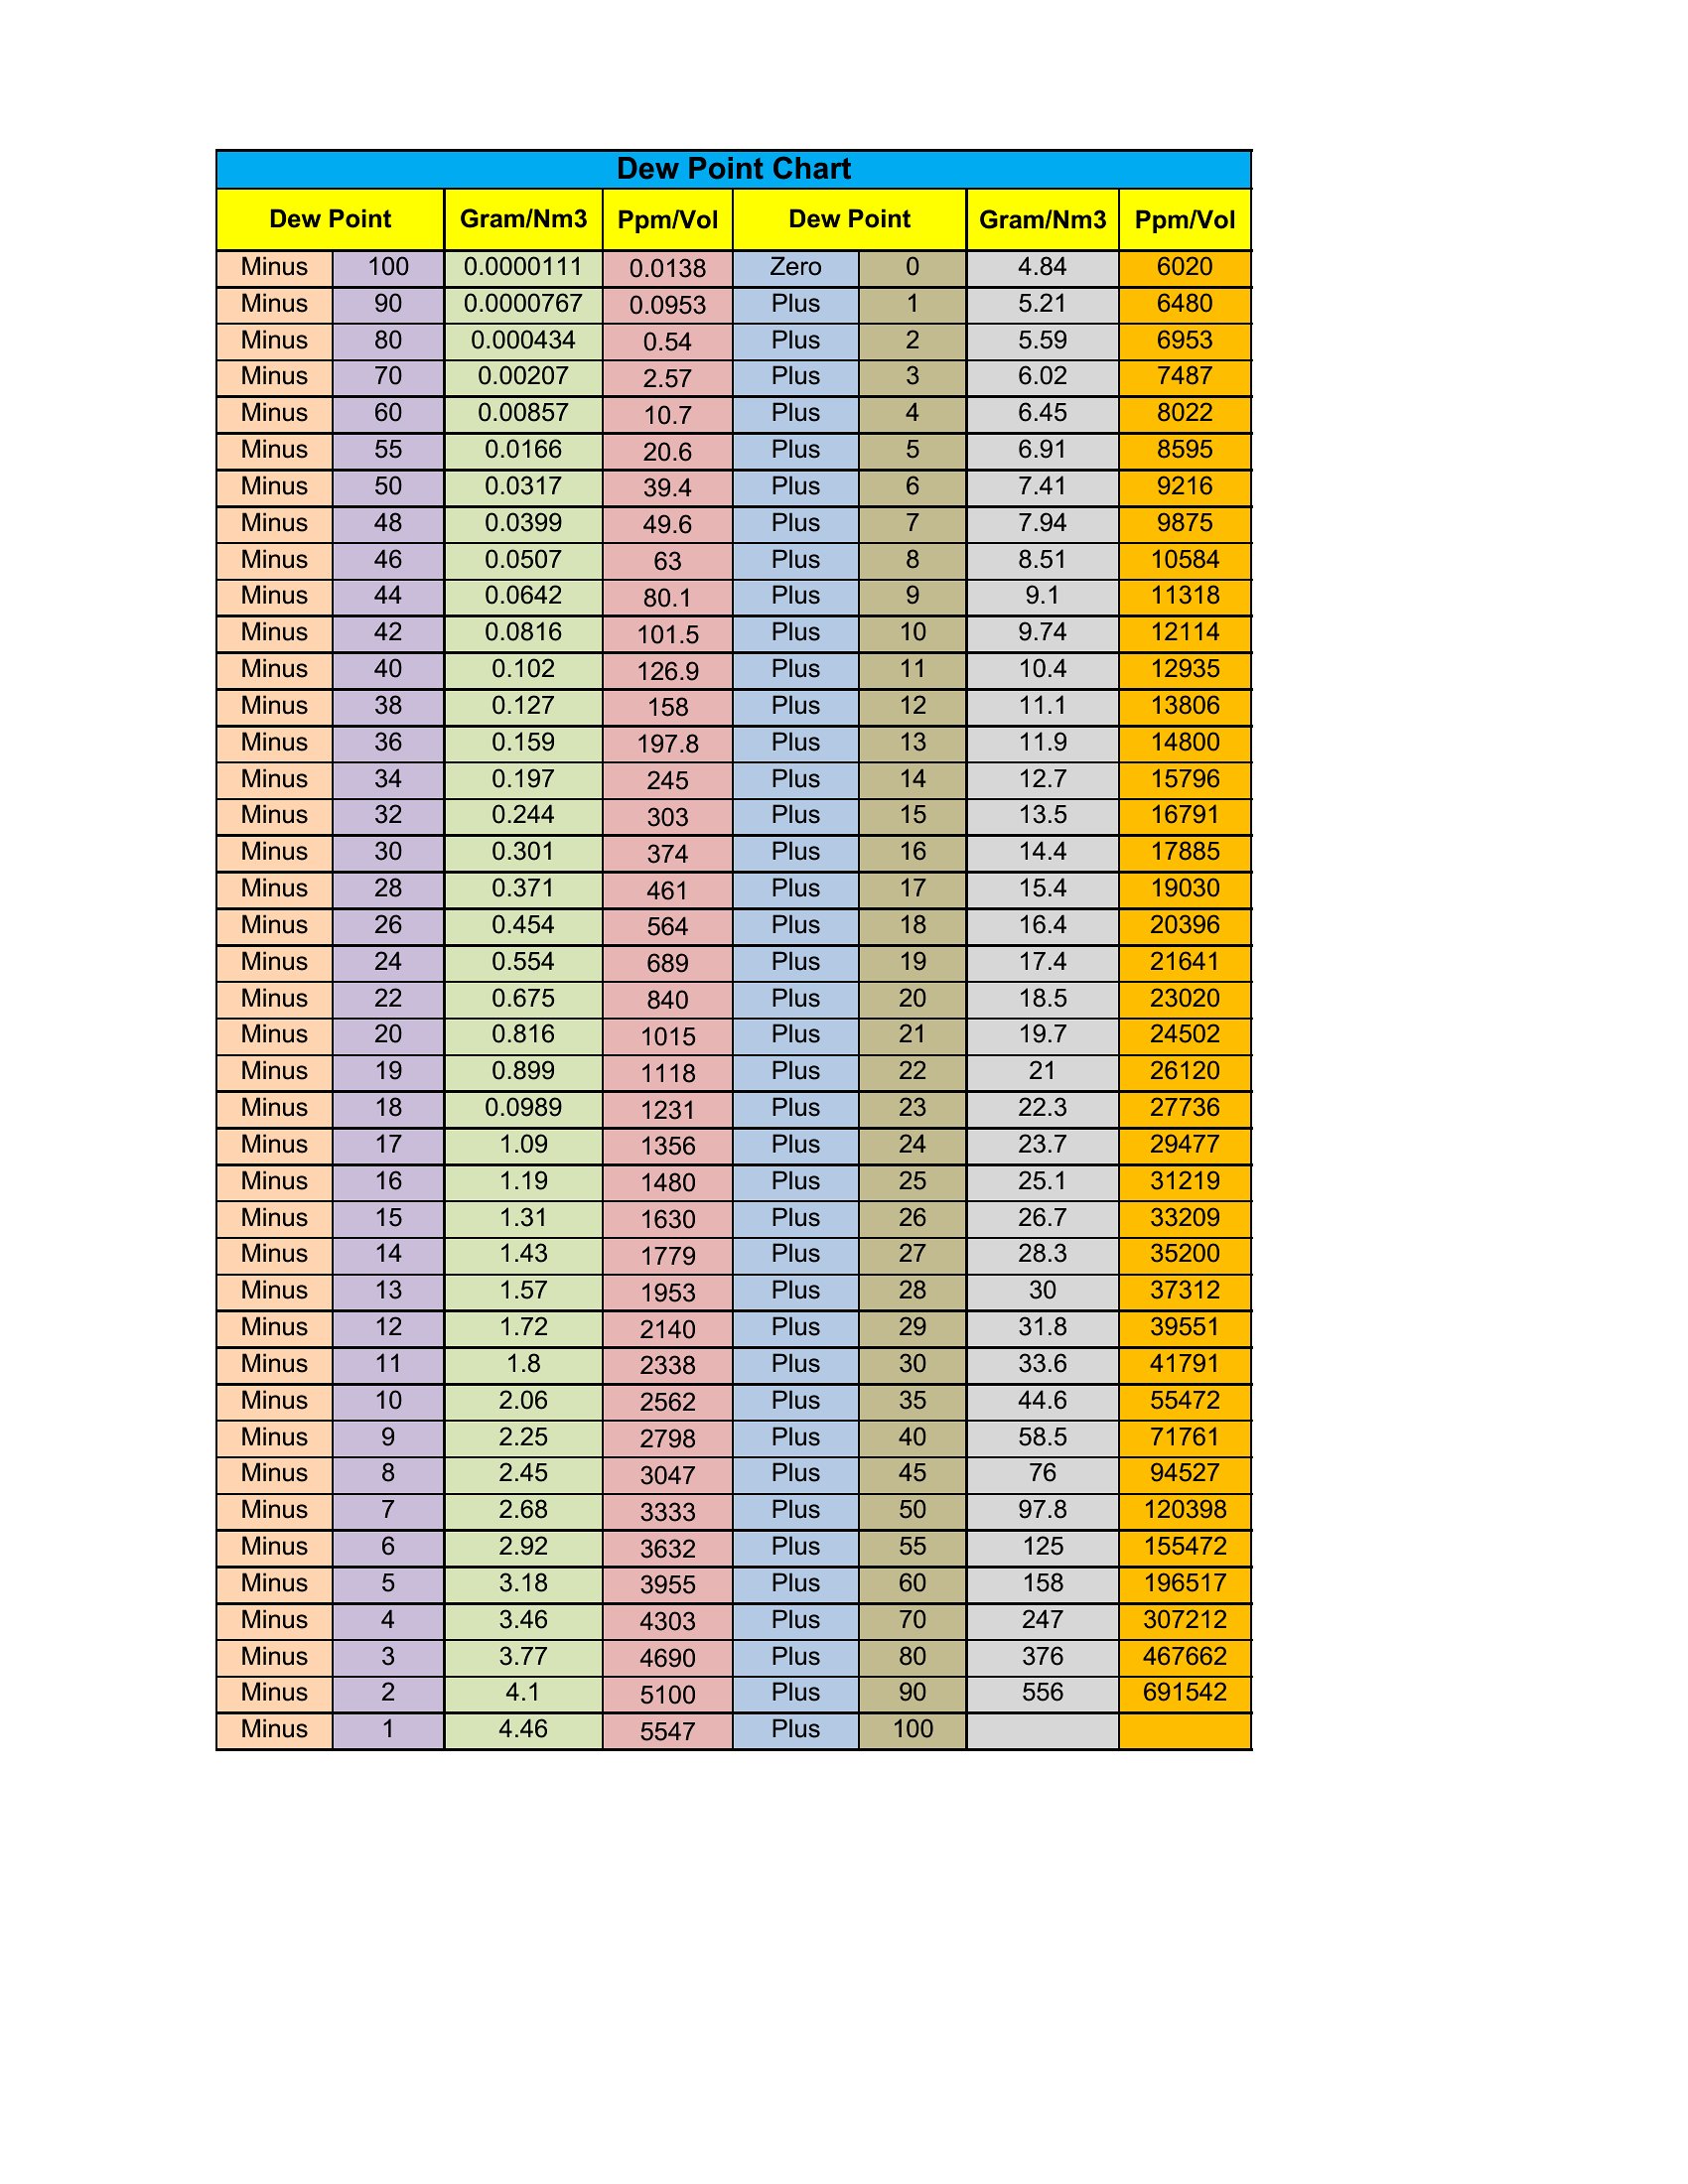
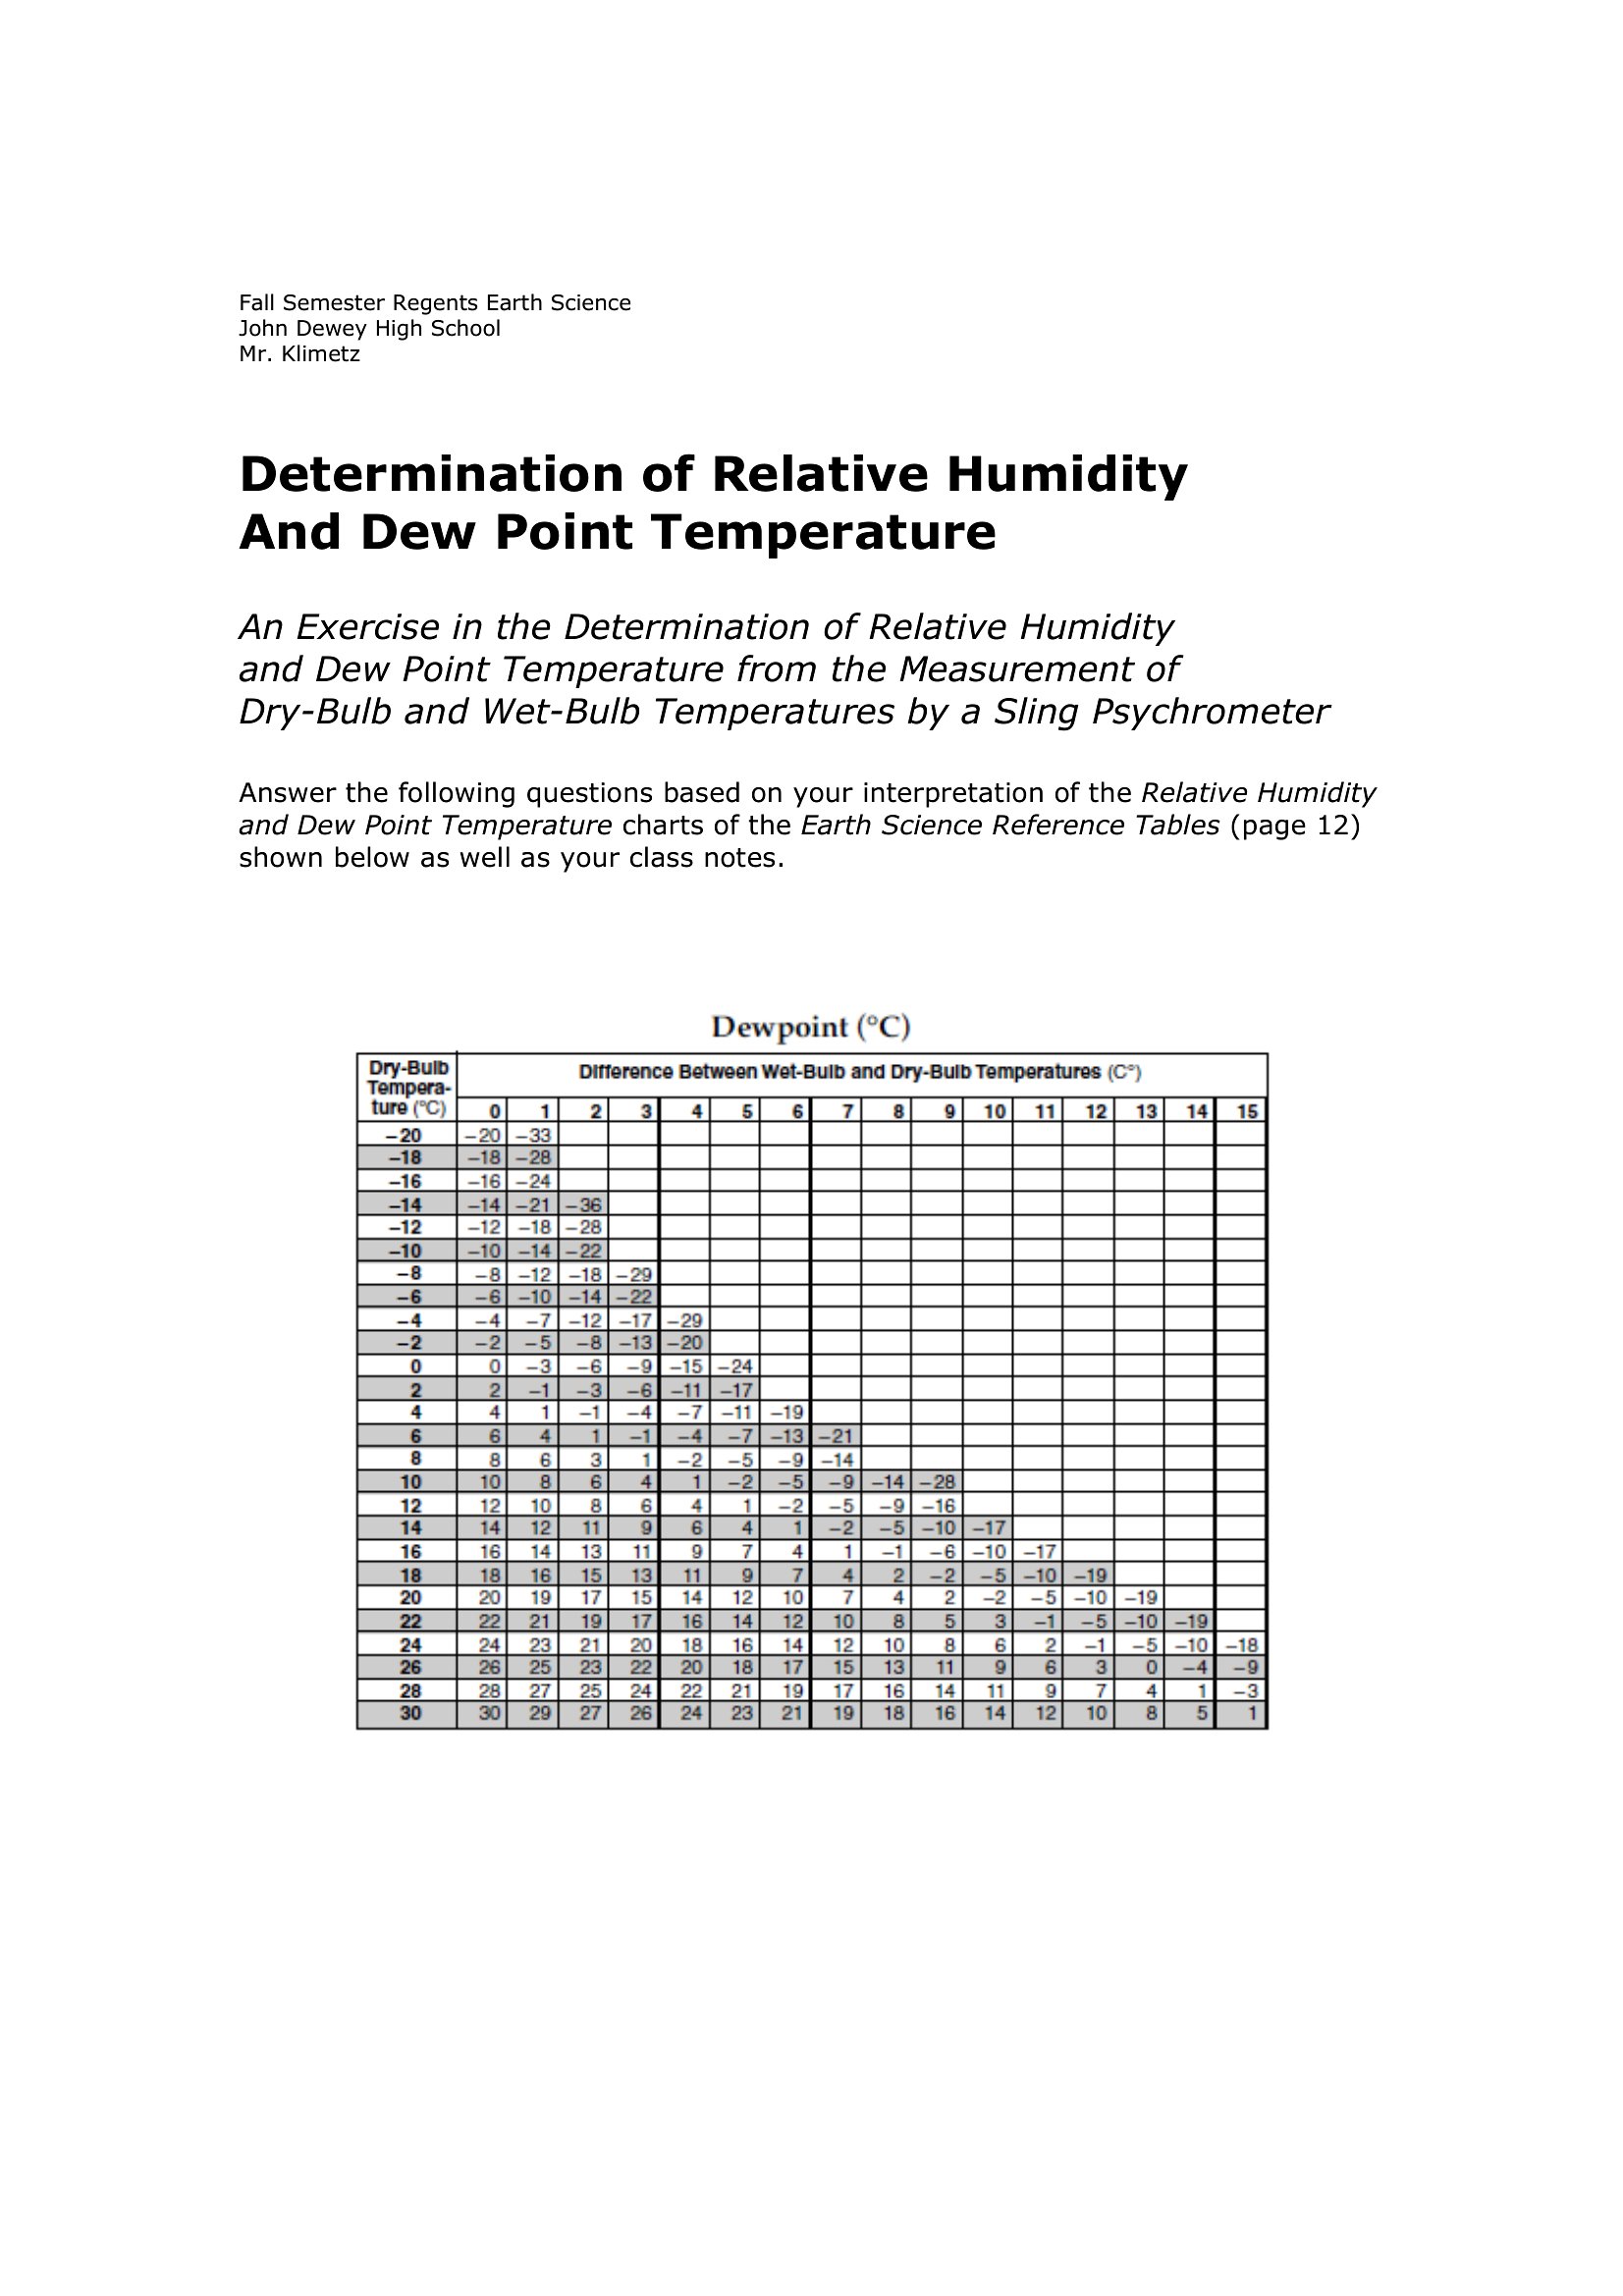
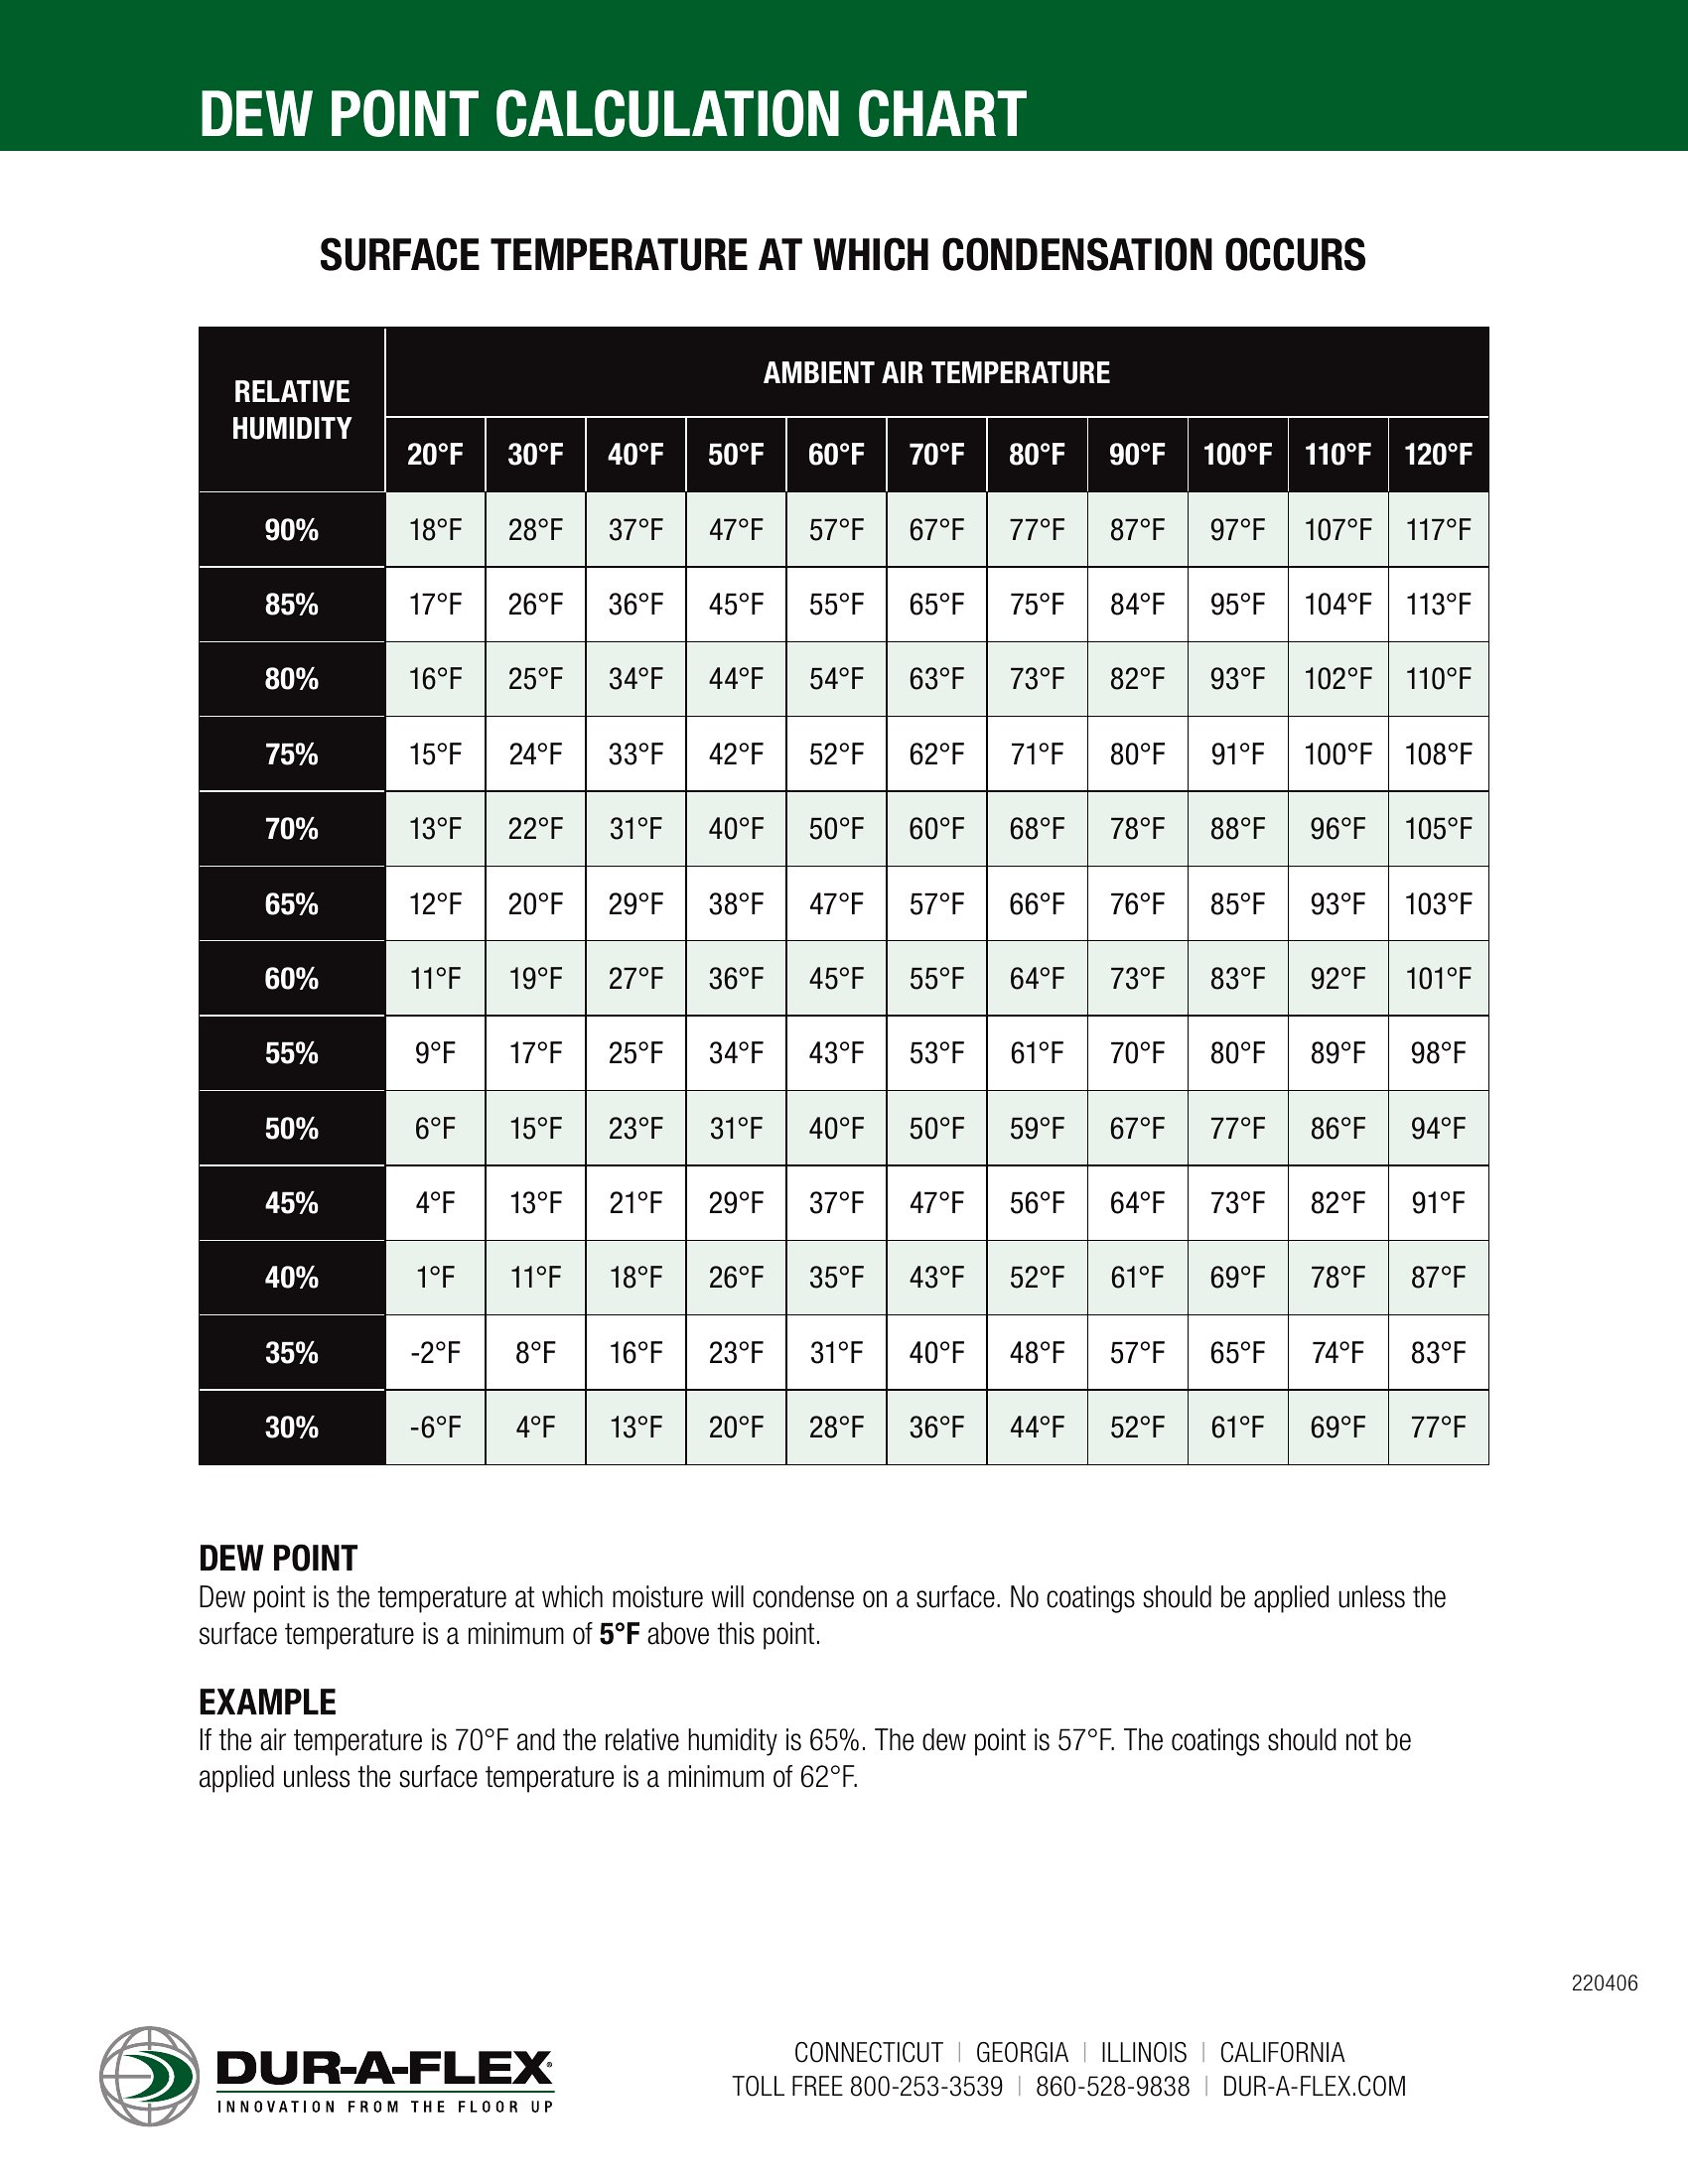
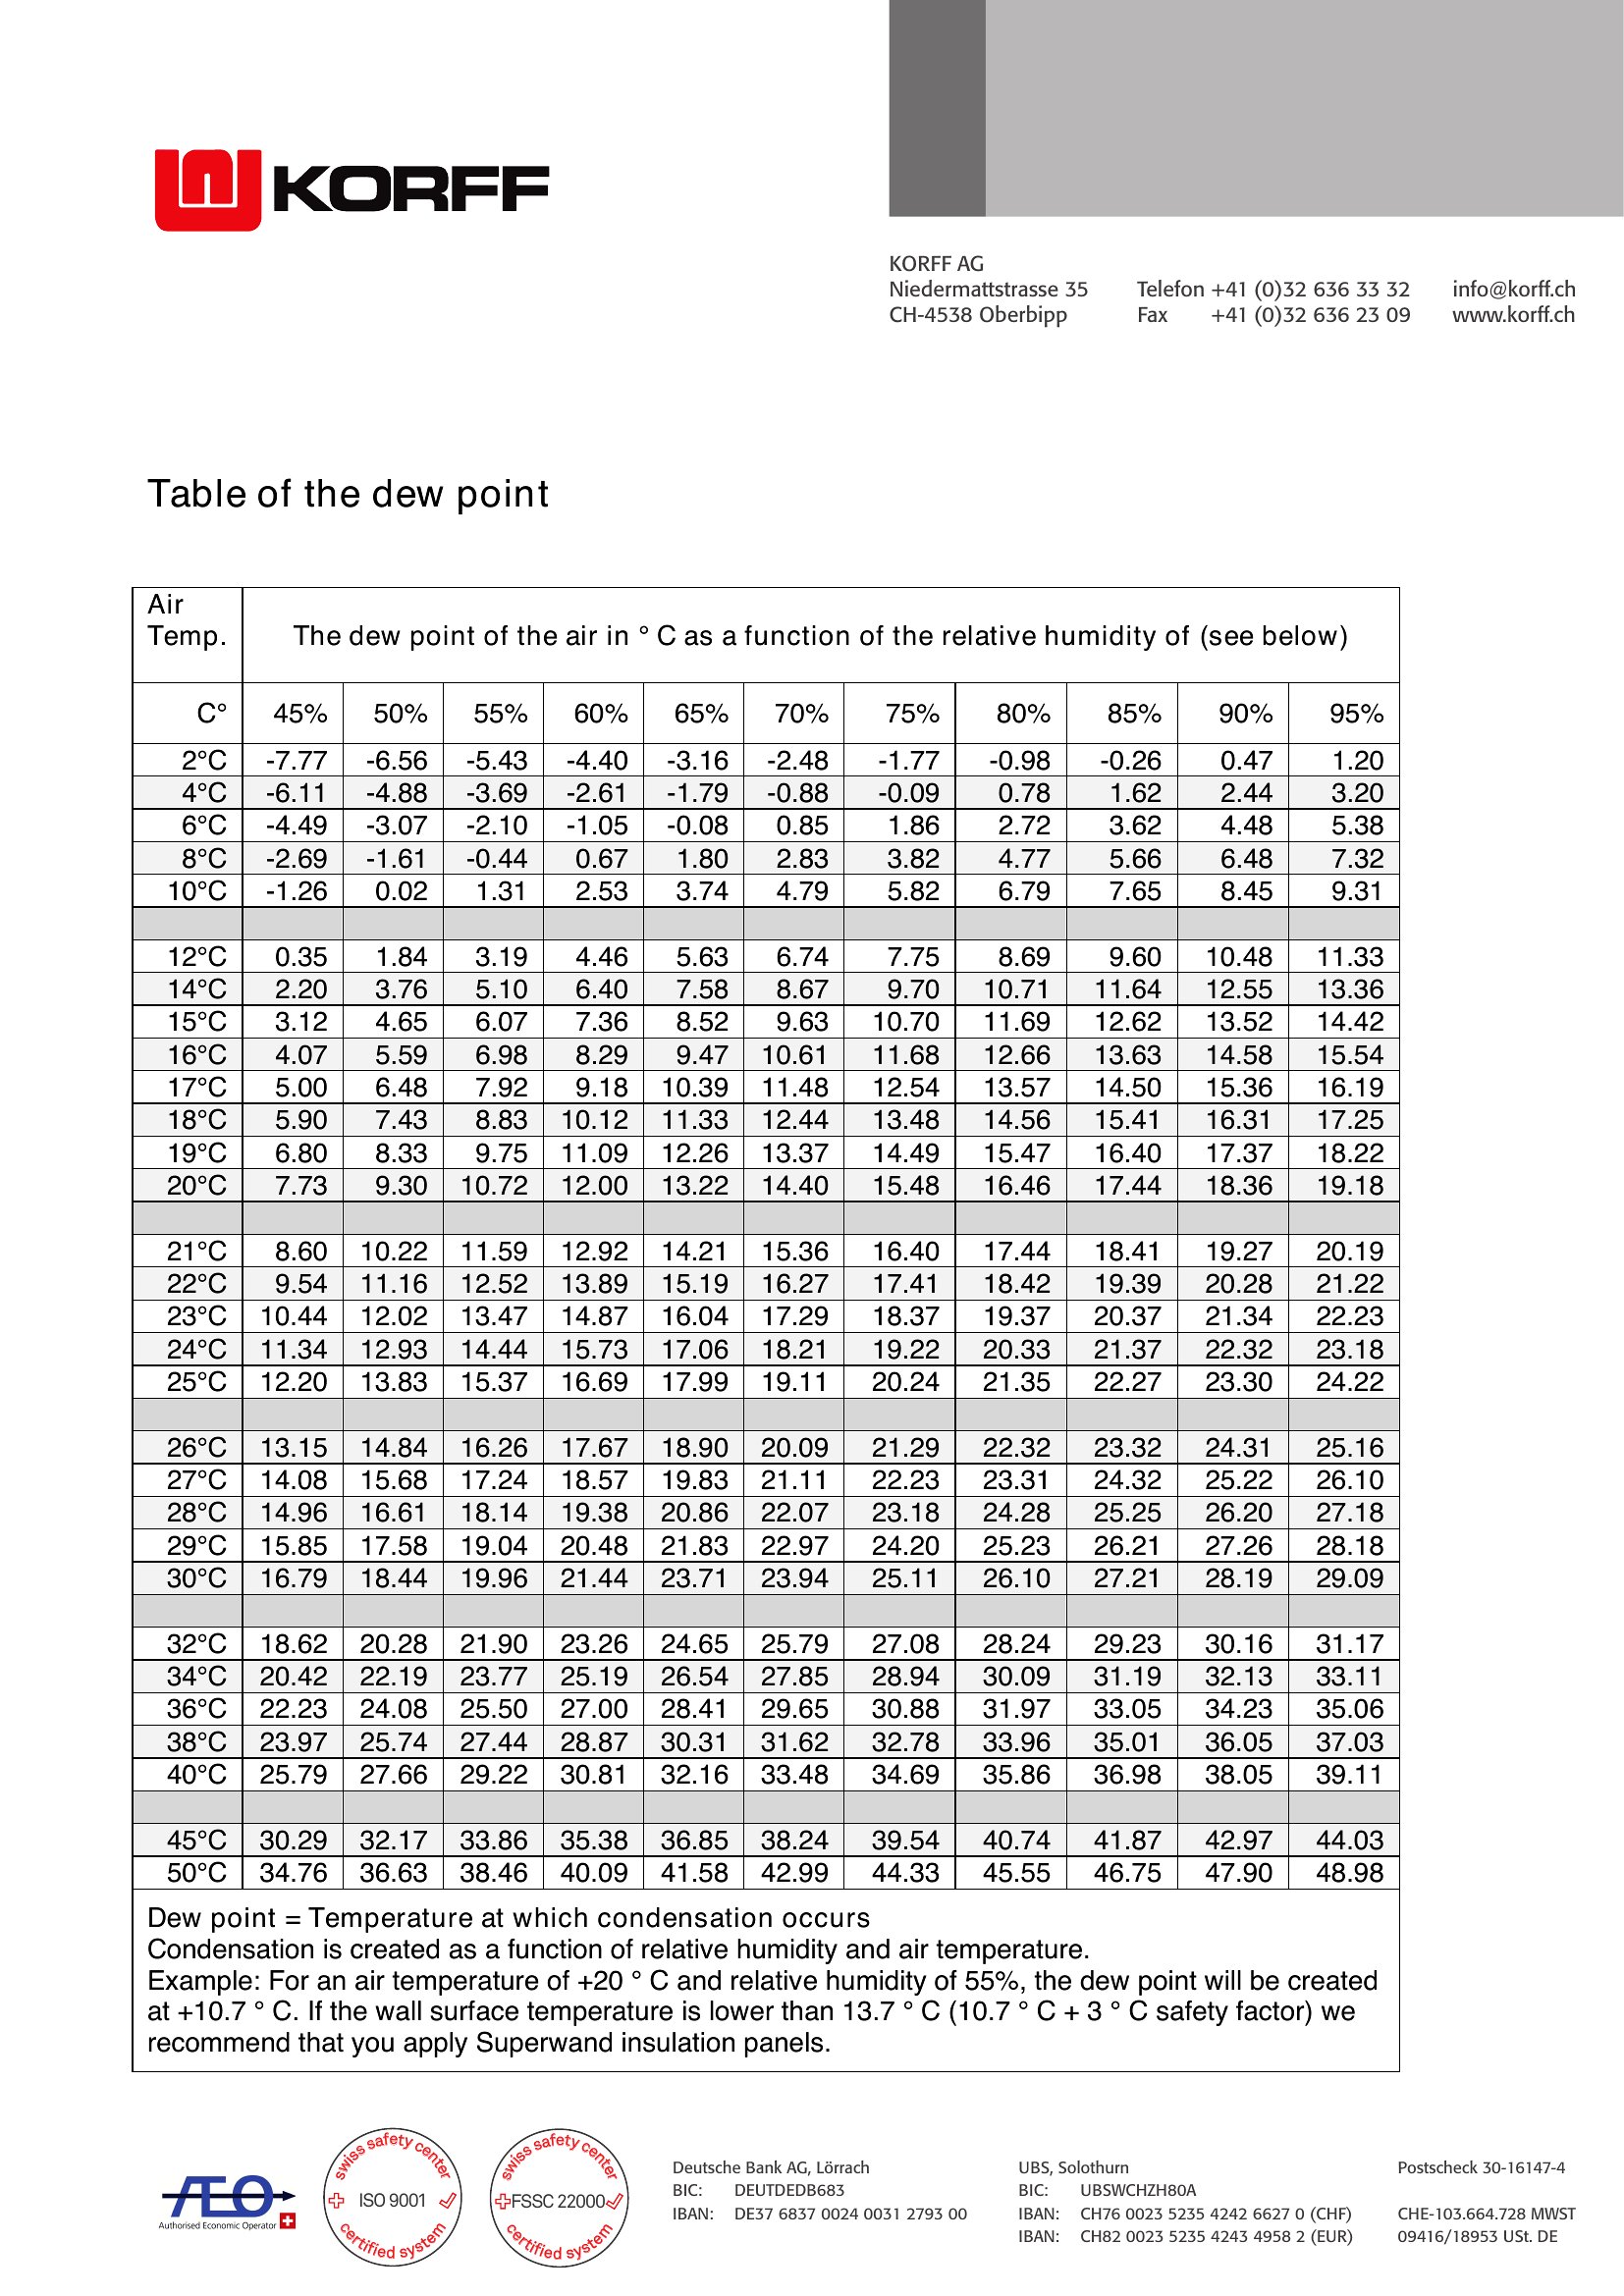
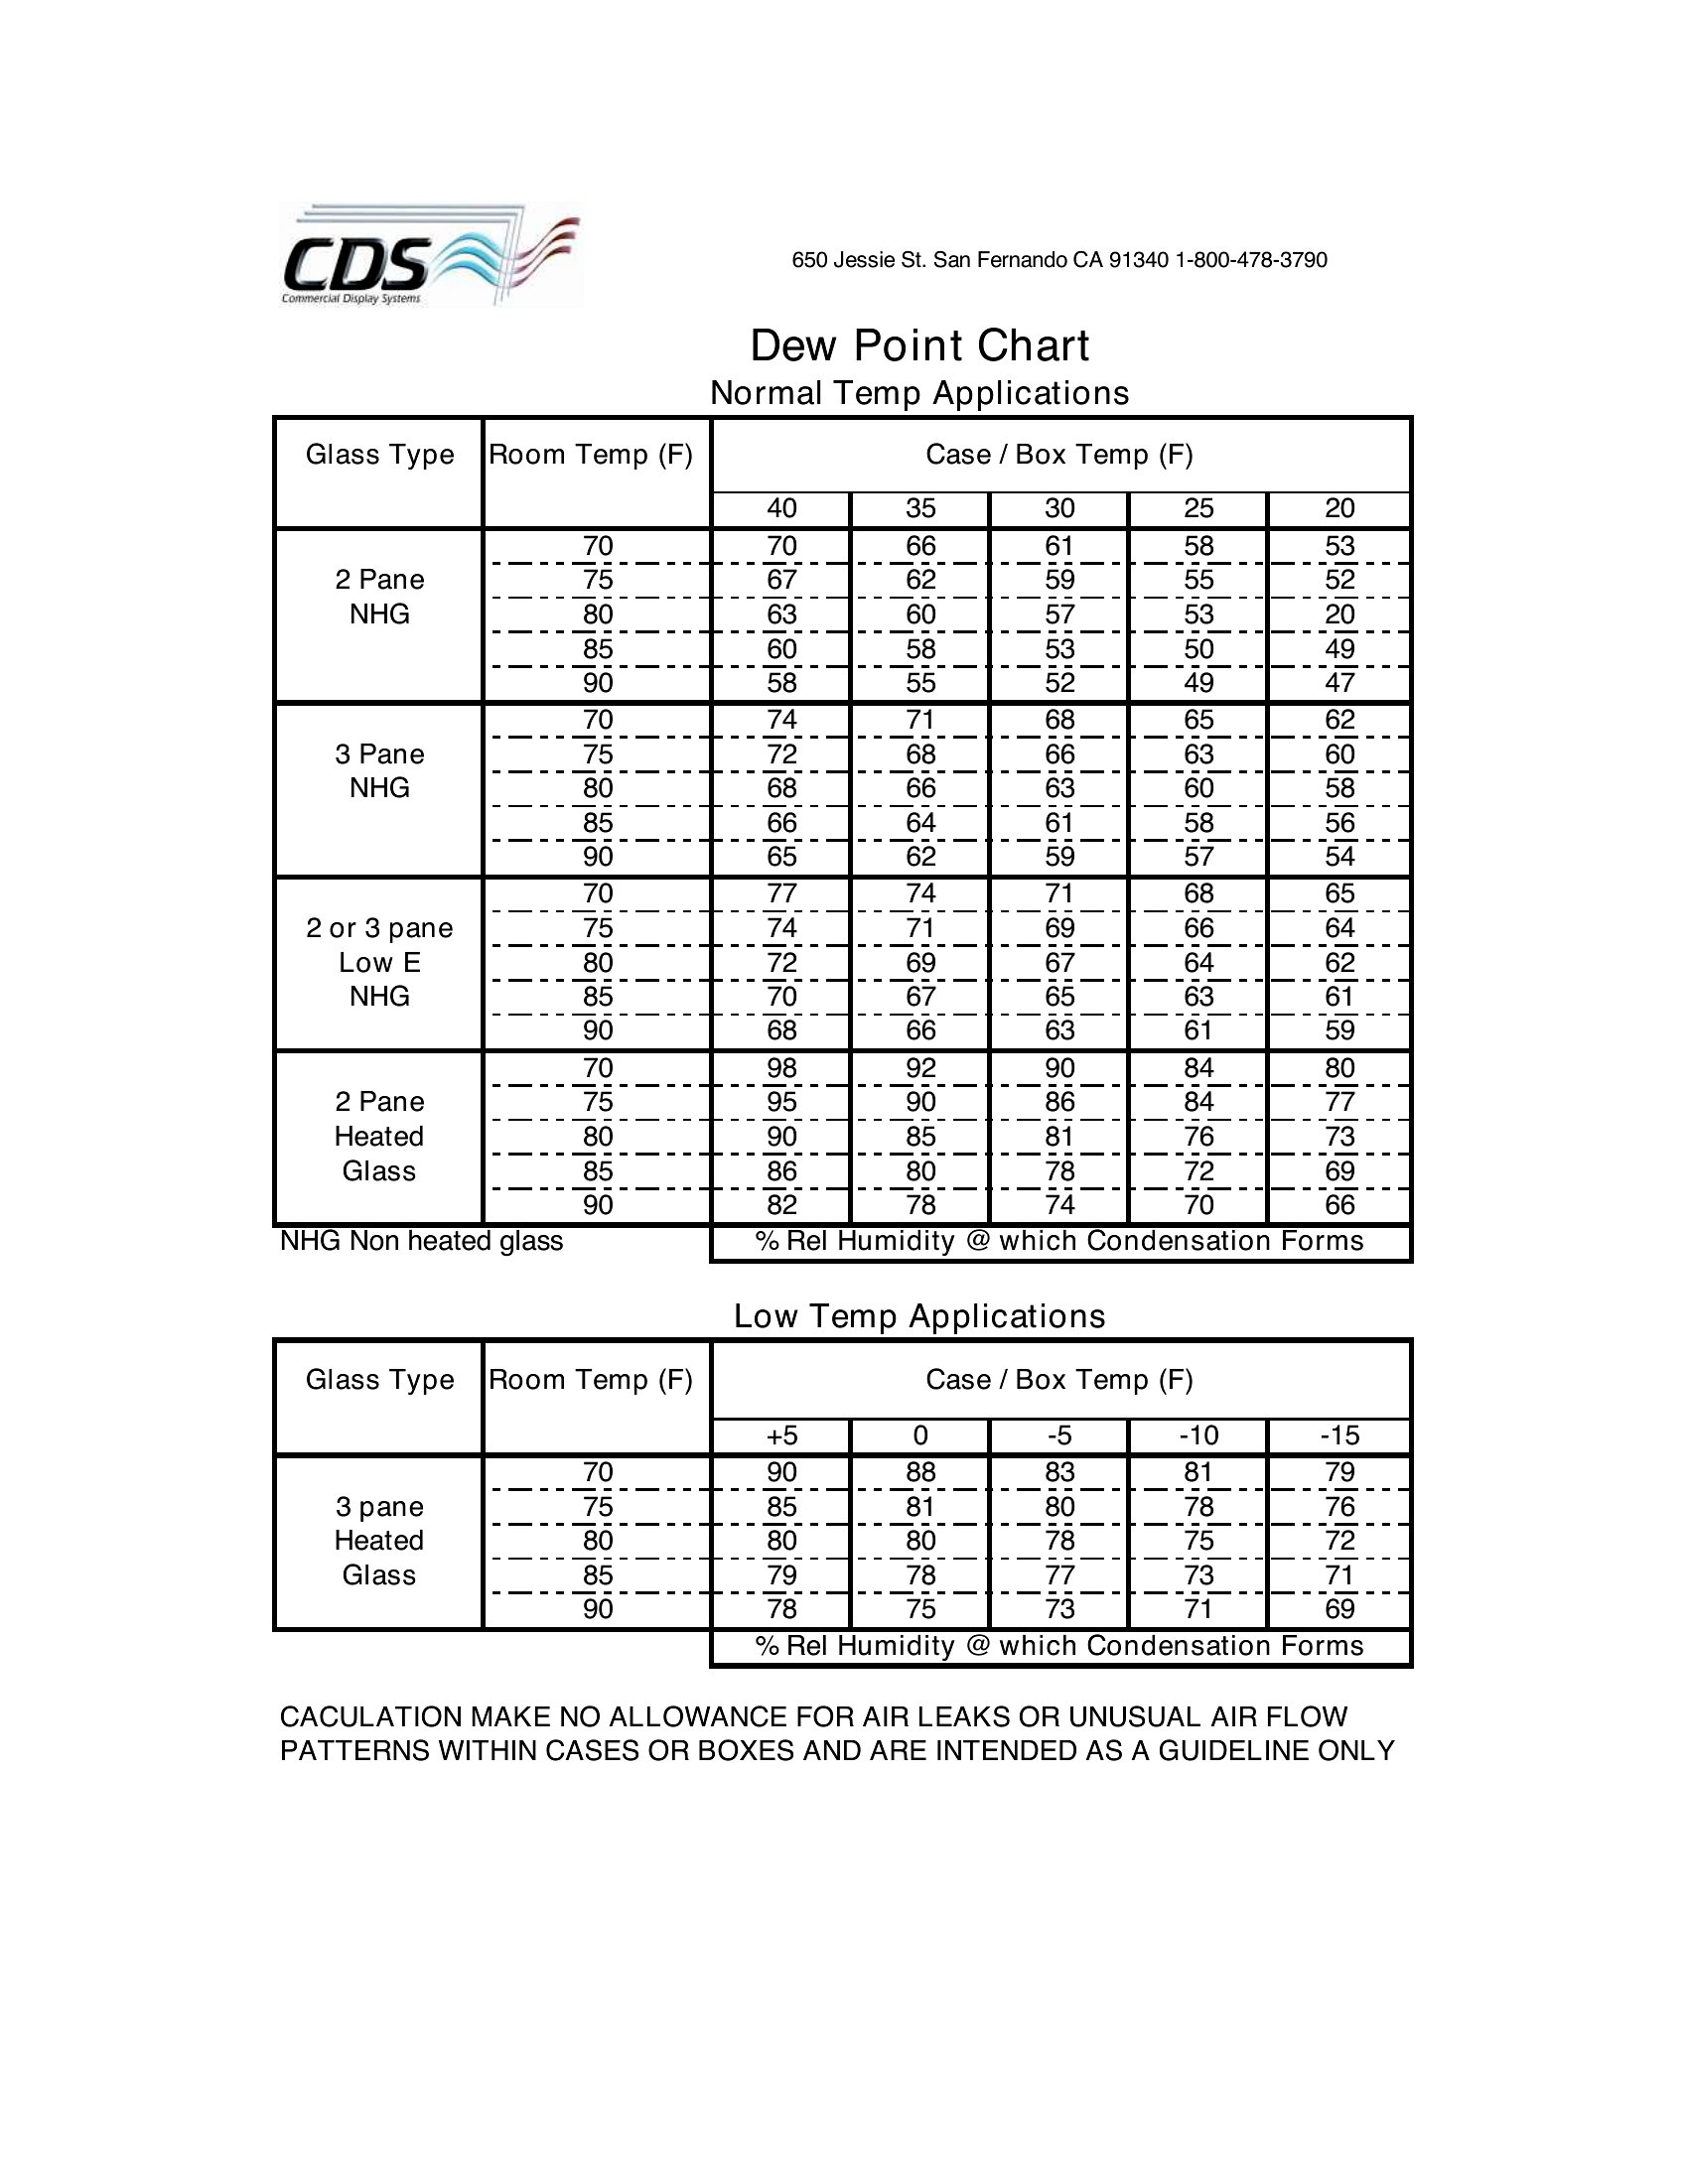
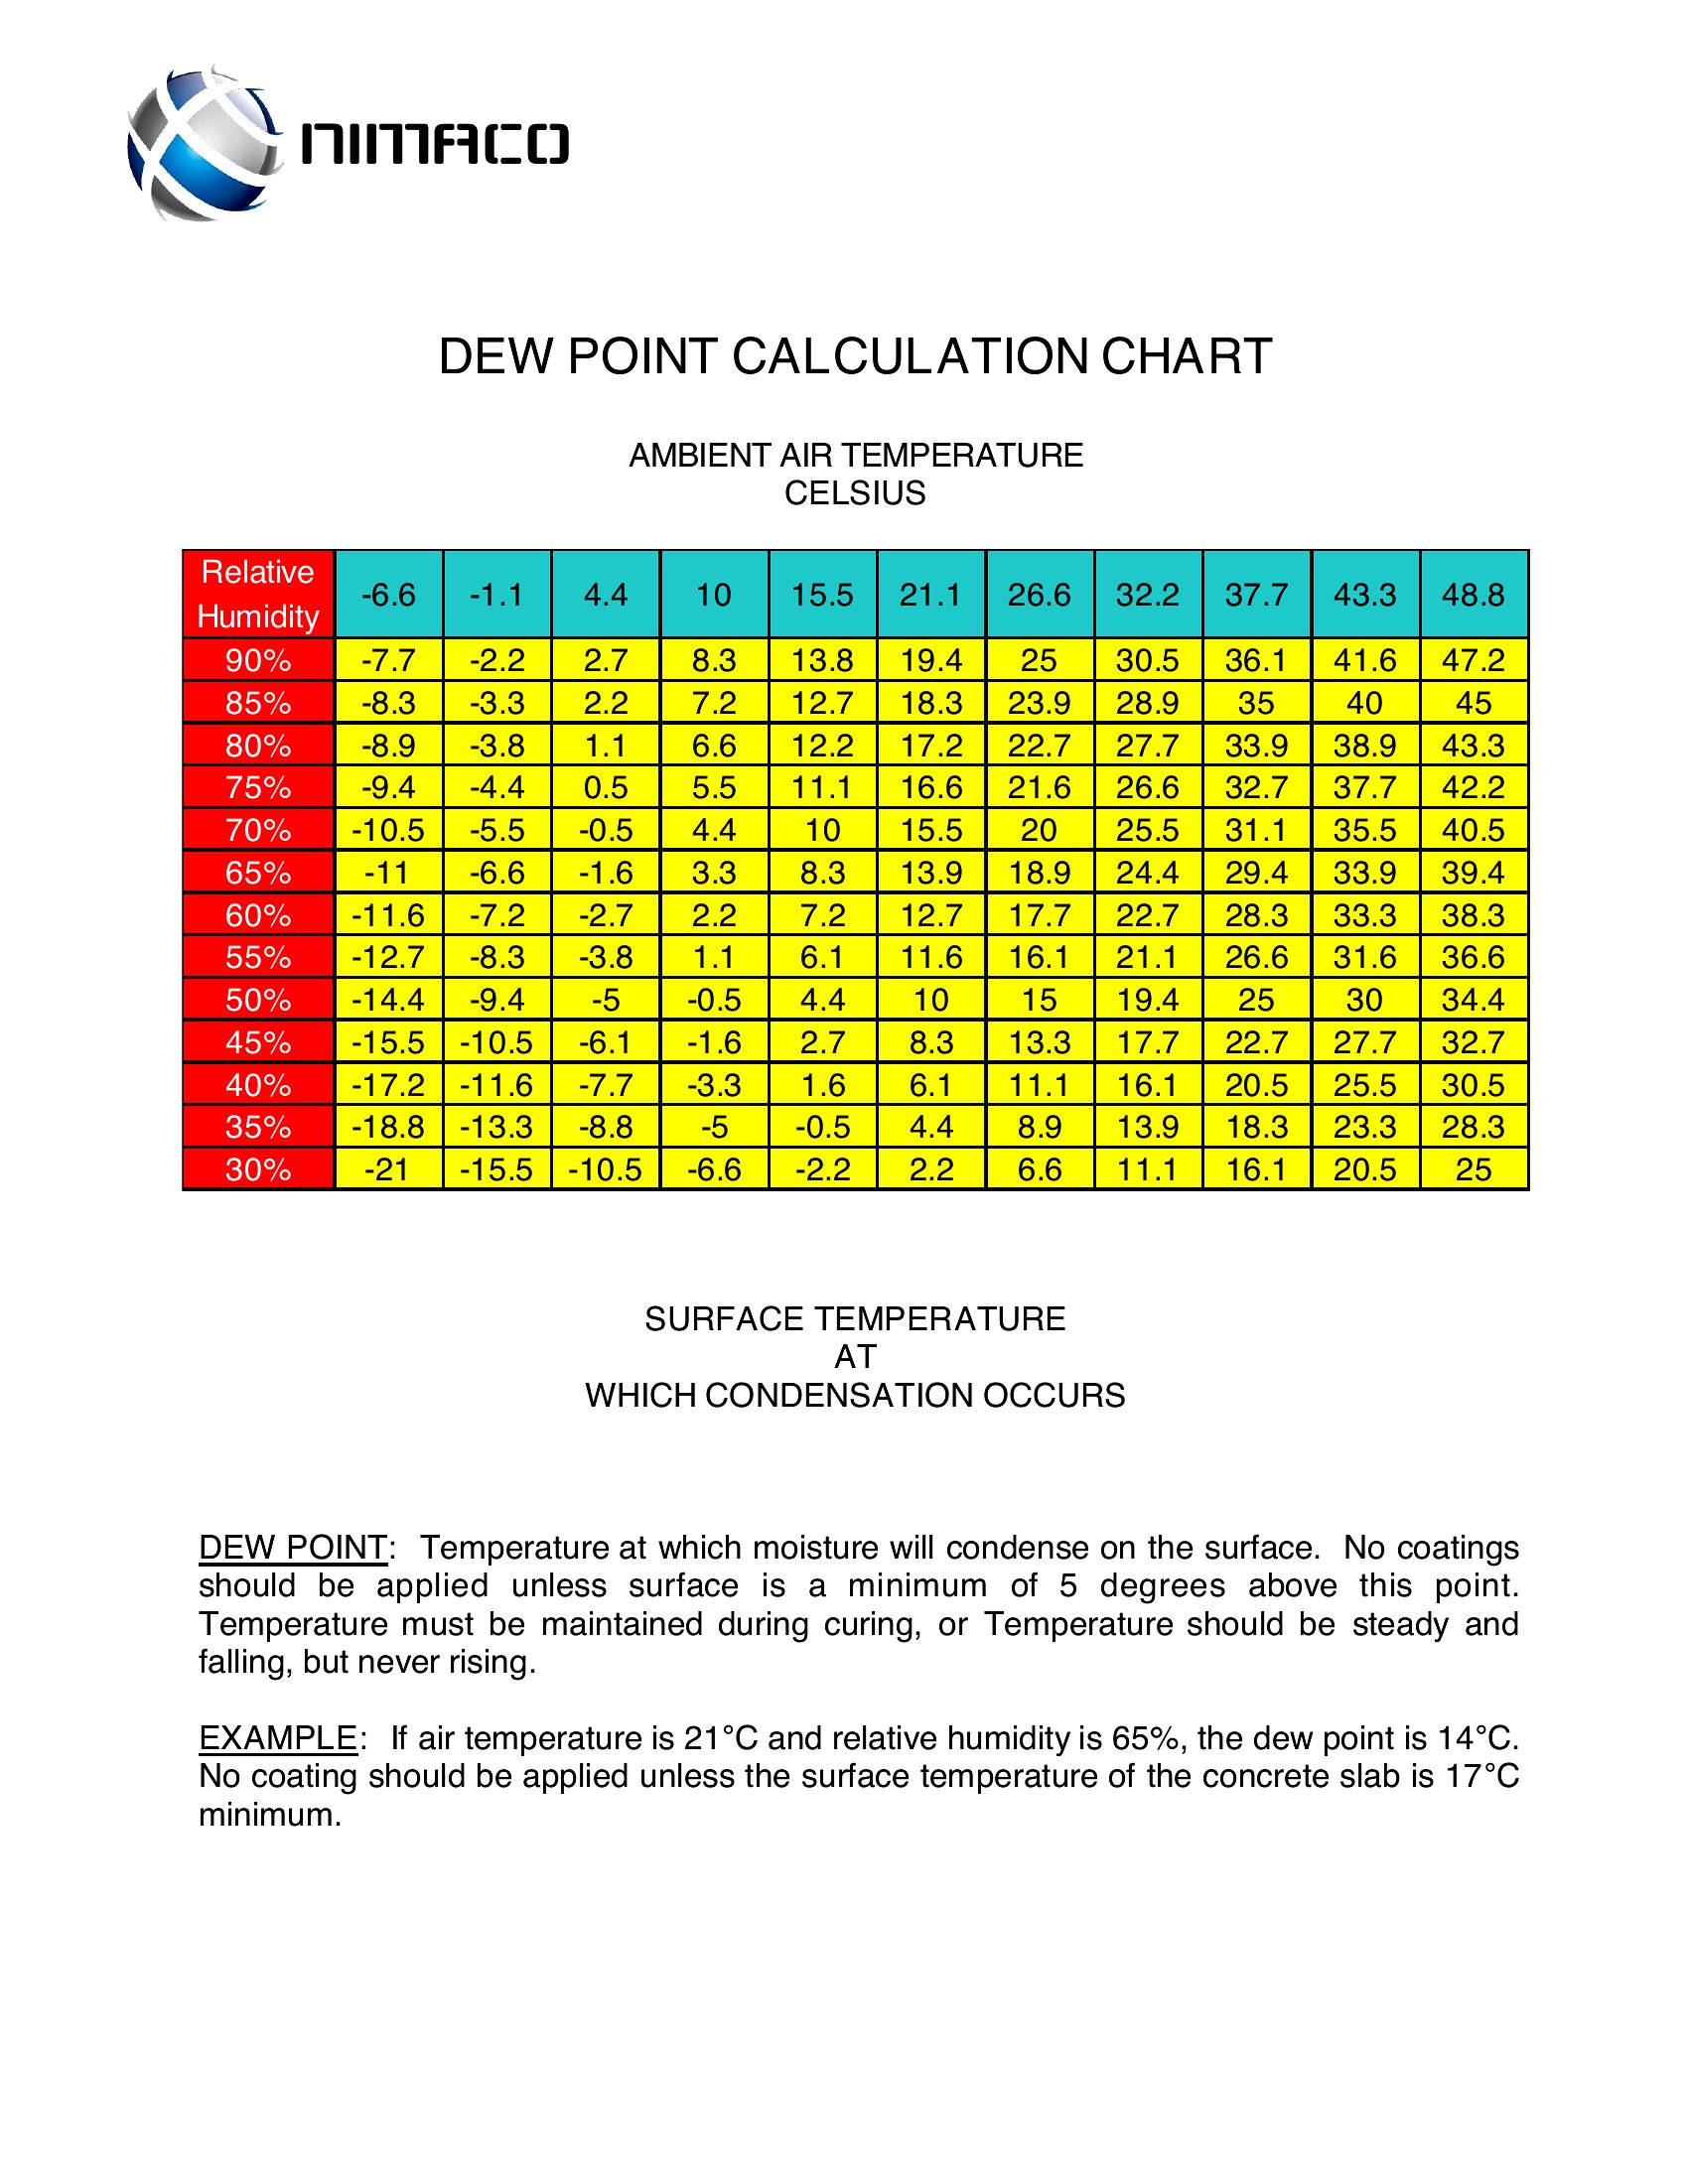
These charts cover the standard psychrometric range (0°F to 120°F / -18°C to 49°C), which works for most global conditions. For hyper-arid or ultra-wet environments, verify readings with a digital hygrometer for precision. The charts simplify cross-checking but shouldn’t replace calibrated instruments in research or industrial settings.
Can I use these to estimate indoor humidity risks for mold prevention in older buildings?
Yes, but pair them with a thermometer and hygrometer. Note that indoor air often has lower airflow than outdoor readings, so dew points may be slightly higher than charts suggest. Use the data to spot when relative humidity nears 60%, a common tipping point for mold growth in poorly ventilated spaces.
How do I adjust for altitude if I’m working at high elevations, like in mountain facilities?
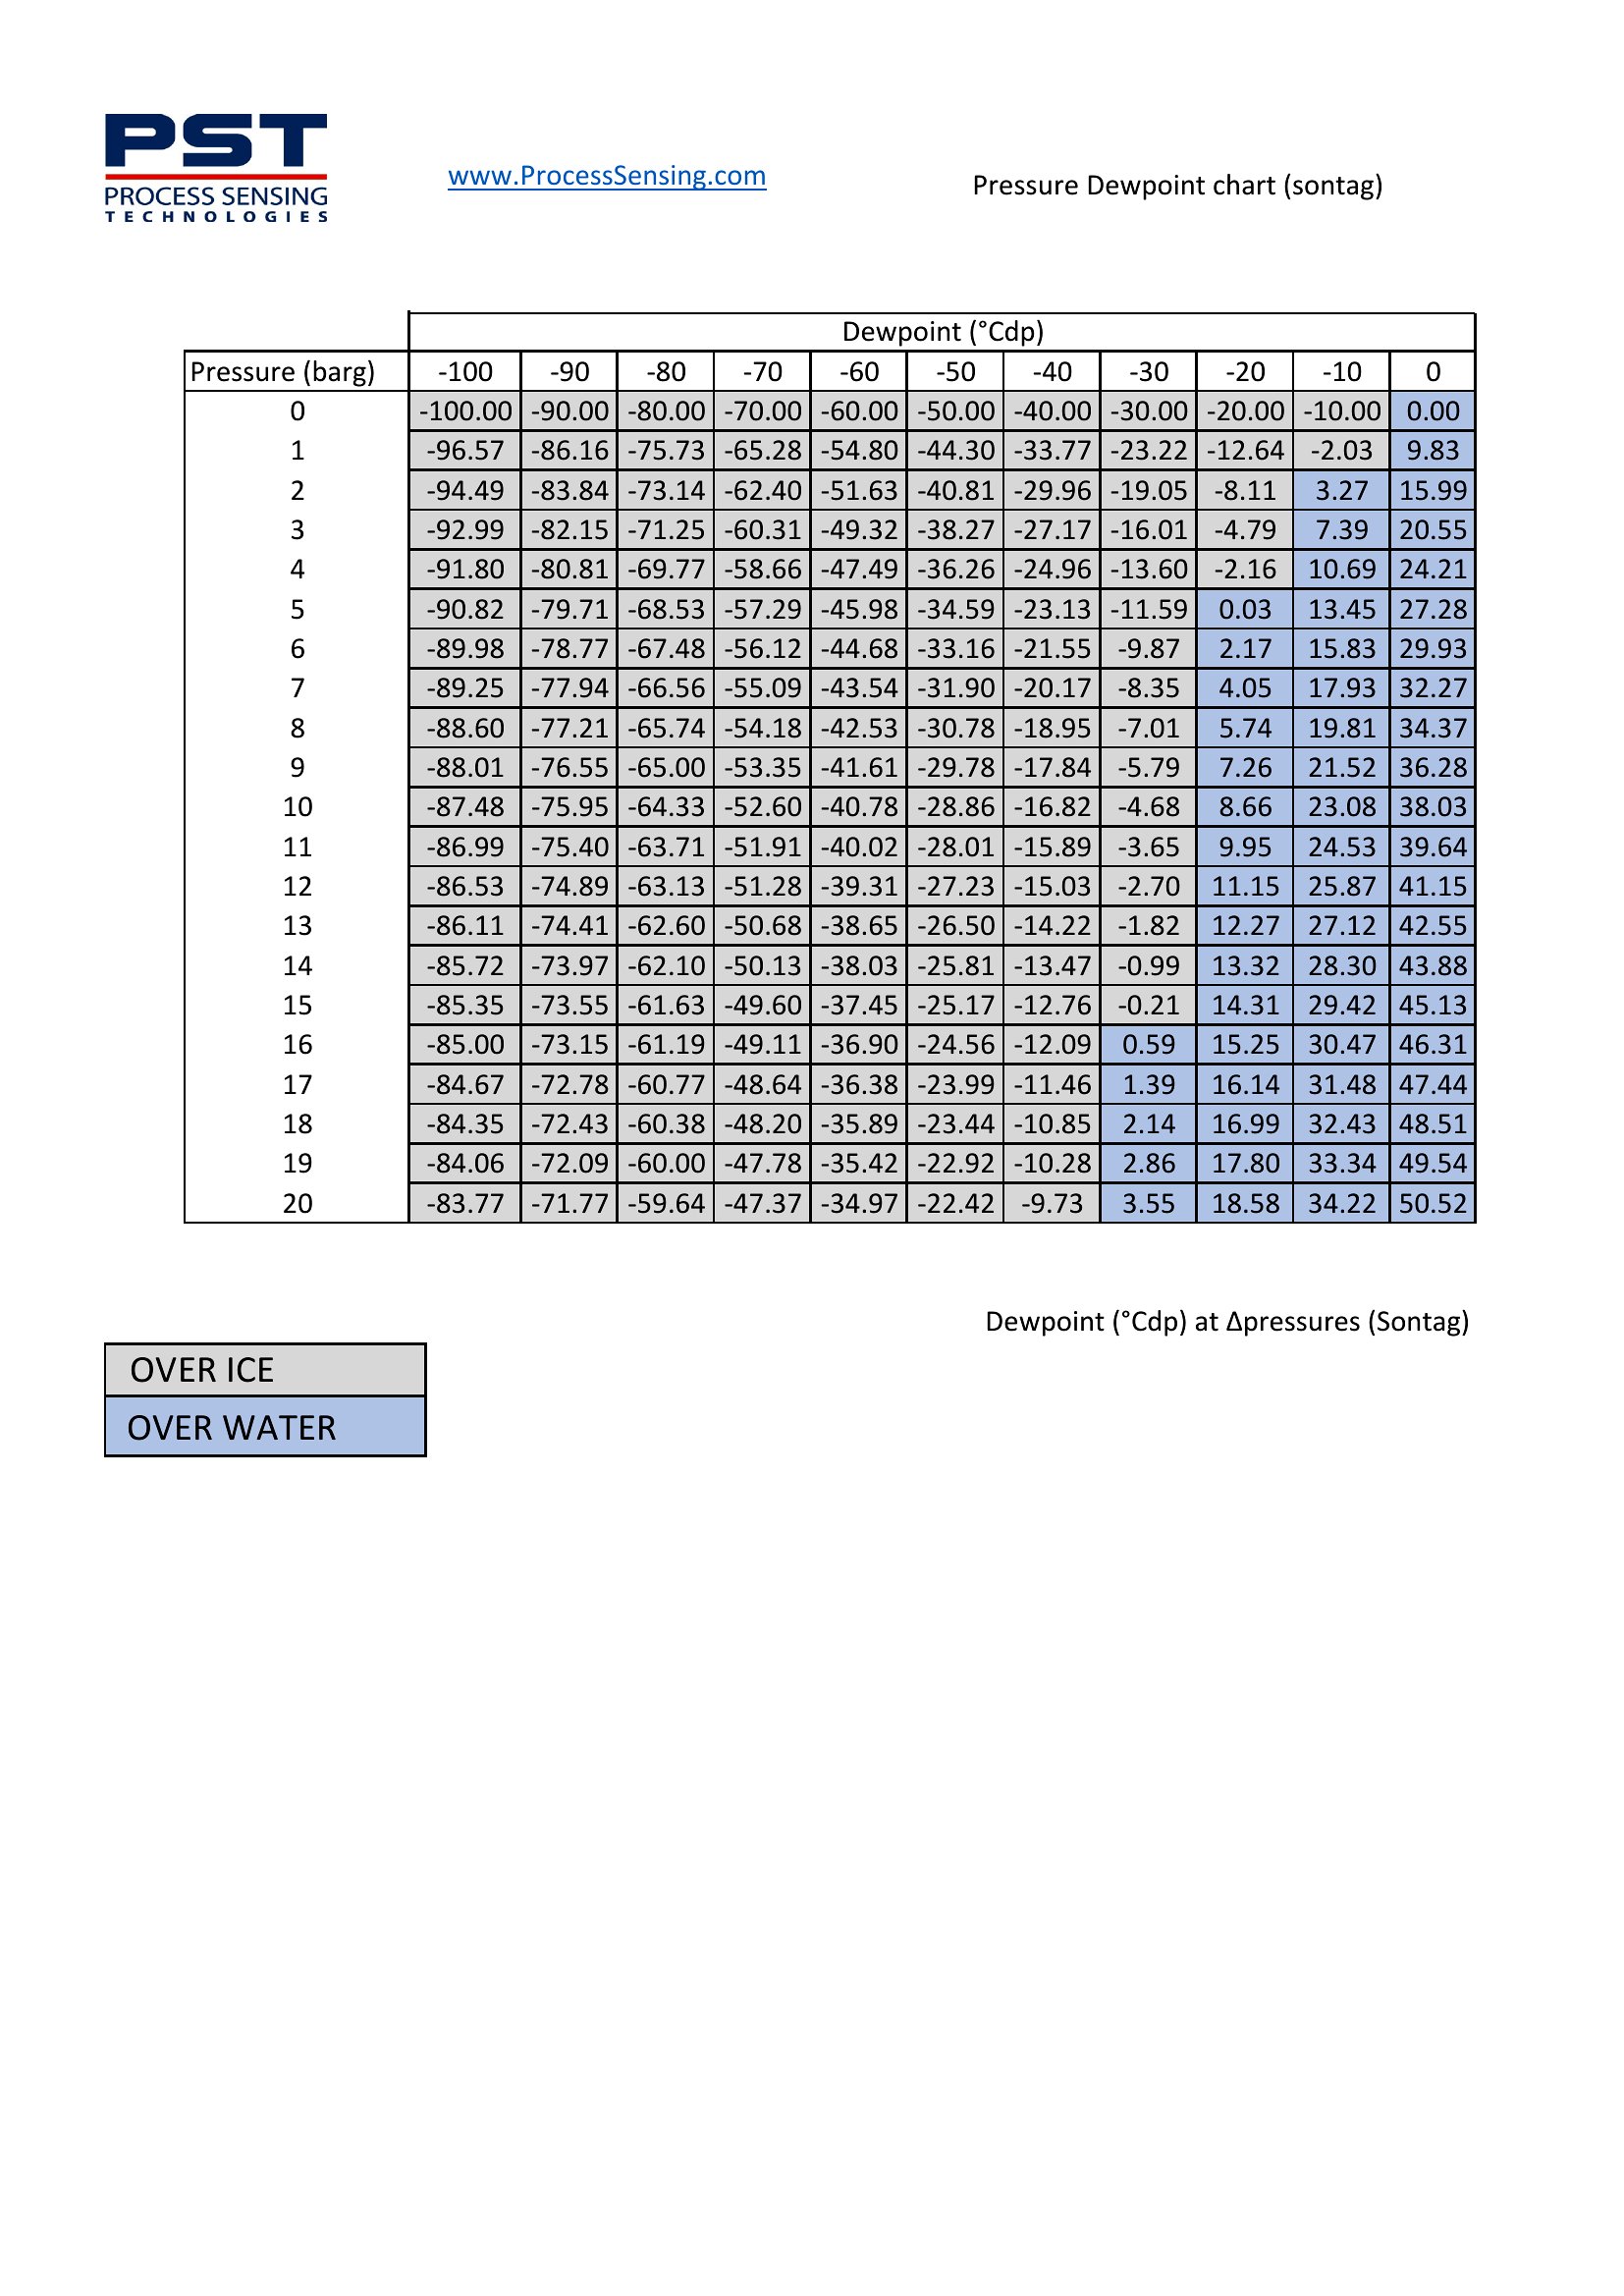
These charts assume sea-level atmospheric pressure. At elevations above 5,000 feet, dew point readings may be 2–5% lower due to reduced air density. For critical applications, consult psychrometric charts adjusted for your specific altitude or factor in a small correction downward when interpreting the values.
Comments
Join the conversation
Sign in to share your thoughts and leave a comment on this resource.