Free Sales Report Templates (Word, Excel, PDF)
AnalysisTemplates

FAQ
How can I make sure my sales report highlights key insights without overwhelming readers?
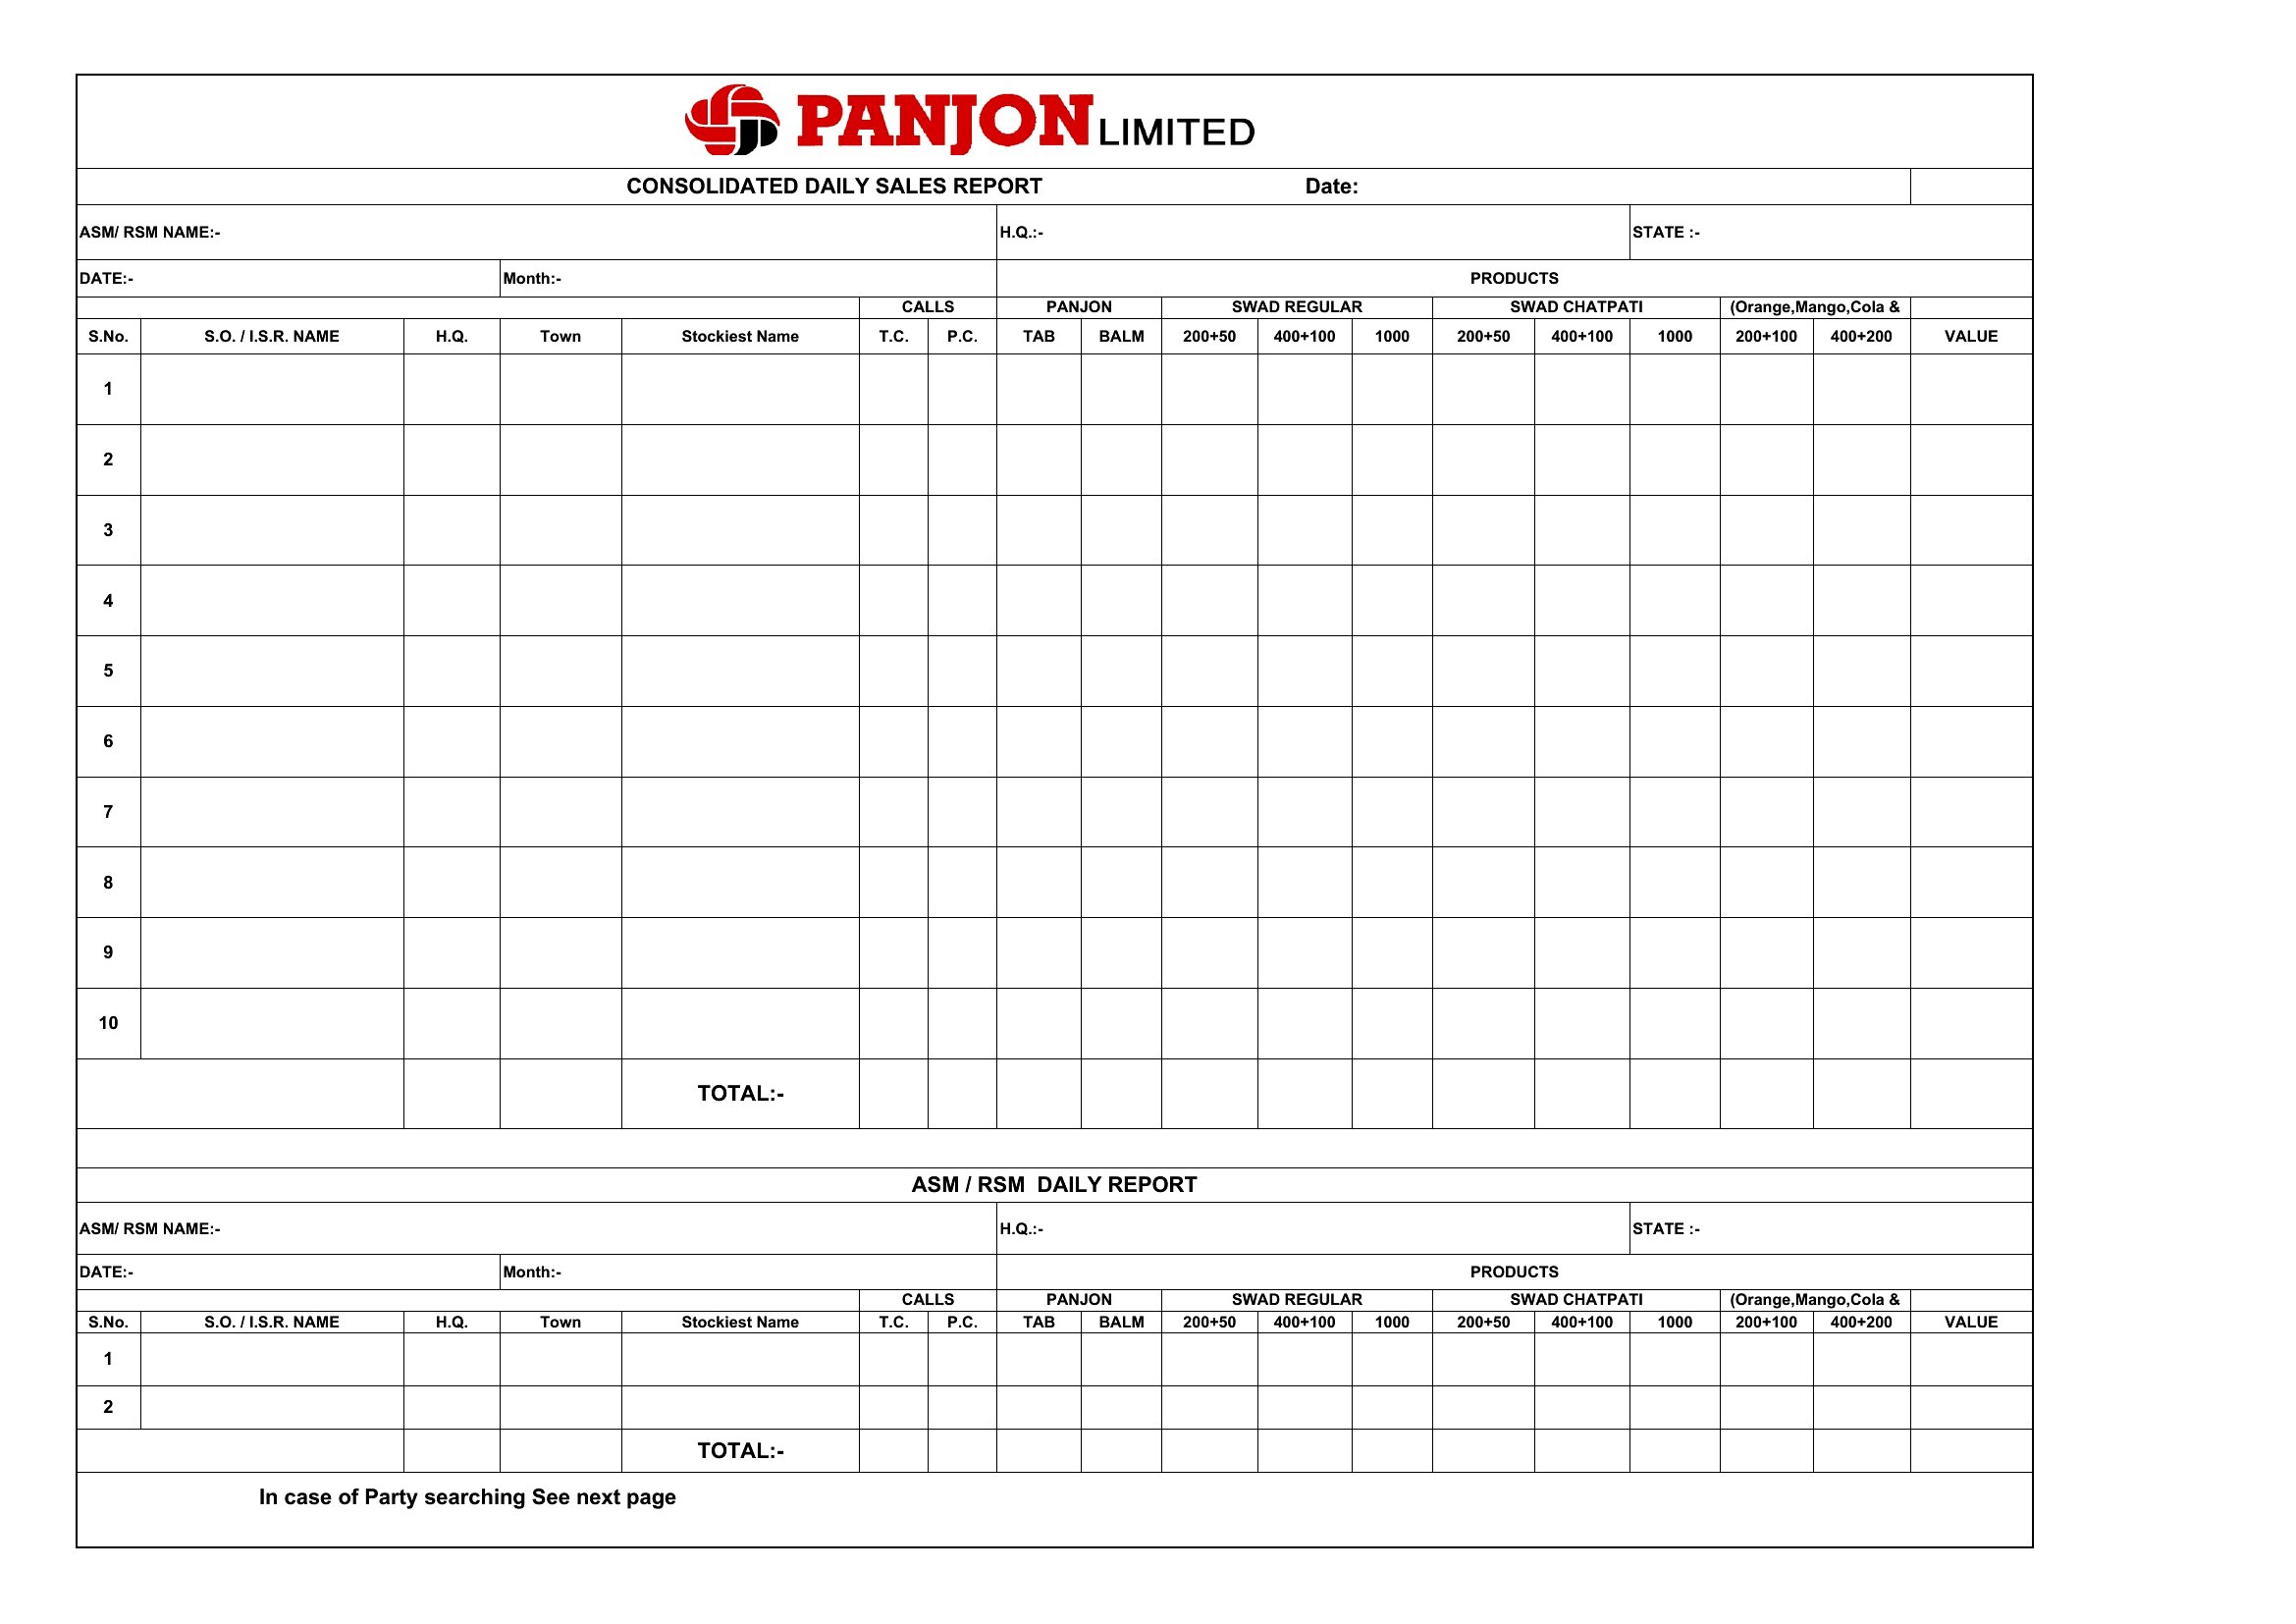
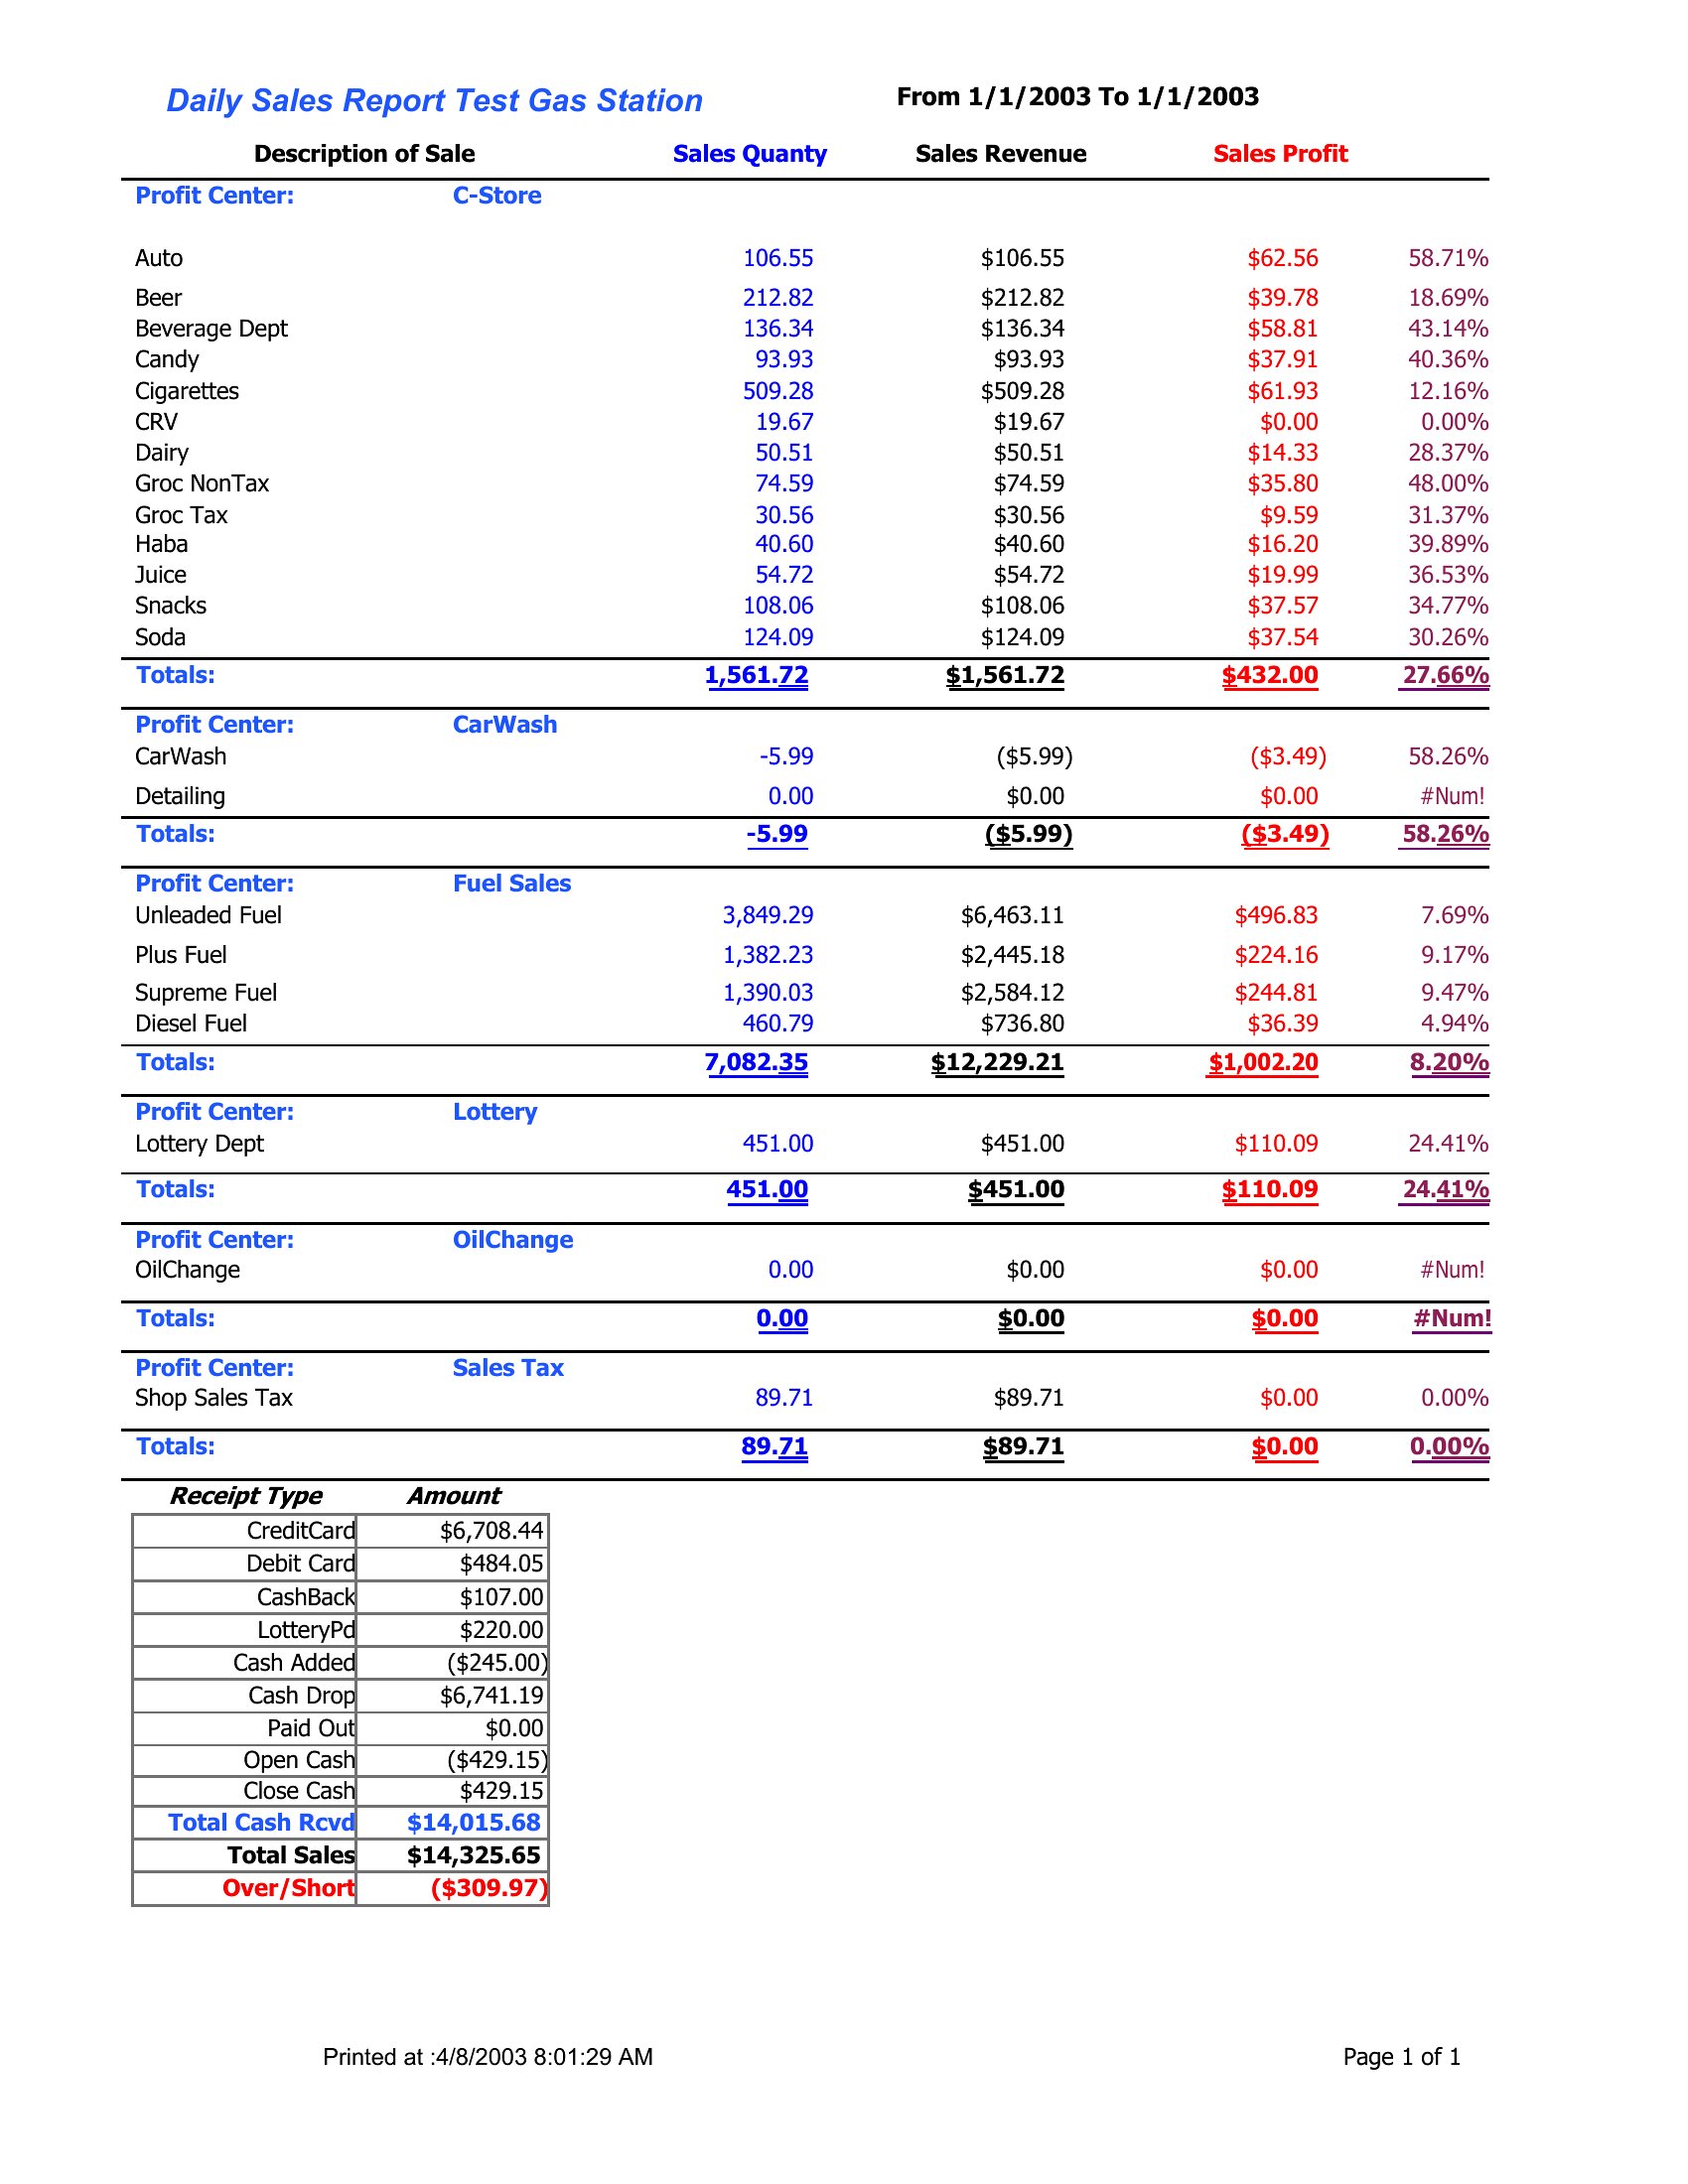
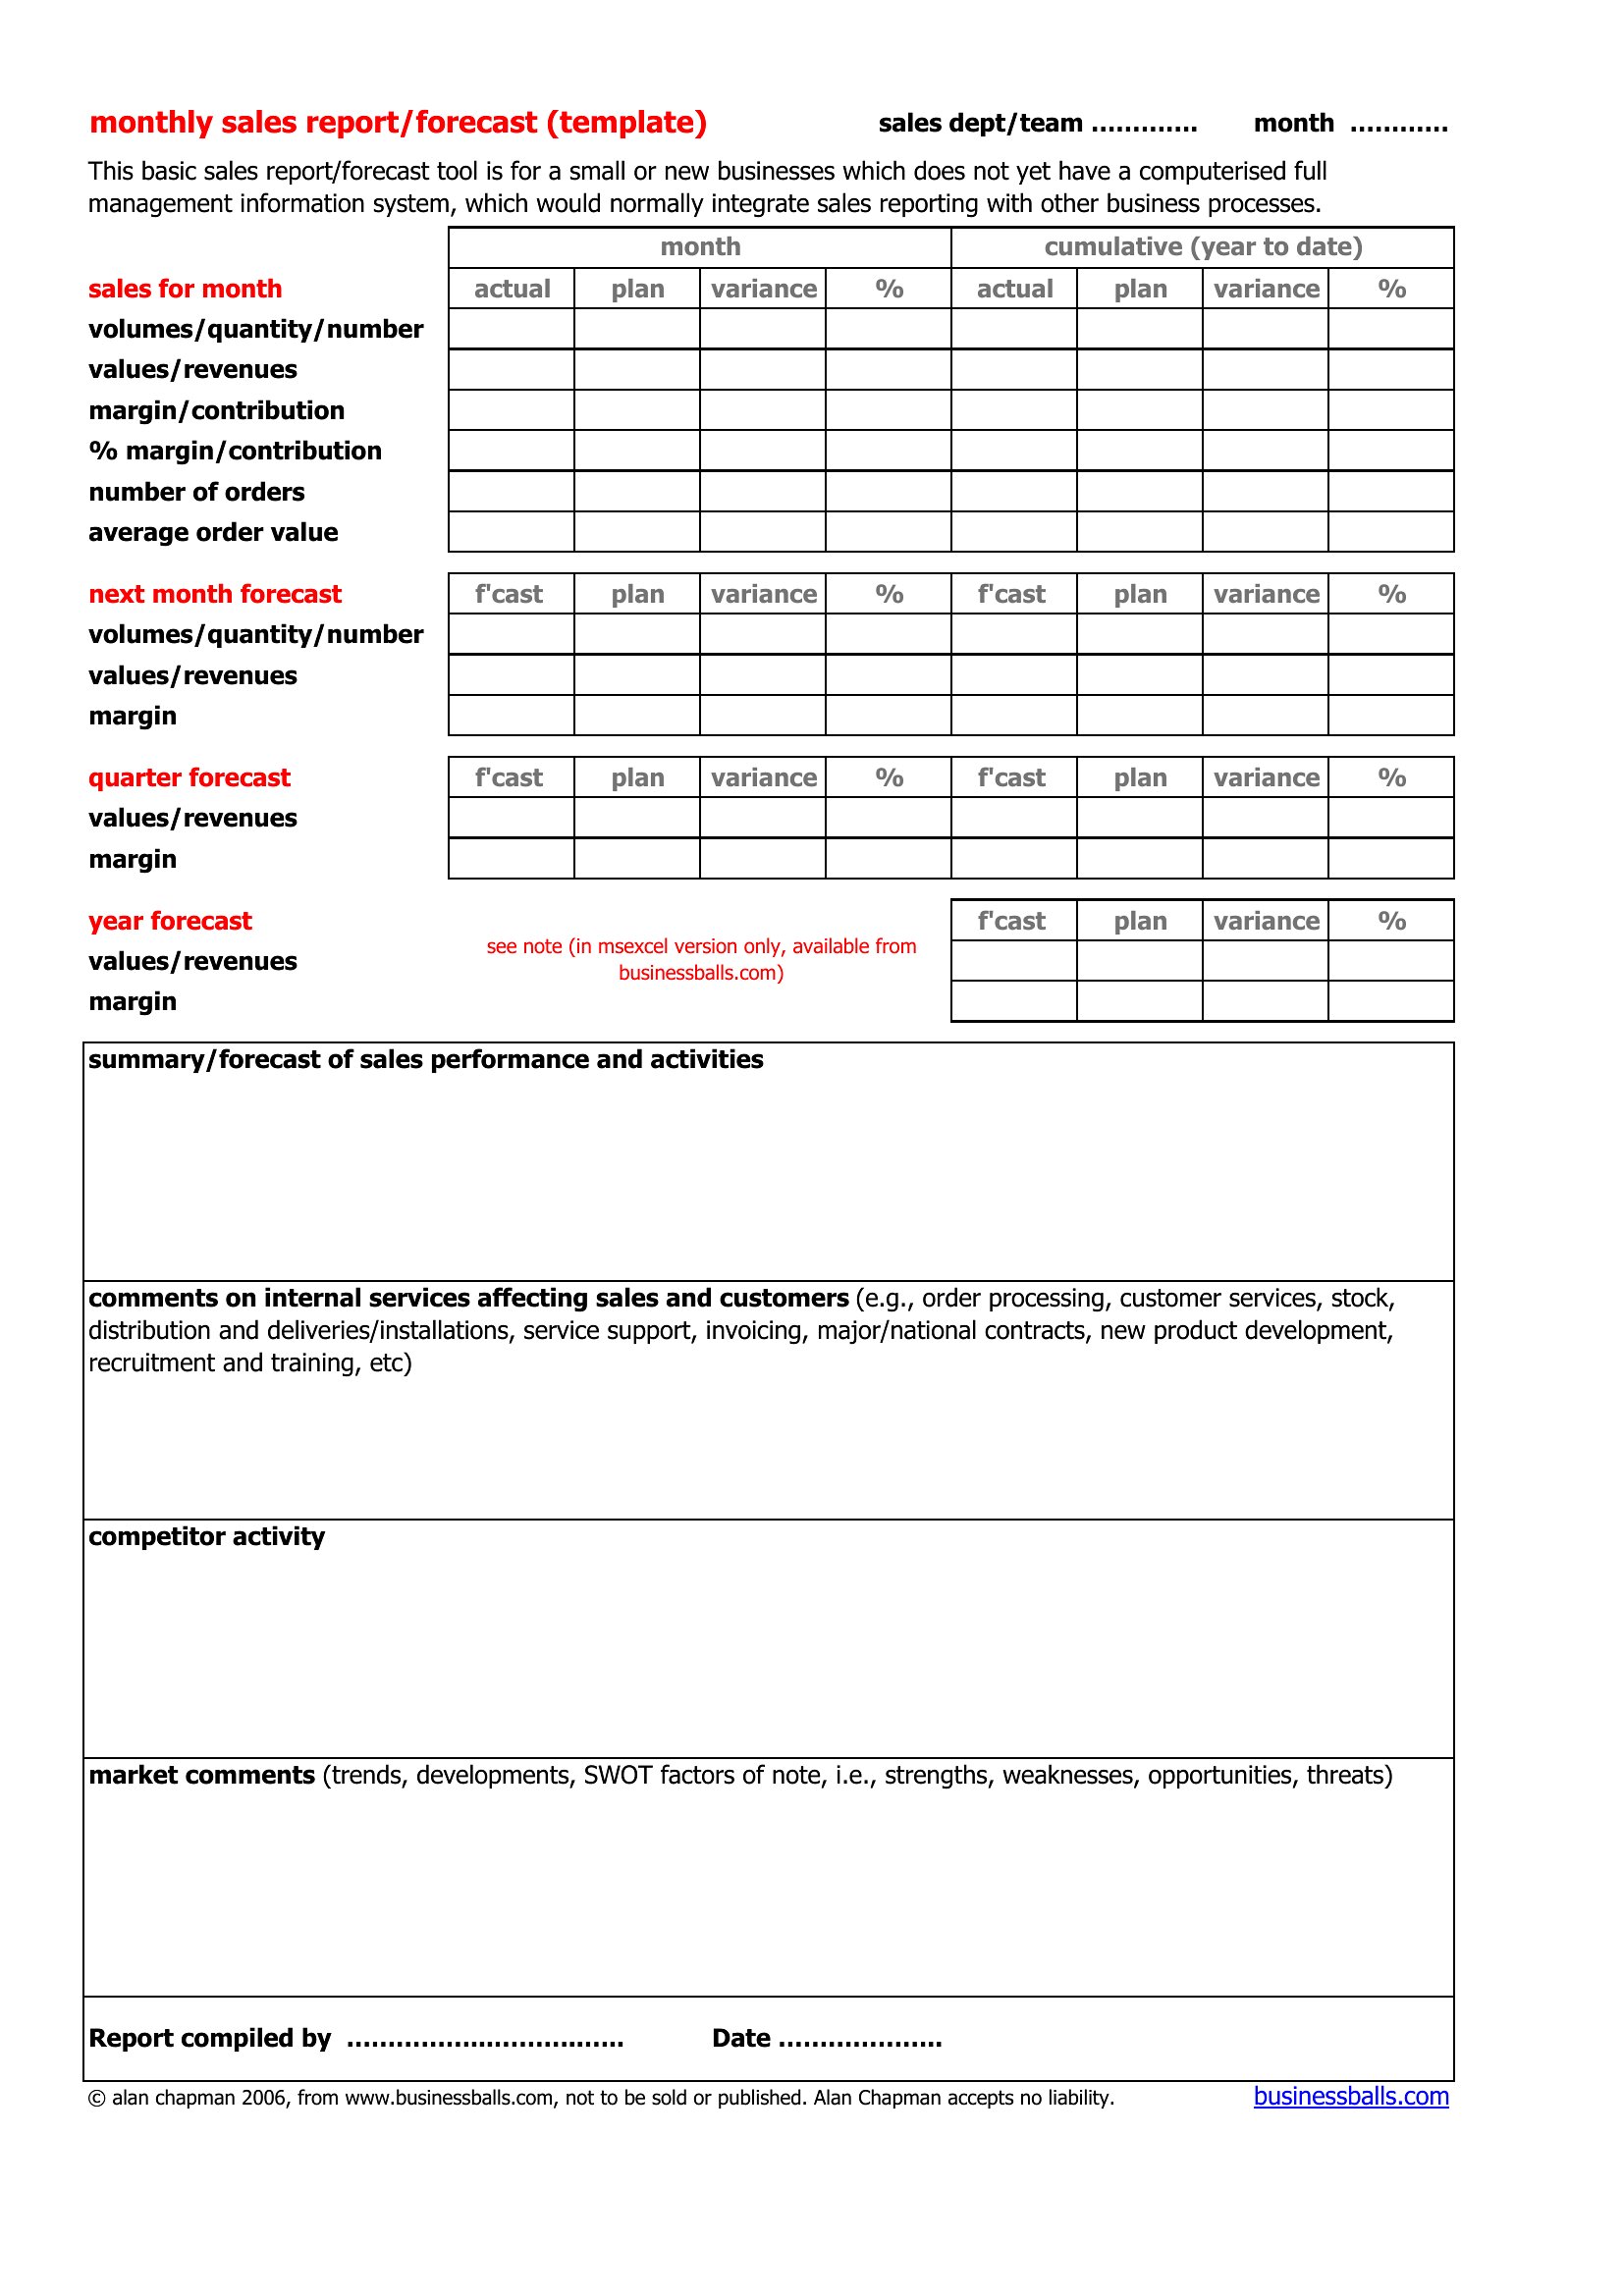
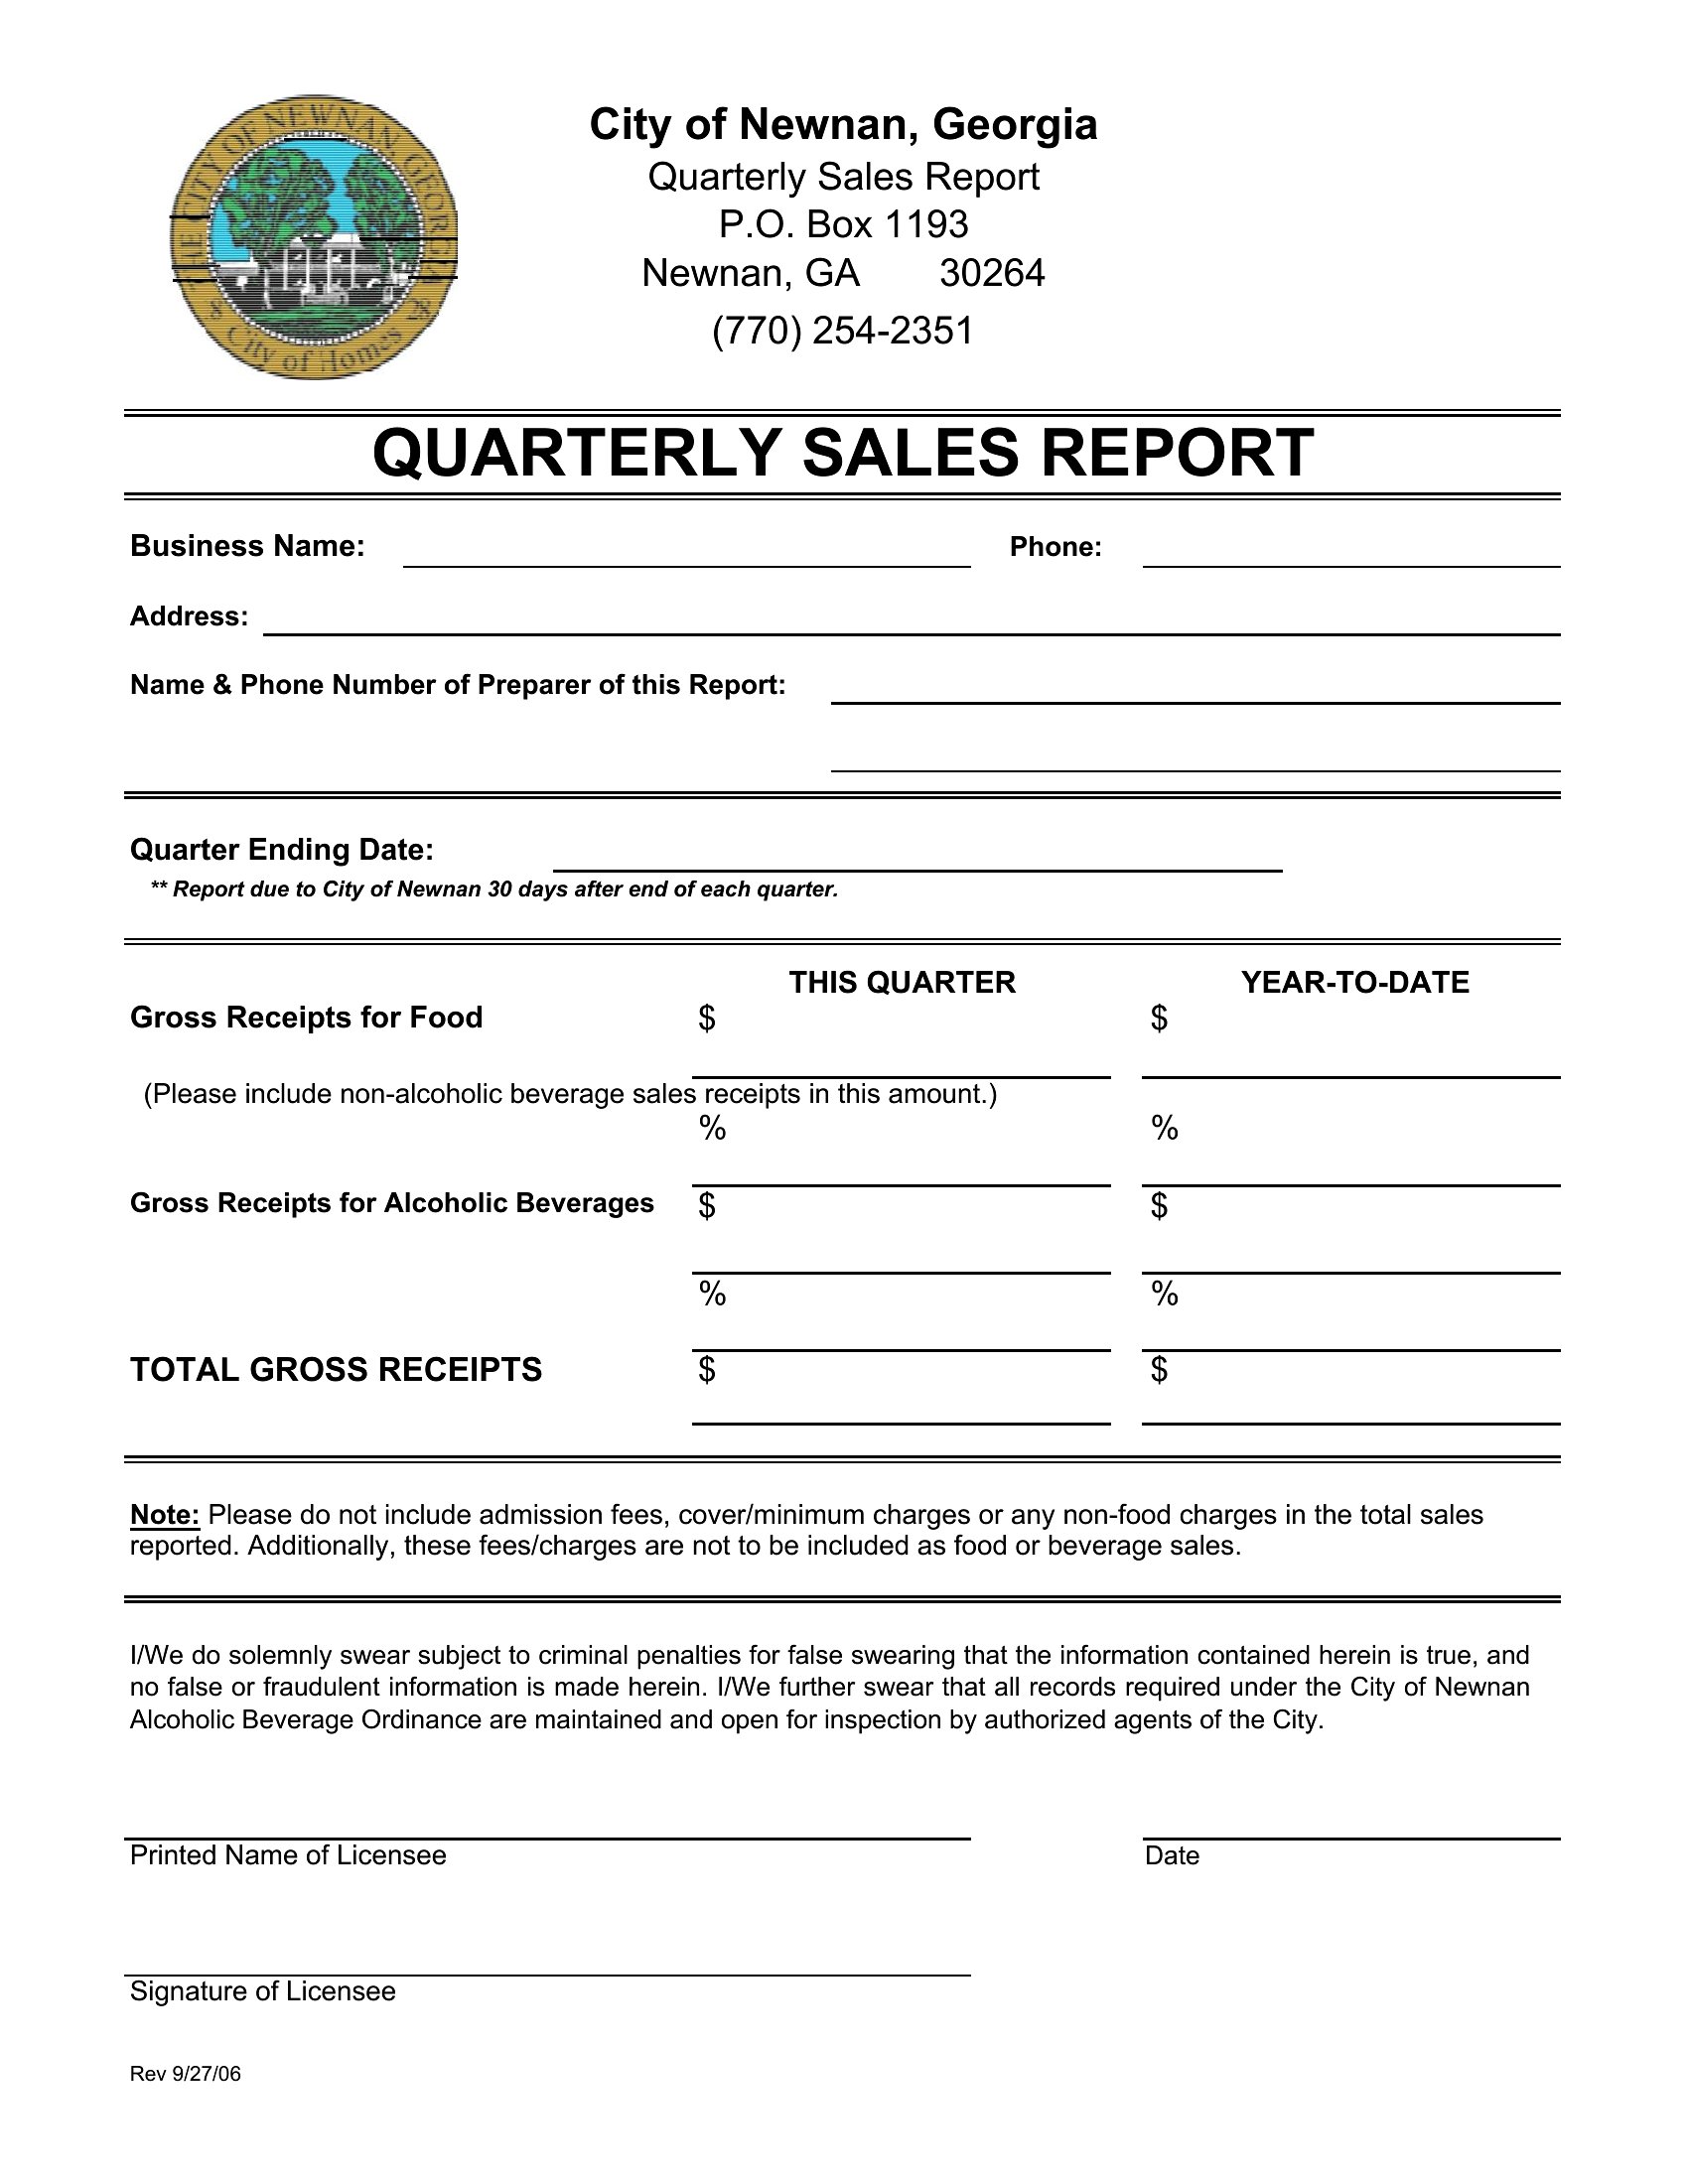
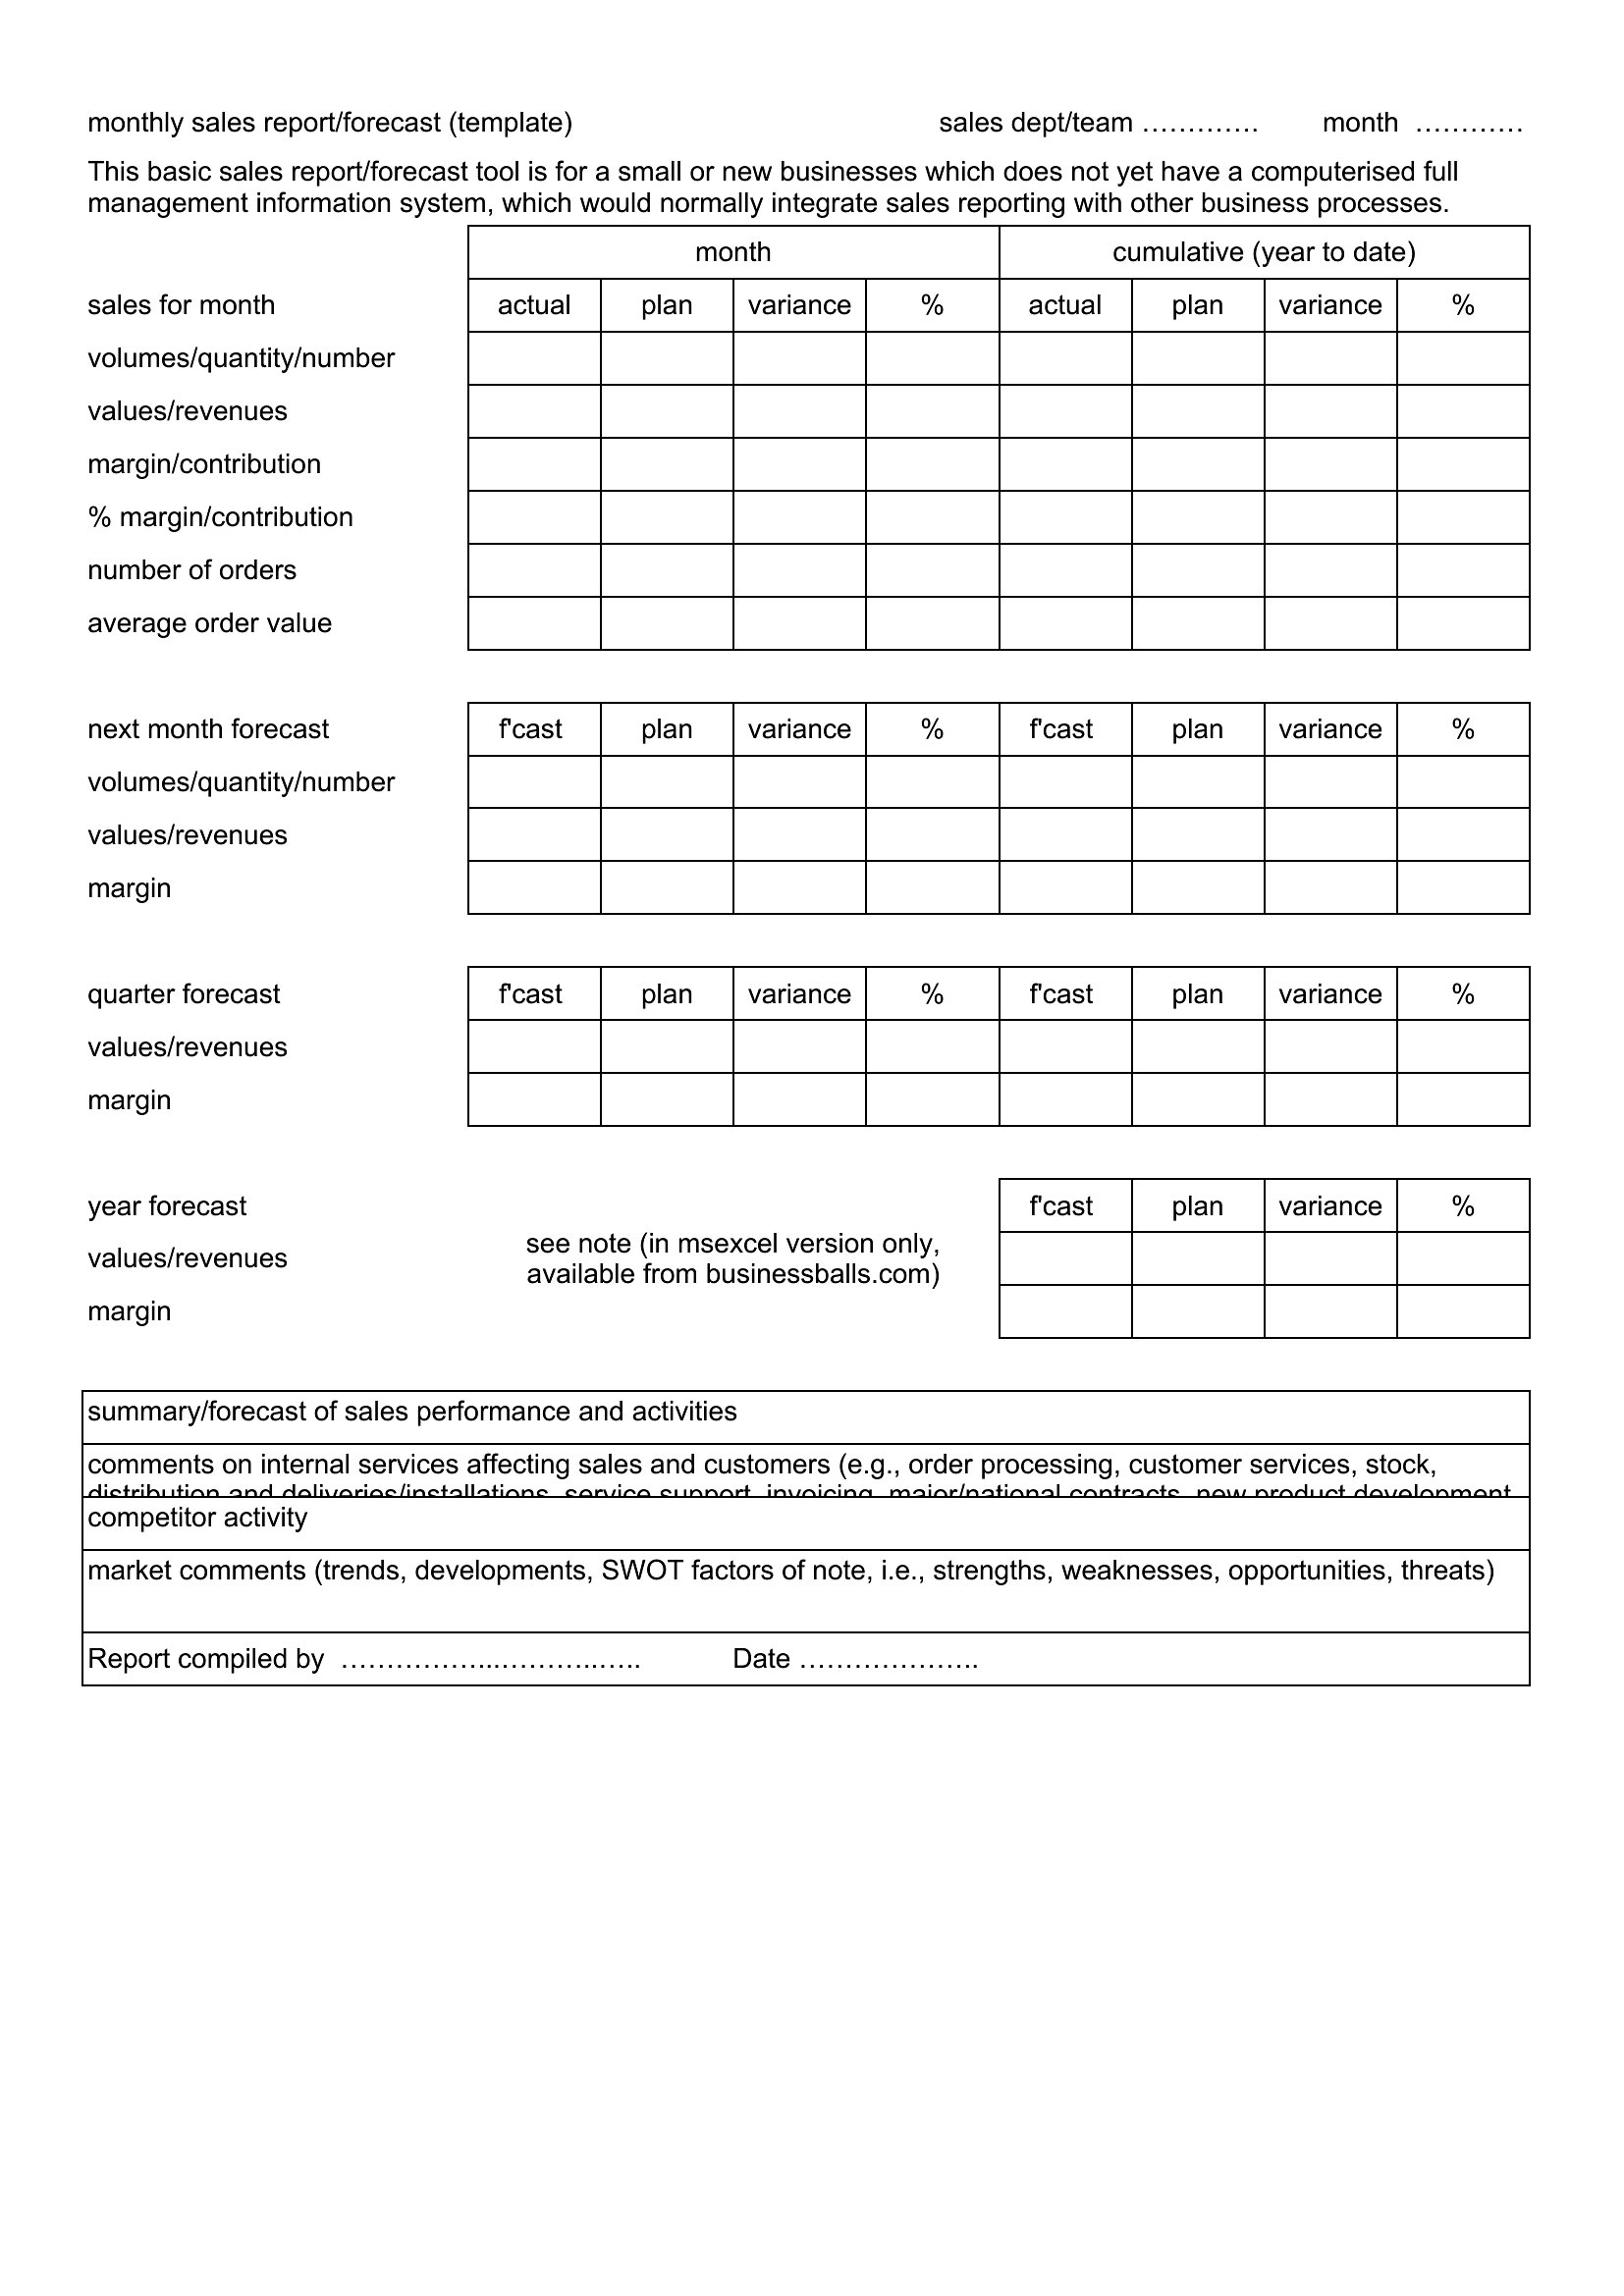
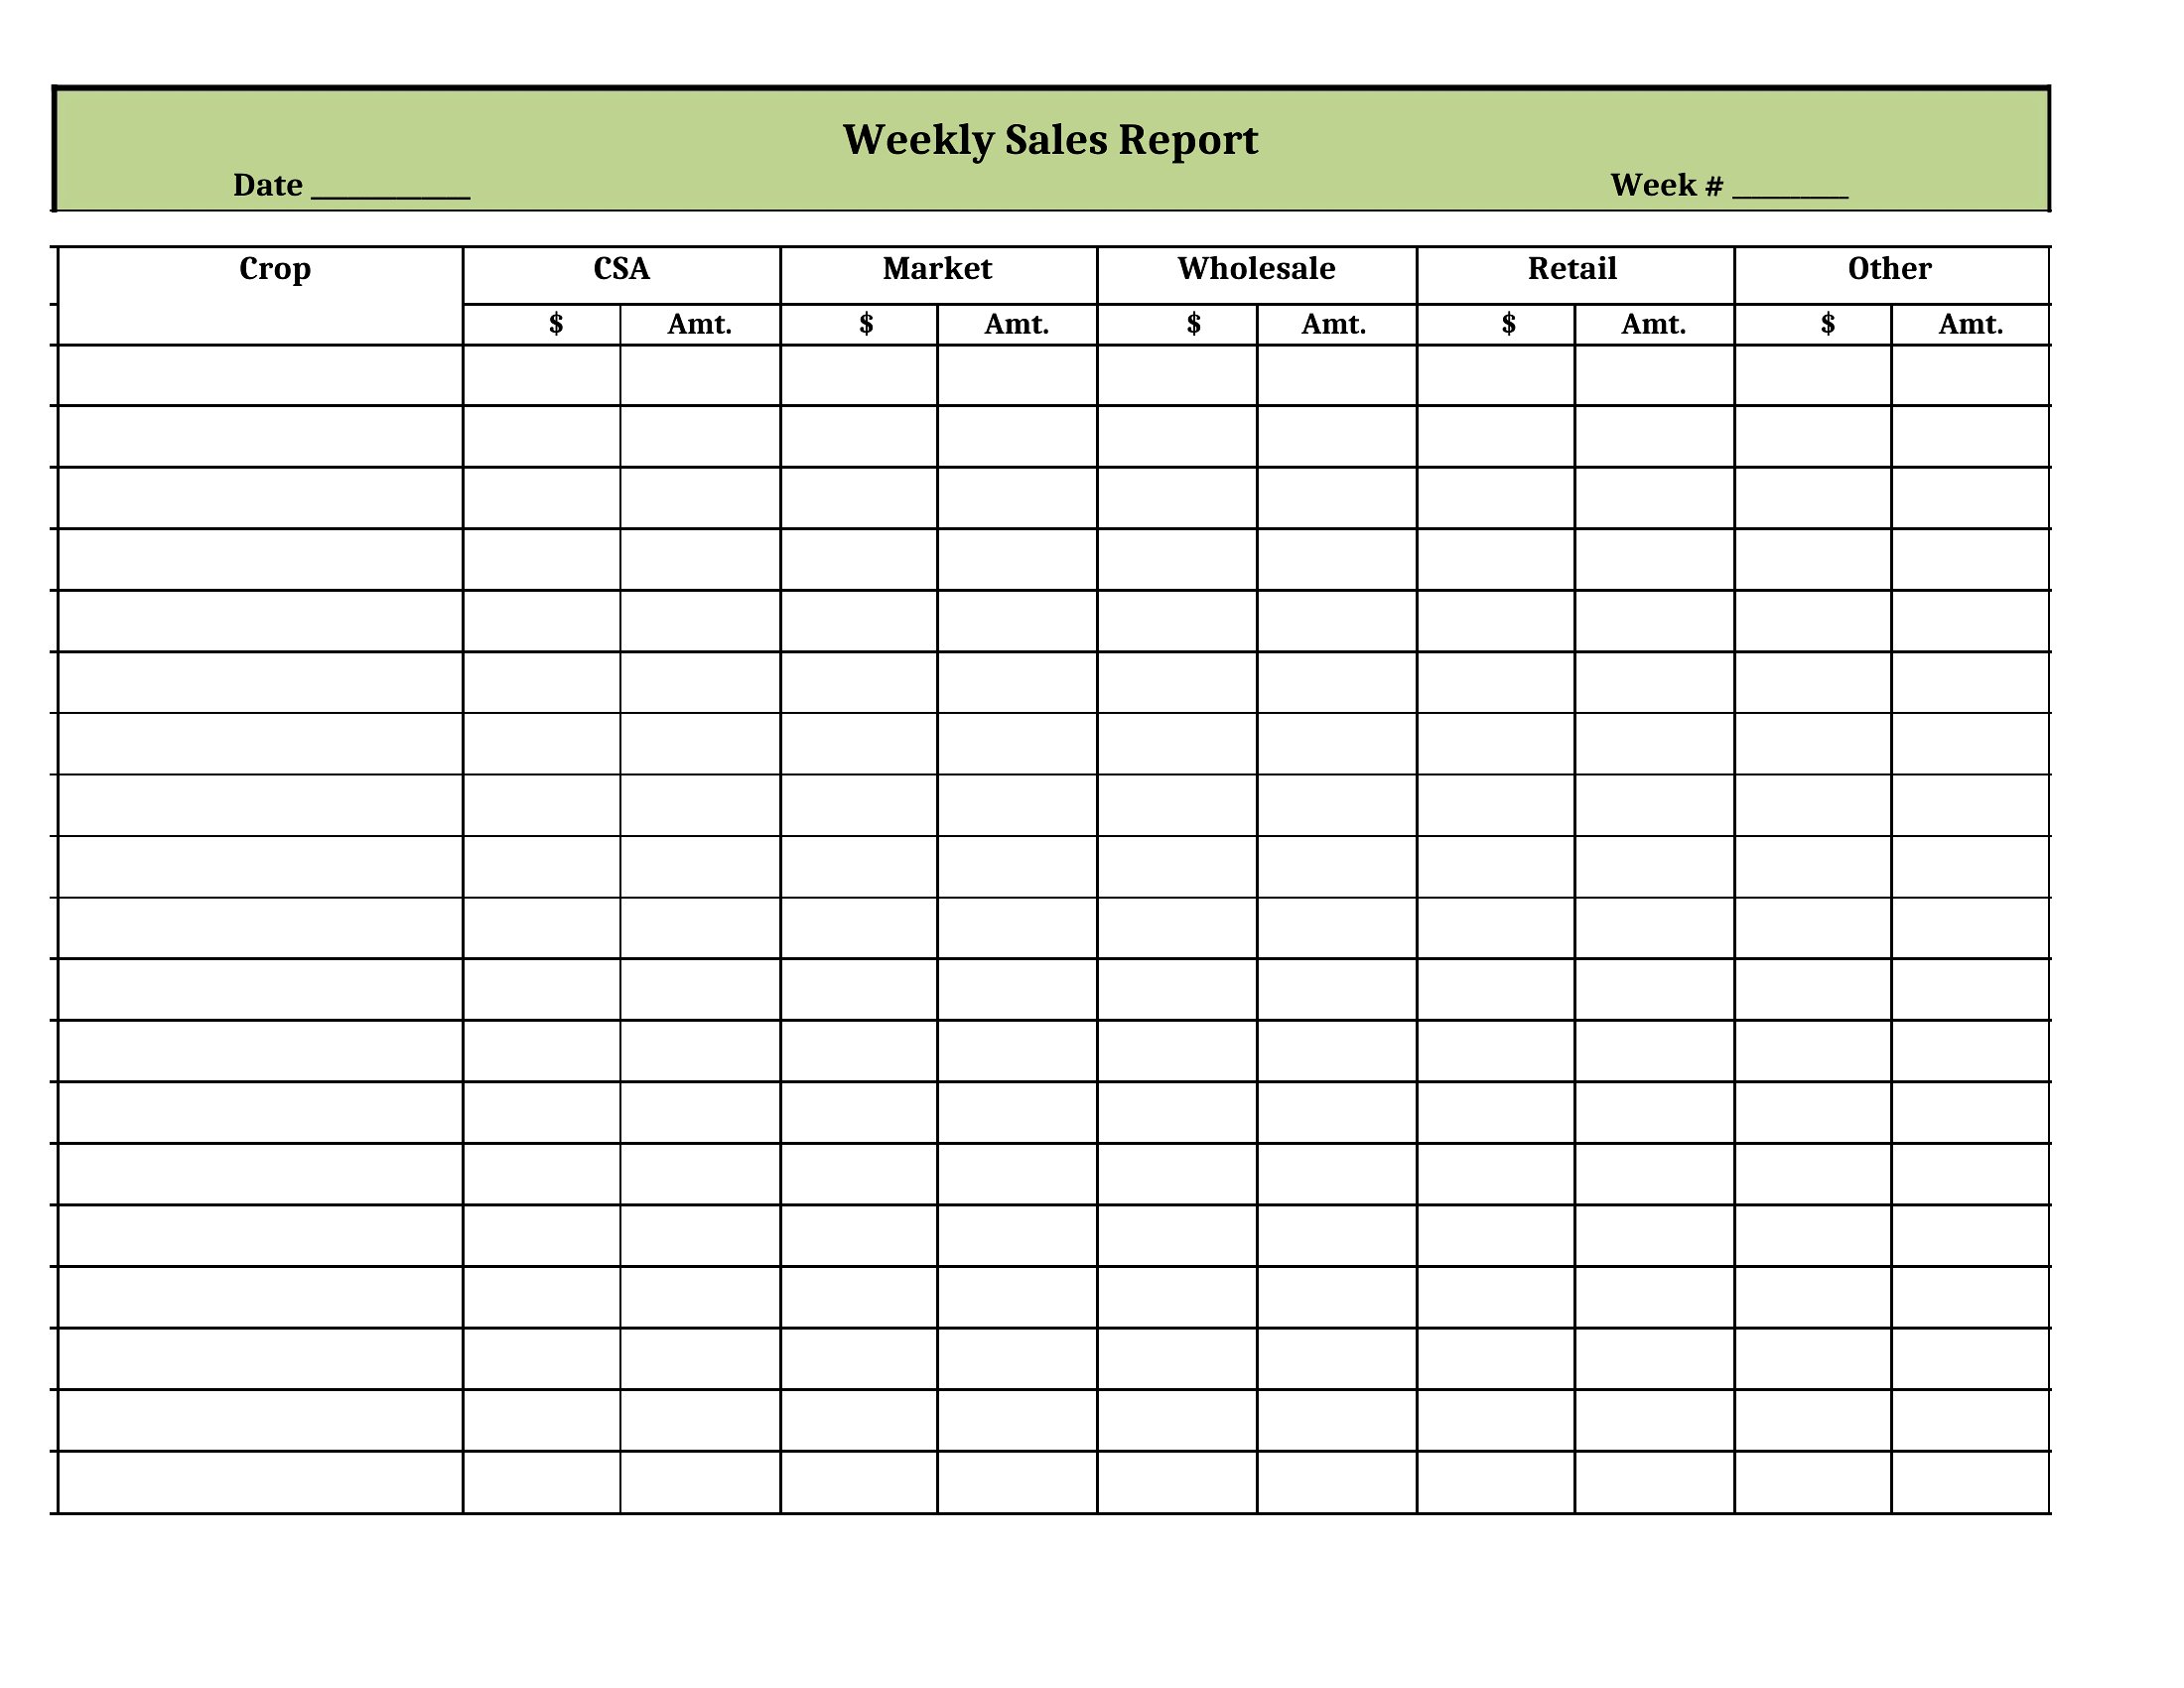
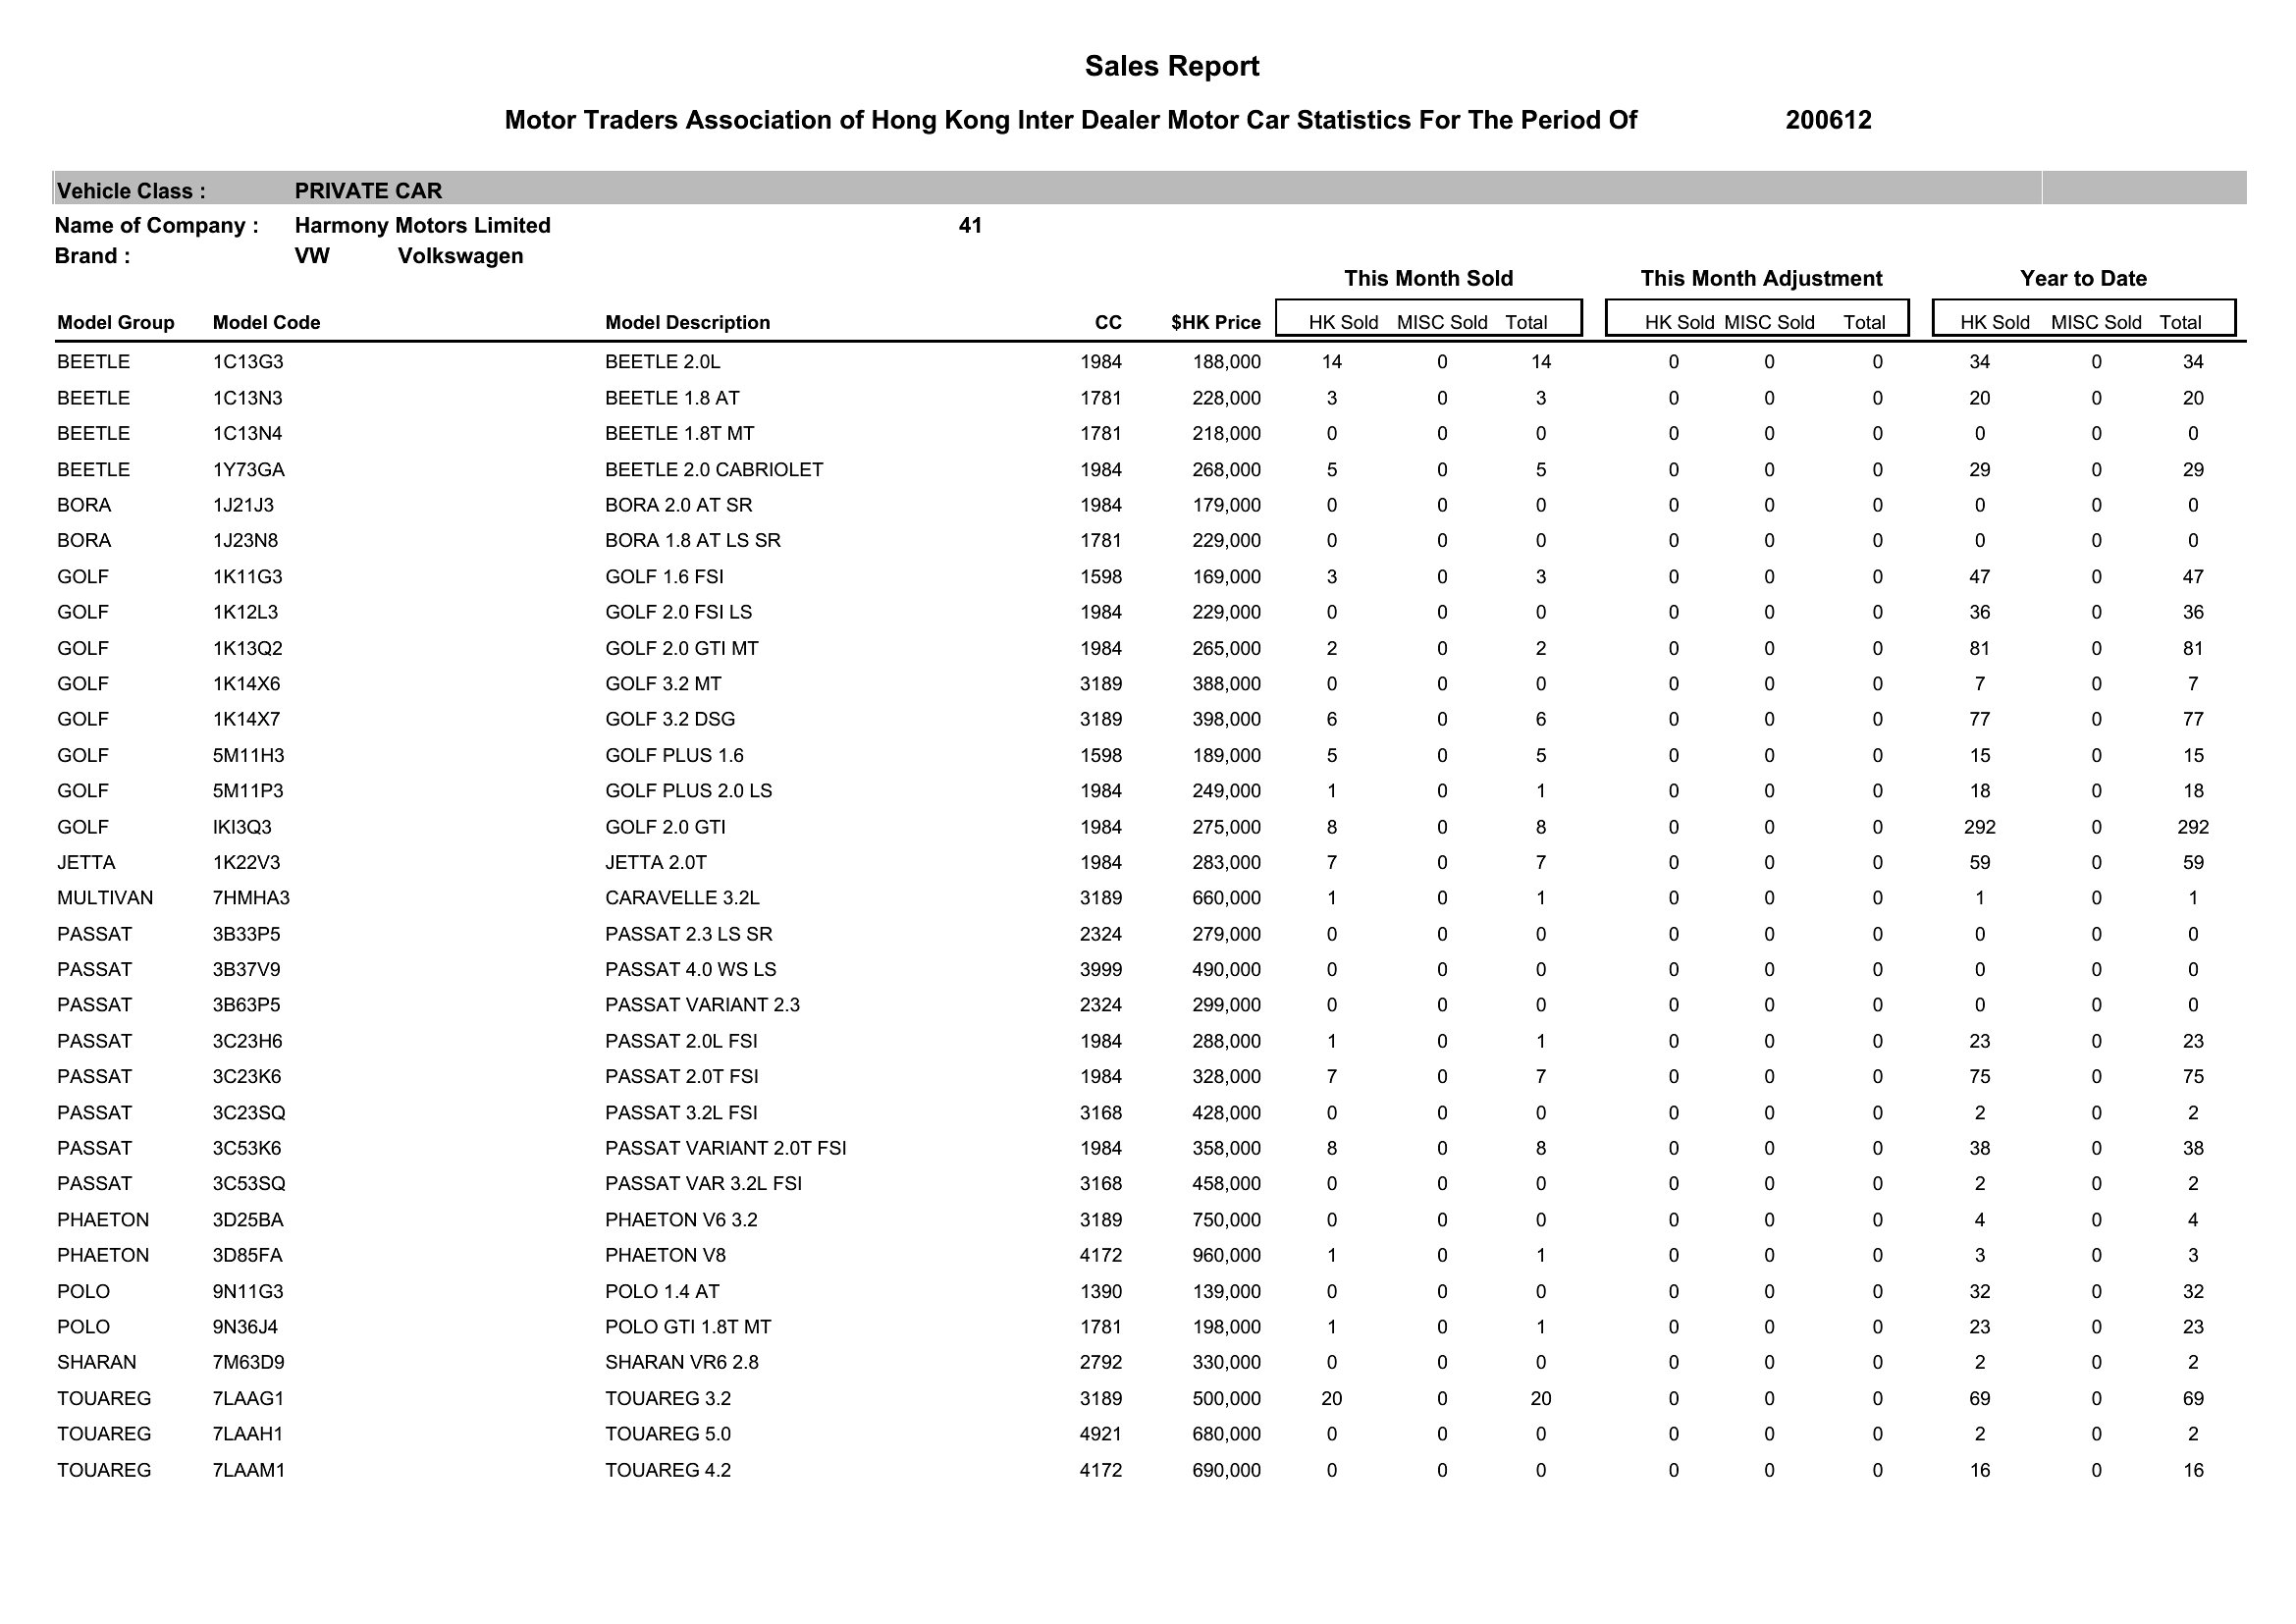
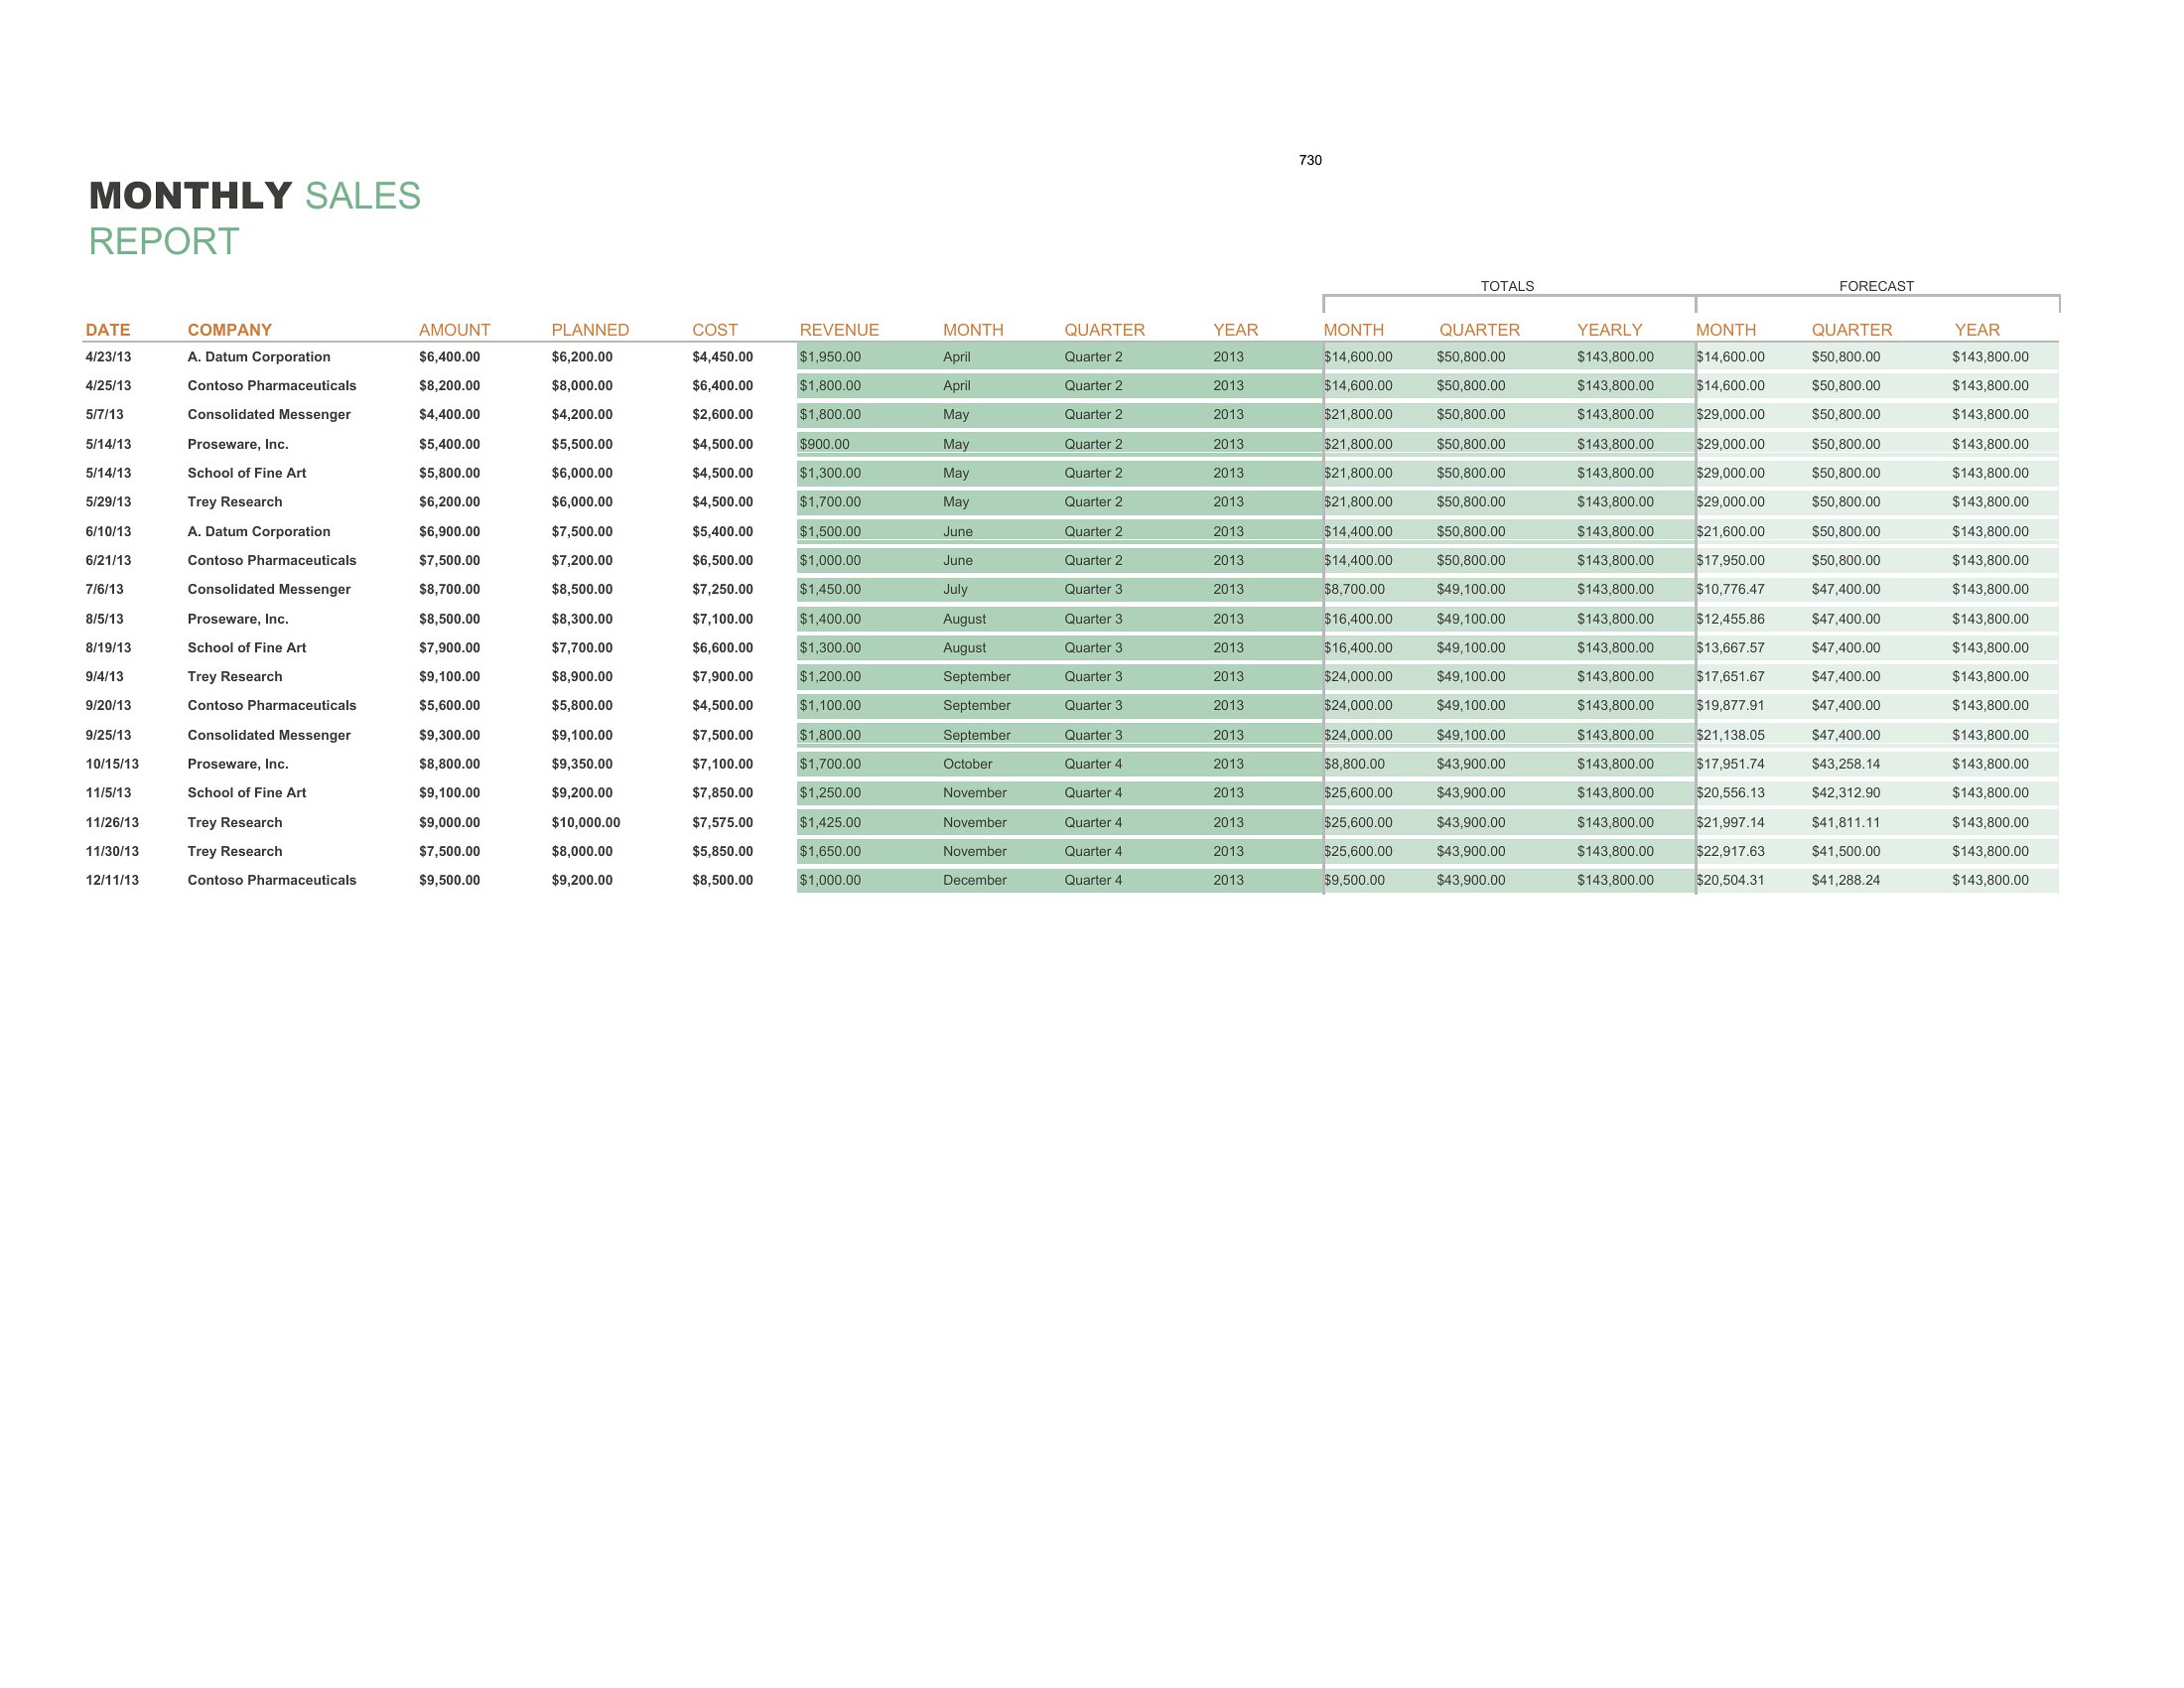
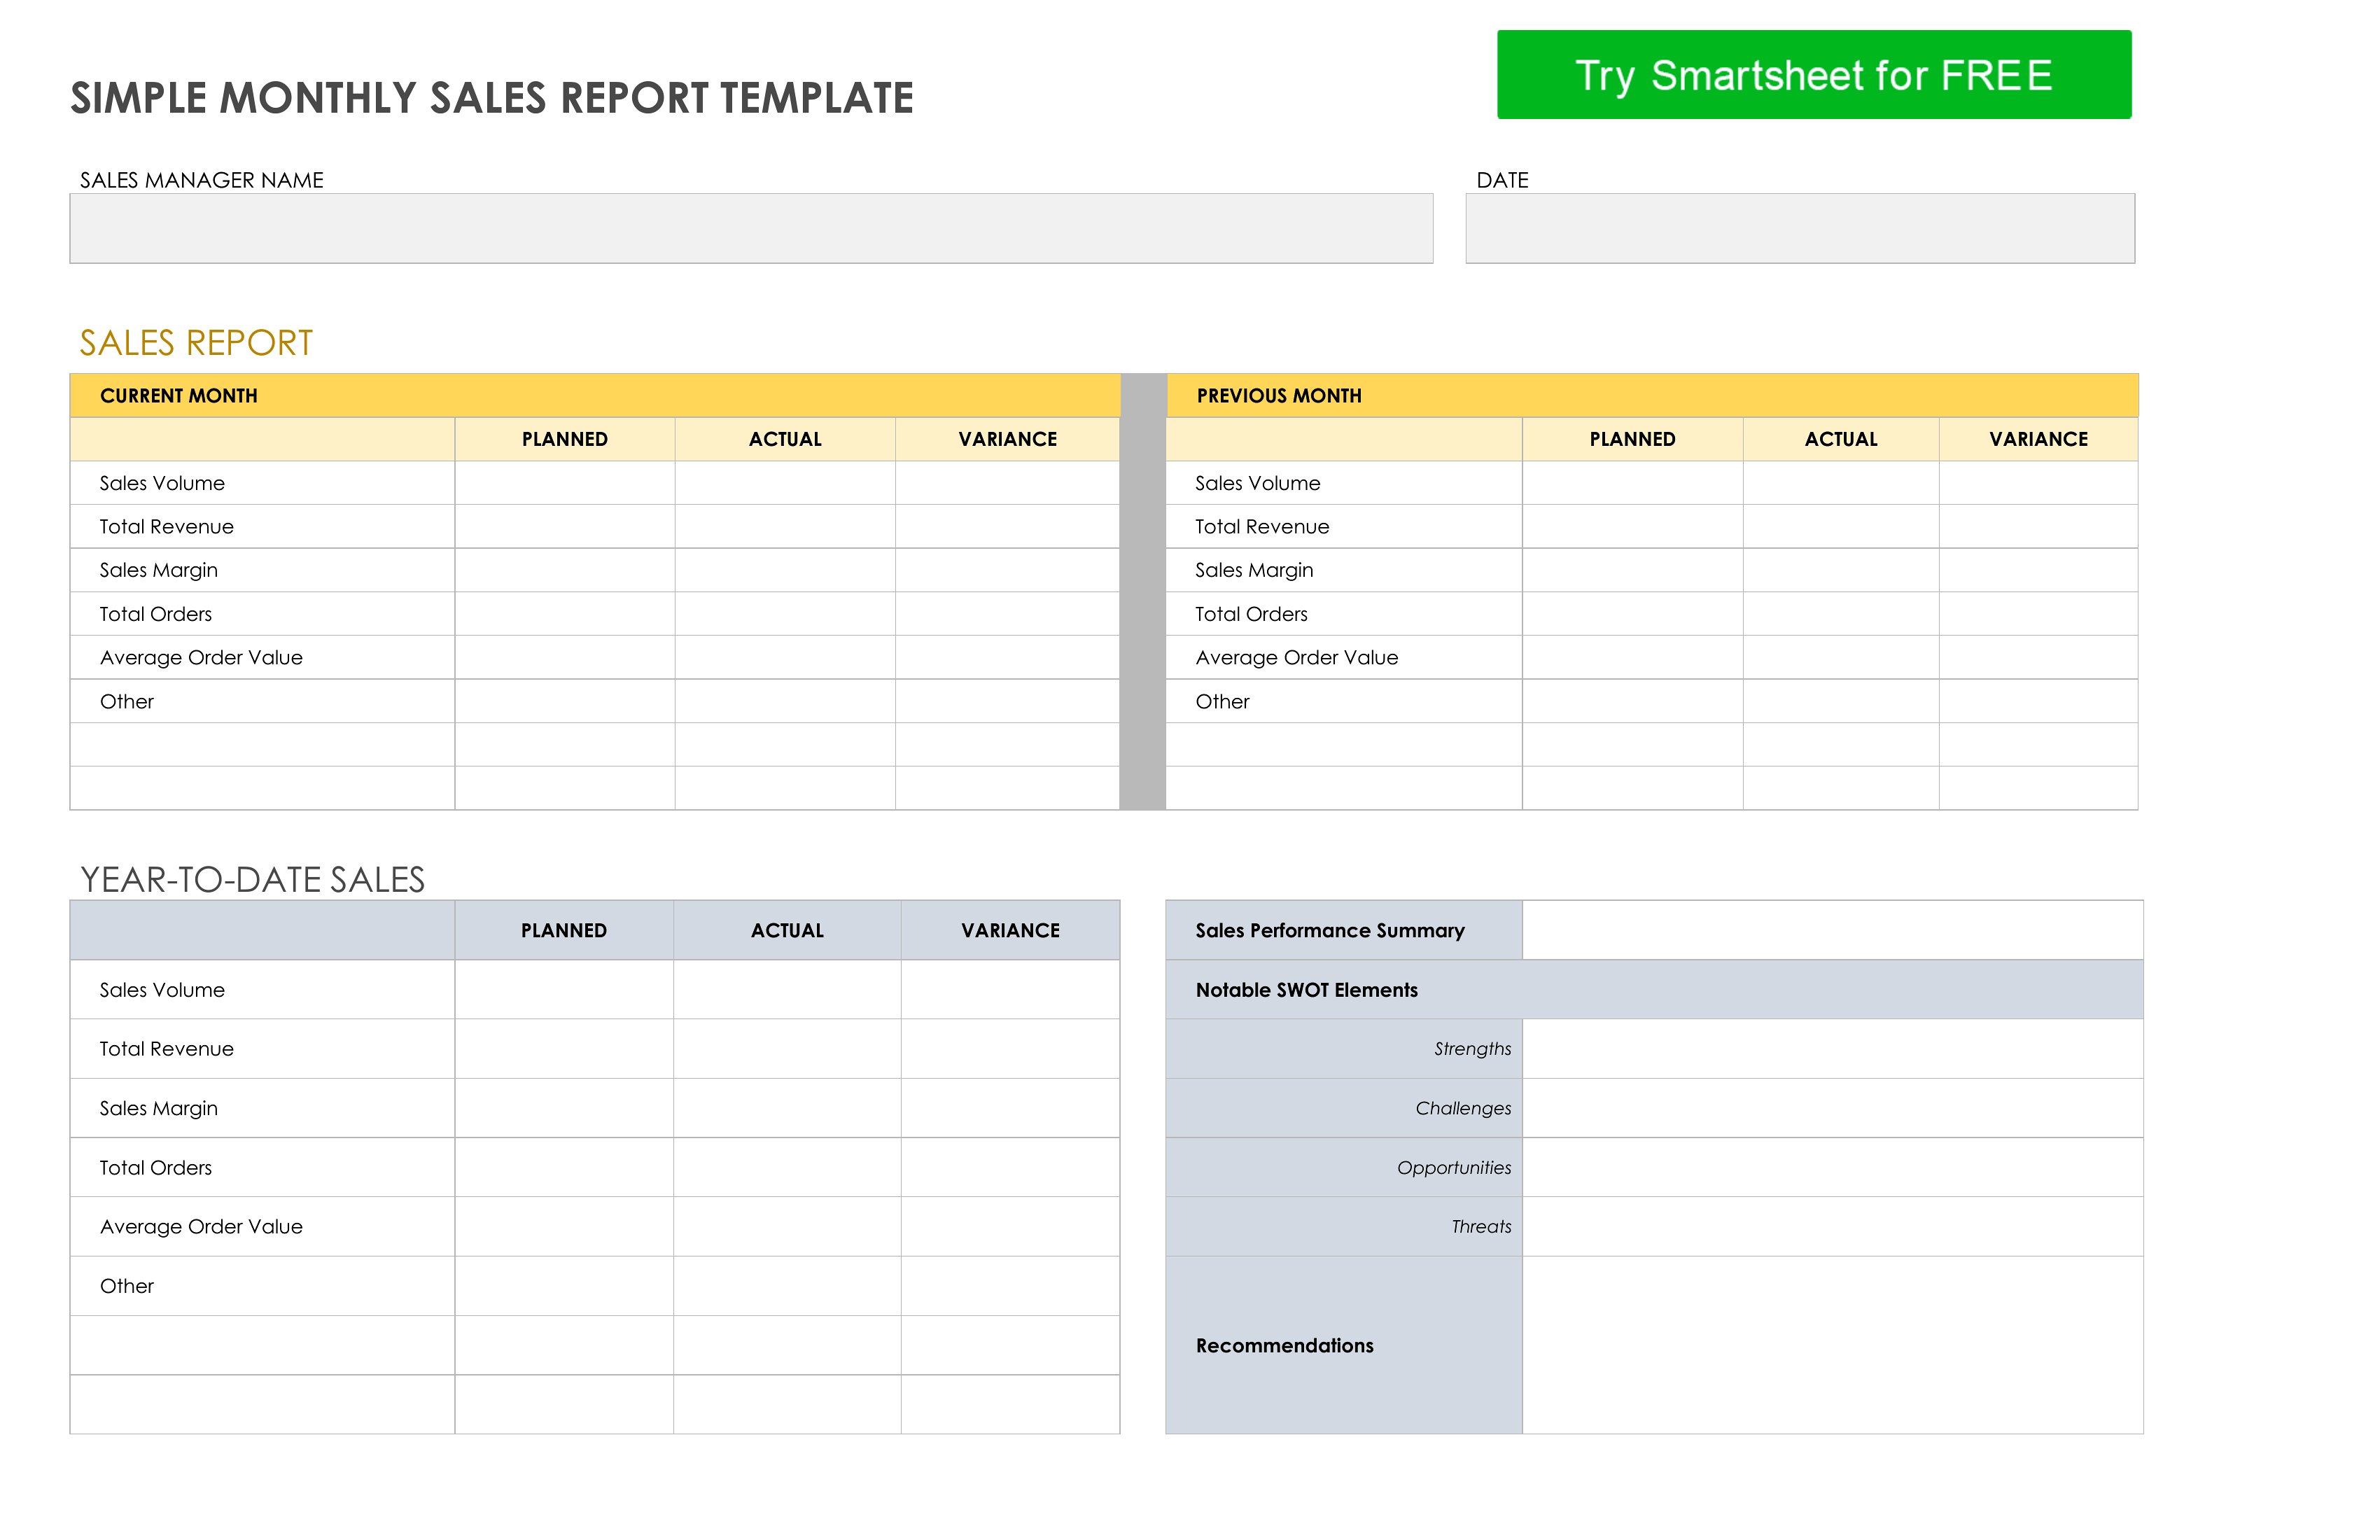
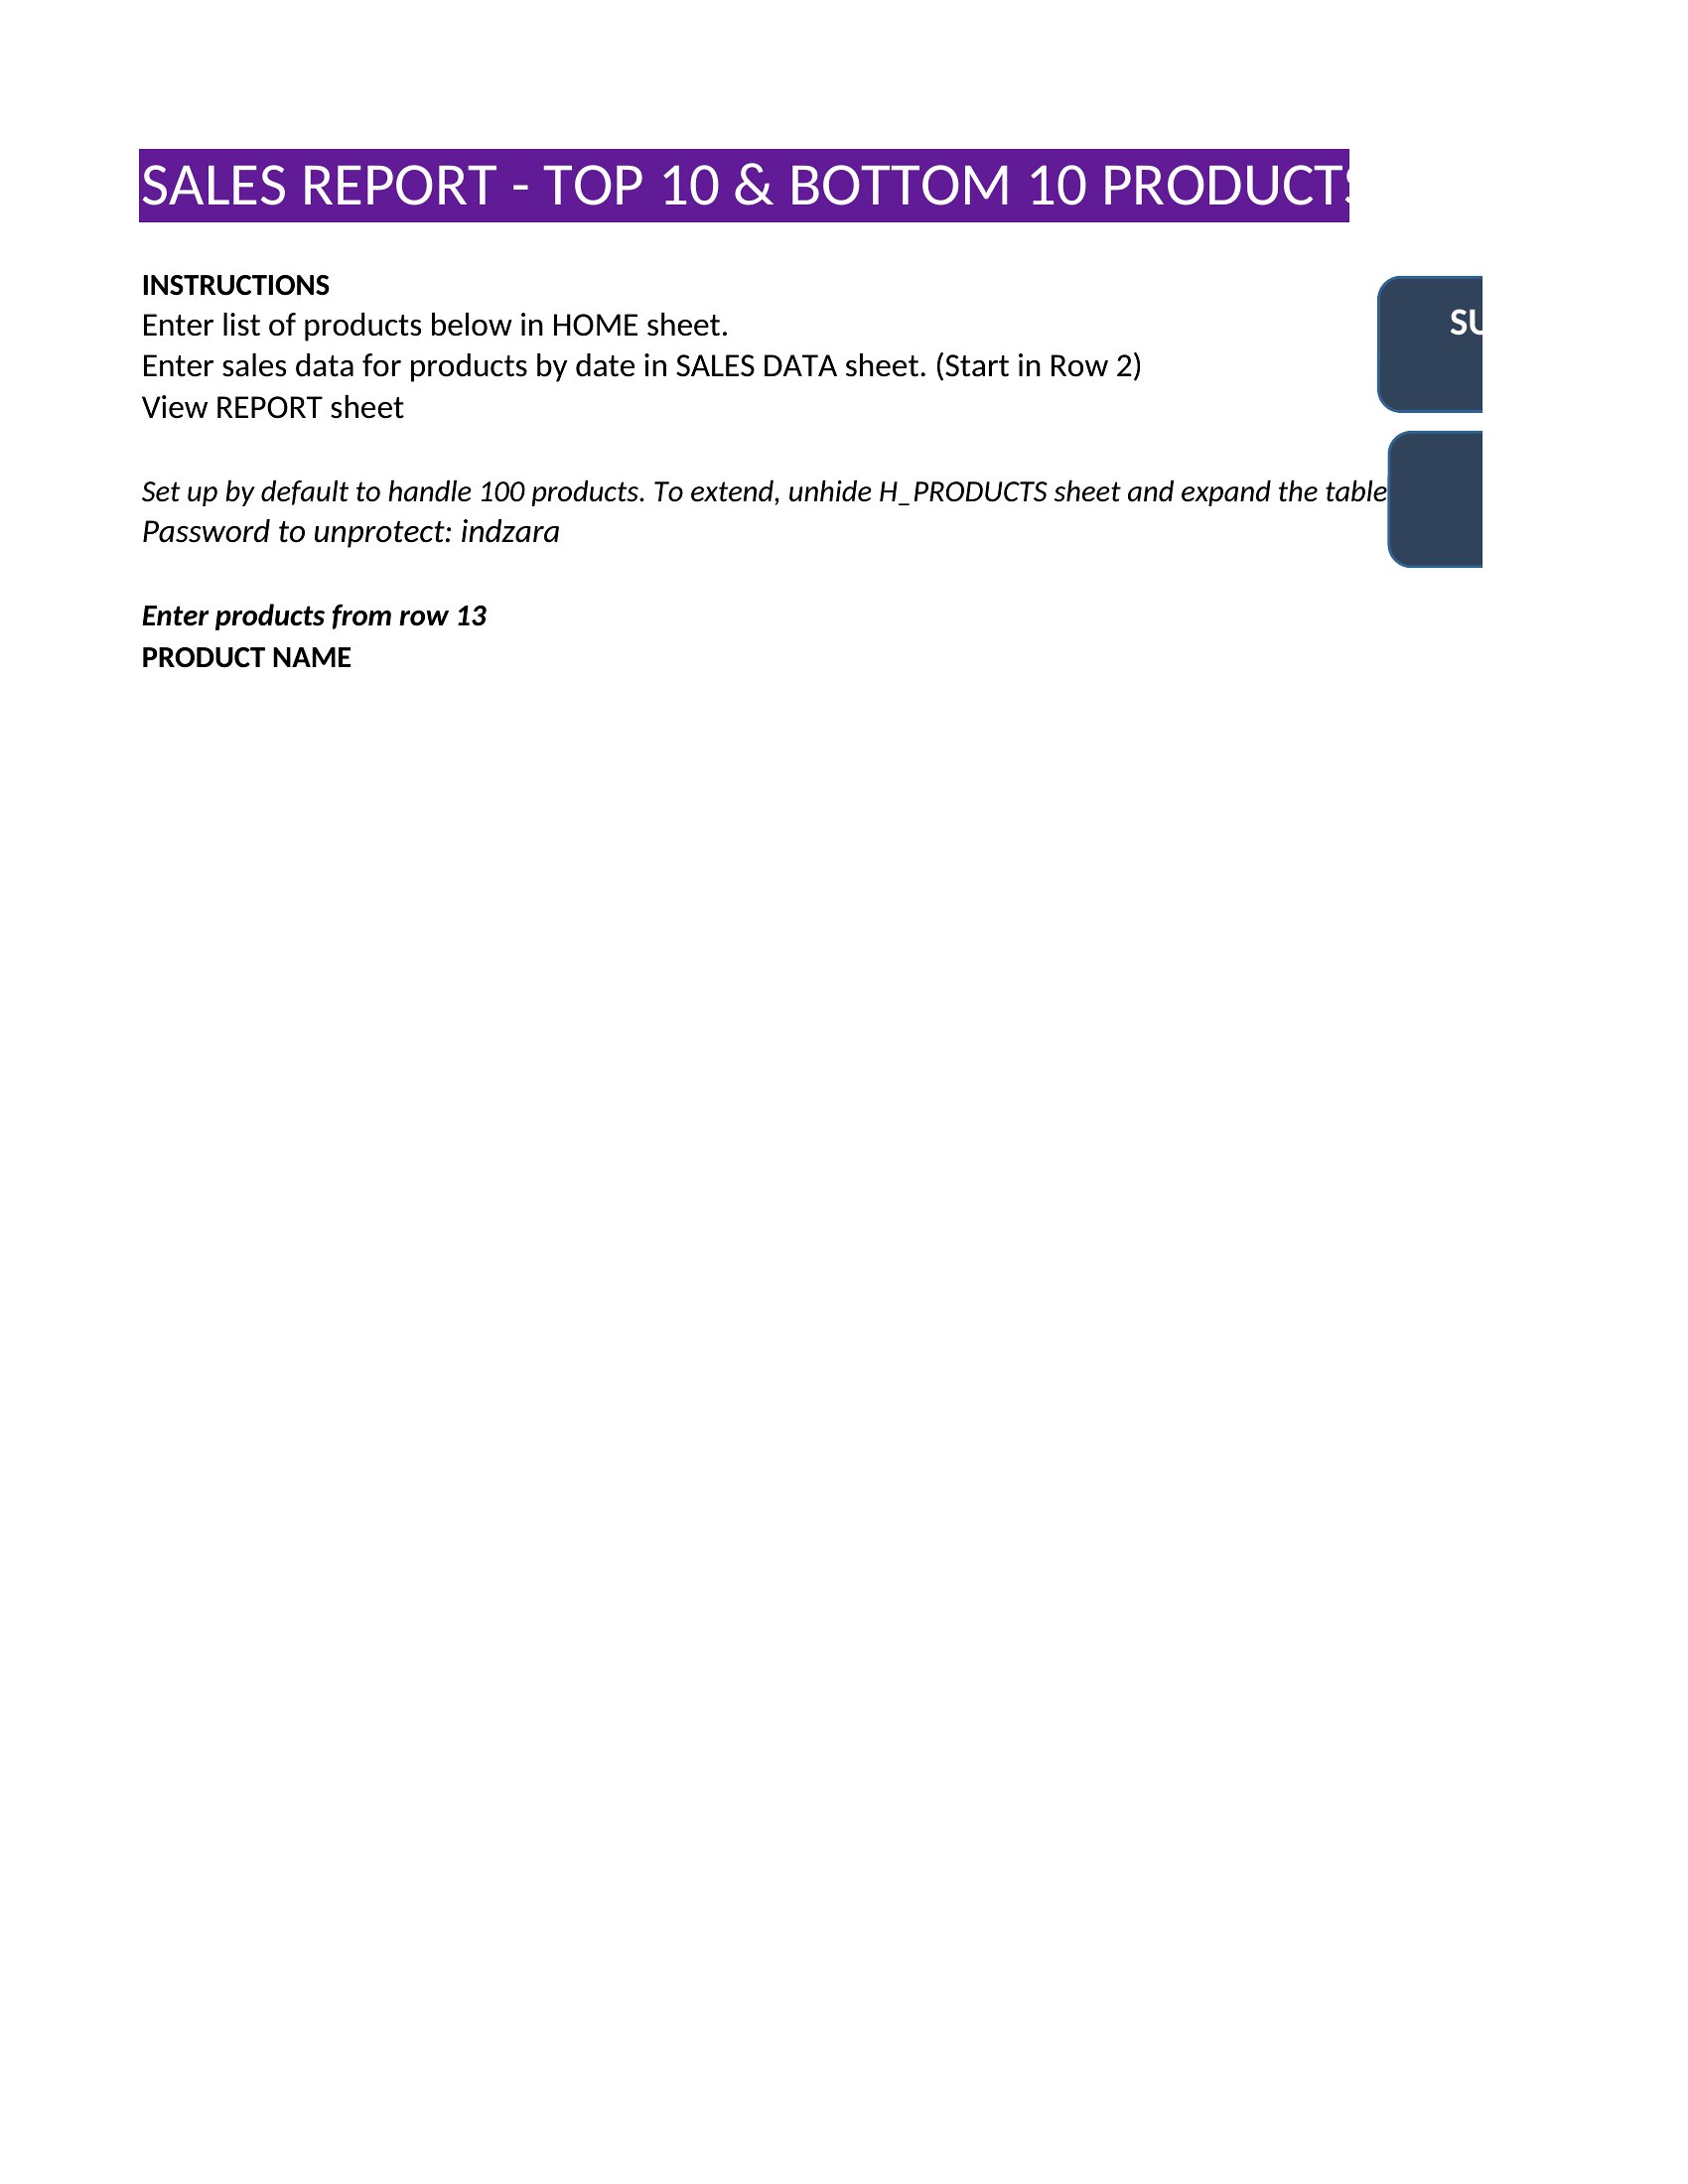
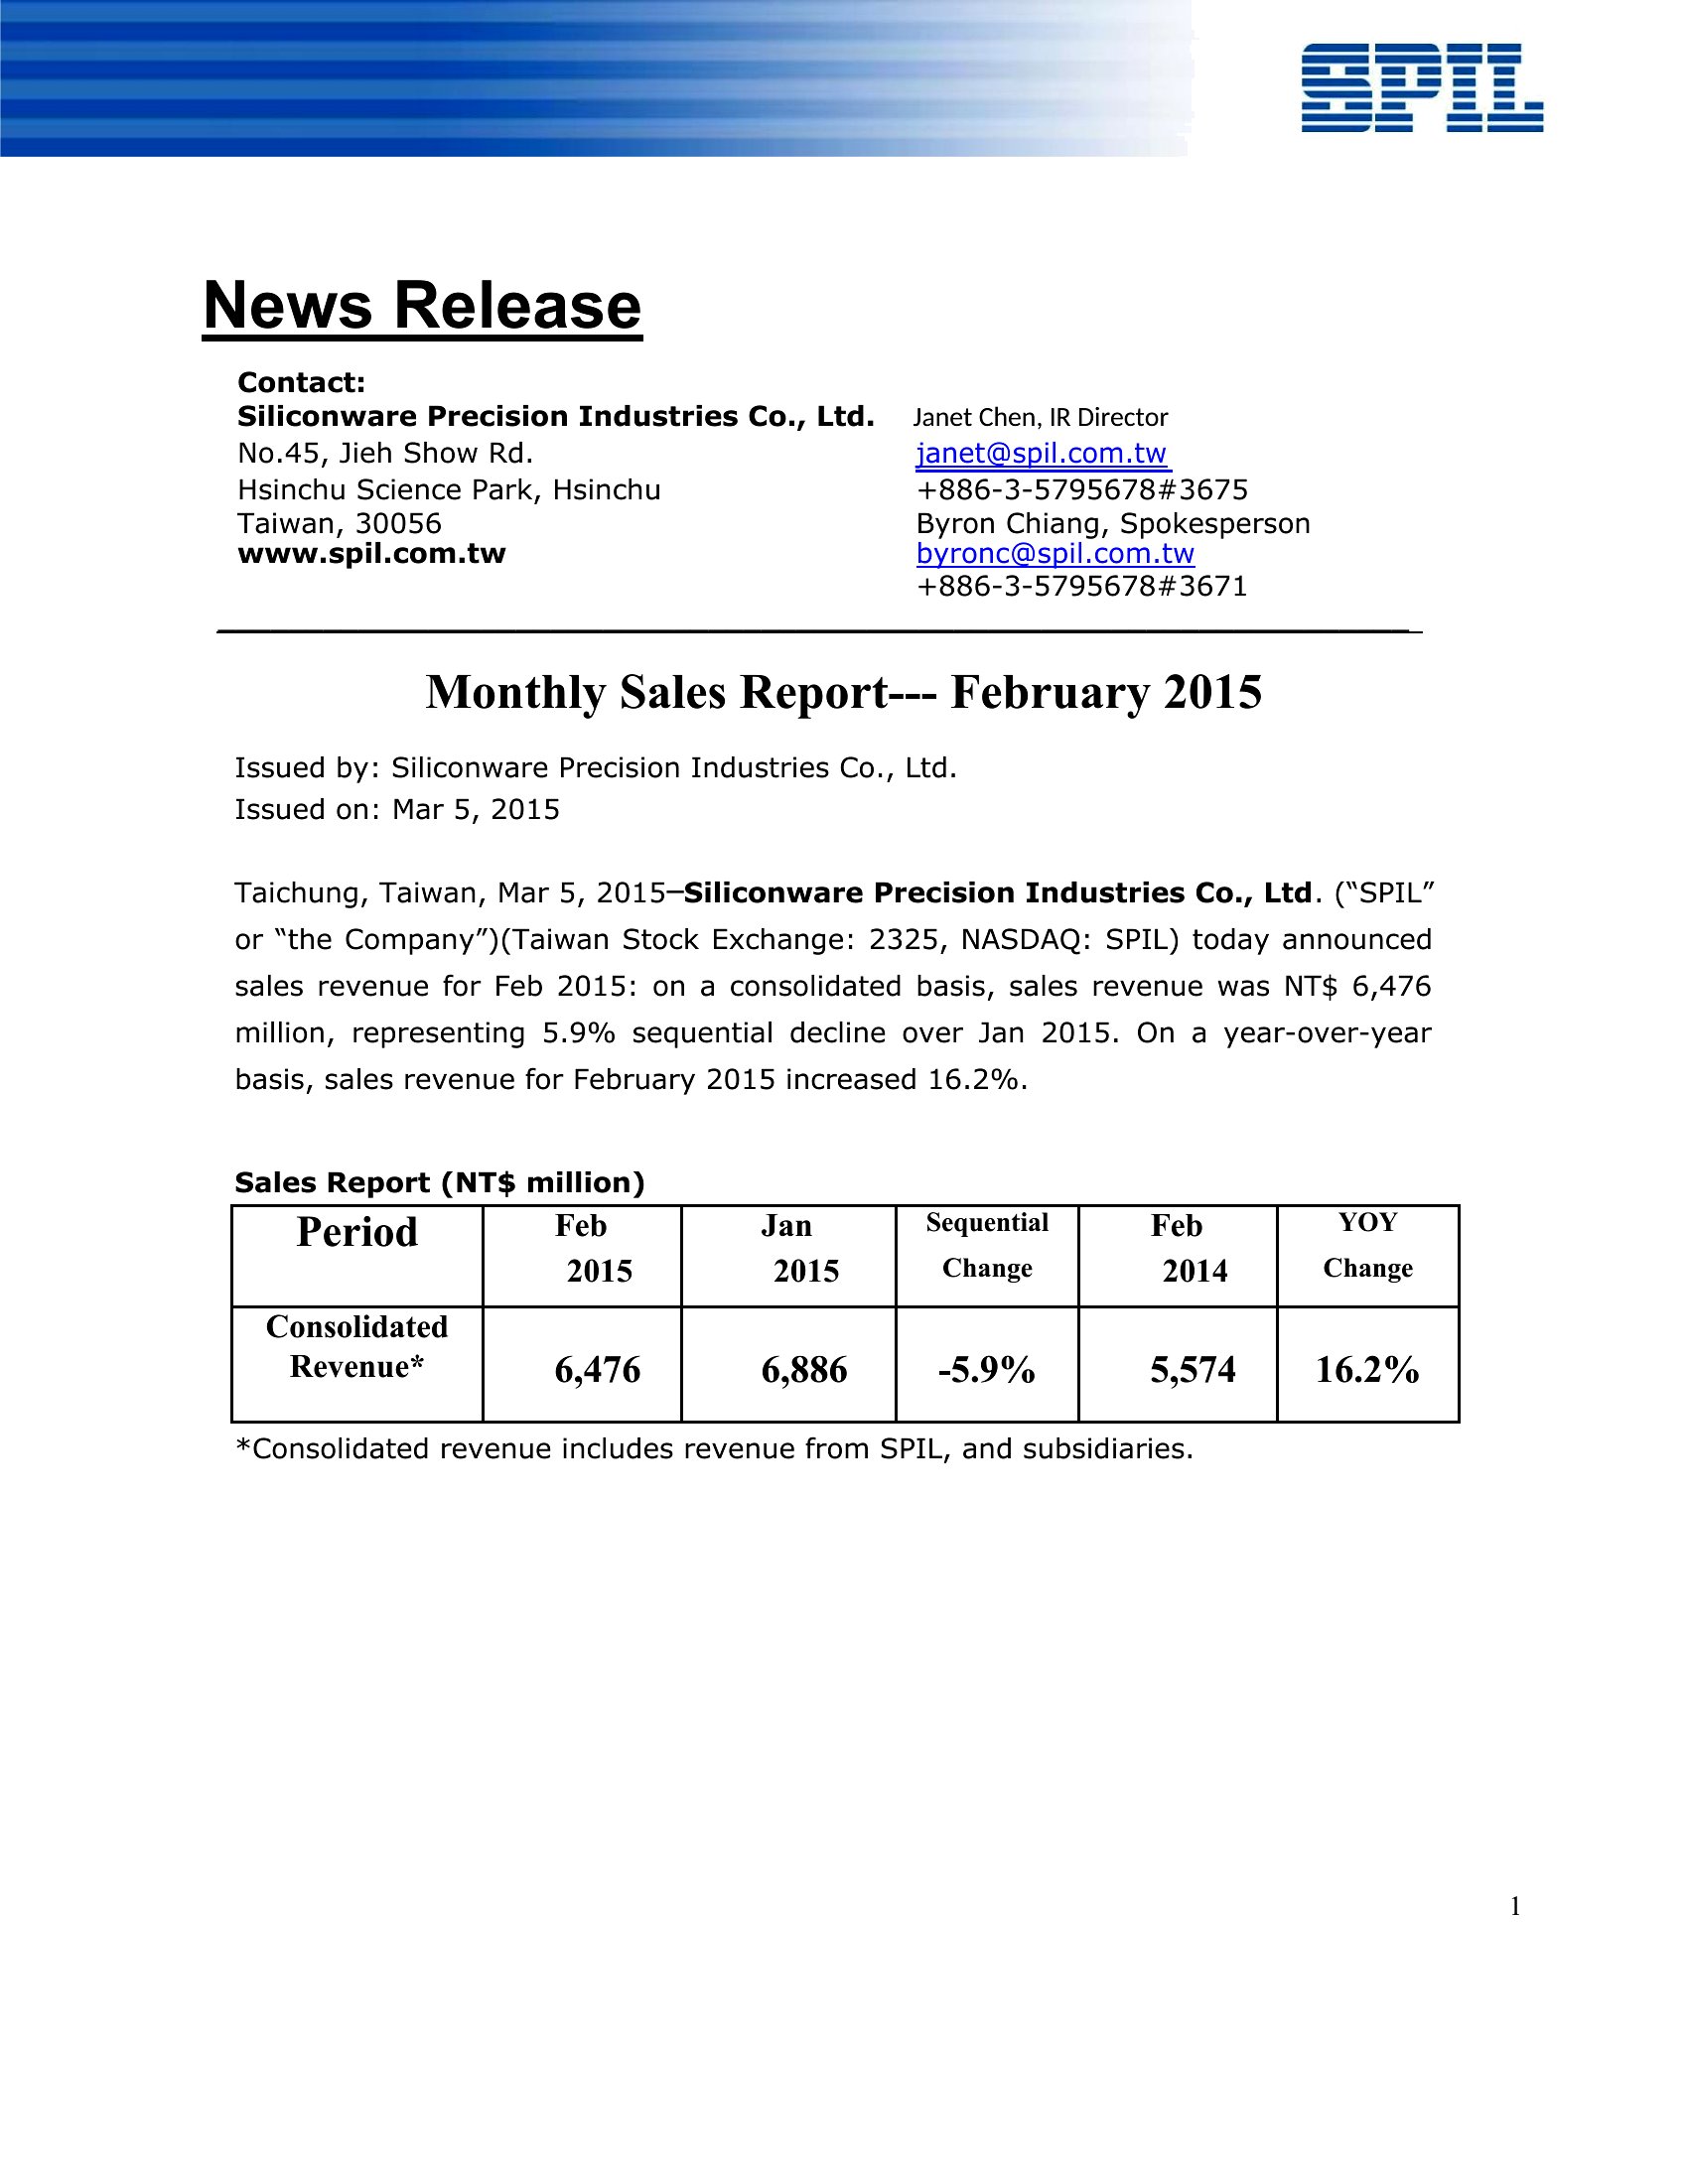
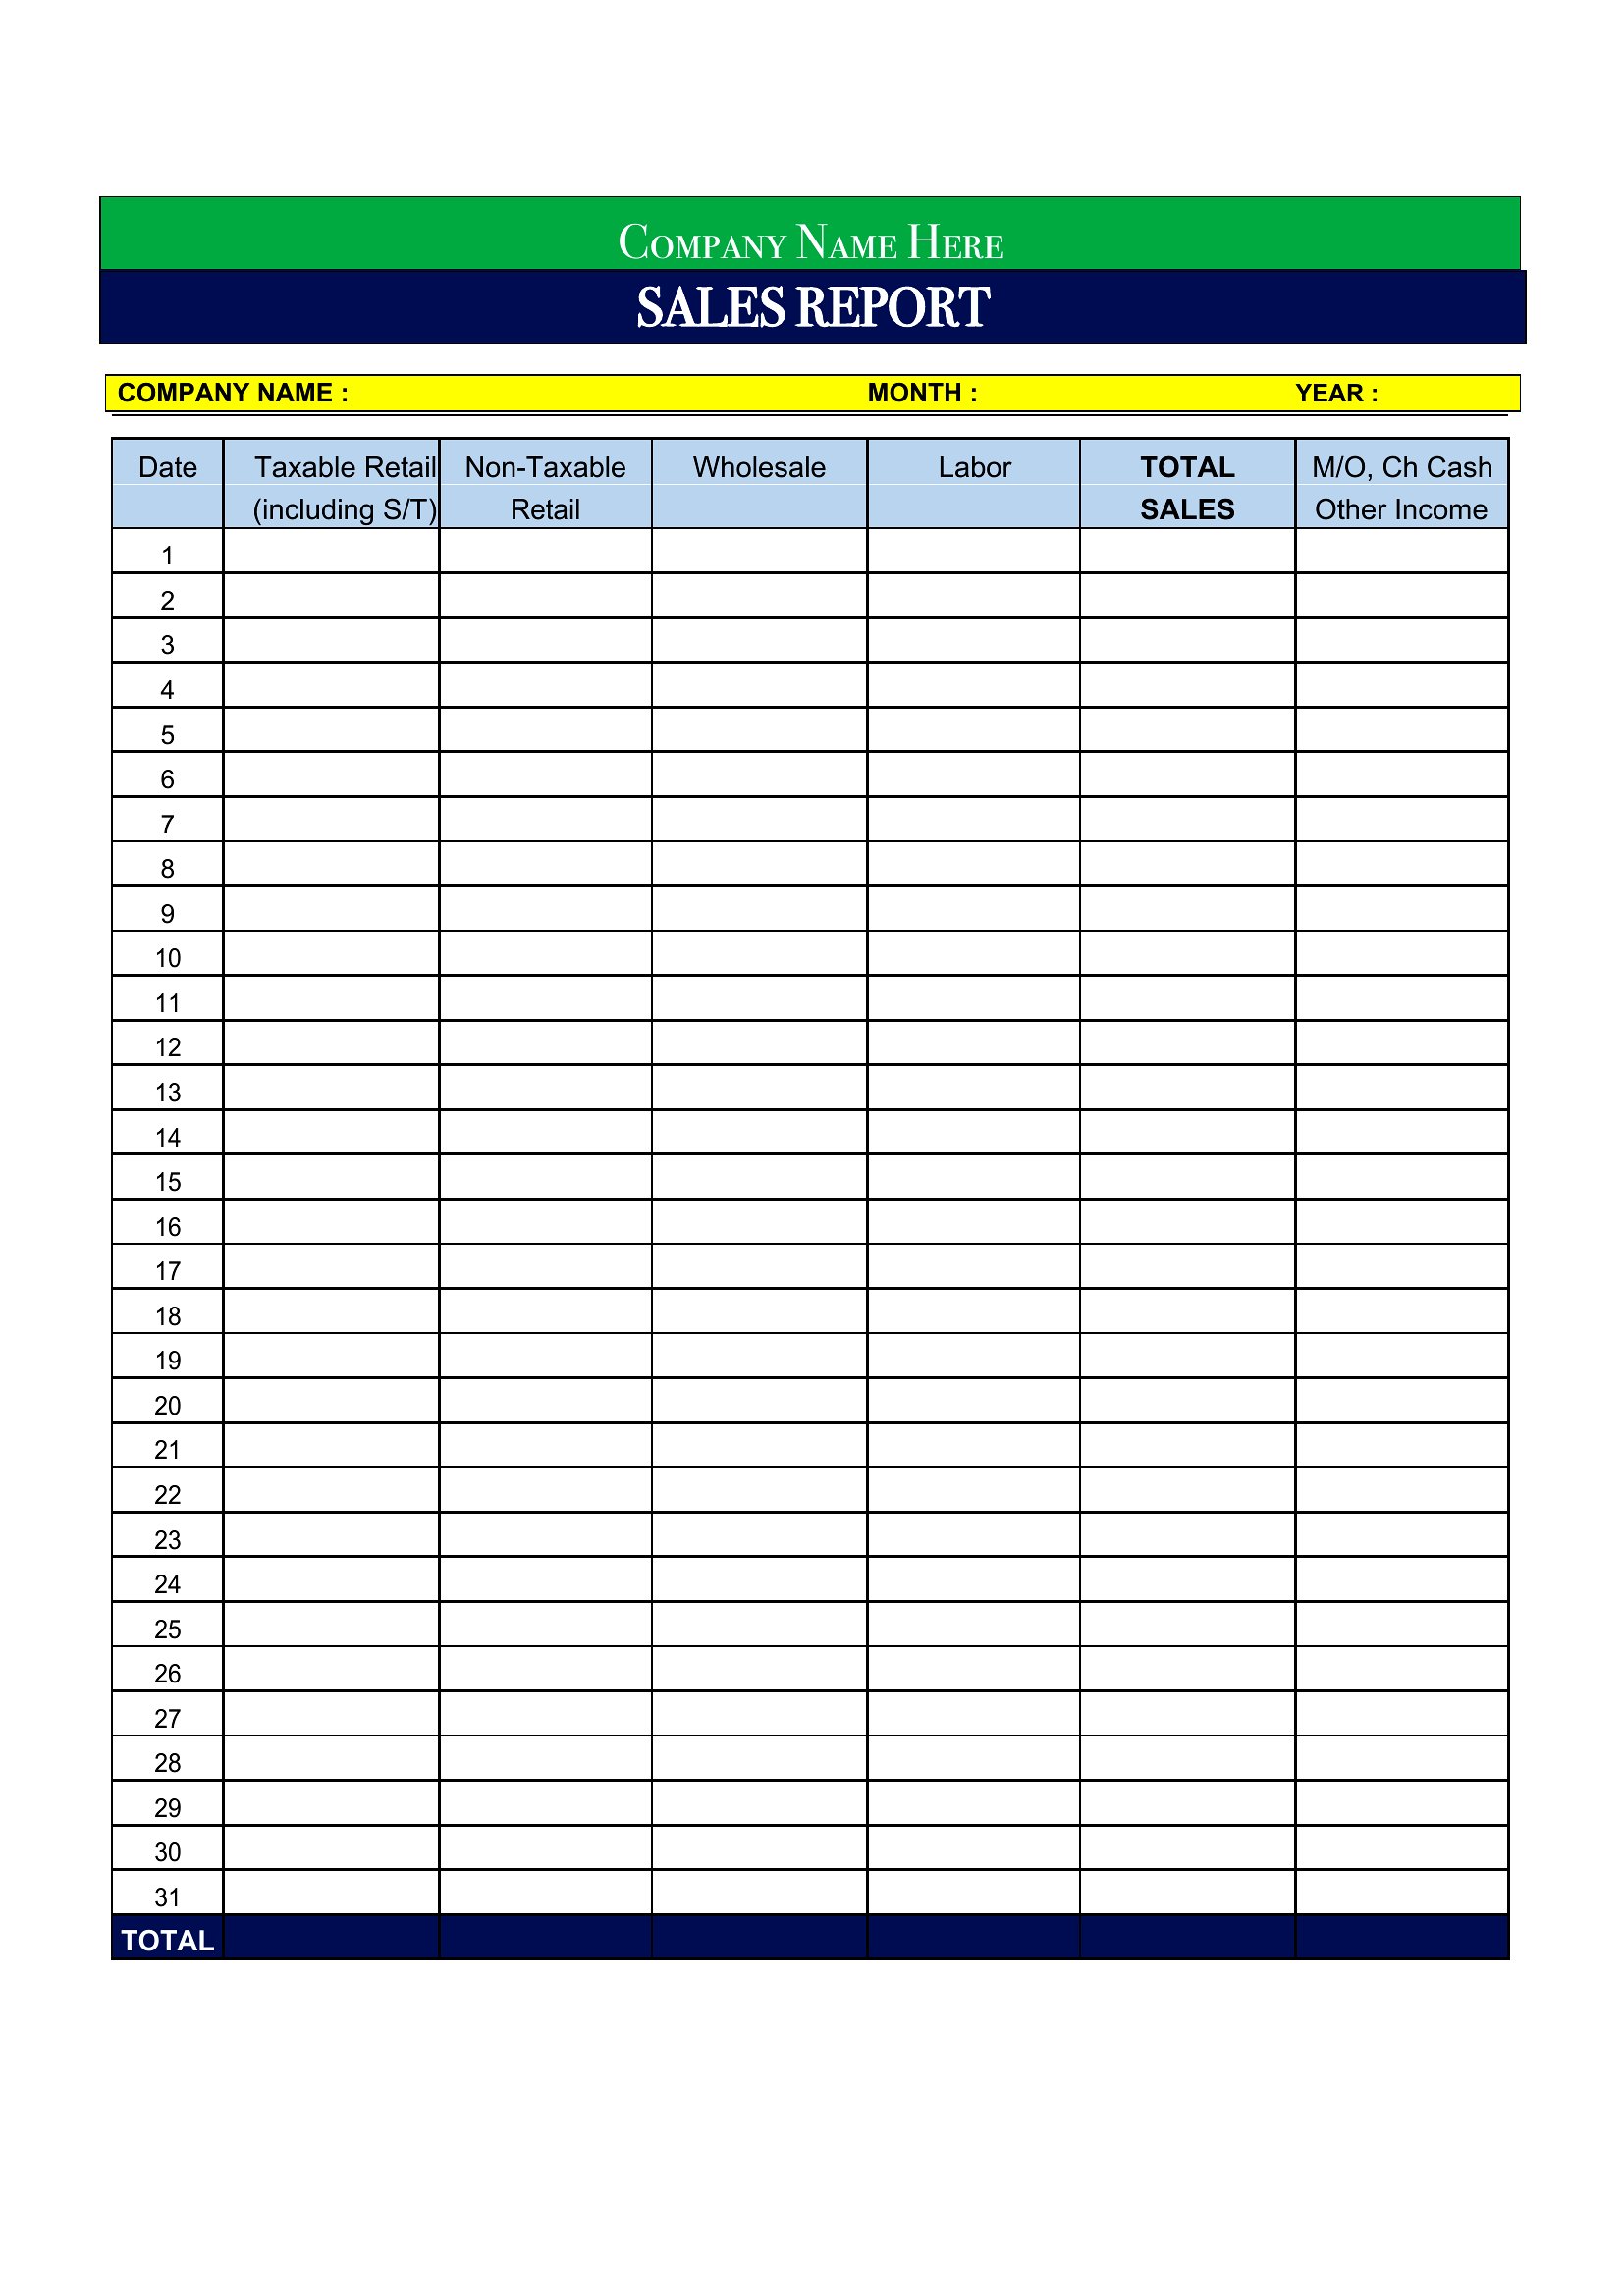
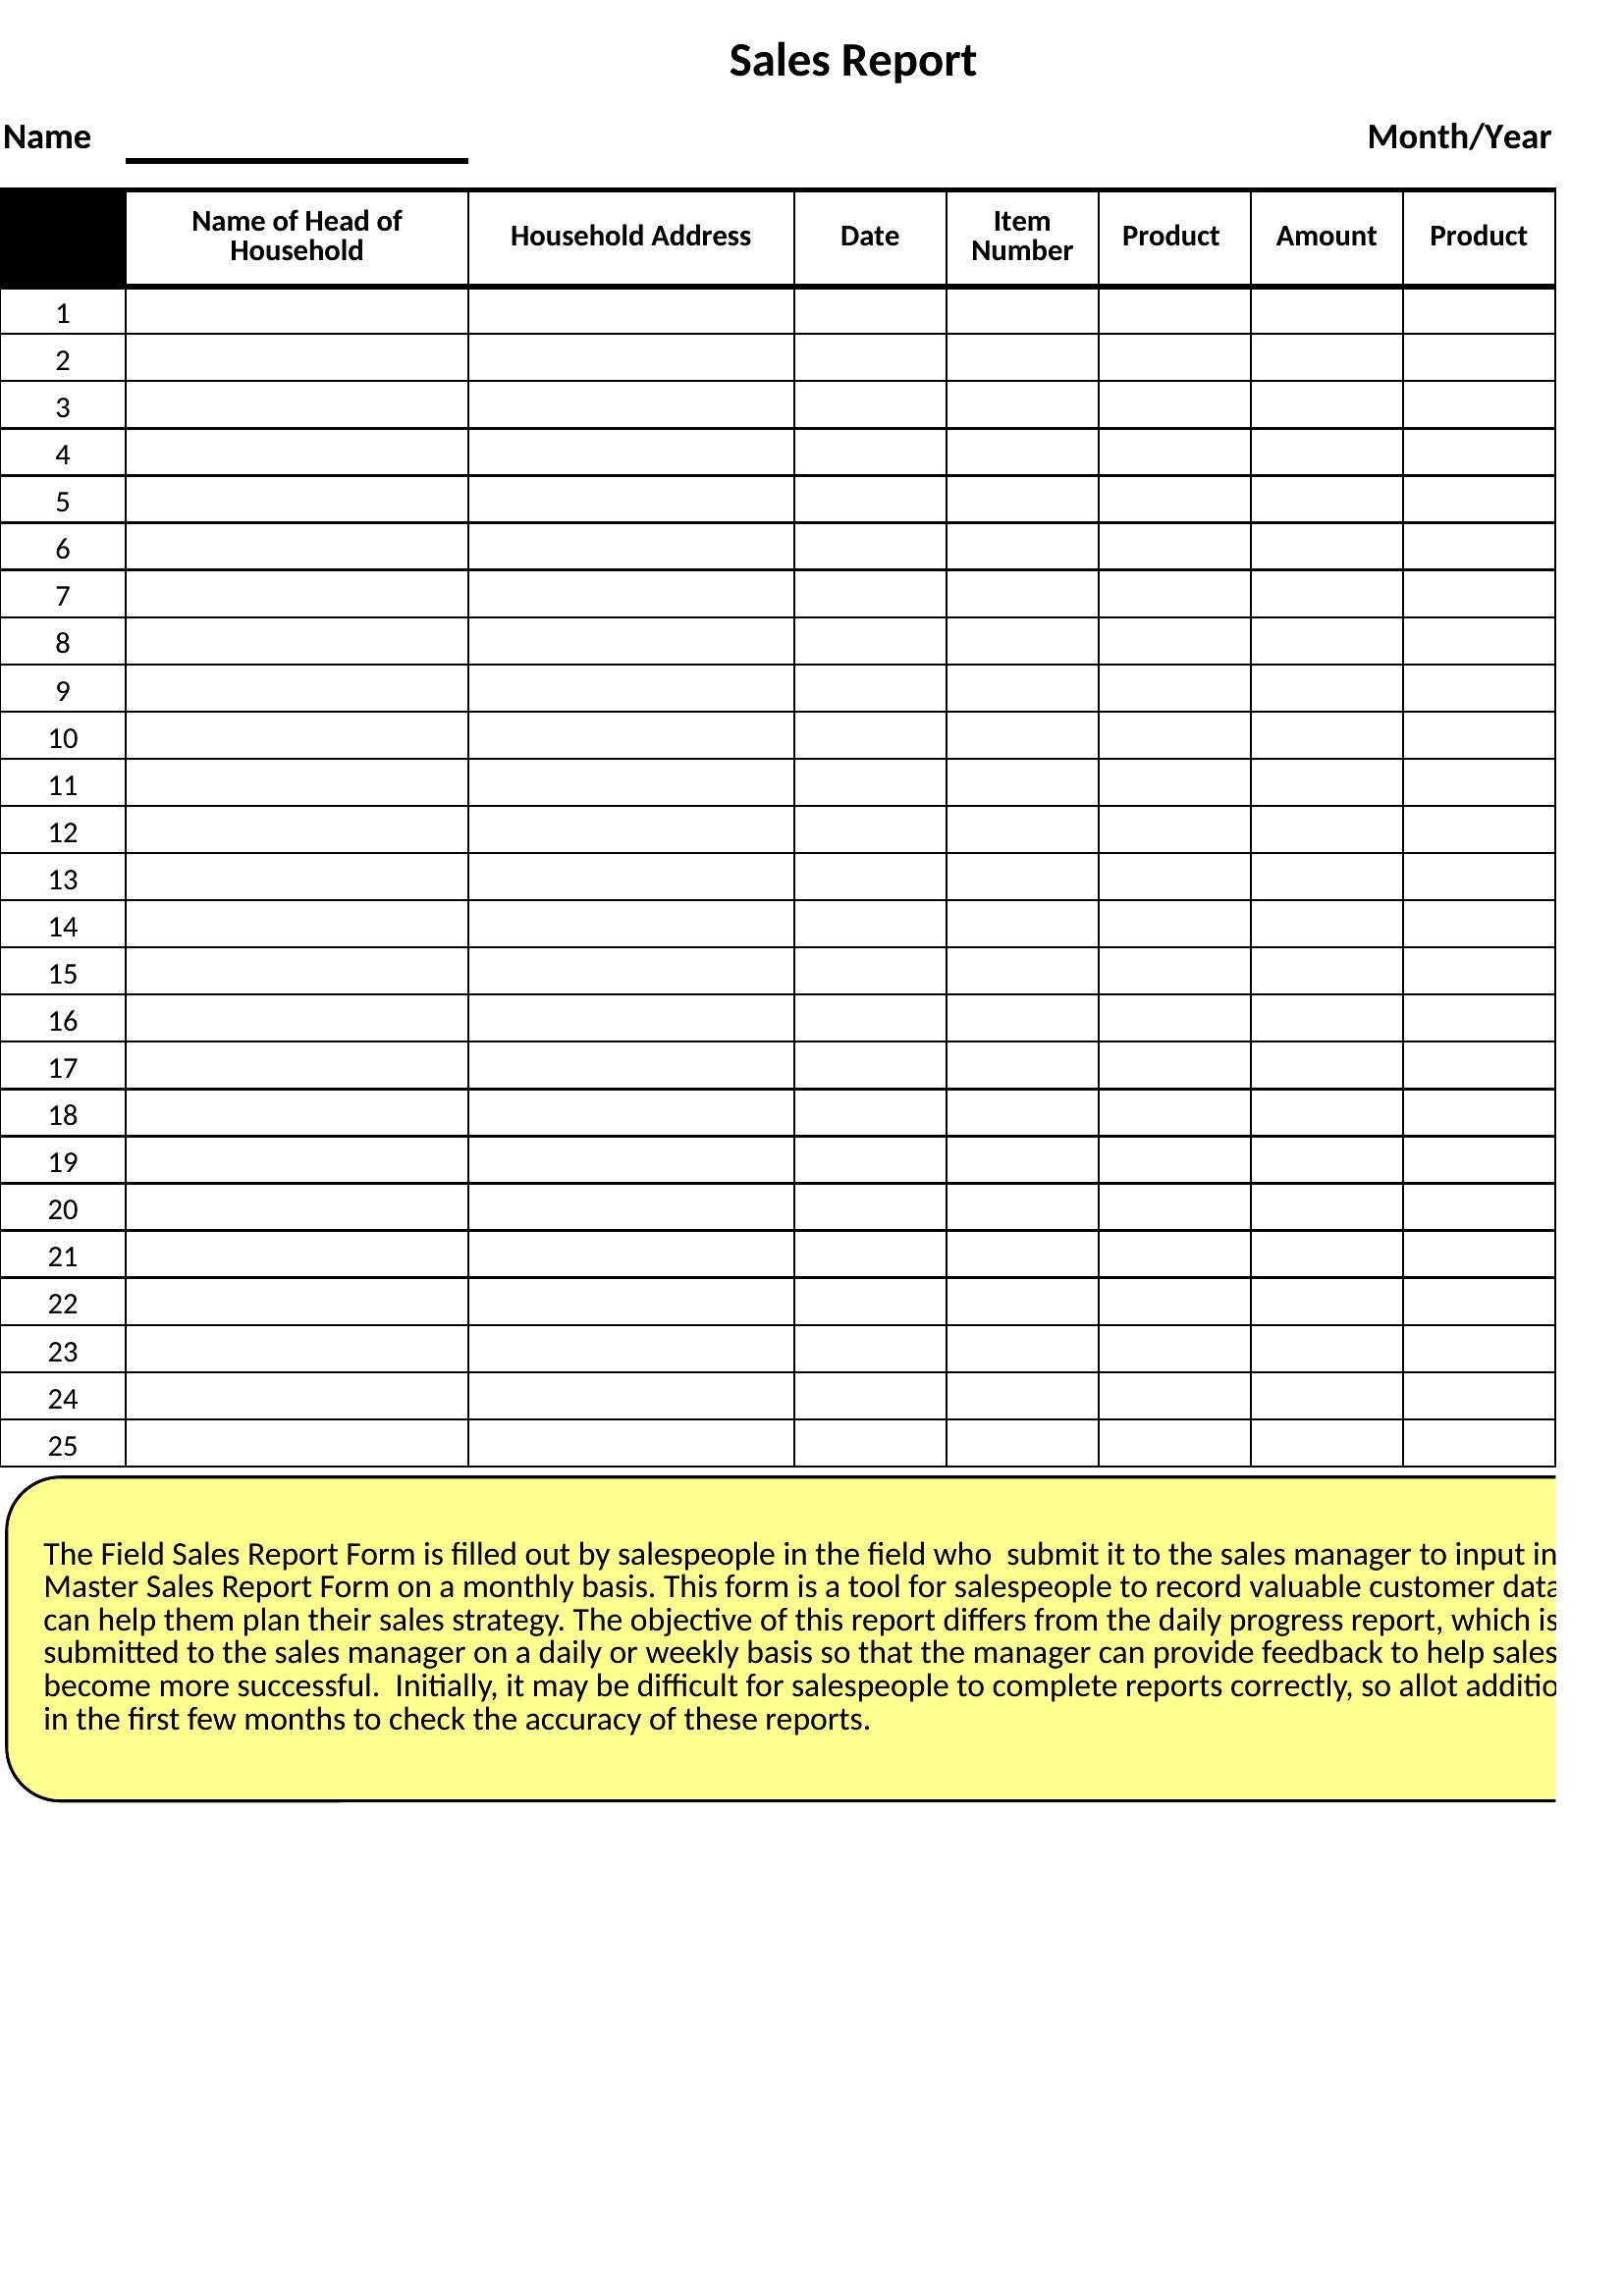
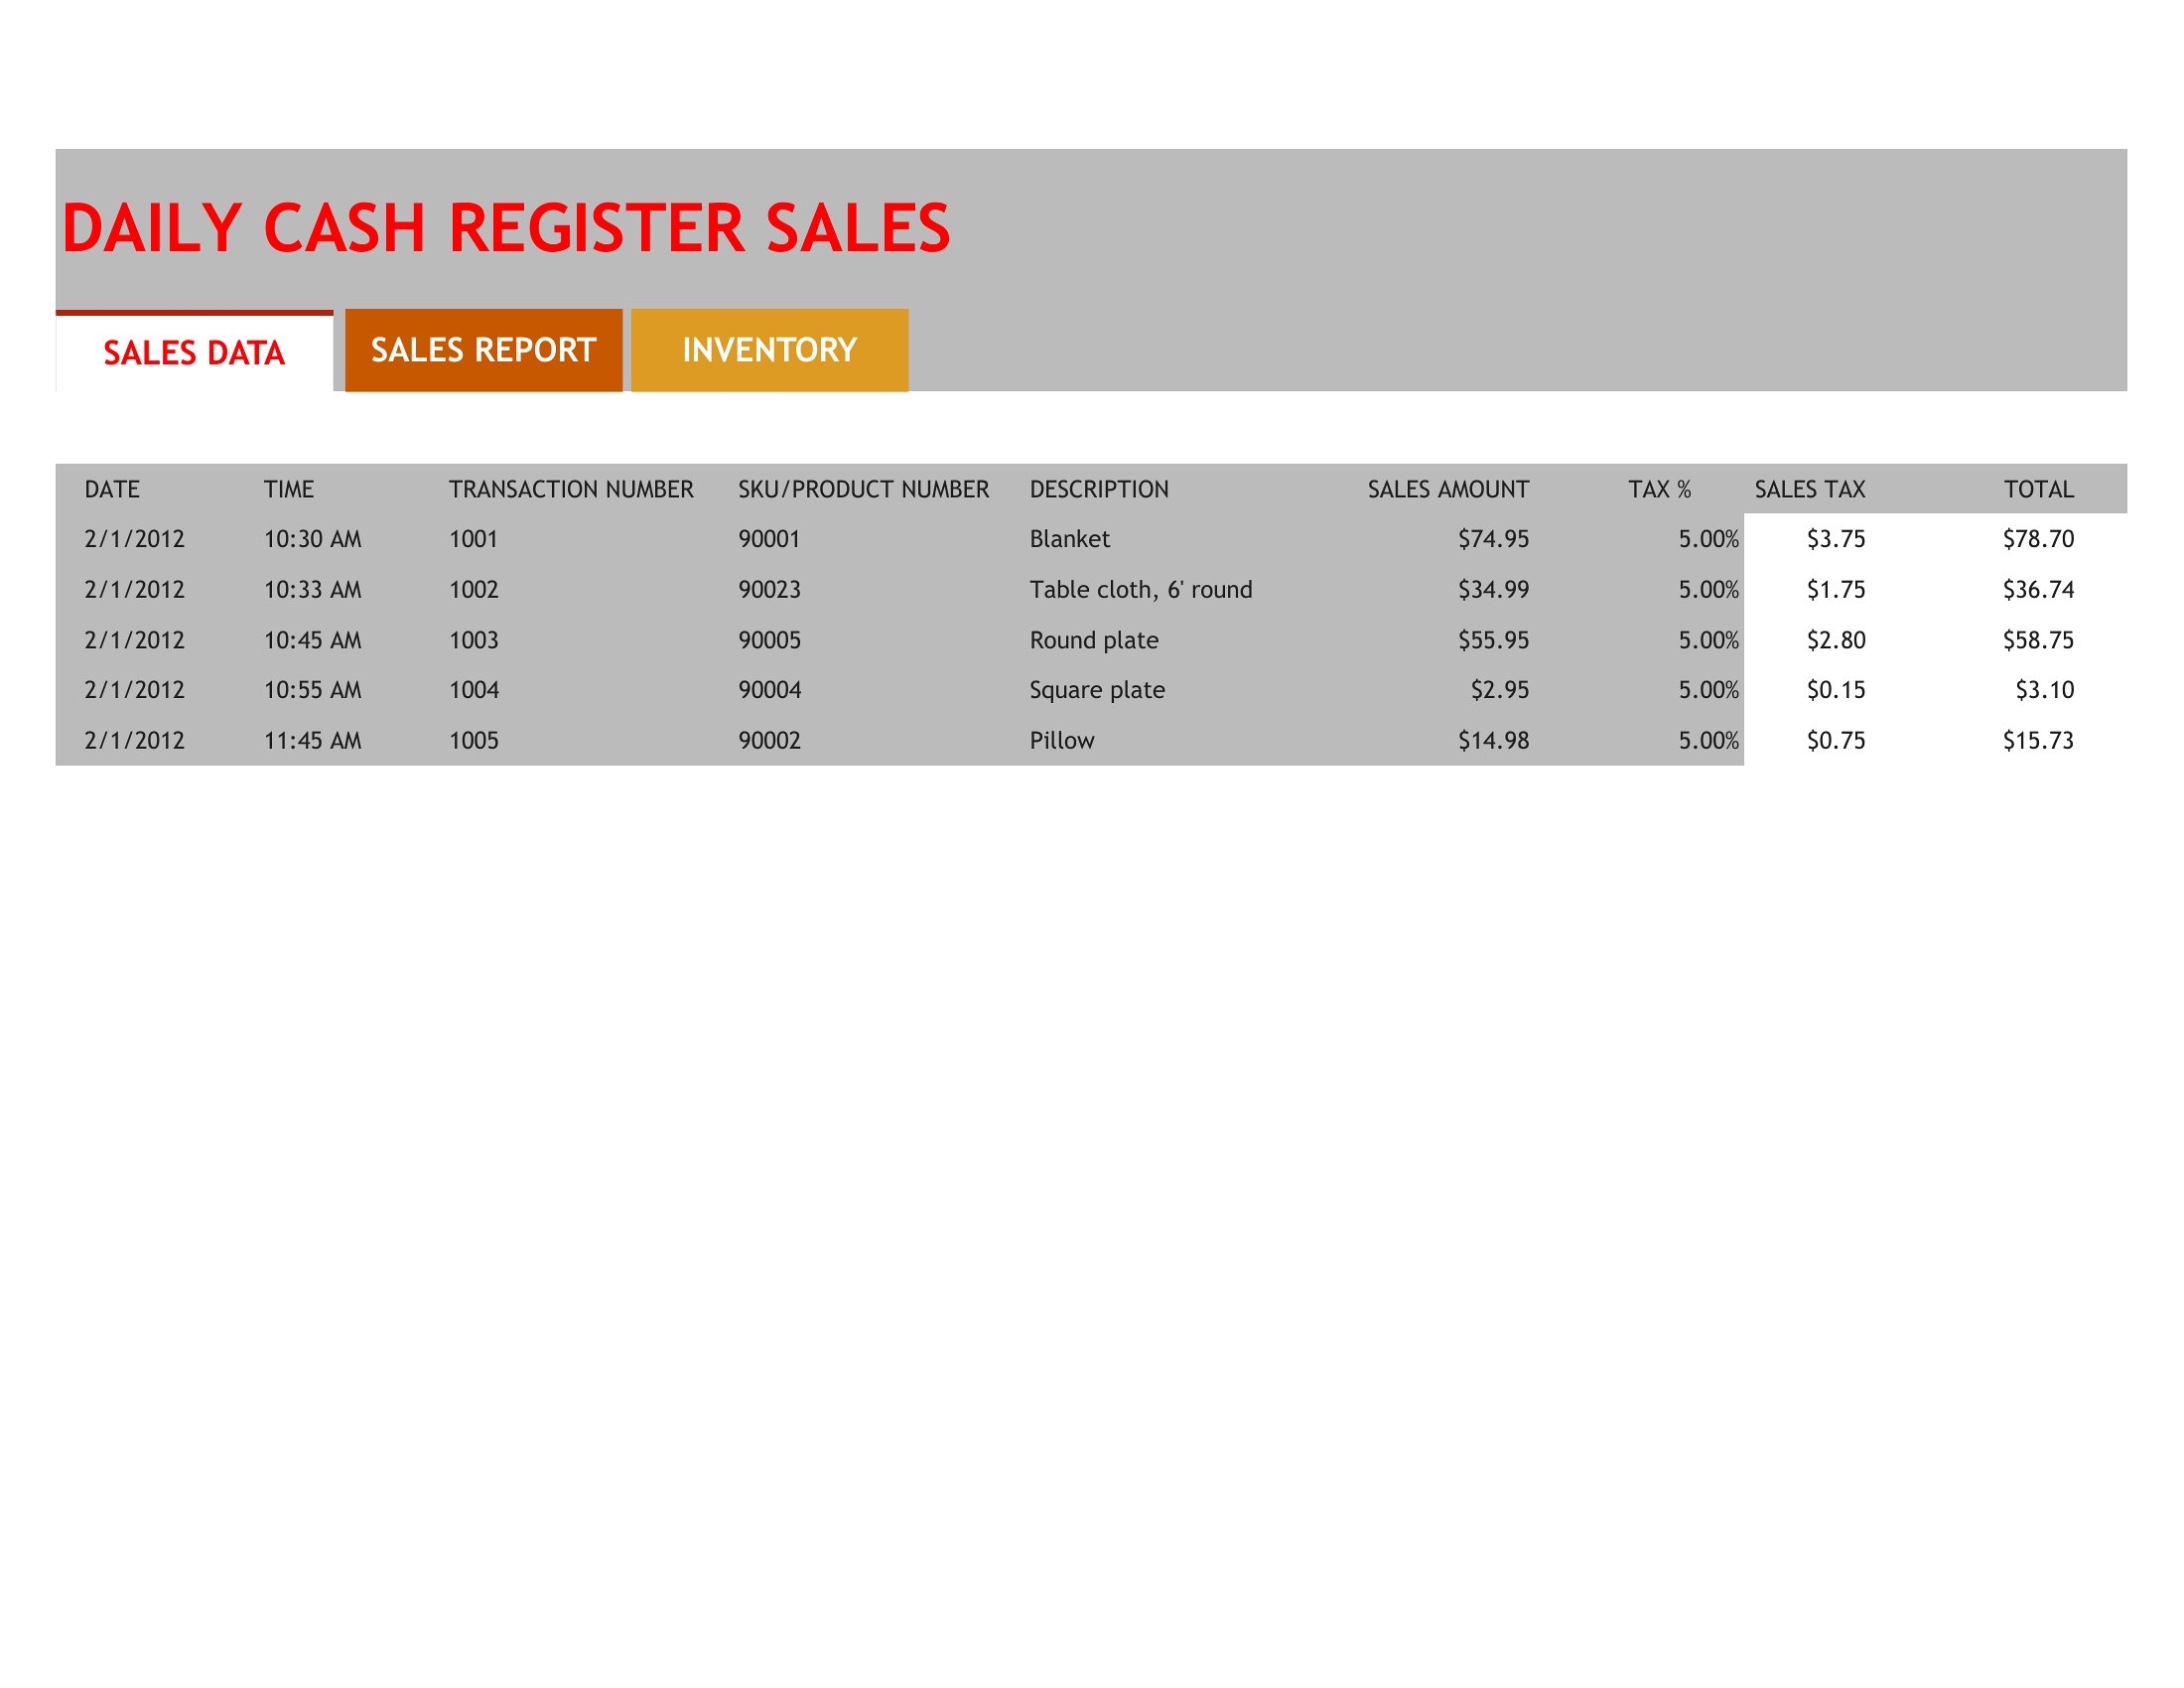
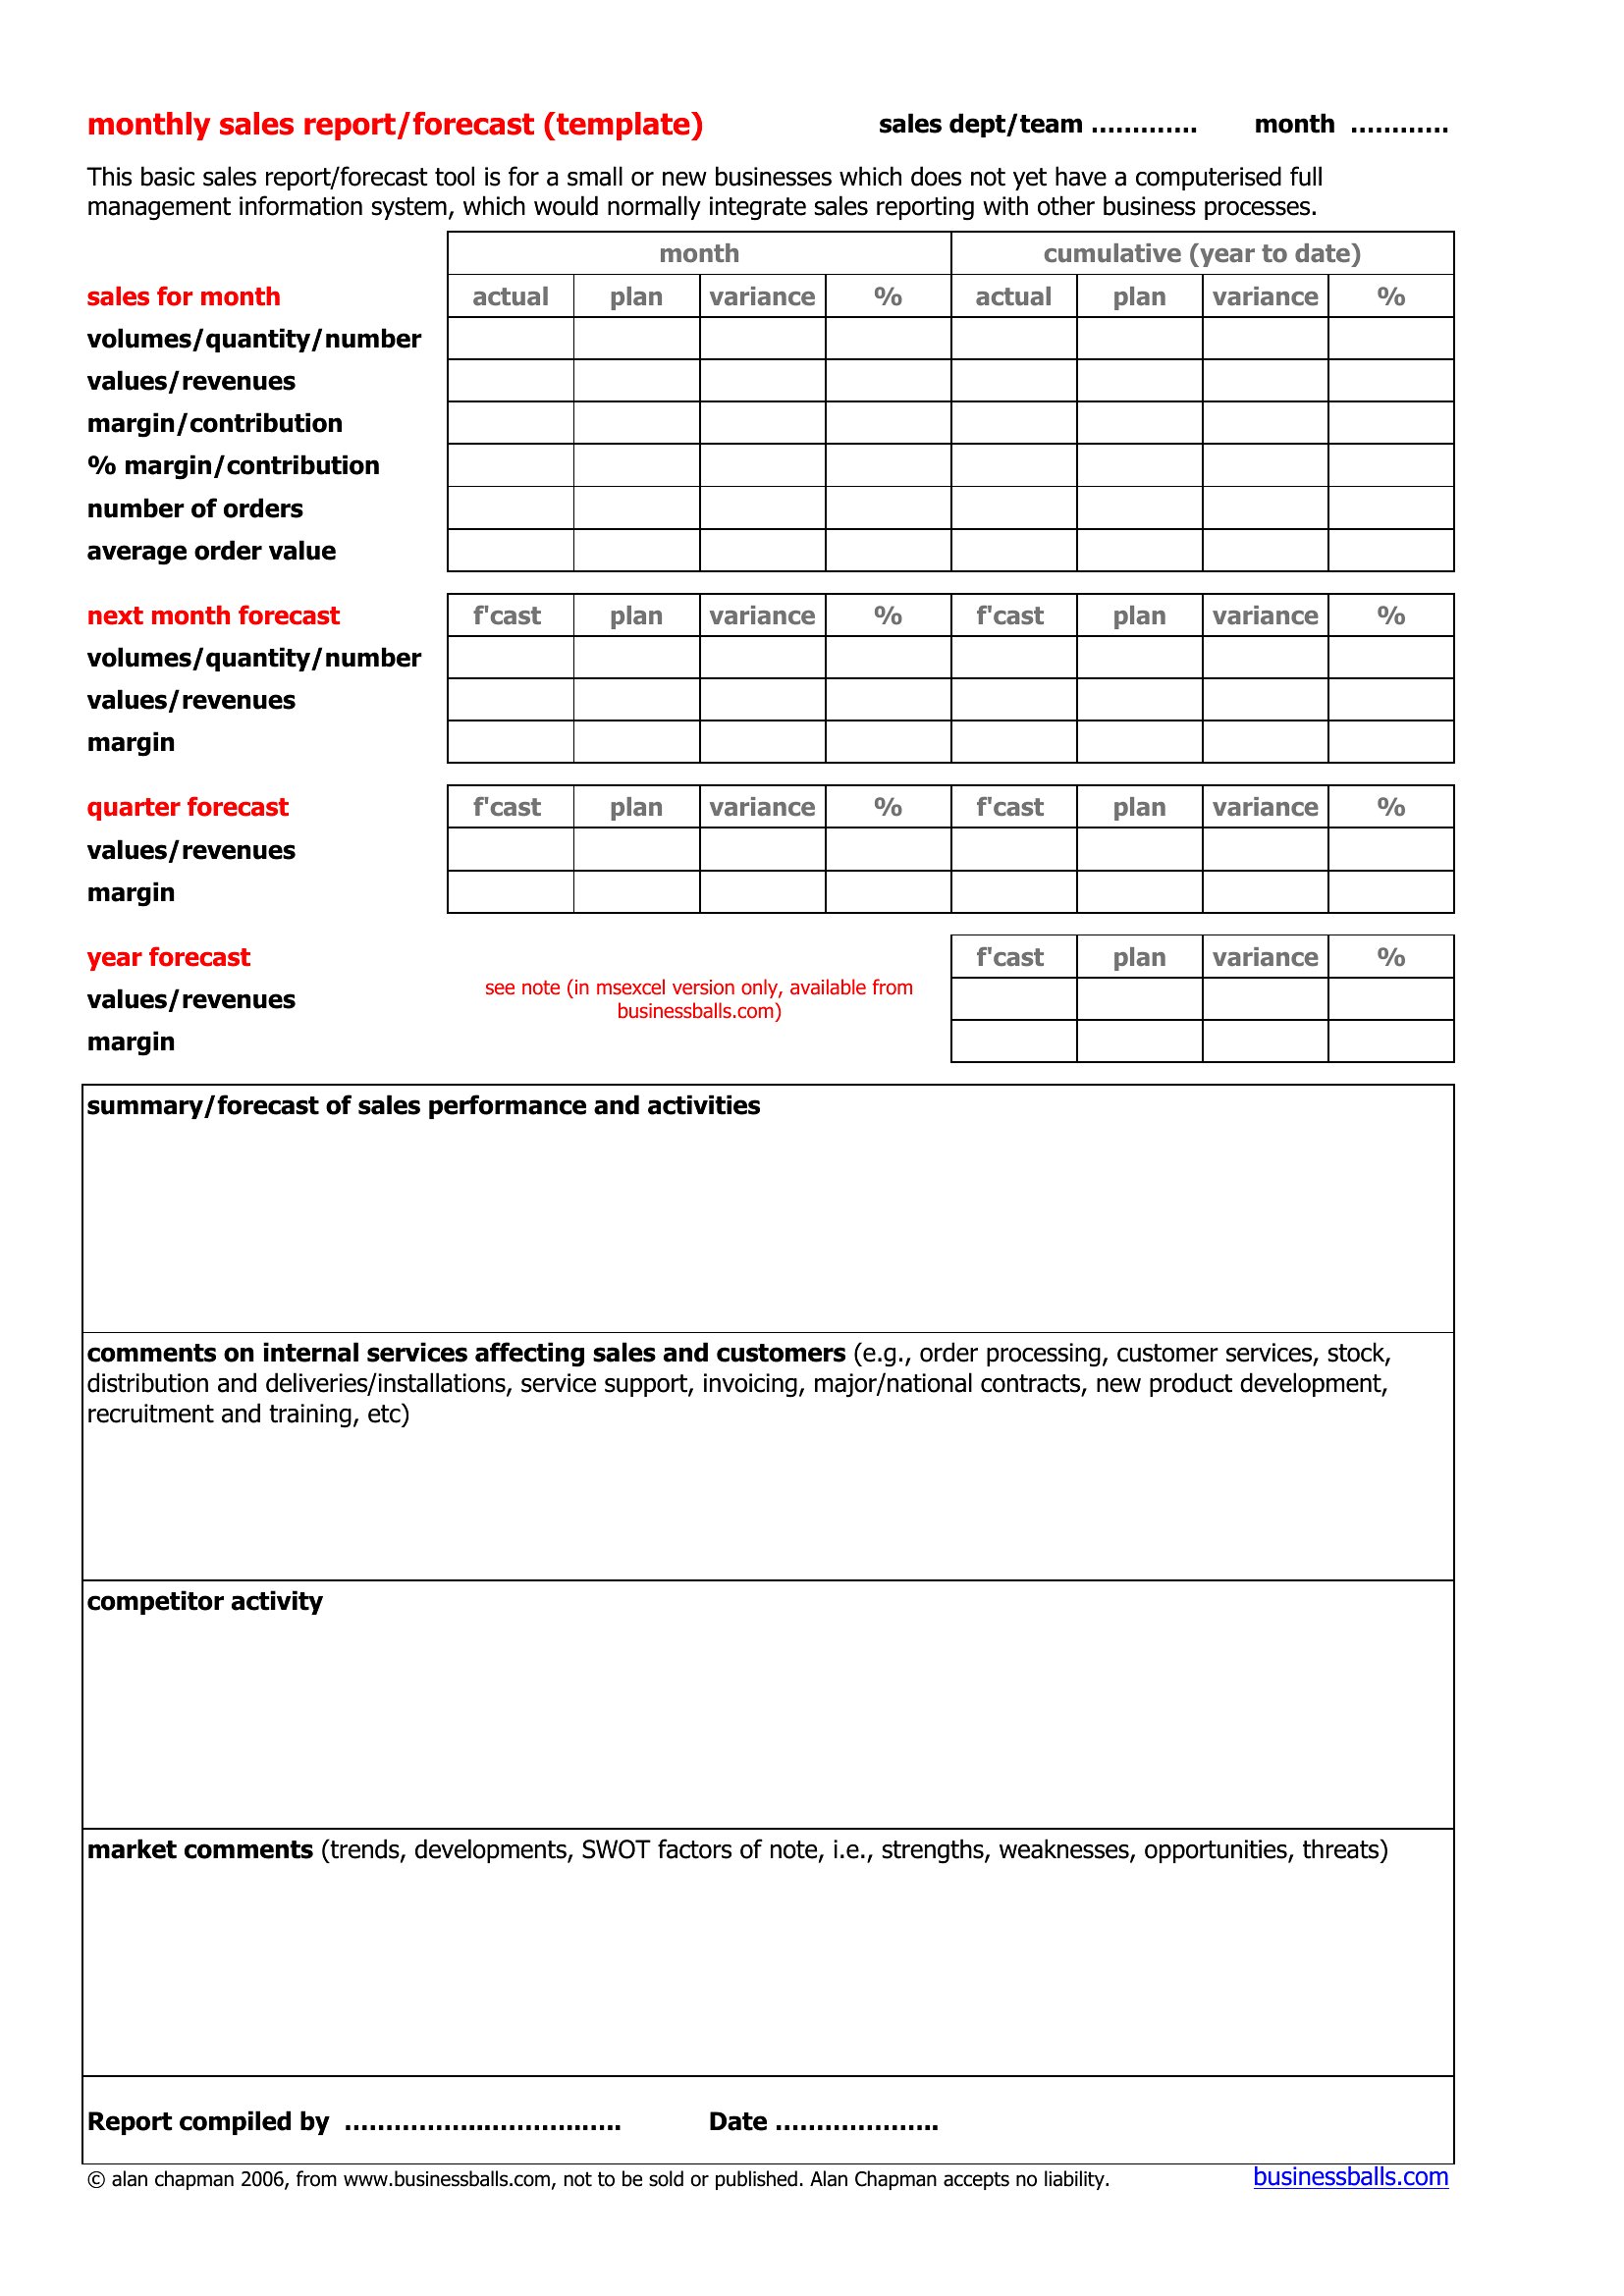
Start with a one-line summary at the top (e.g., ‘Revenue up 12% YoY, driven by Product X’), then use bullet points for top 3 takeaways. The Excel templates include chart placeholders to visualize trends—pair these with annotations like ‘Notice the dip in Q2’ to guide attention. Keep tables clean: group similar metrics (e.g., all regional sales) and leave space for handwritten notes if reviewing in meetings.
What details should I include if my team sells both products and services?
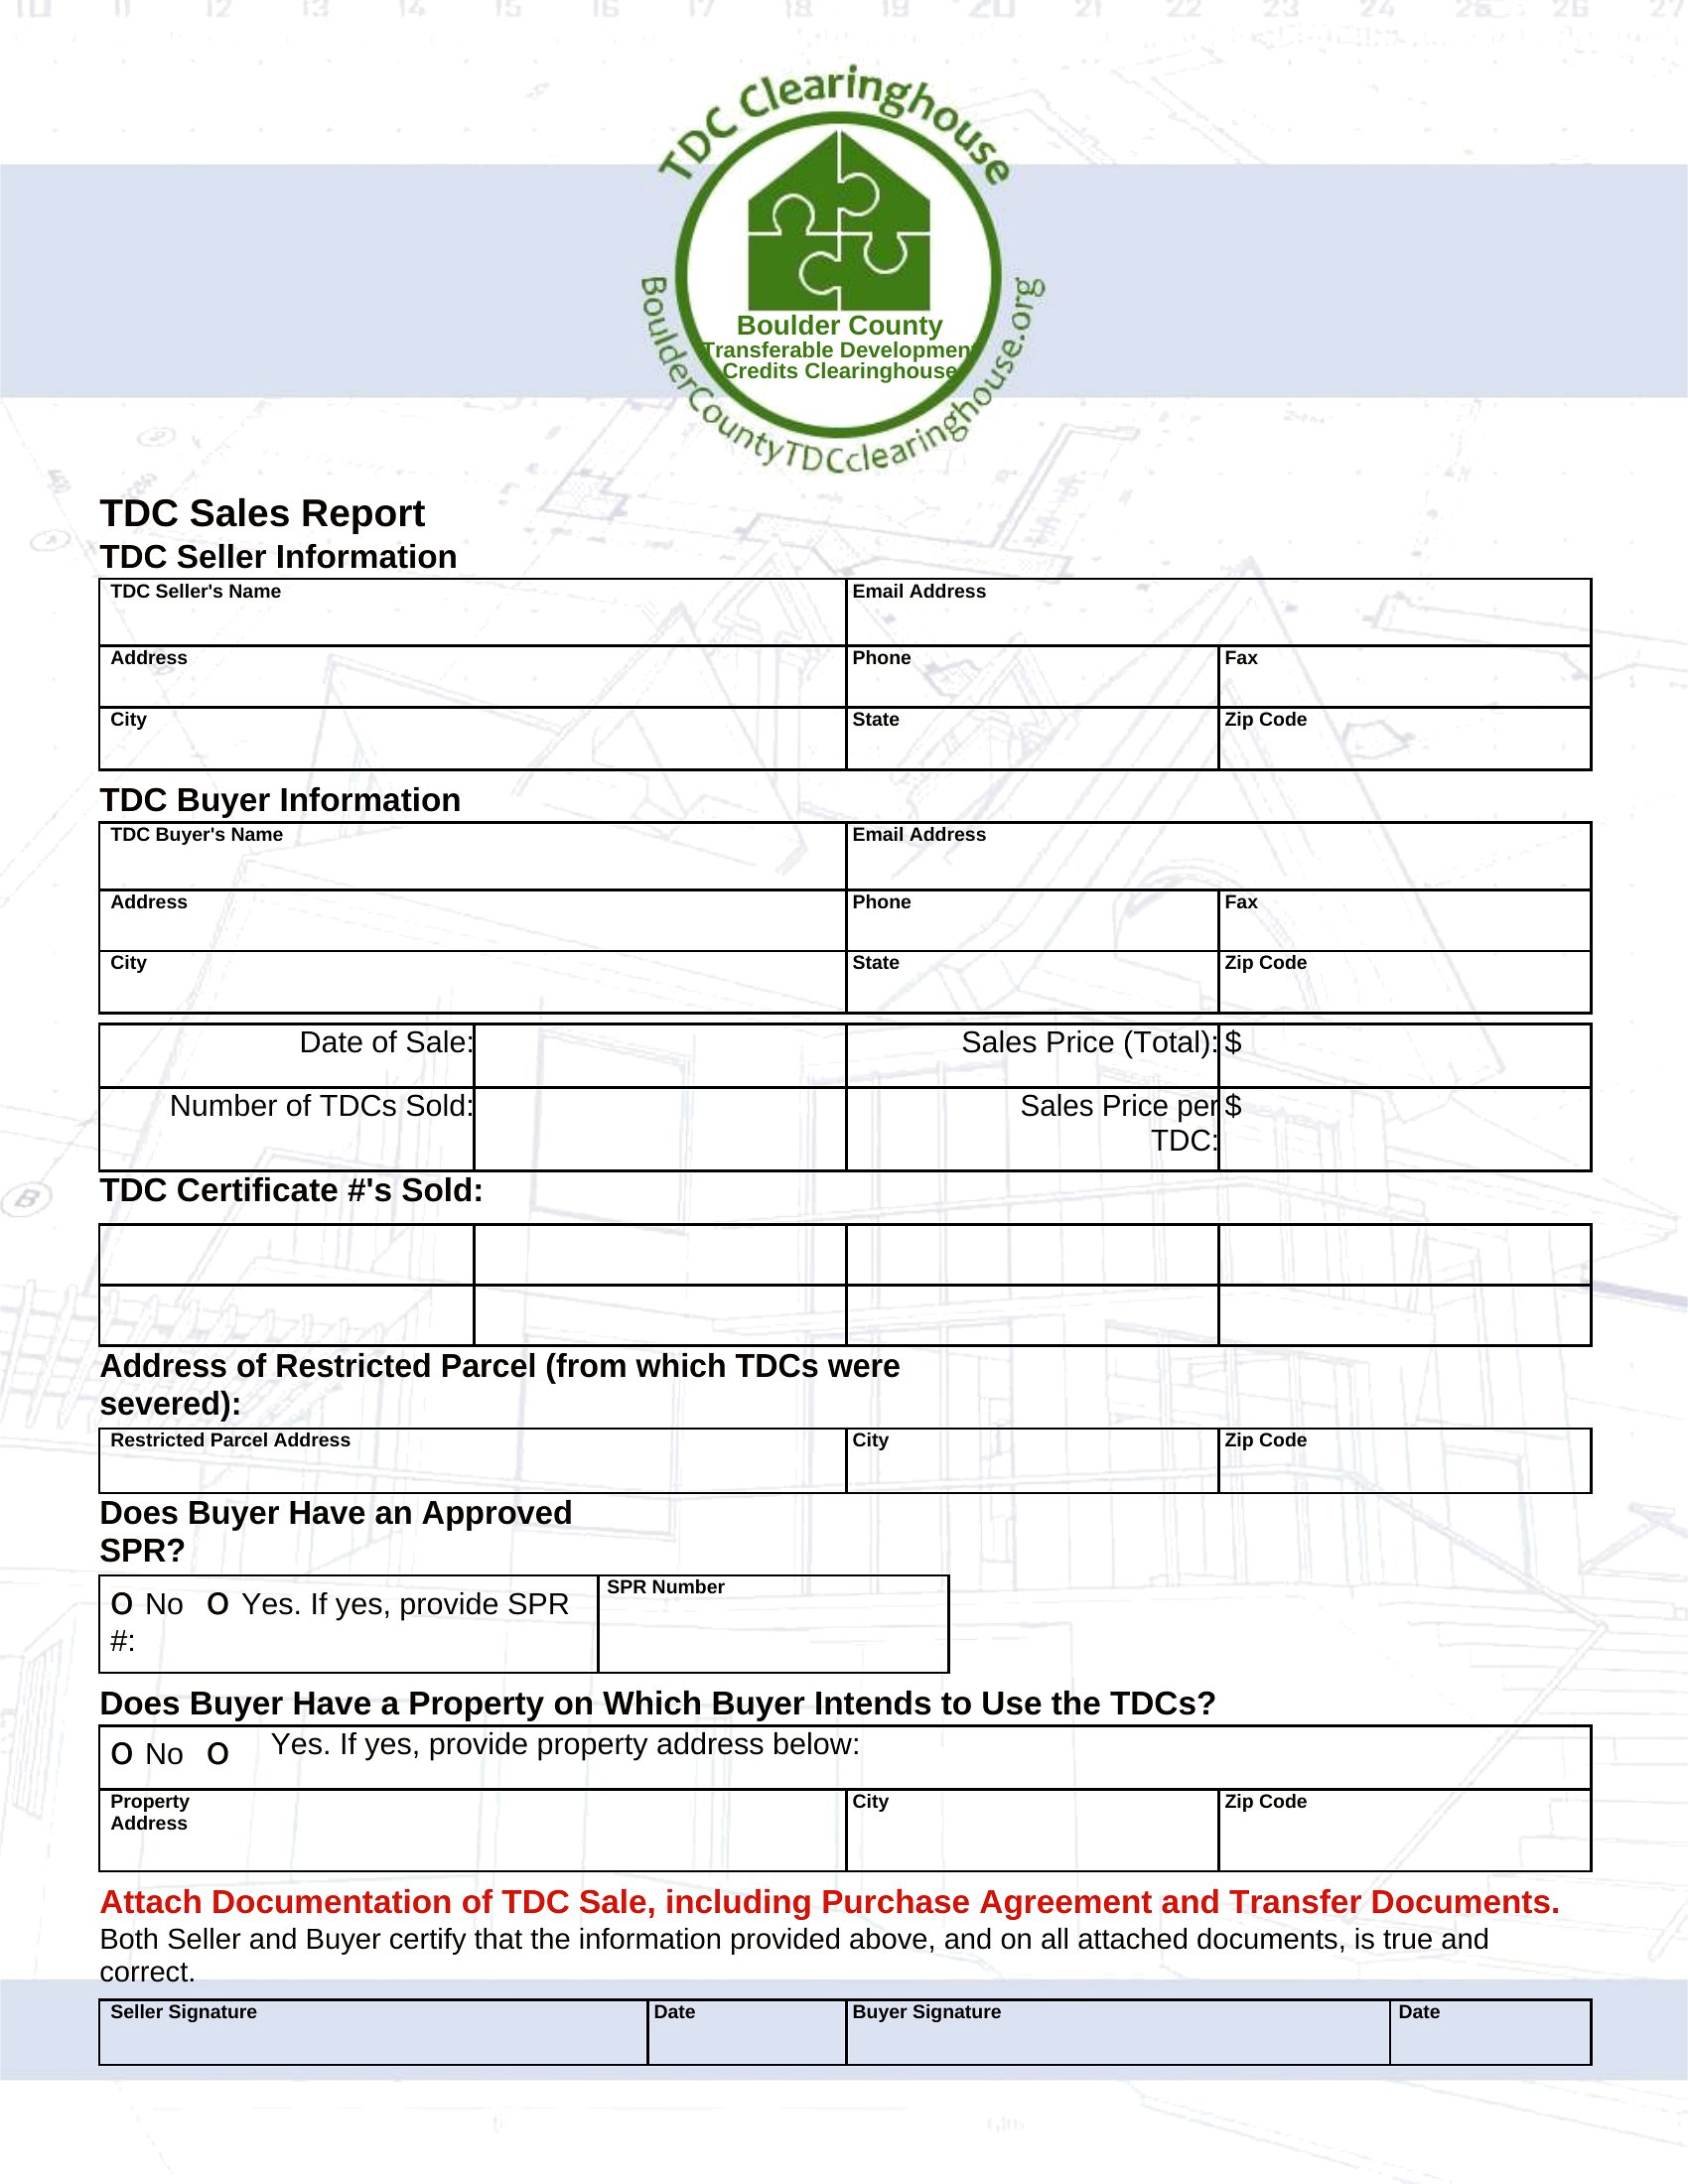
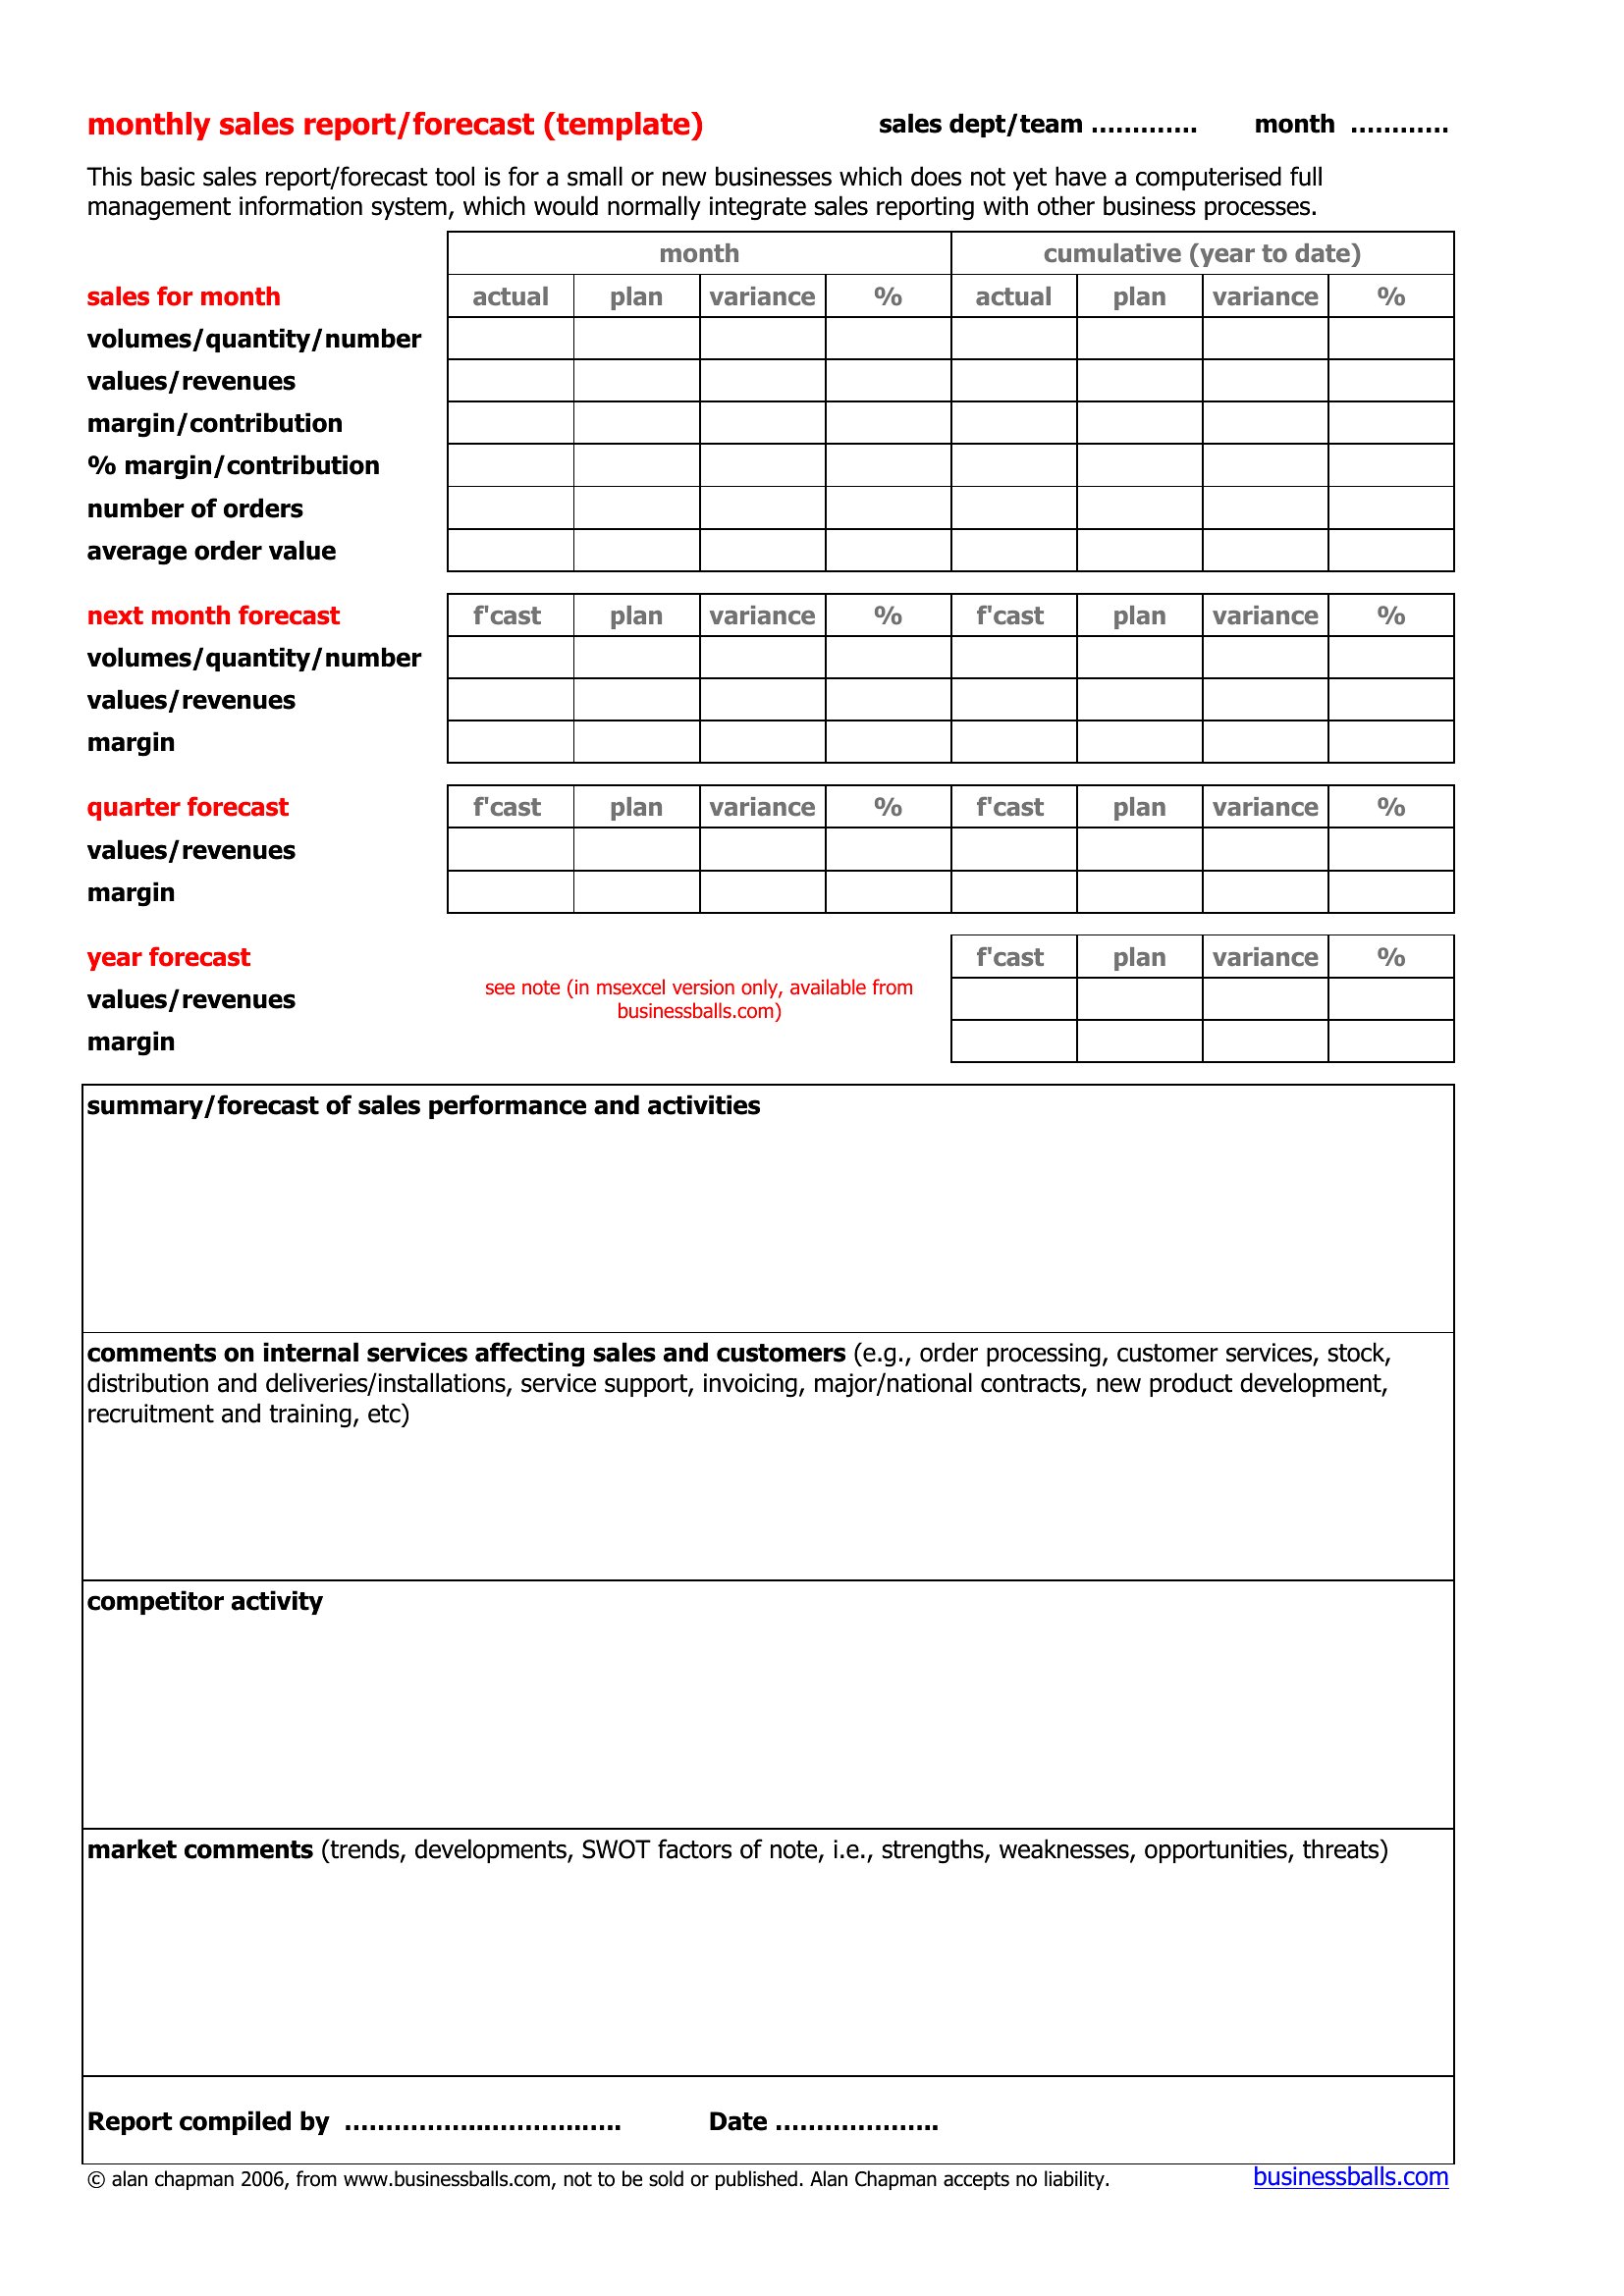
Break out revenue by category in a separate table, but tie them to shared metrics like customer acquisition cost or average deal size. Use the Word templates’ section dividers to separate product margins from service hours billed. For Excel, consider a pivot table to compare contribution margins side by side. Note if any services require follow-up work (e.g., ‘30% of service revenue pending Phase 2 approval’).
Can these templates help explain sales drops to skeptical leadership?
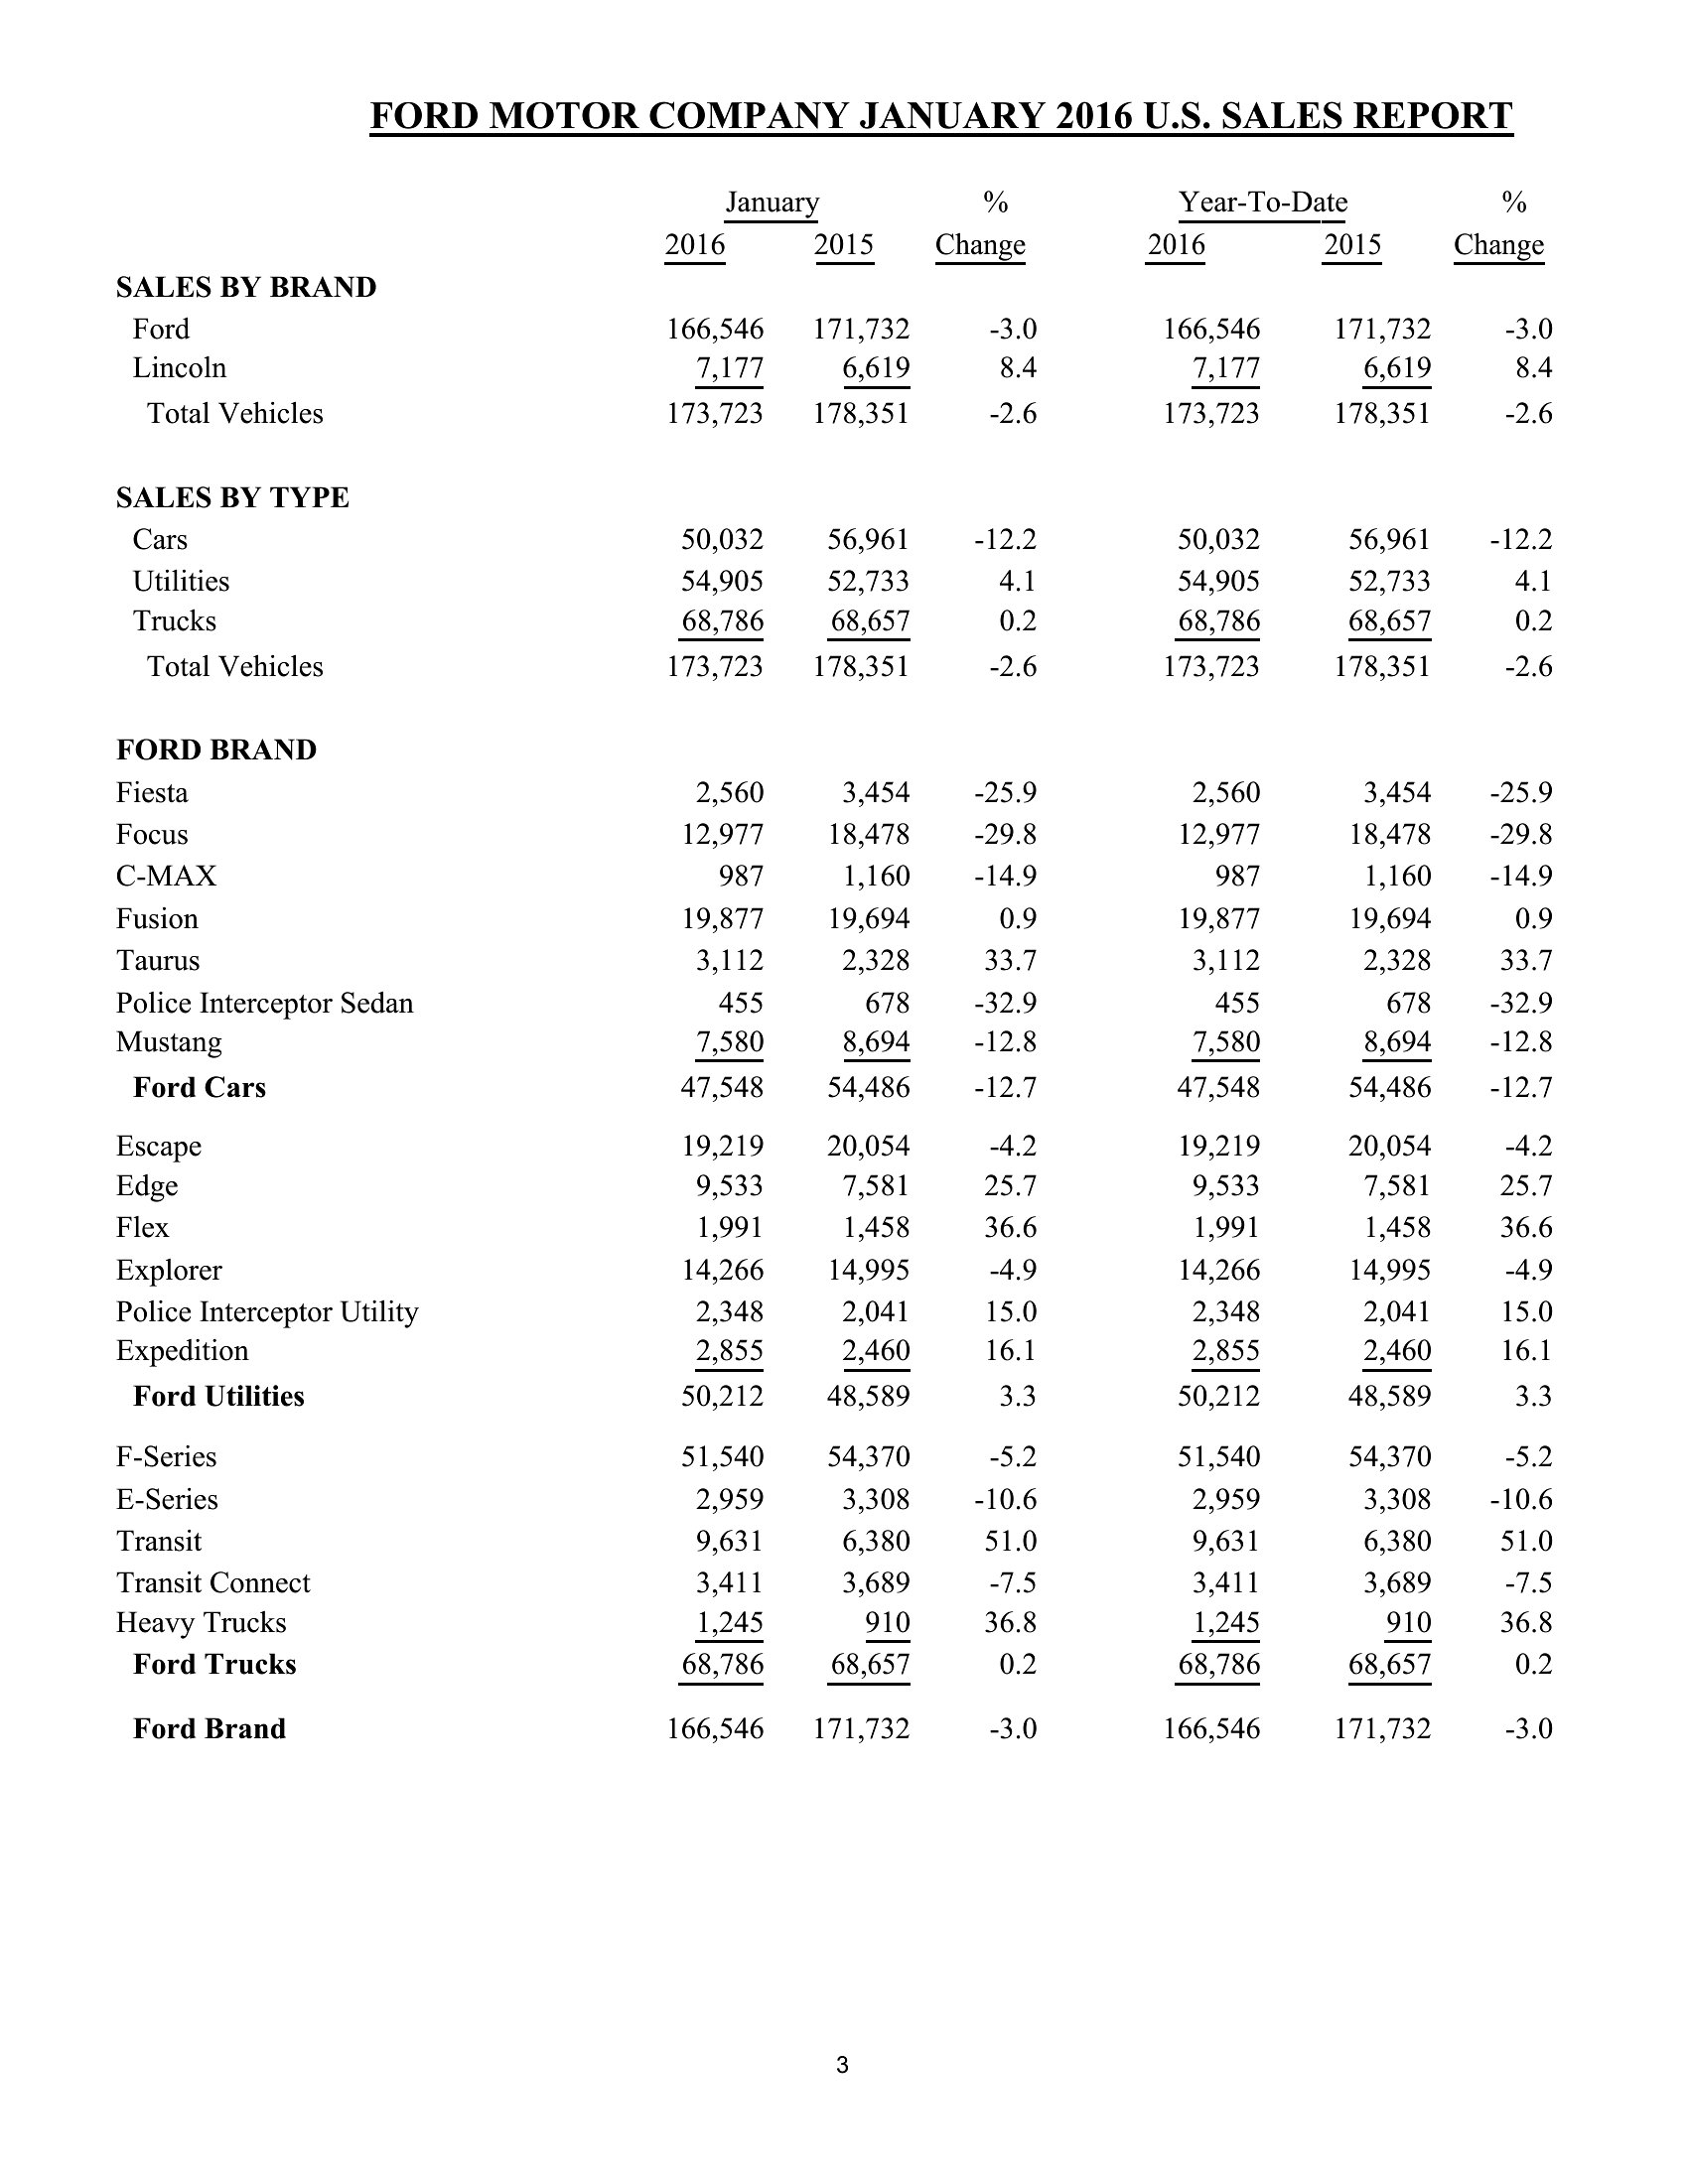
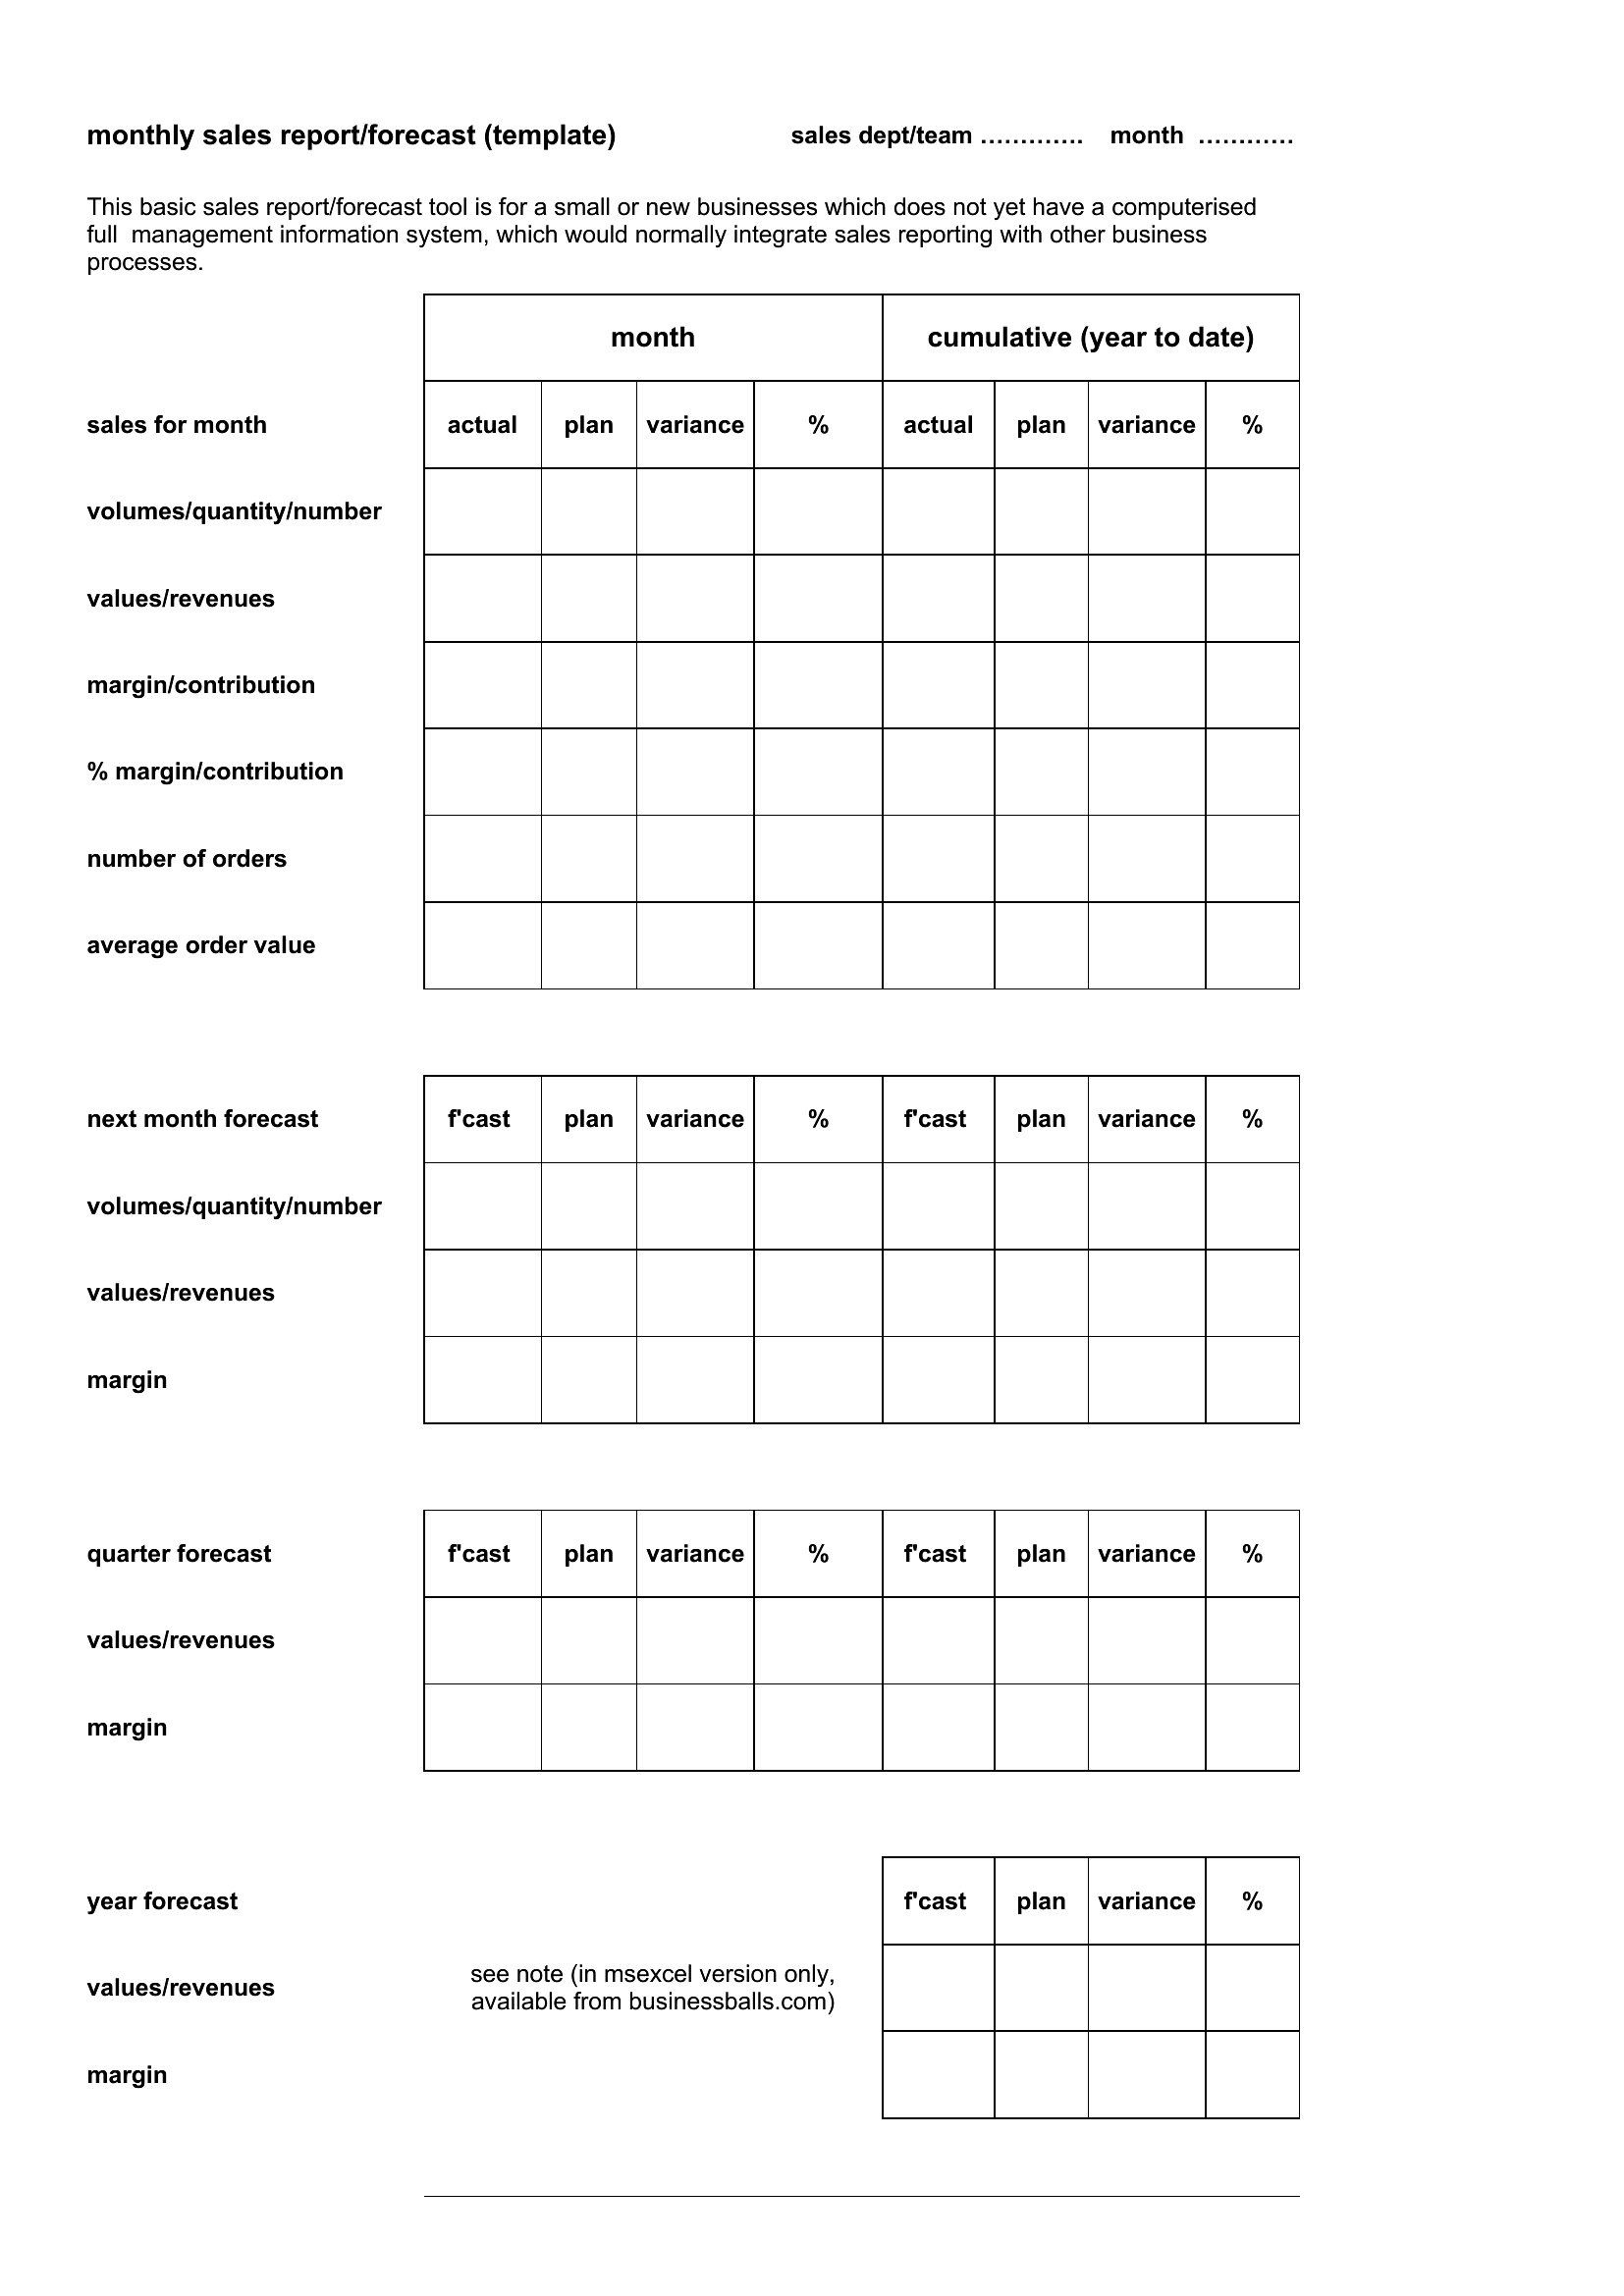
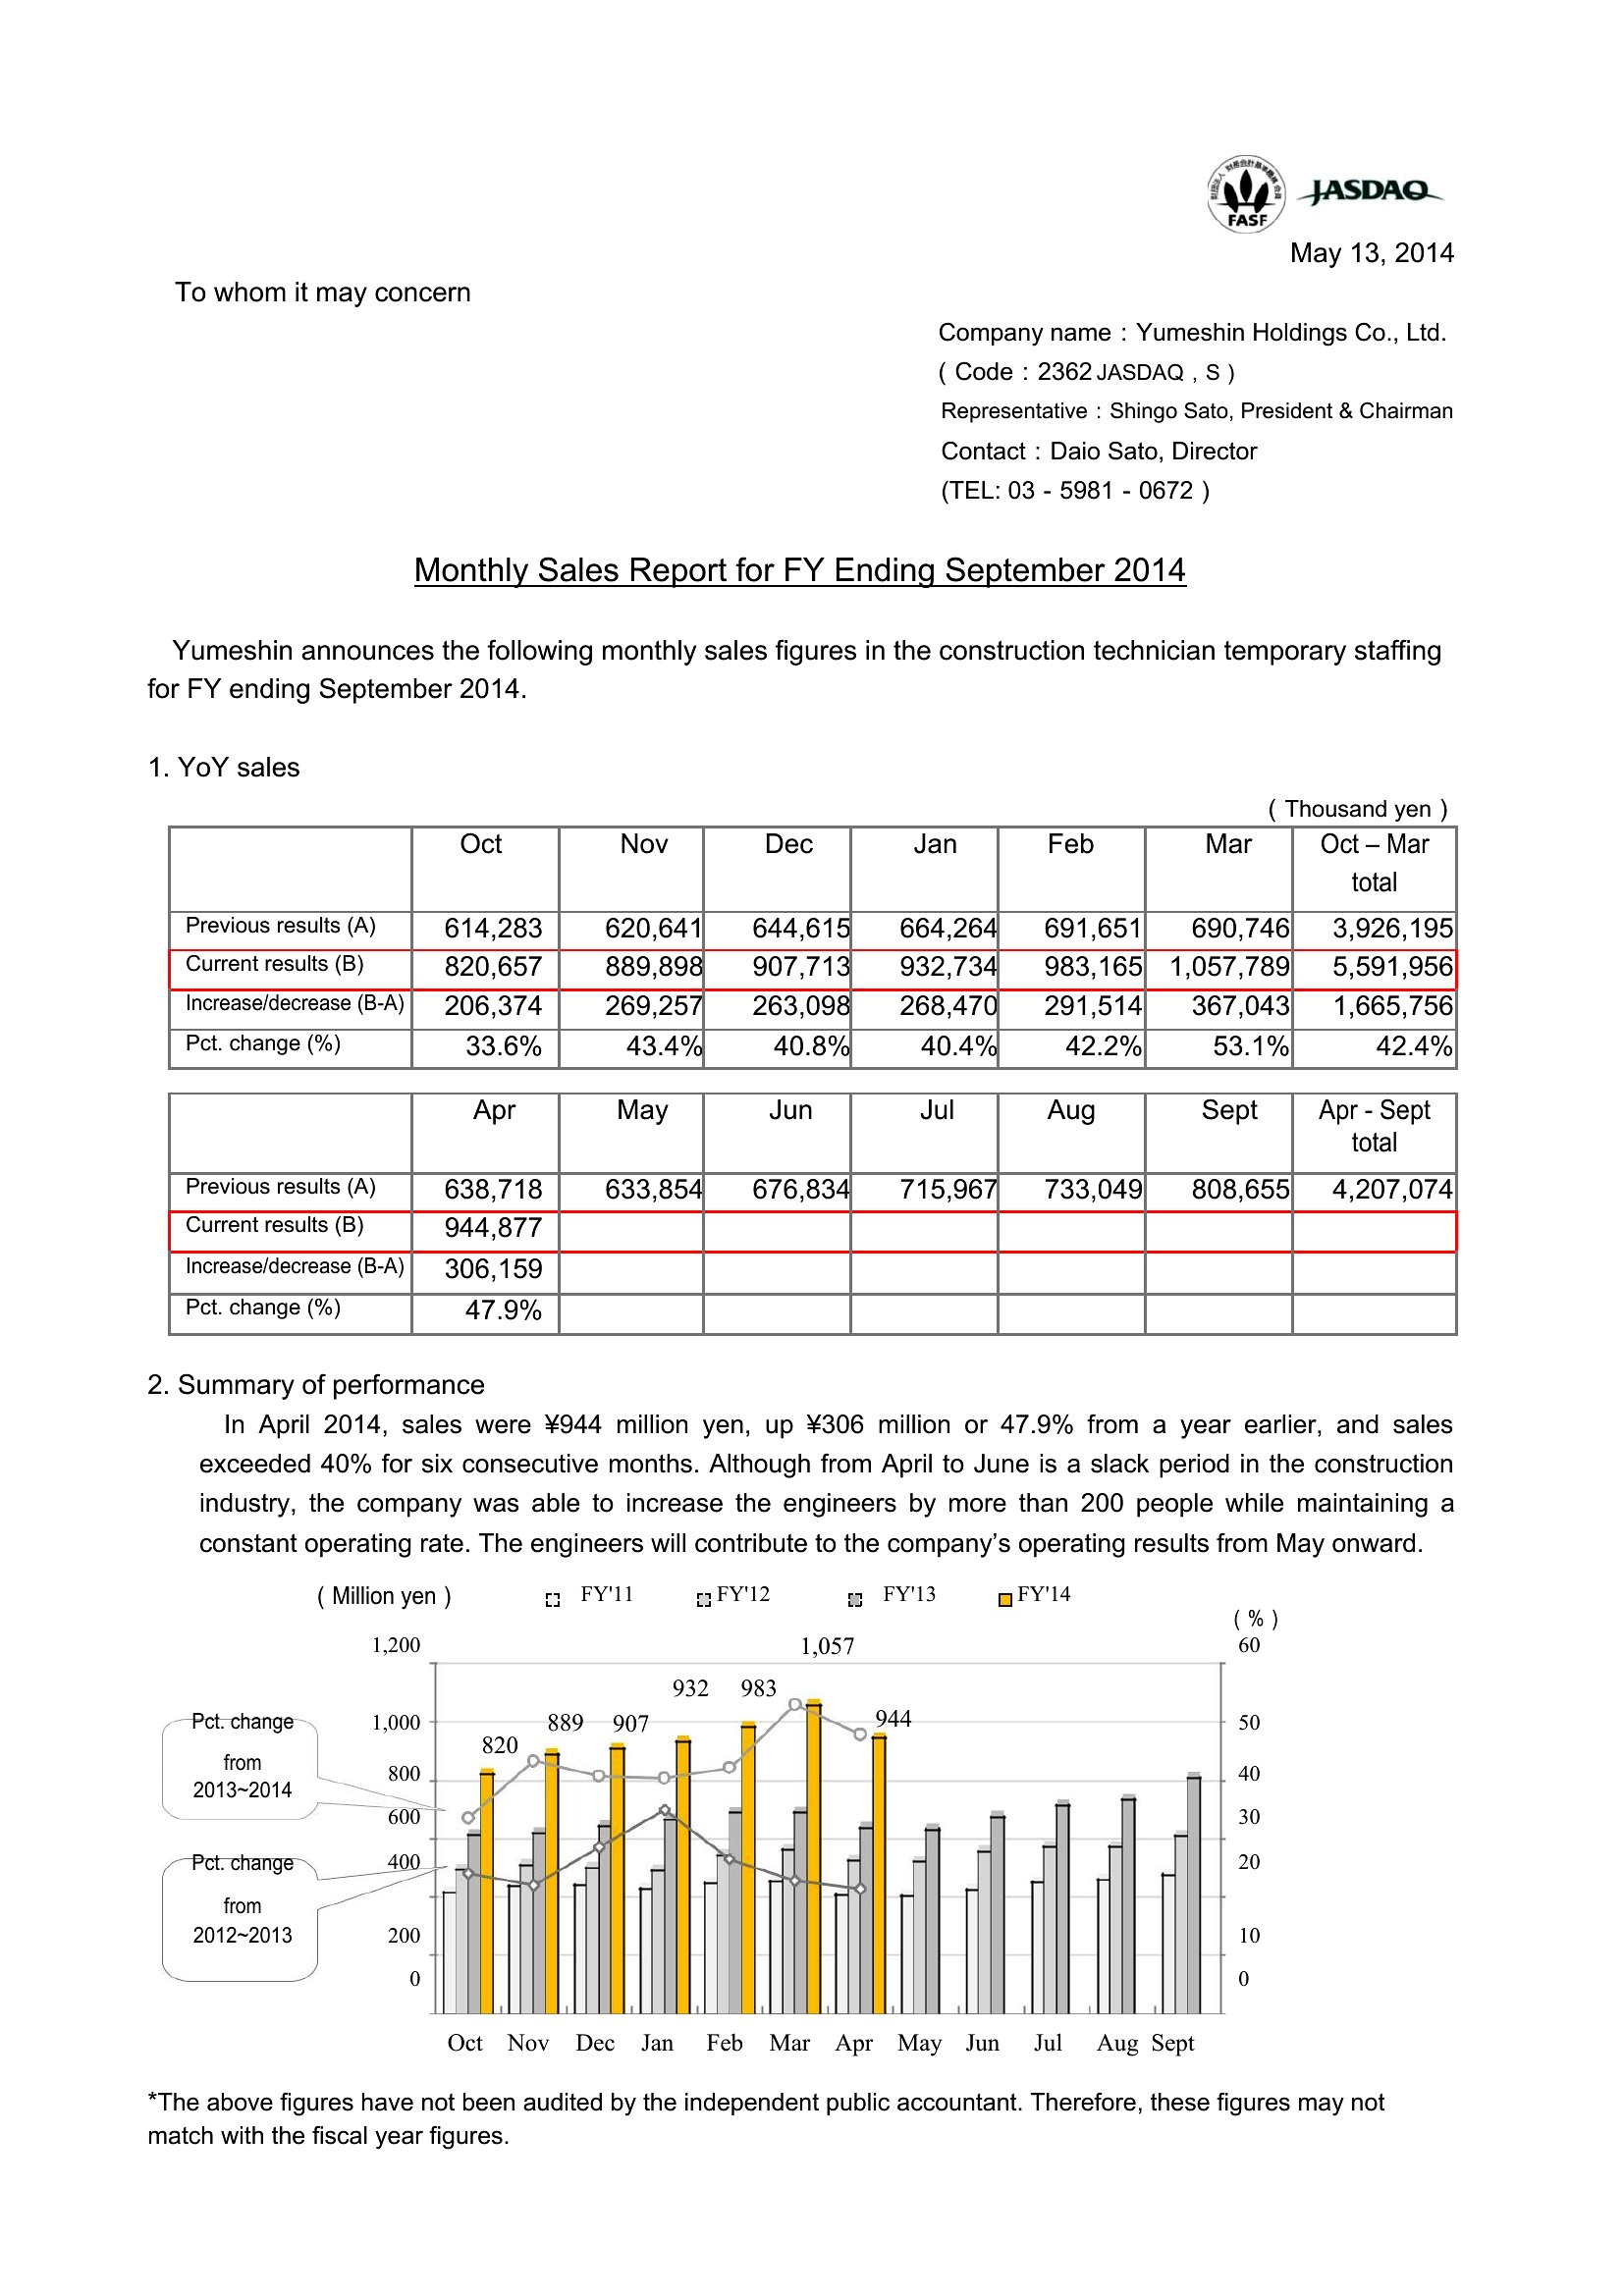
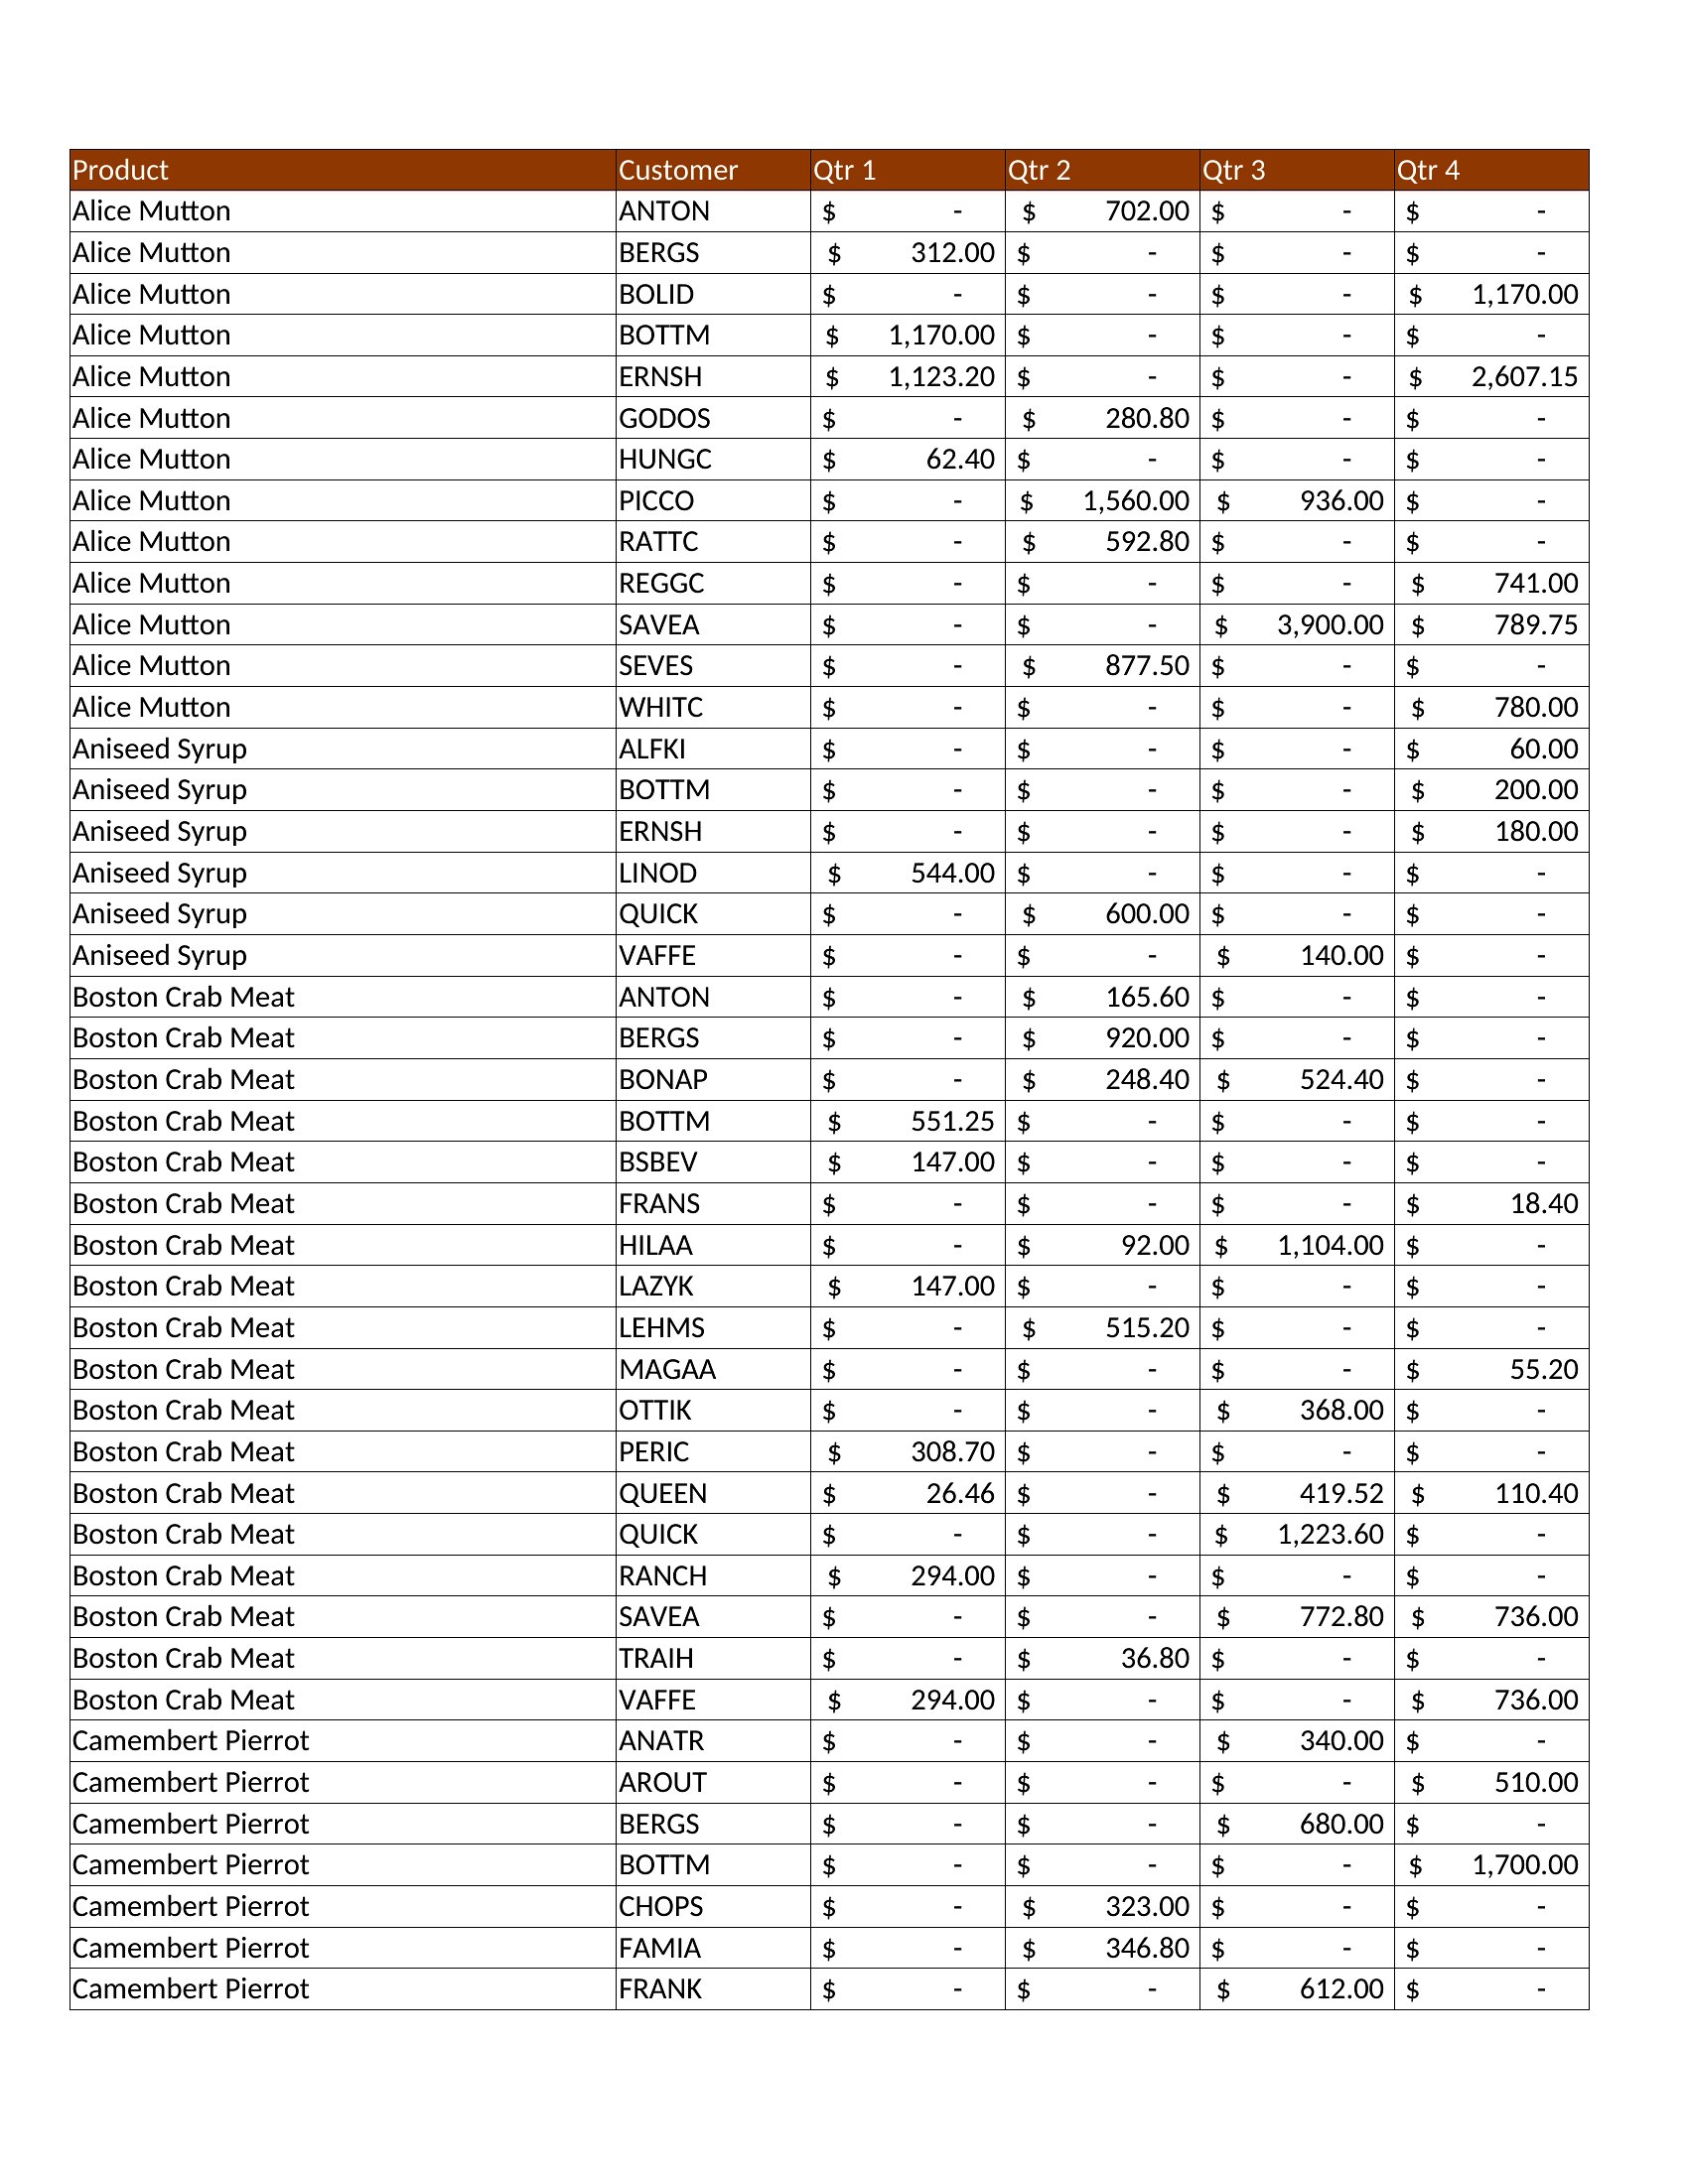
Yes—the Excel templates include trend lines and ‘% change’ columns to frame declines as part of a larger pattern (e.g., ‘Q1 dip aligns with industry benchmark of -8%’). Add a ‘Root Cause’ section in Word or a highlighted comment in Excel to address external factors like supply chain delays or internal issues like onboarding delays. Use the ‘Notes’ field to outline proposed actions, like reallocating the marketing budget or retraining the team on a specific product line.
Comments
Join the conversation
Sign in to share your thoughts and leave a comment on this resource.