Skip to content
50% off this one-time $1.99 pack with HALFOFF — or unlimited with Pro.HALFOFF
Premium

Free Sales Report Templates (Word, Excel, PDF)
Analysis
ulricorocha by ulricorocha
Updated 0 downloads 2 community comments

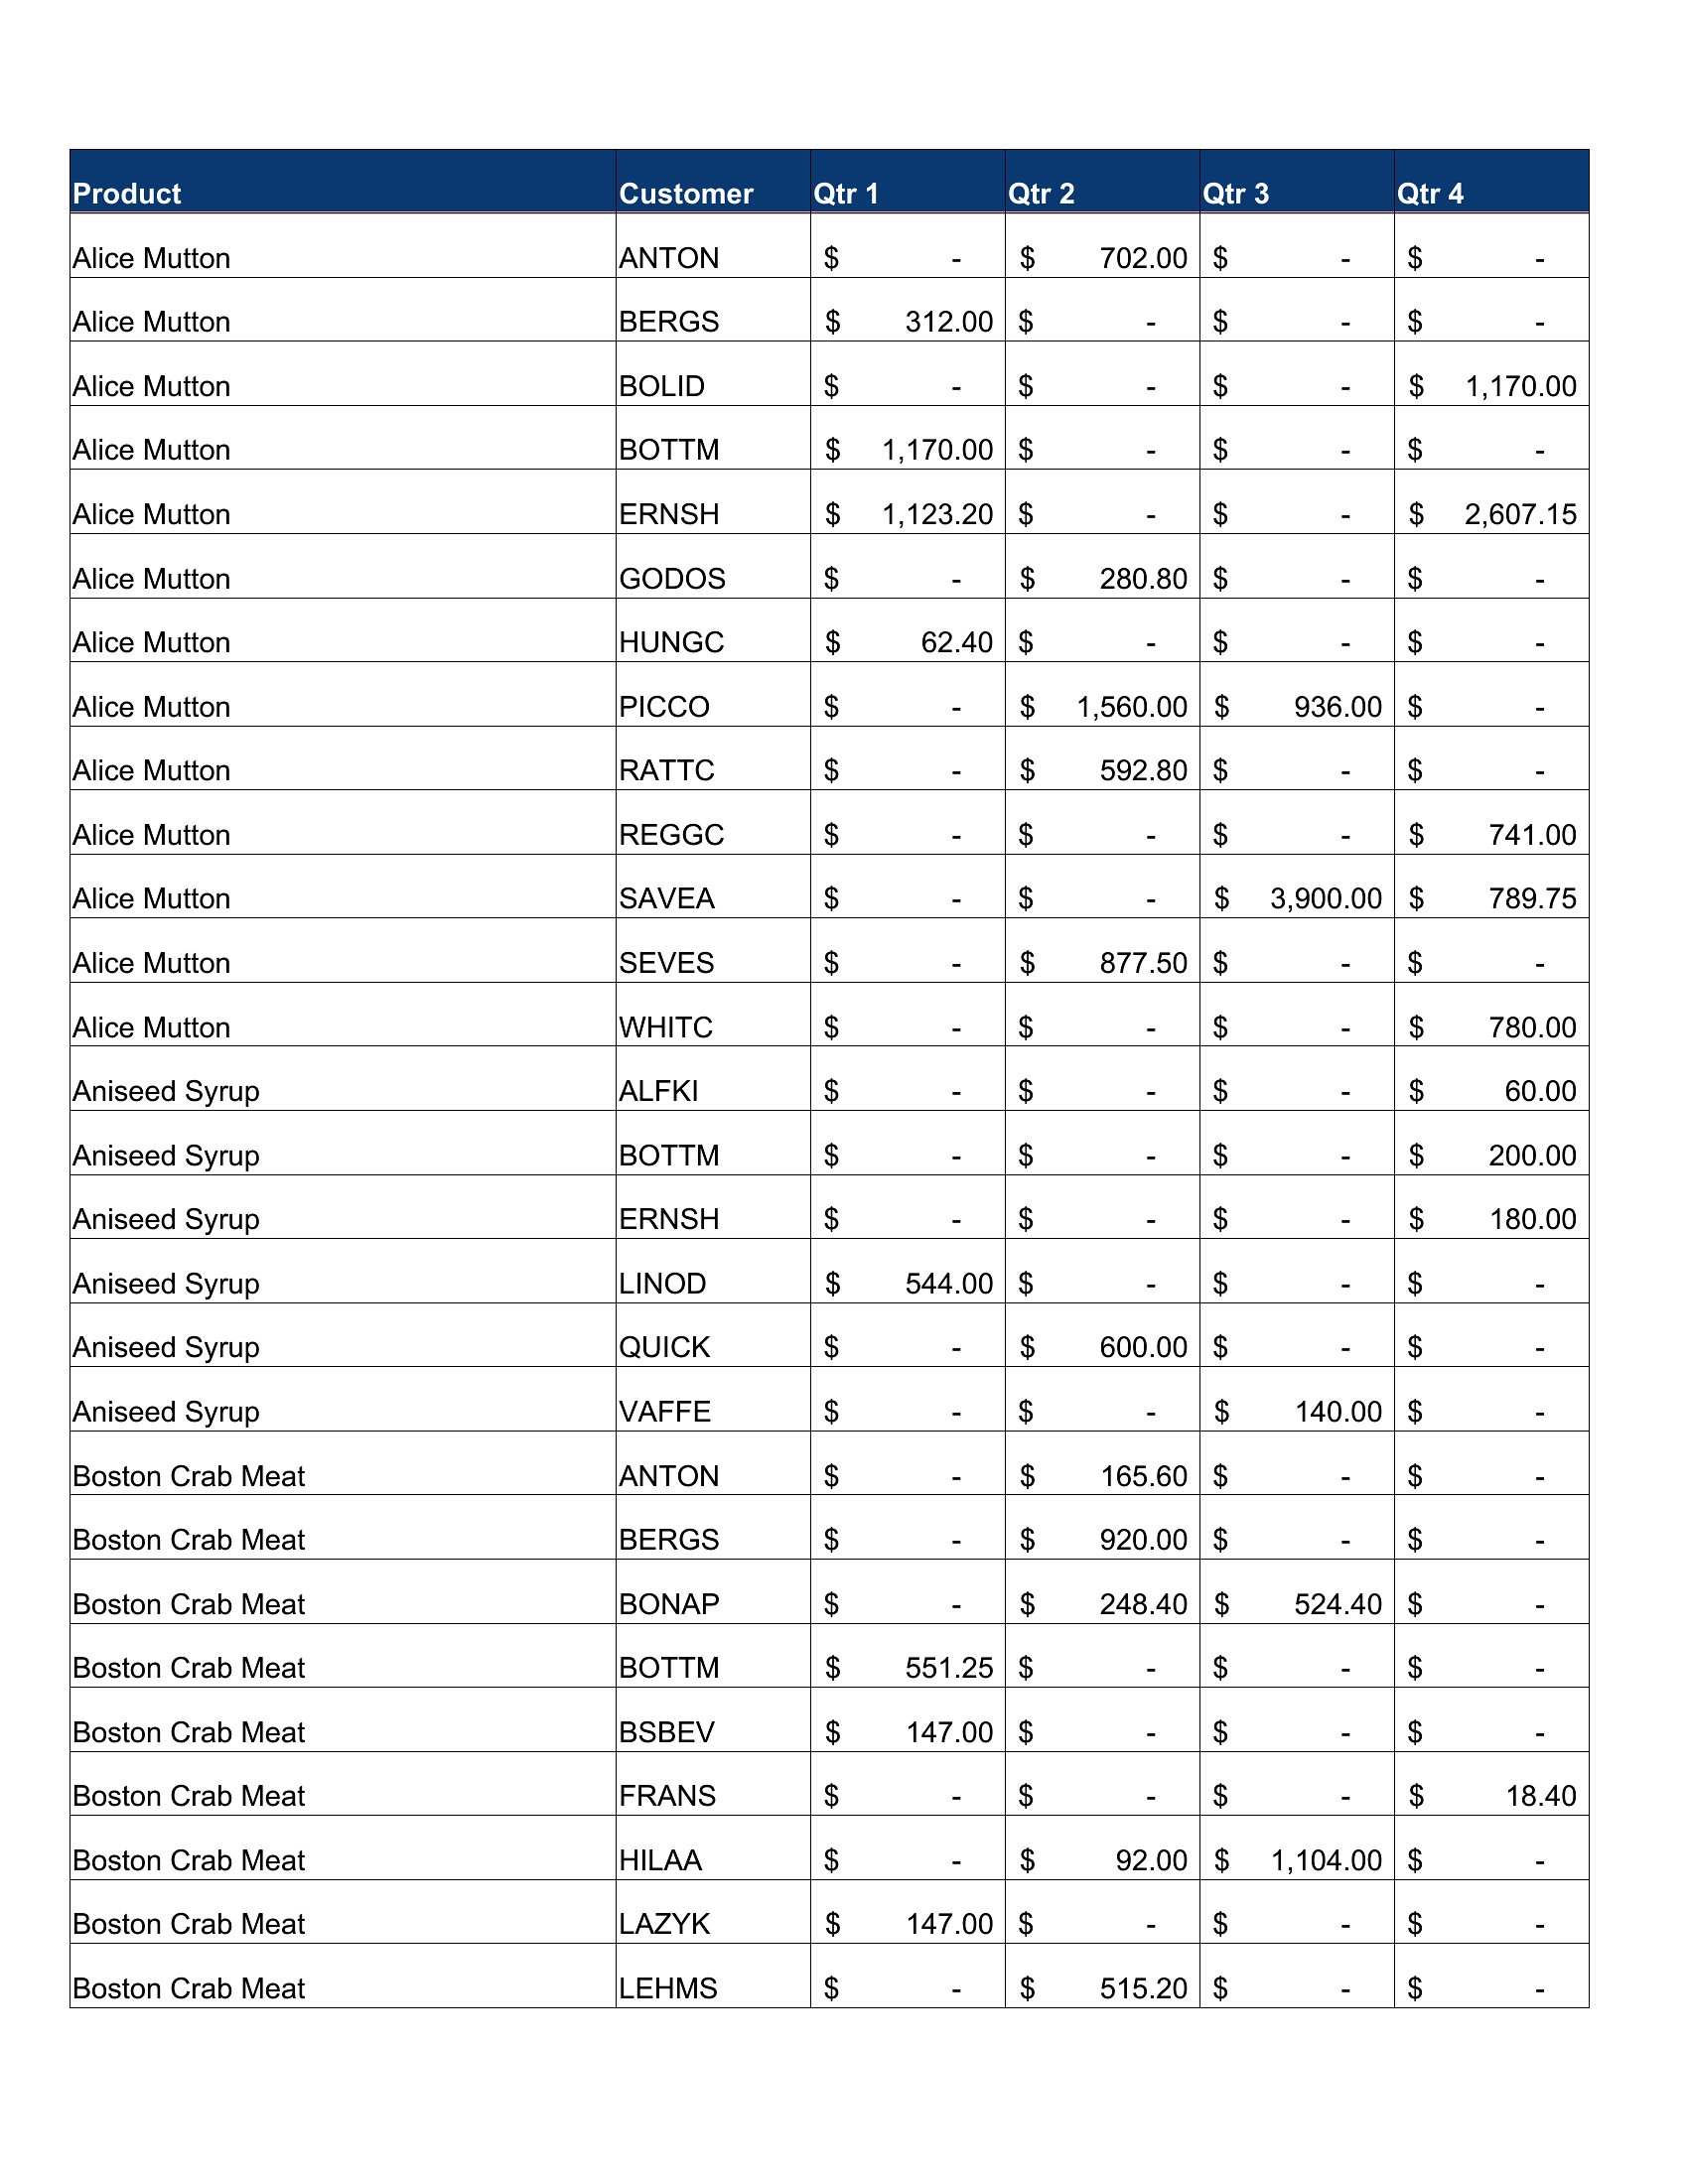
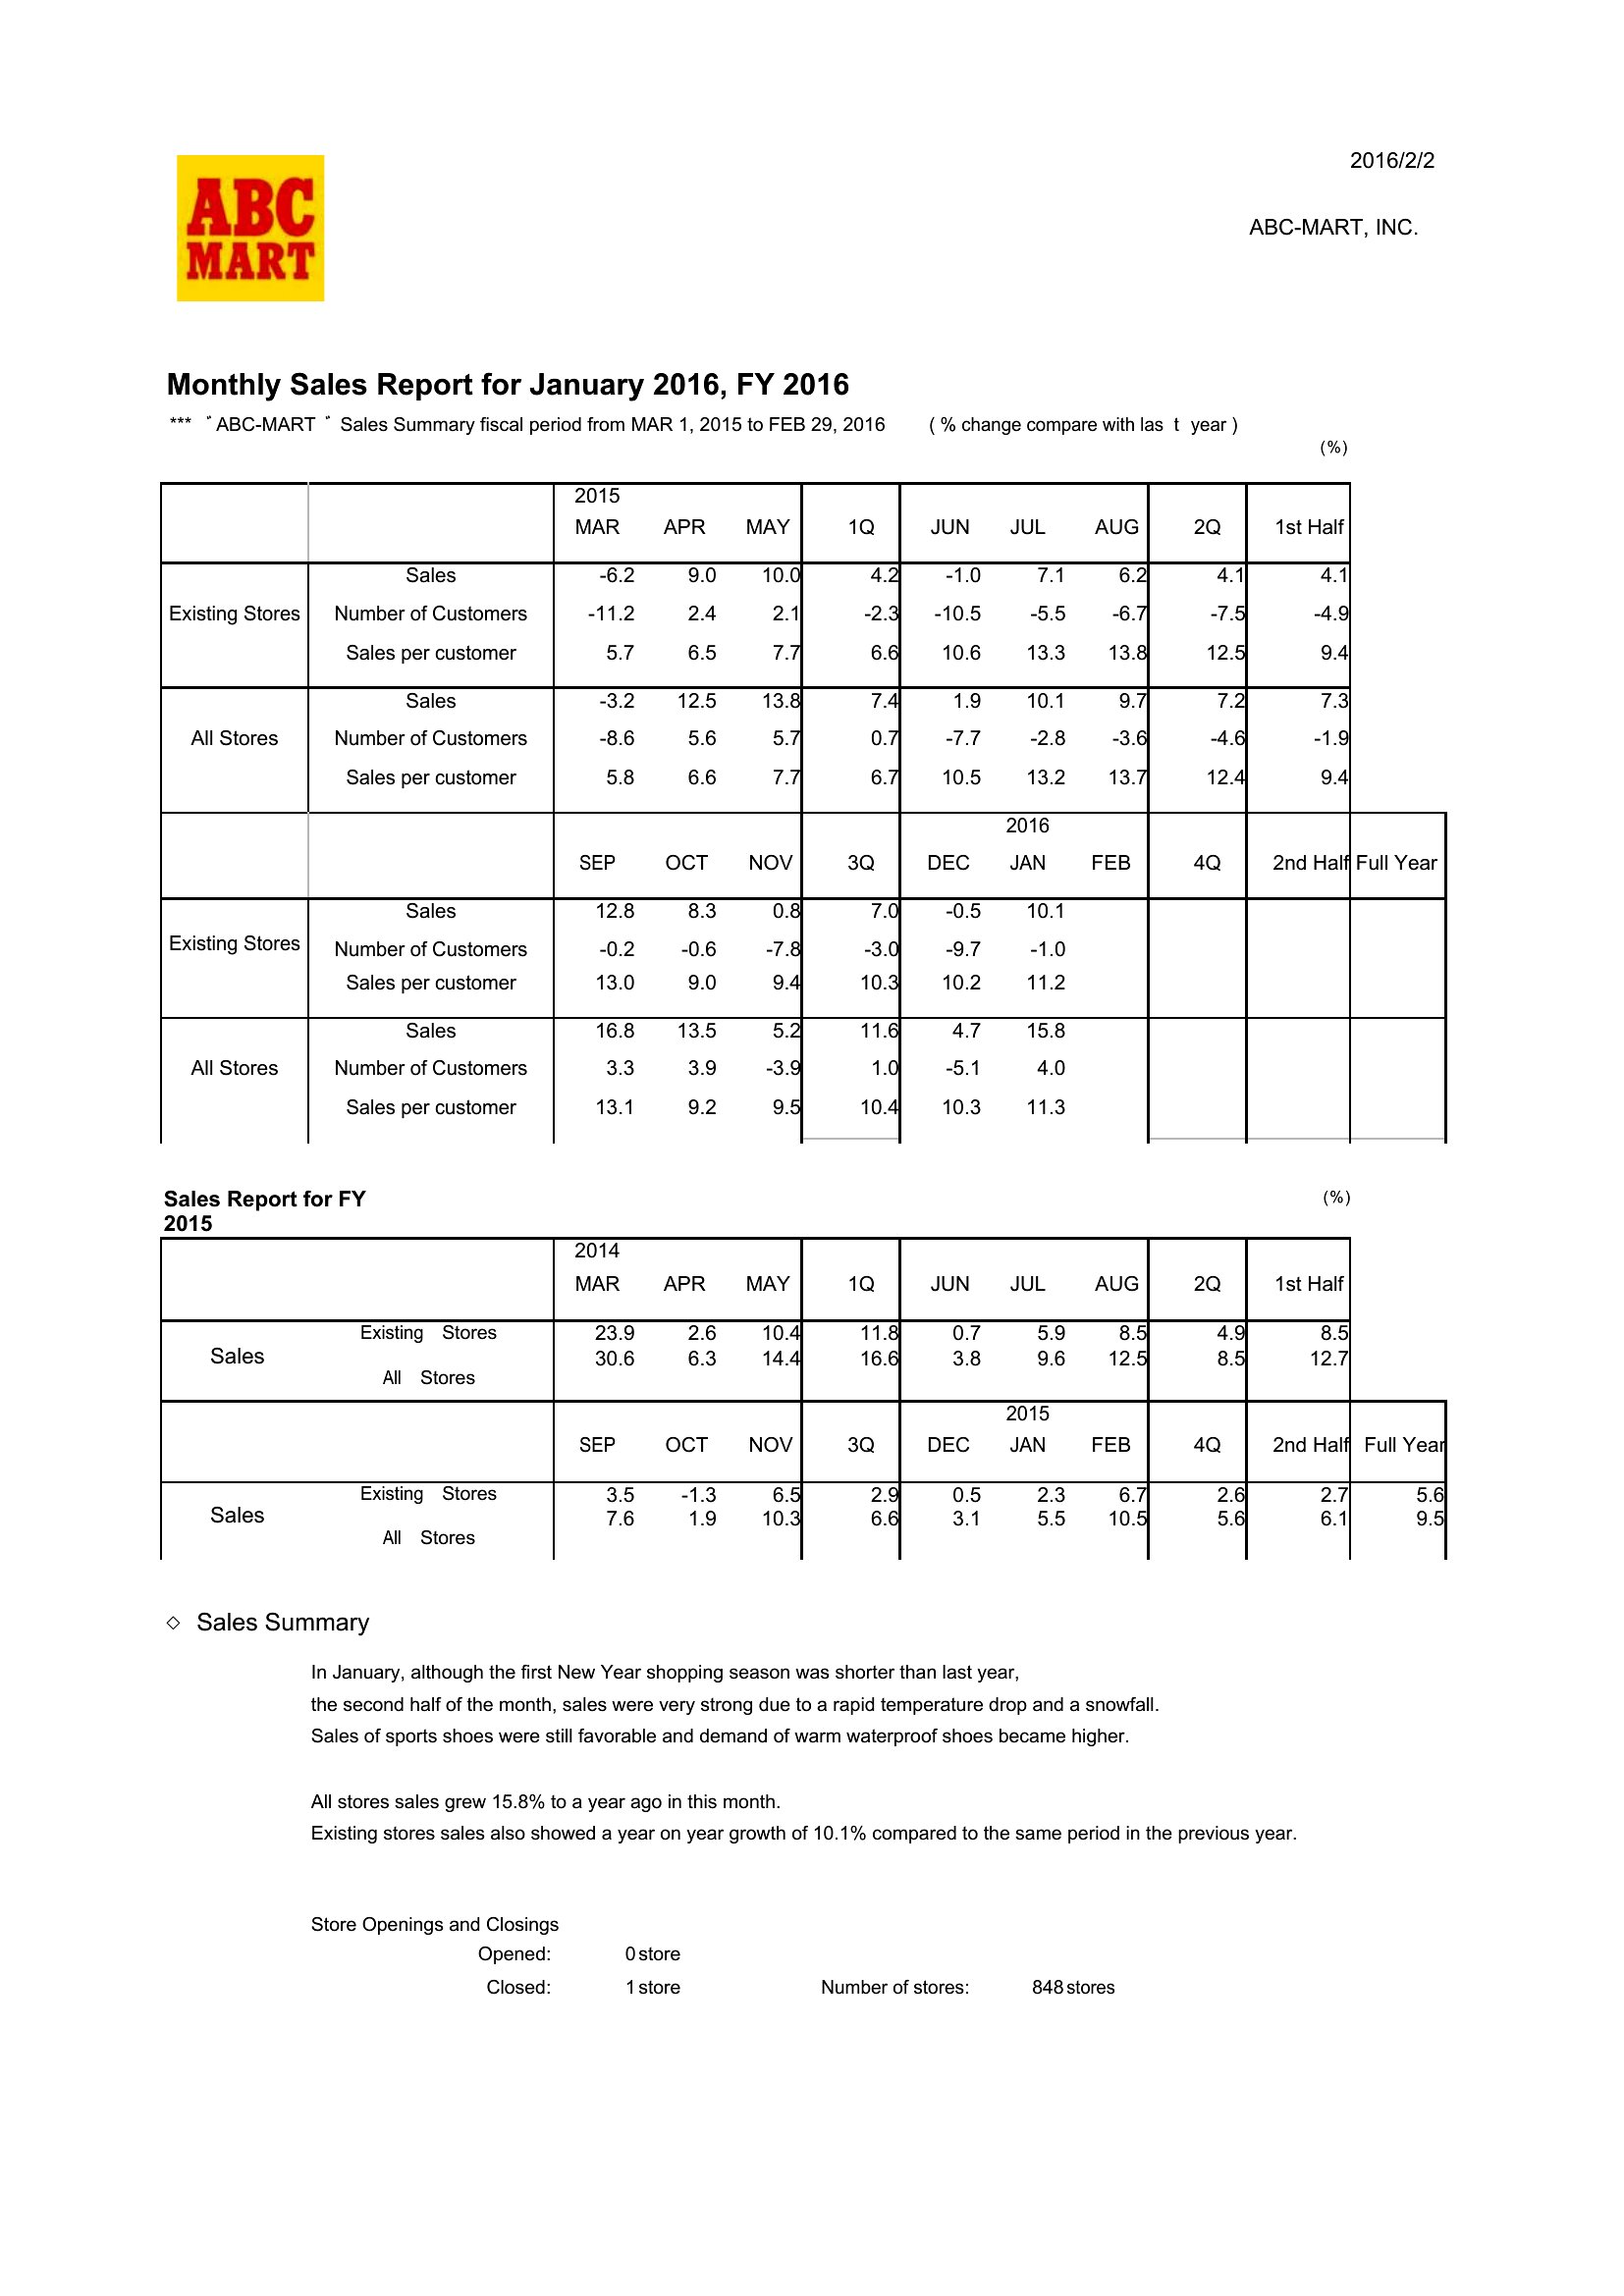
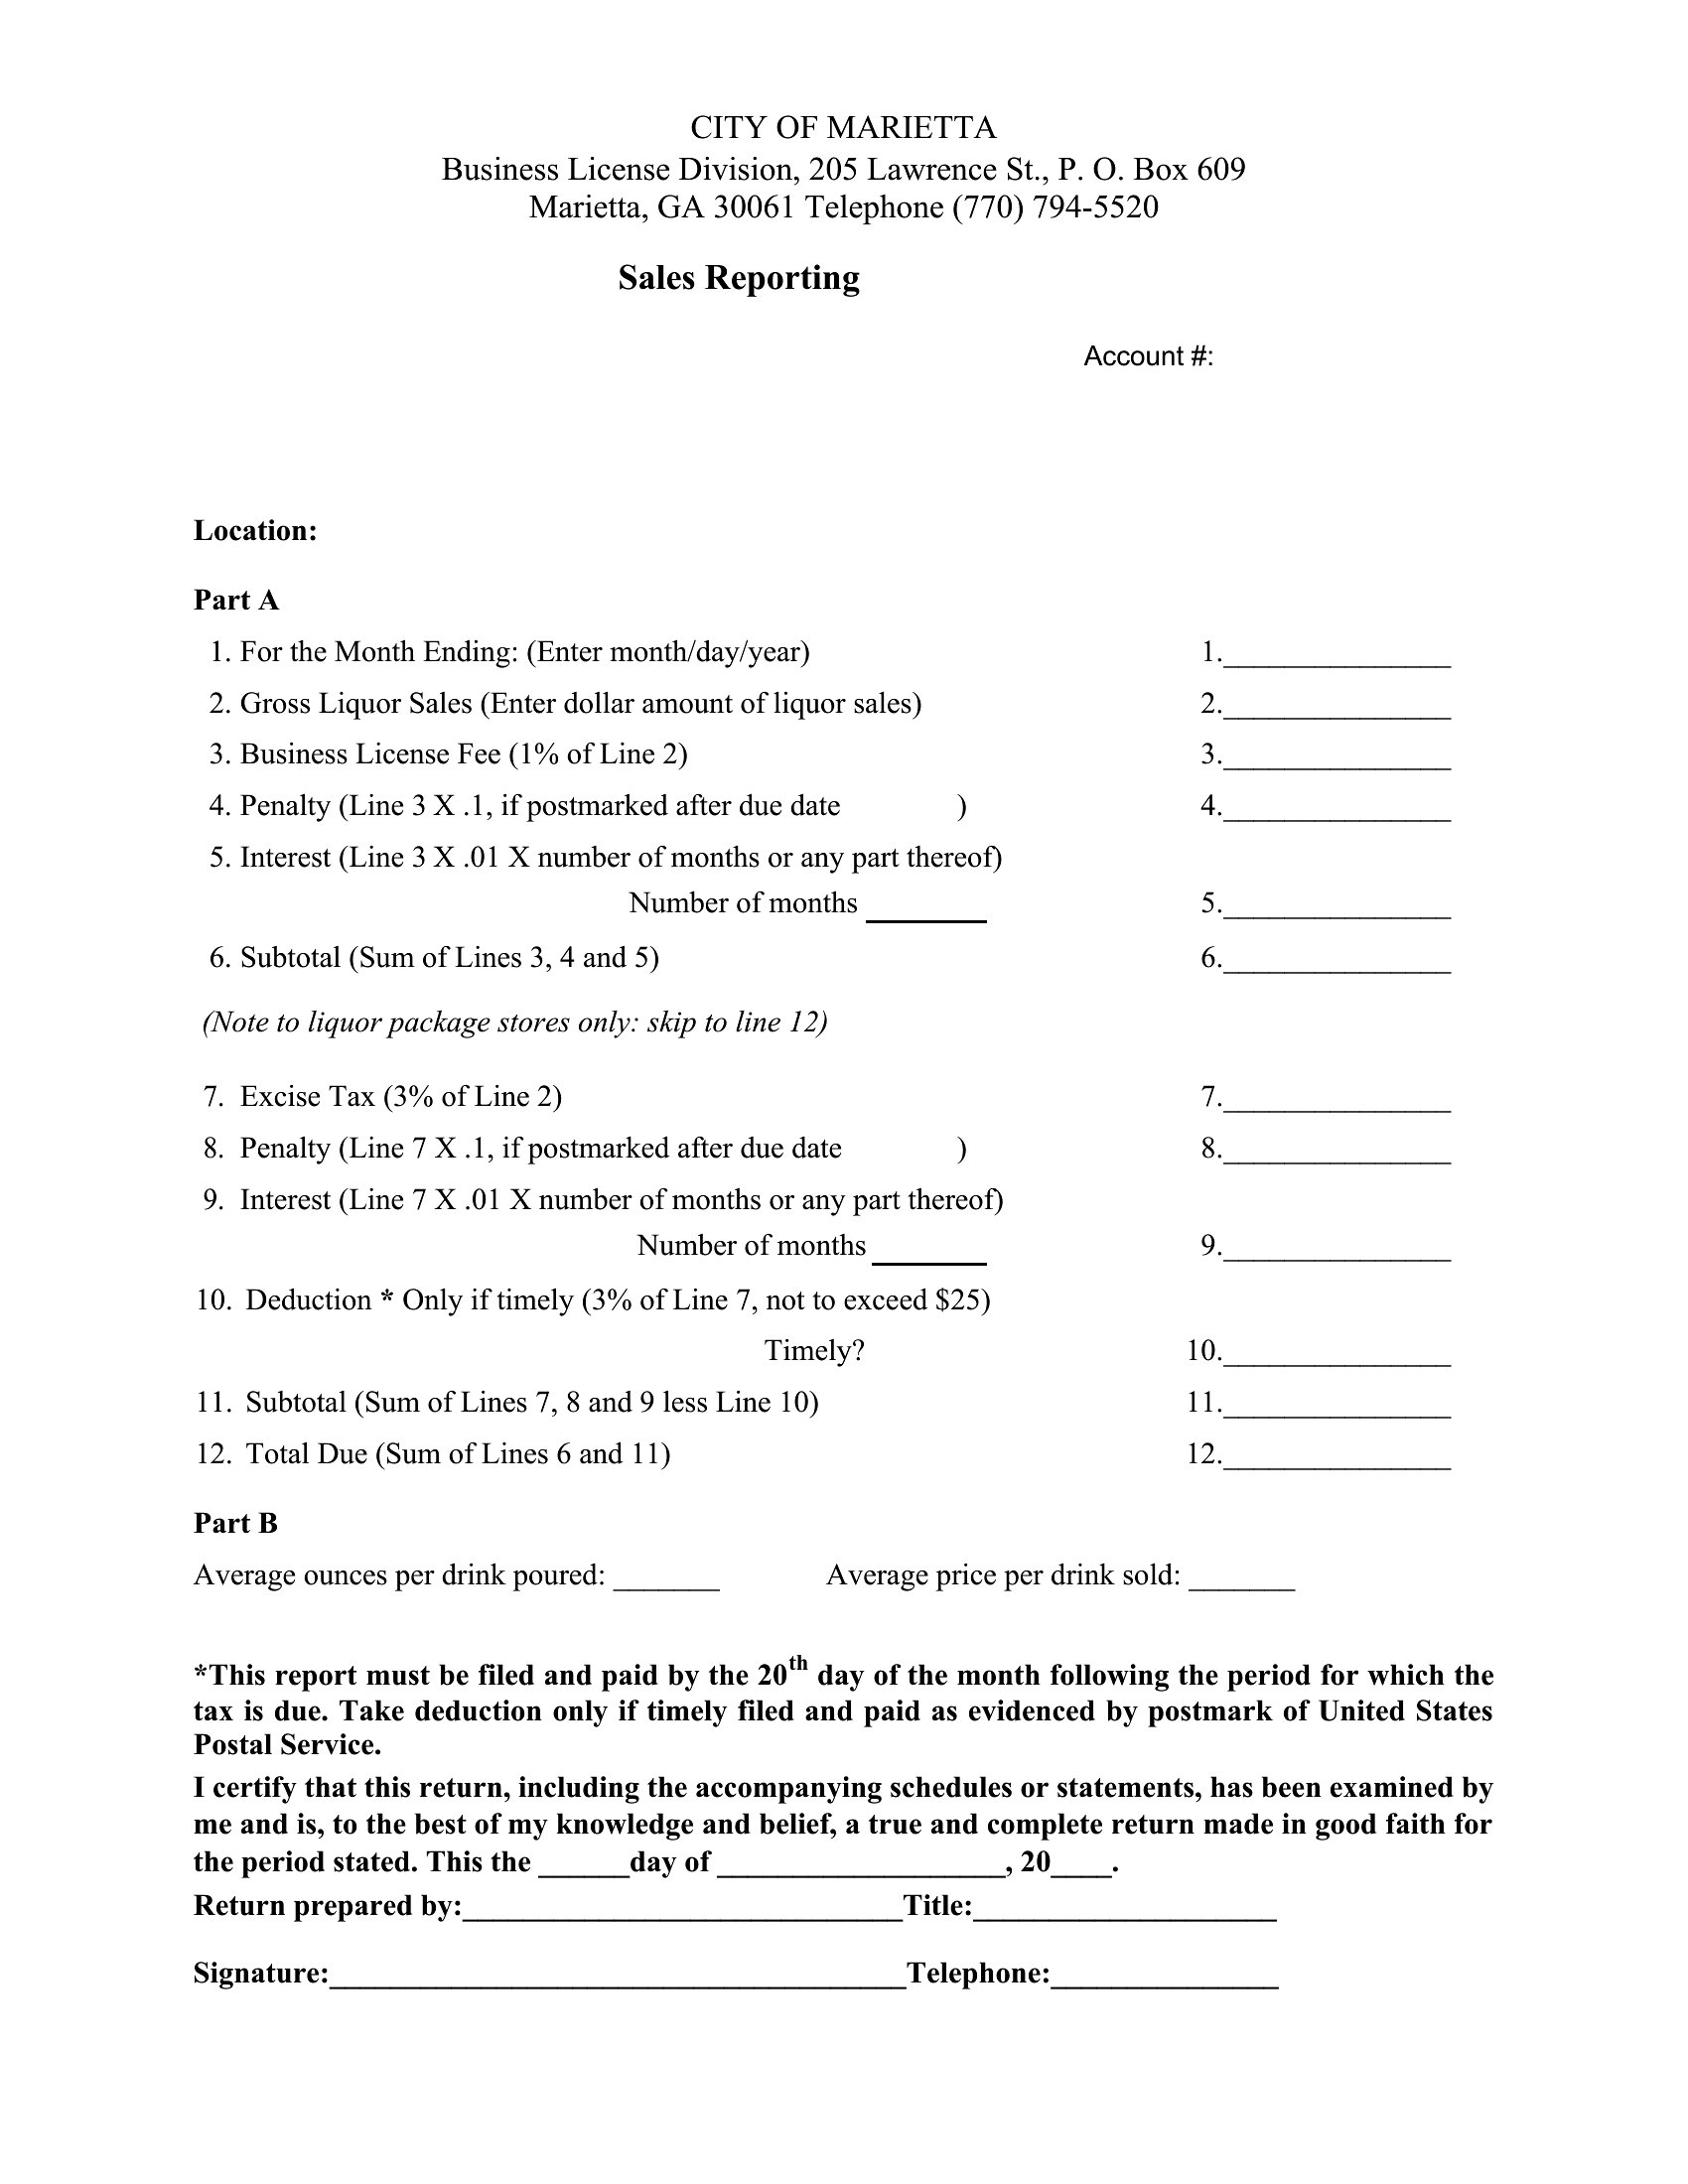
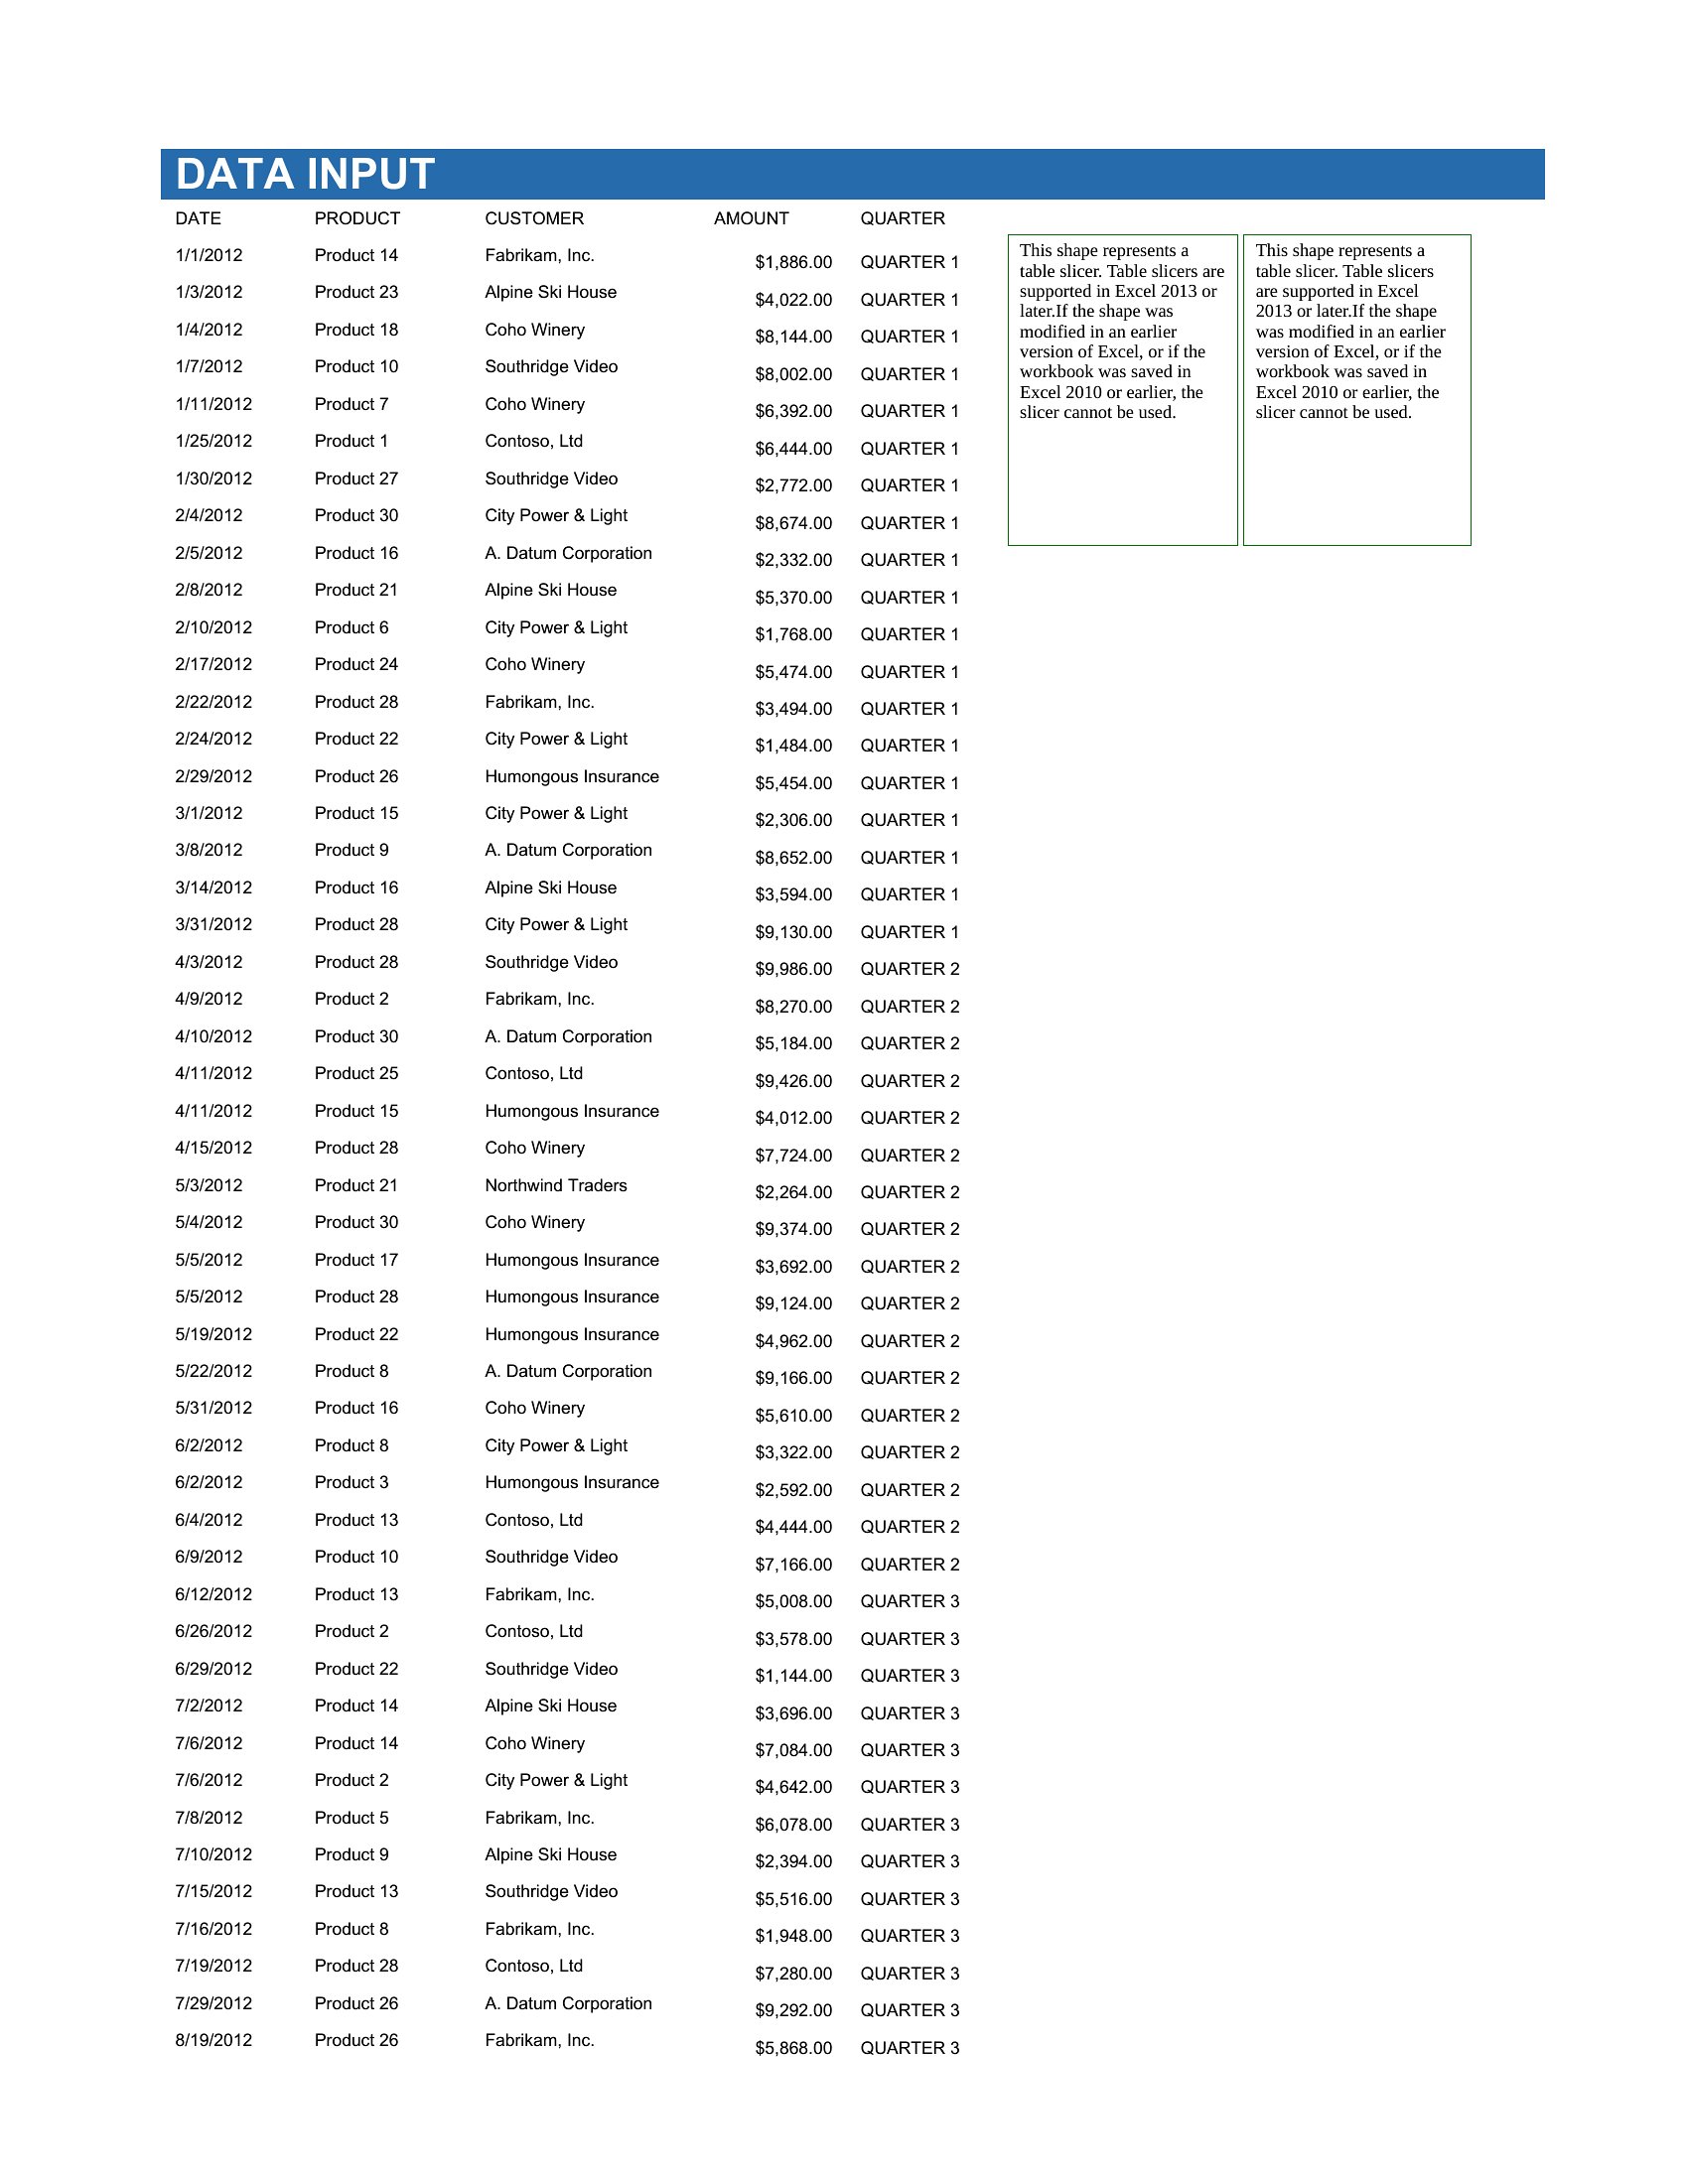
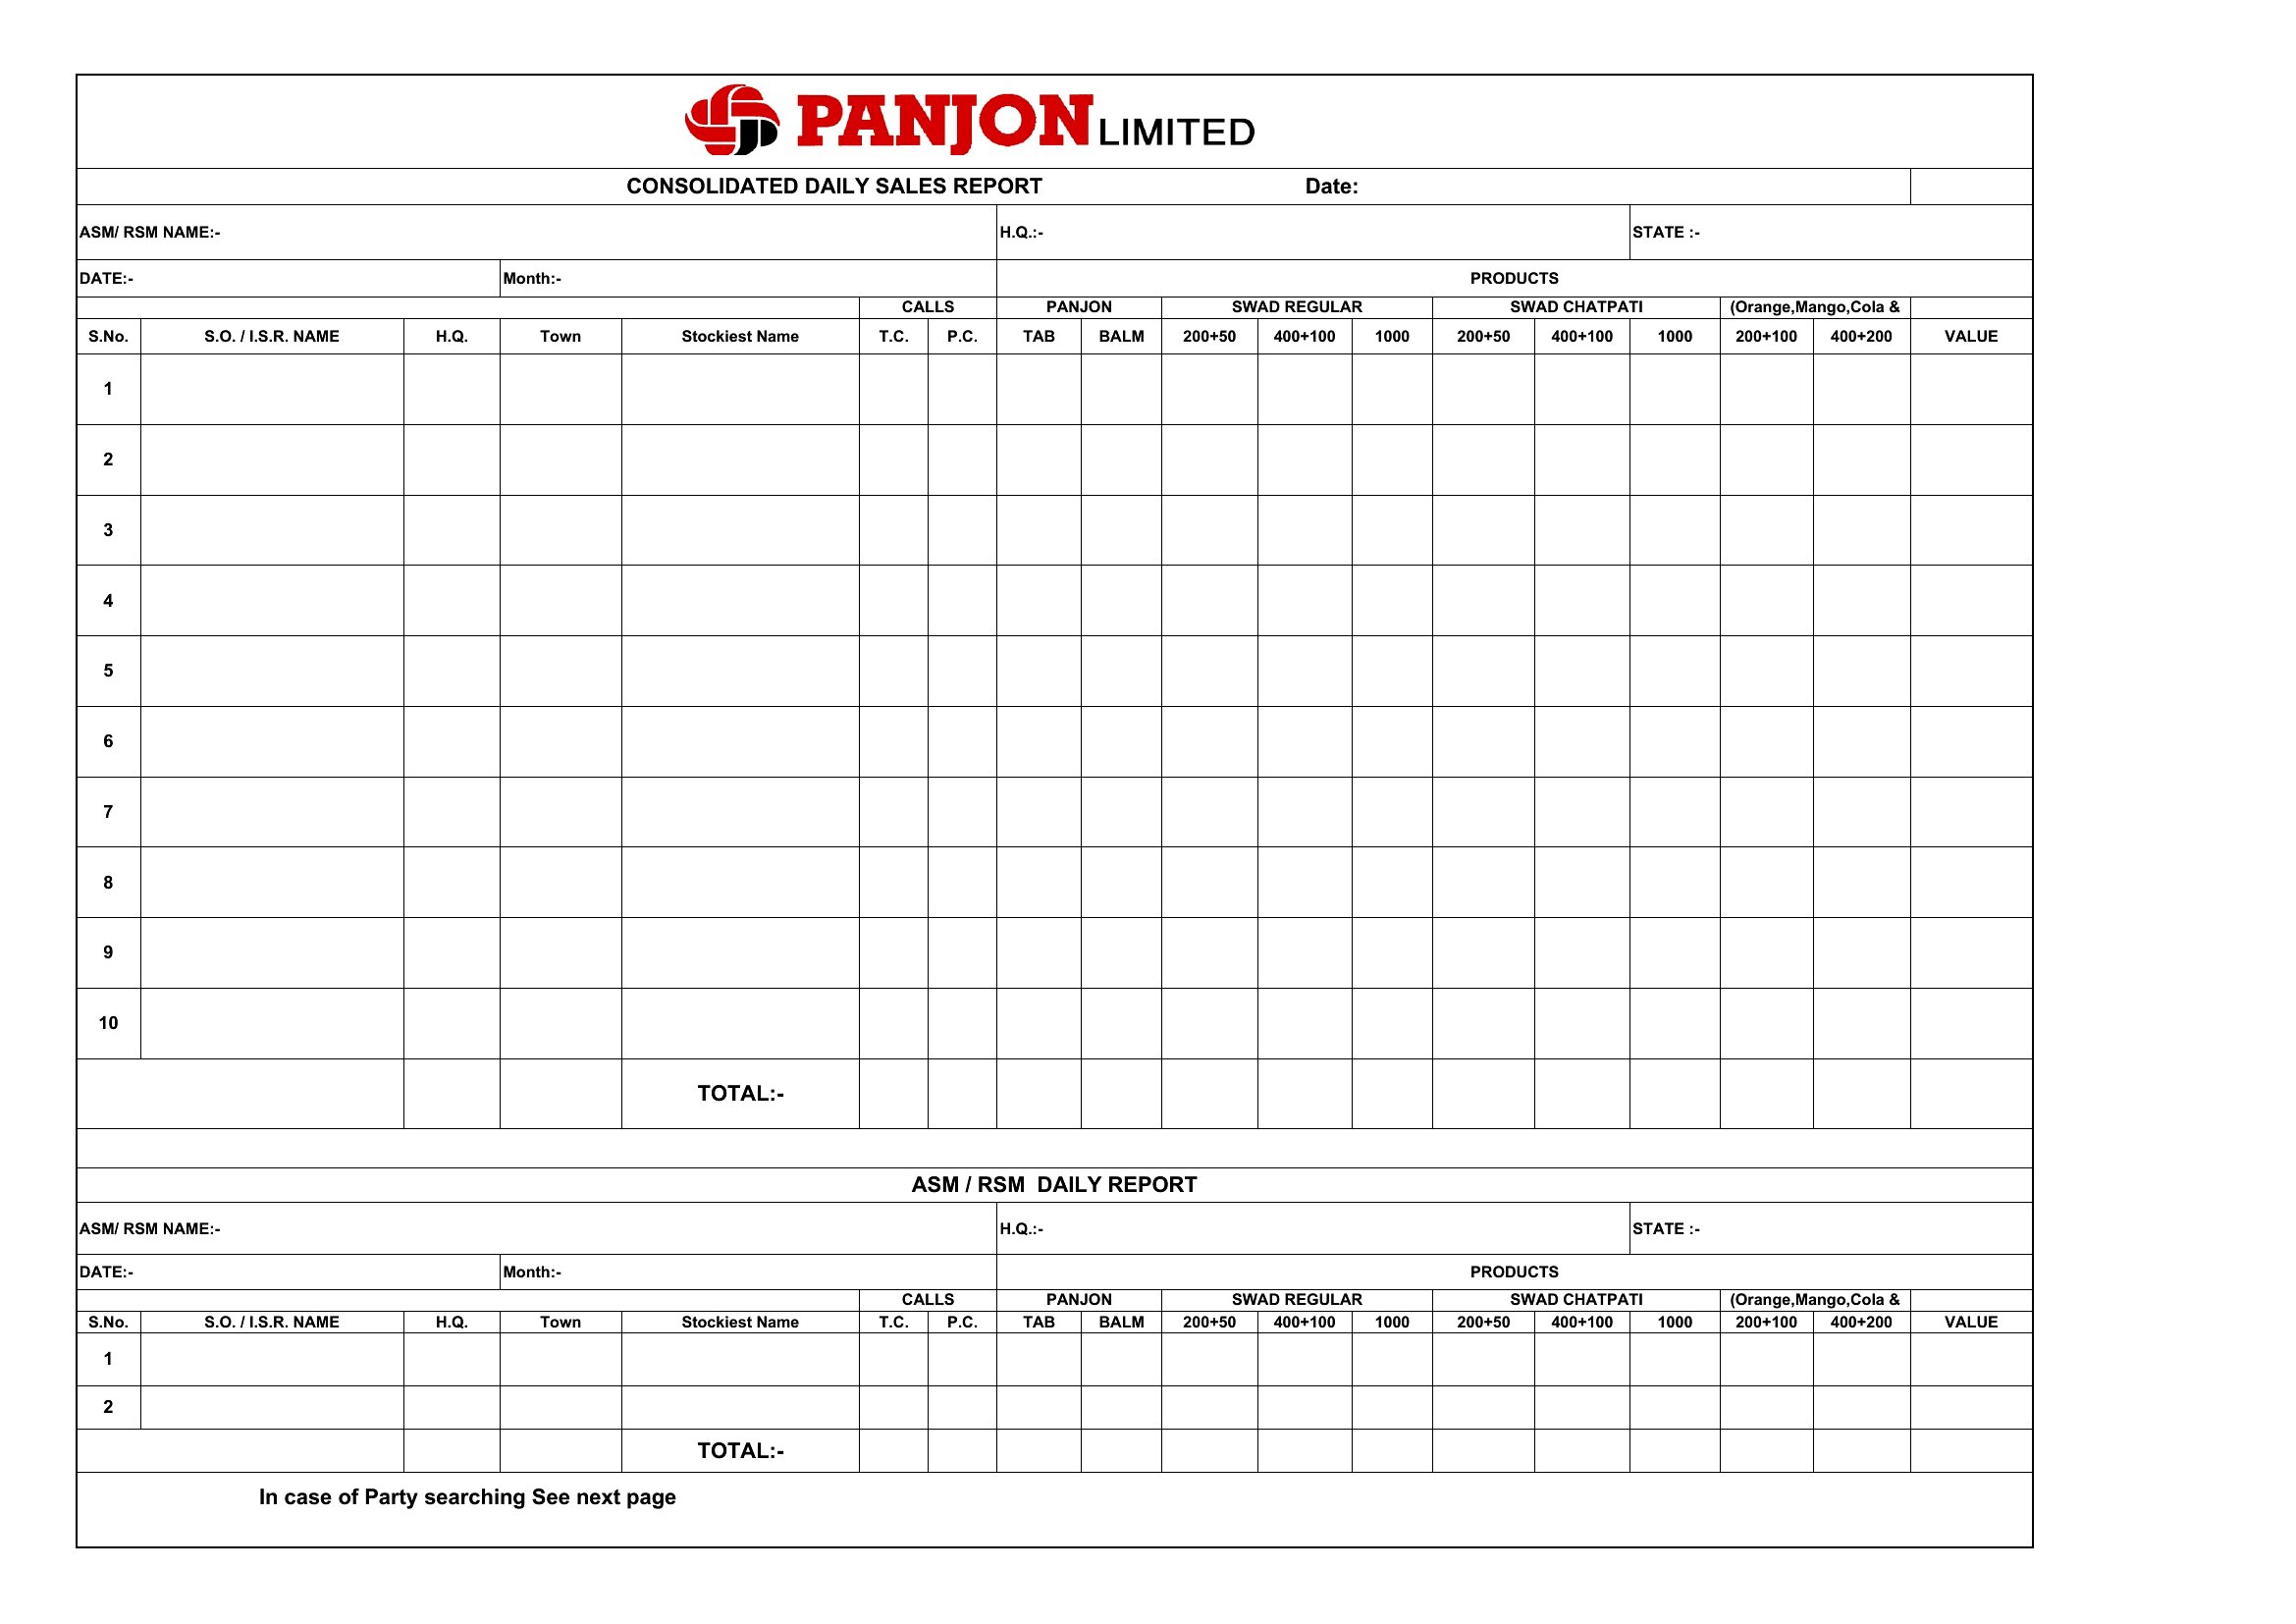
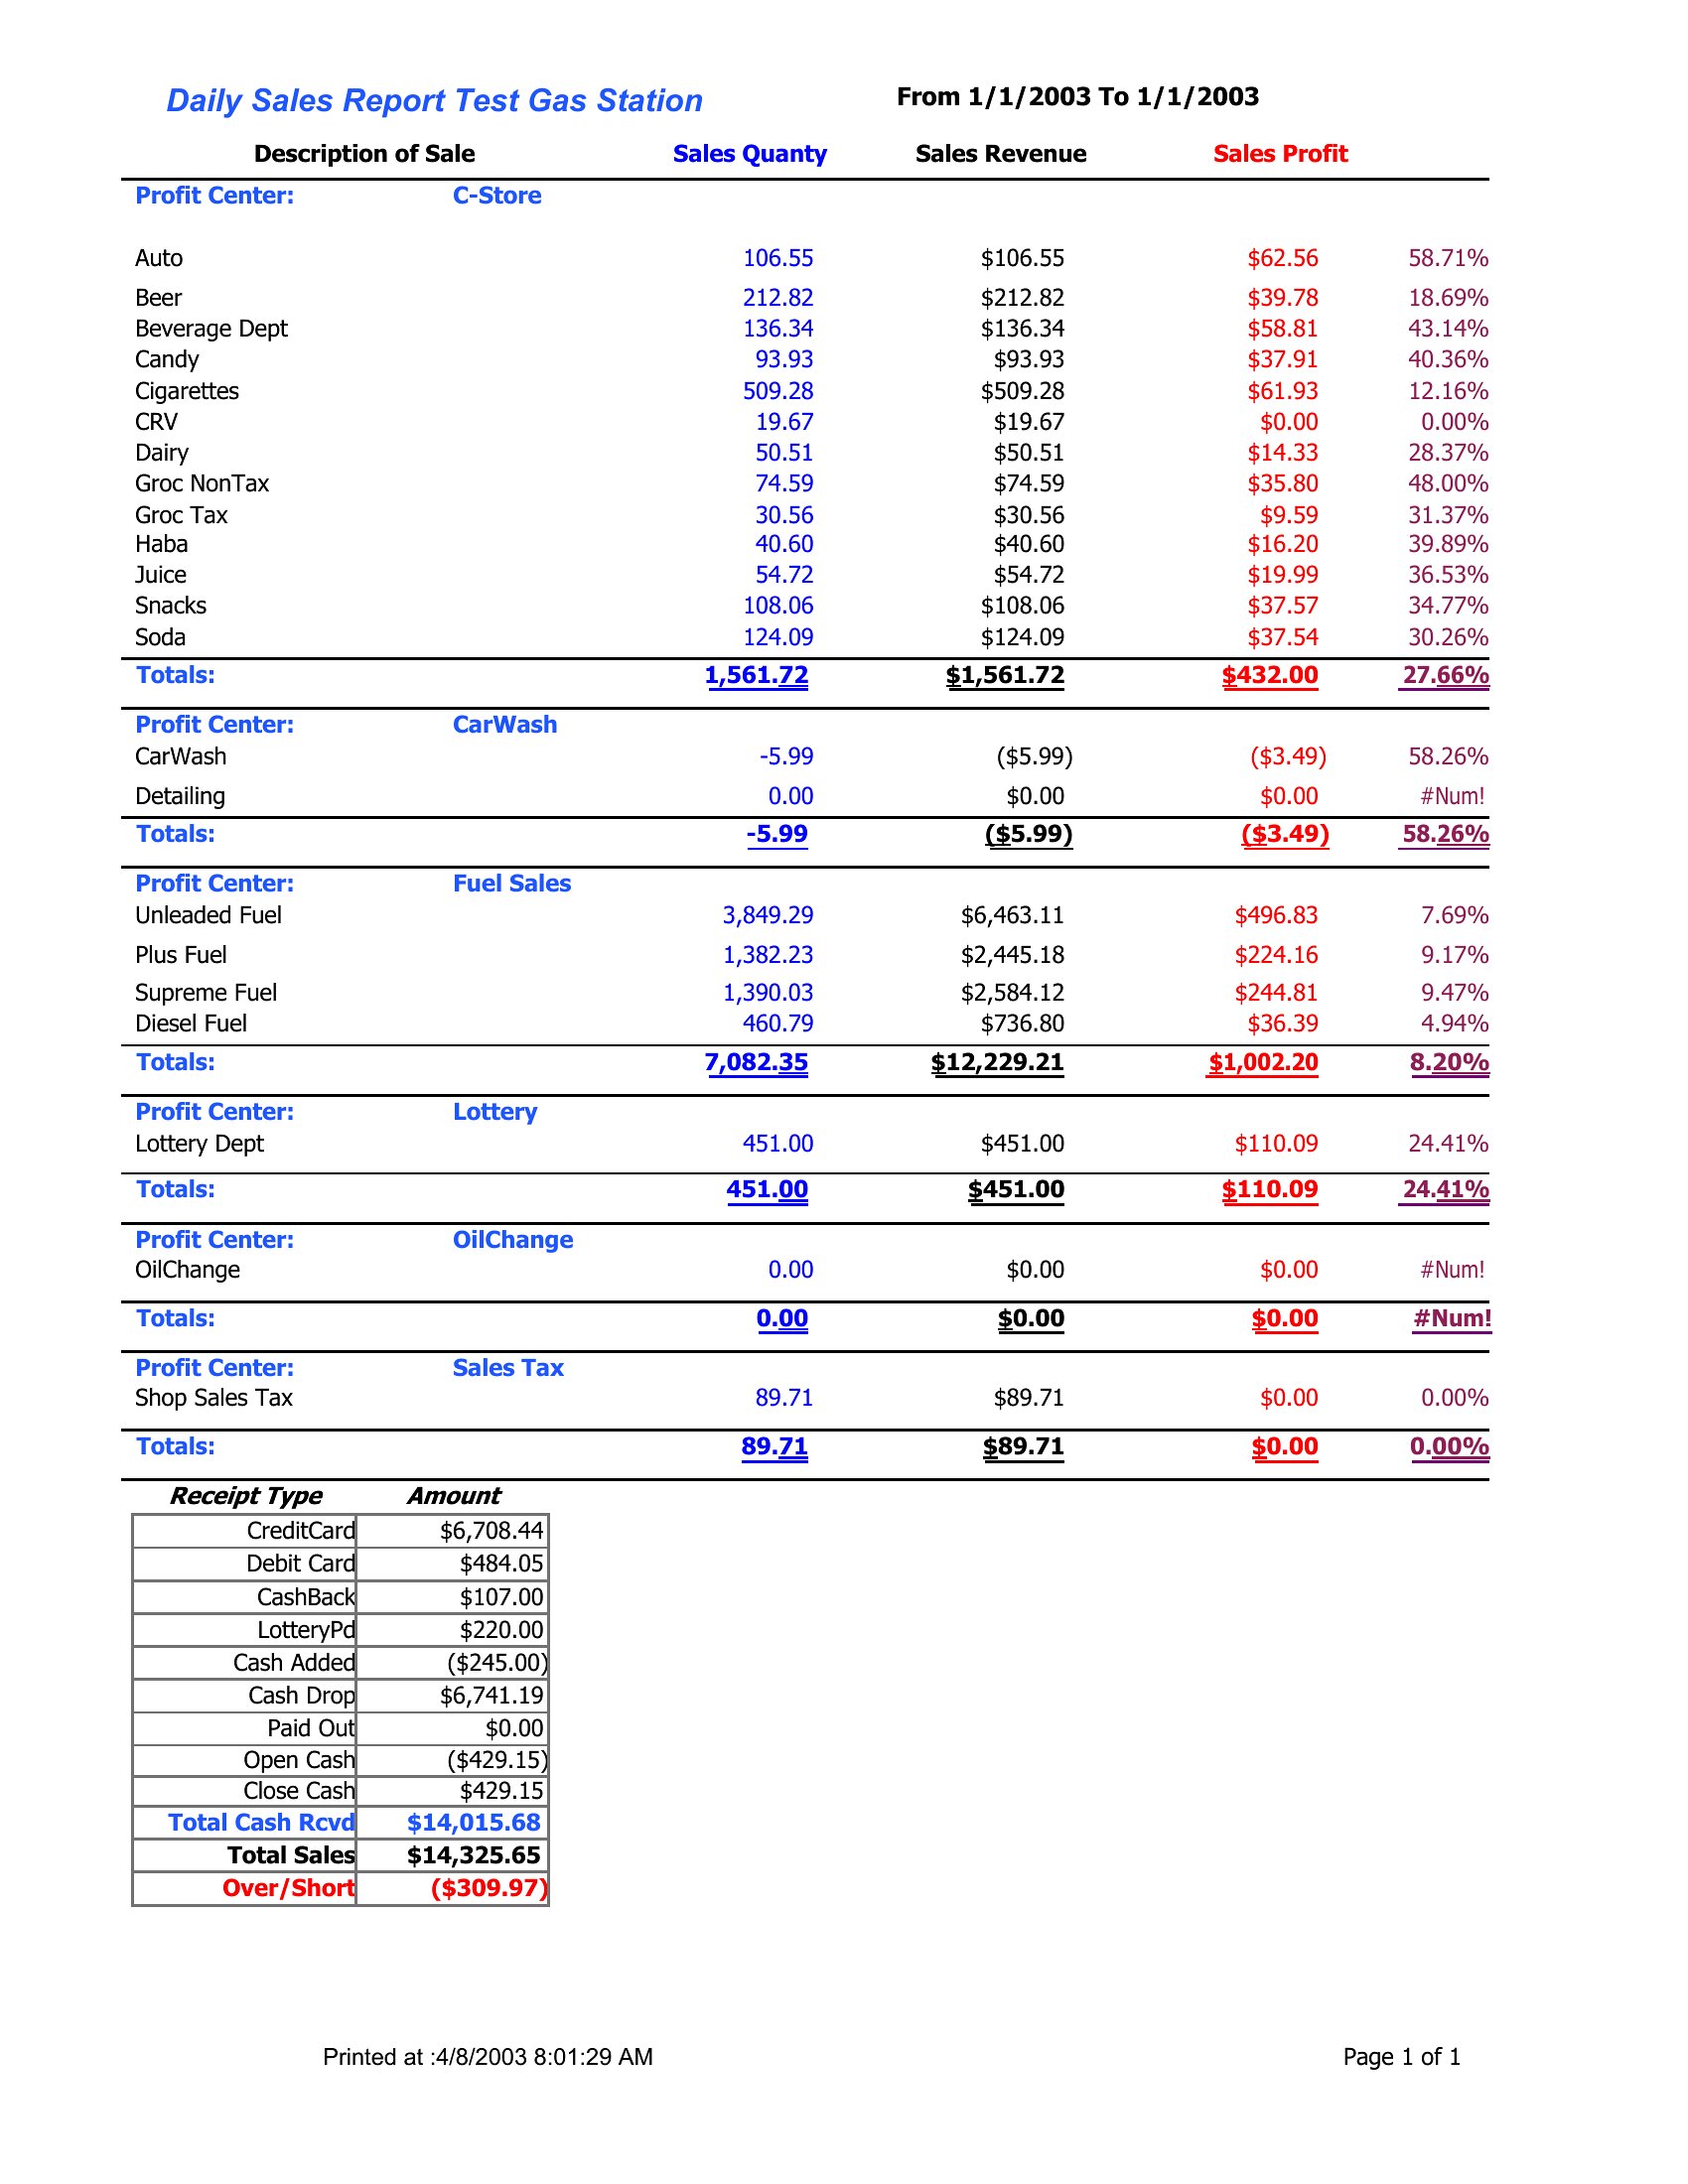
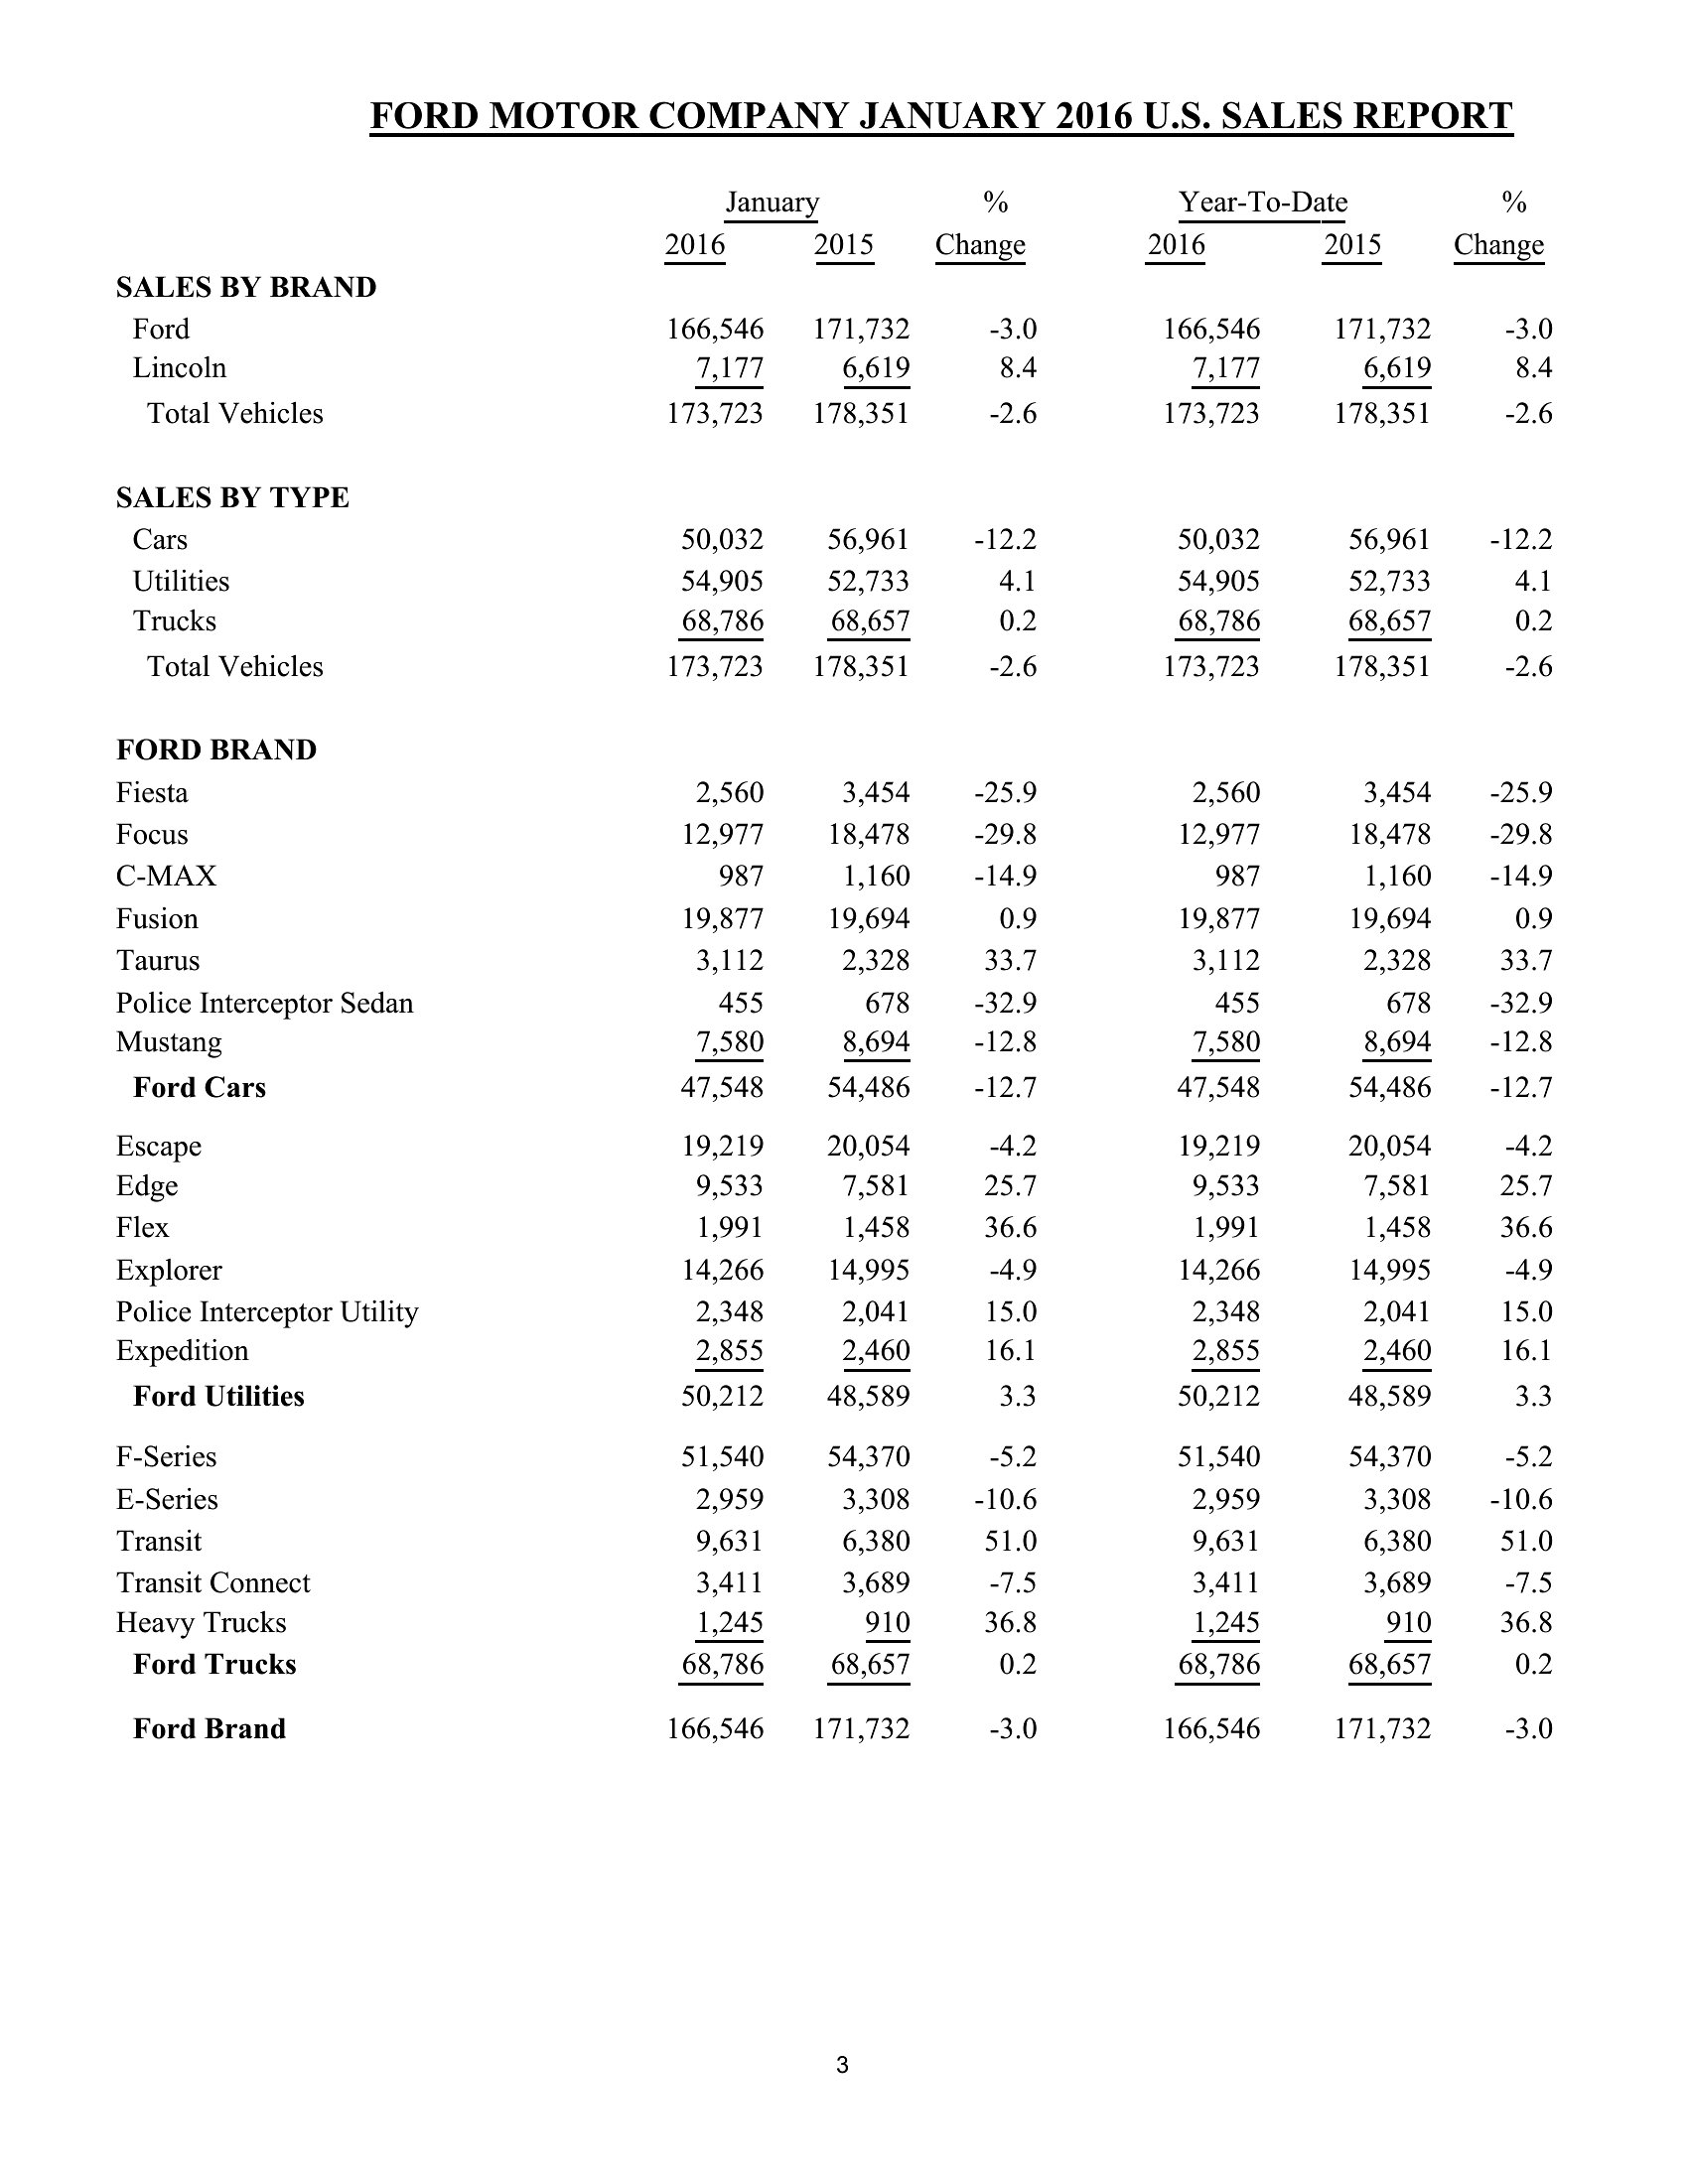
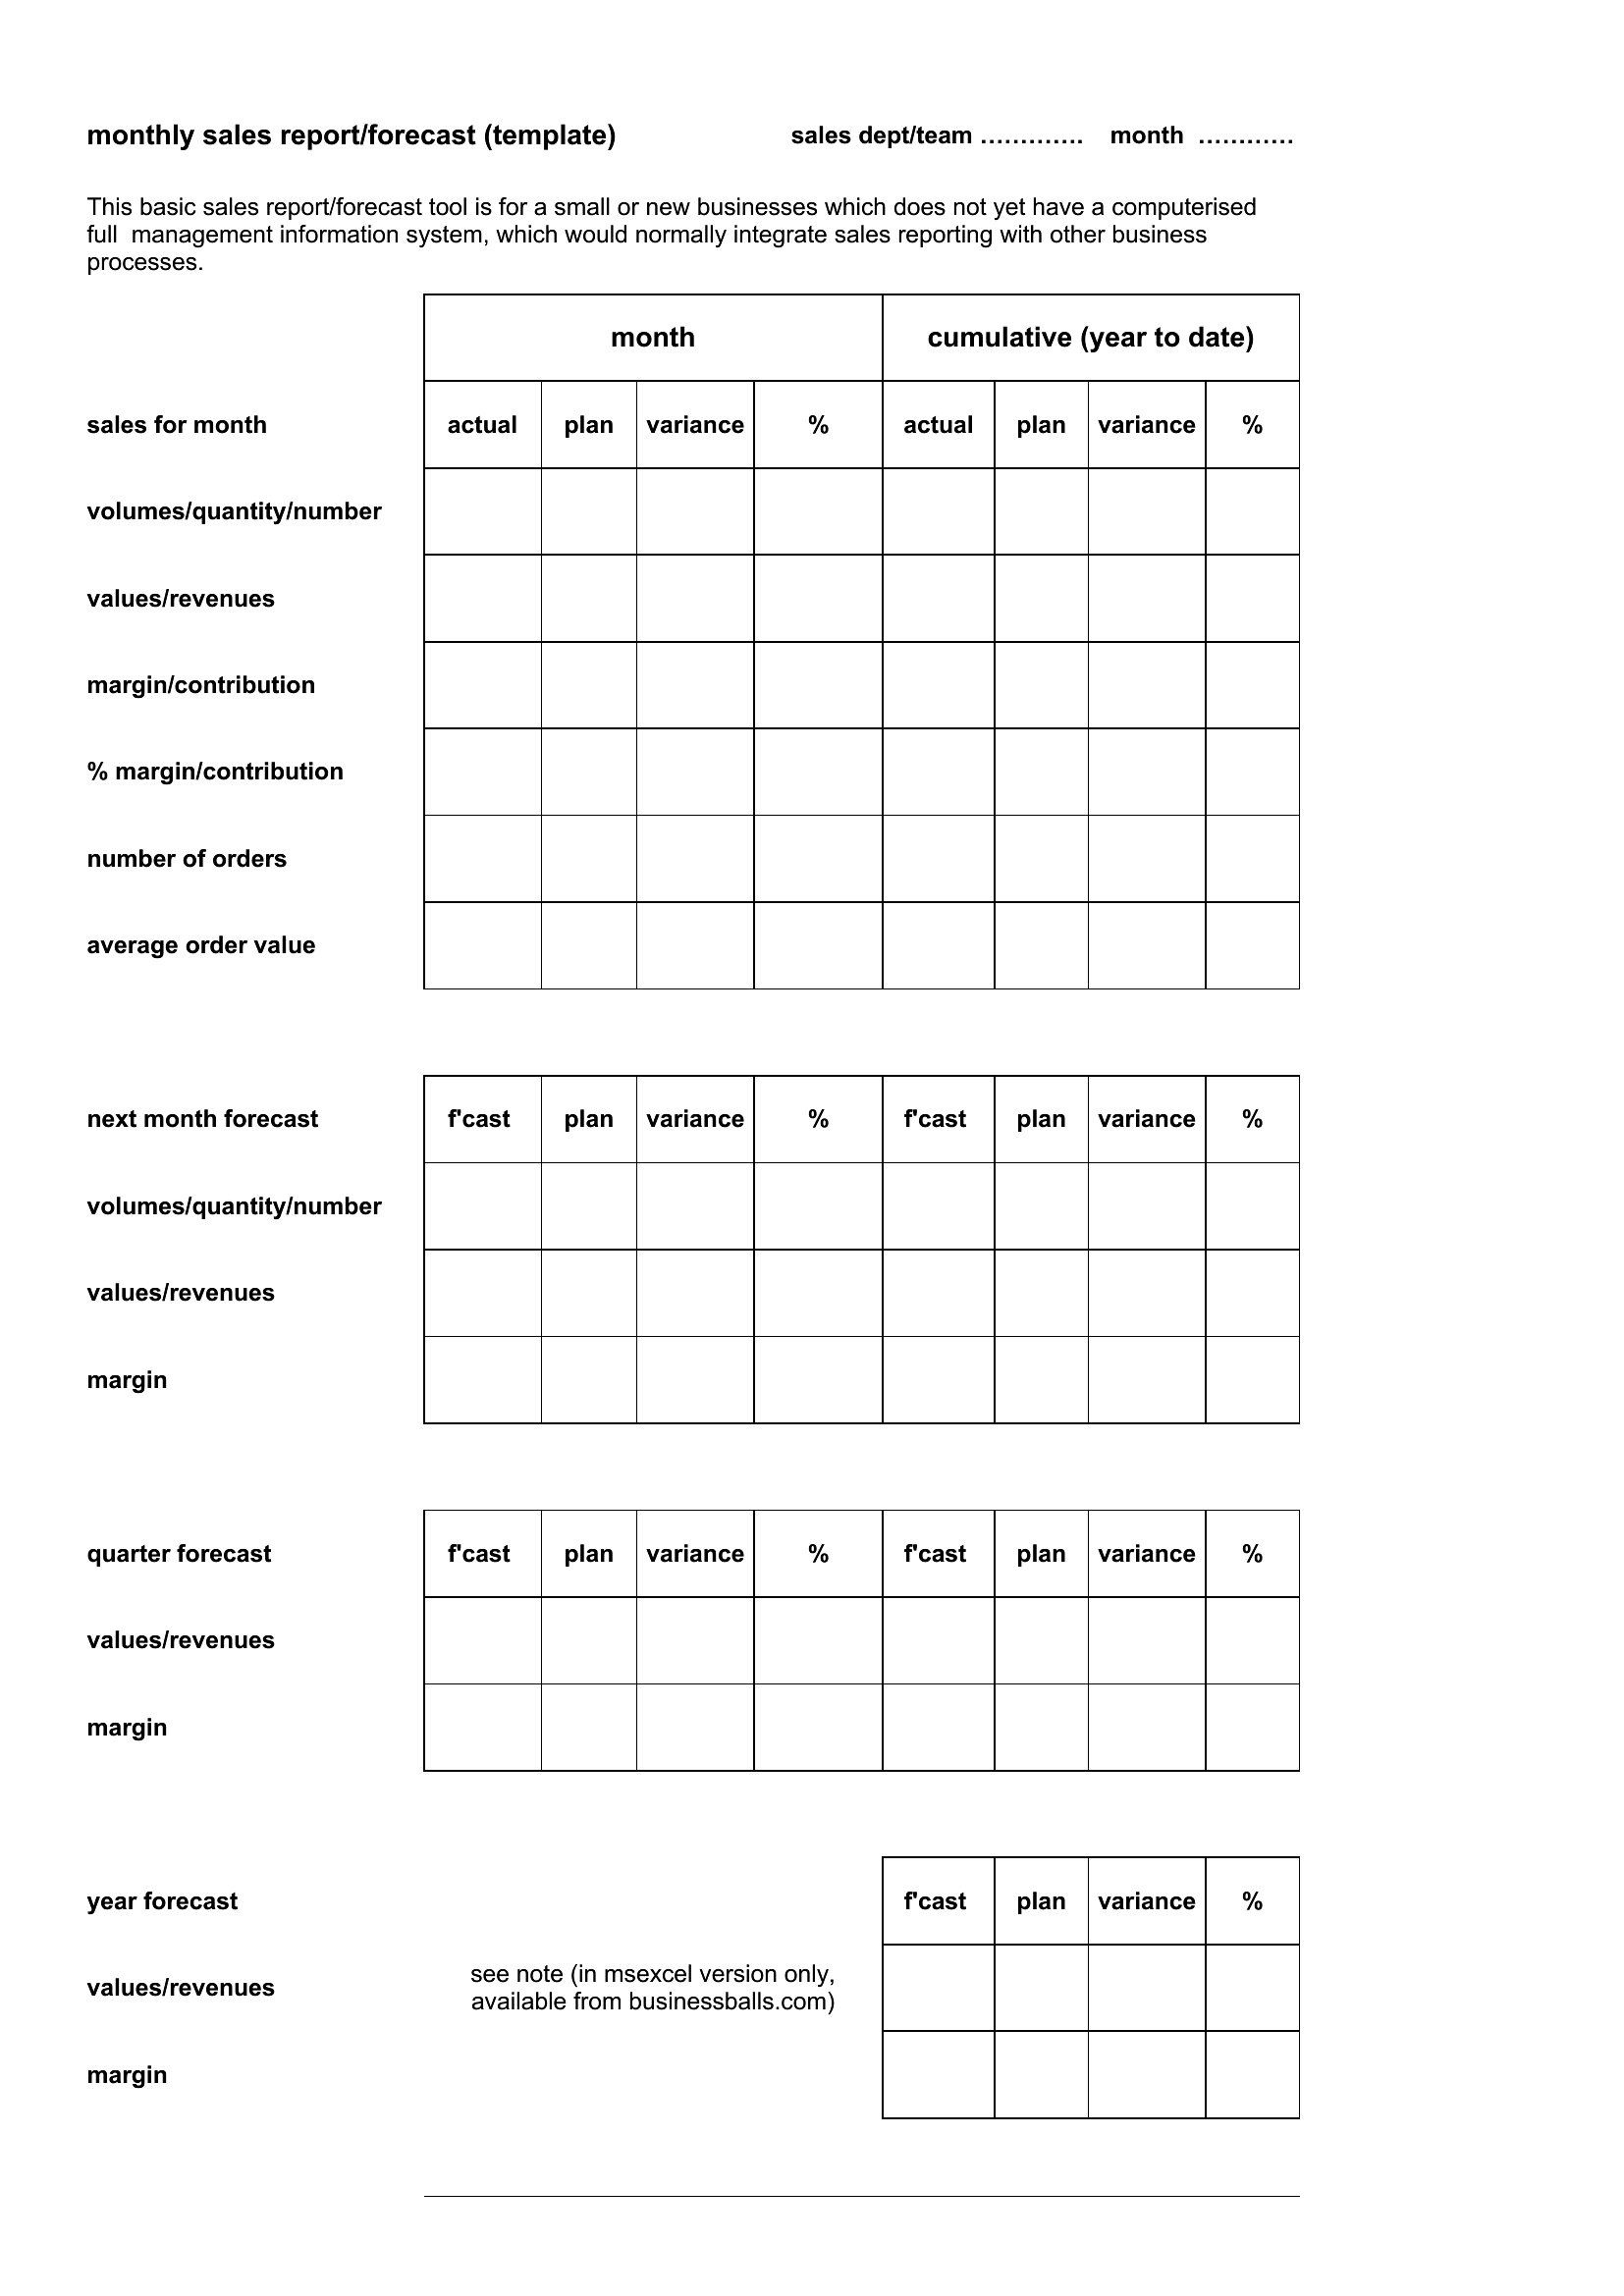
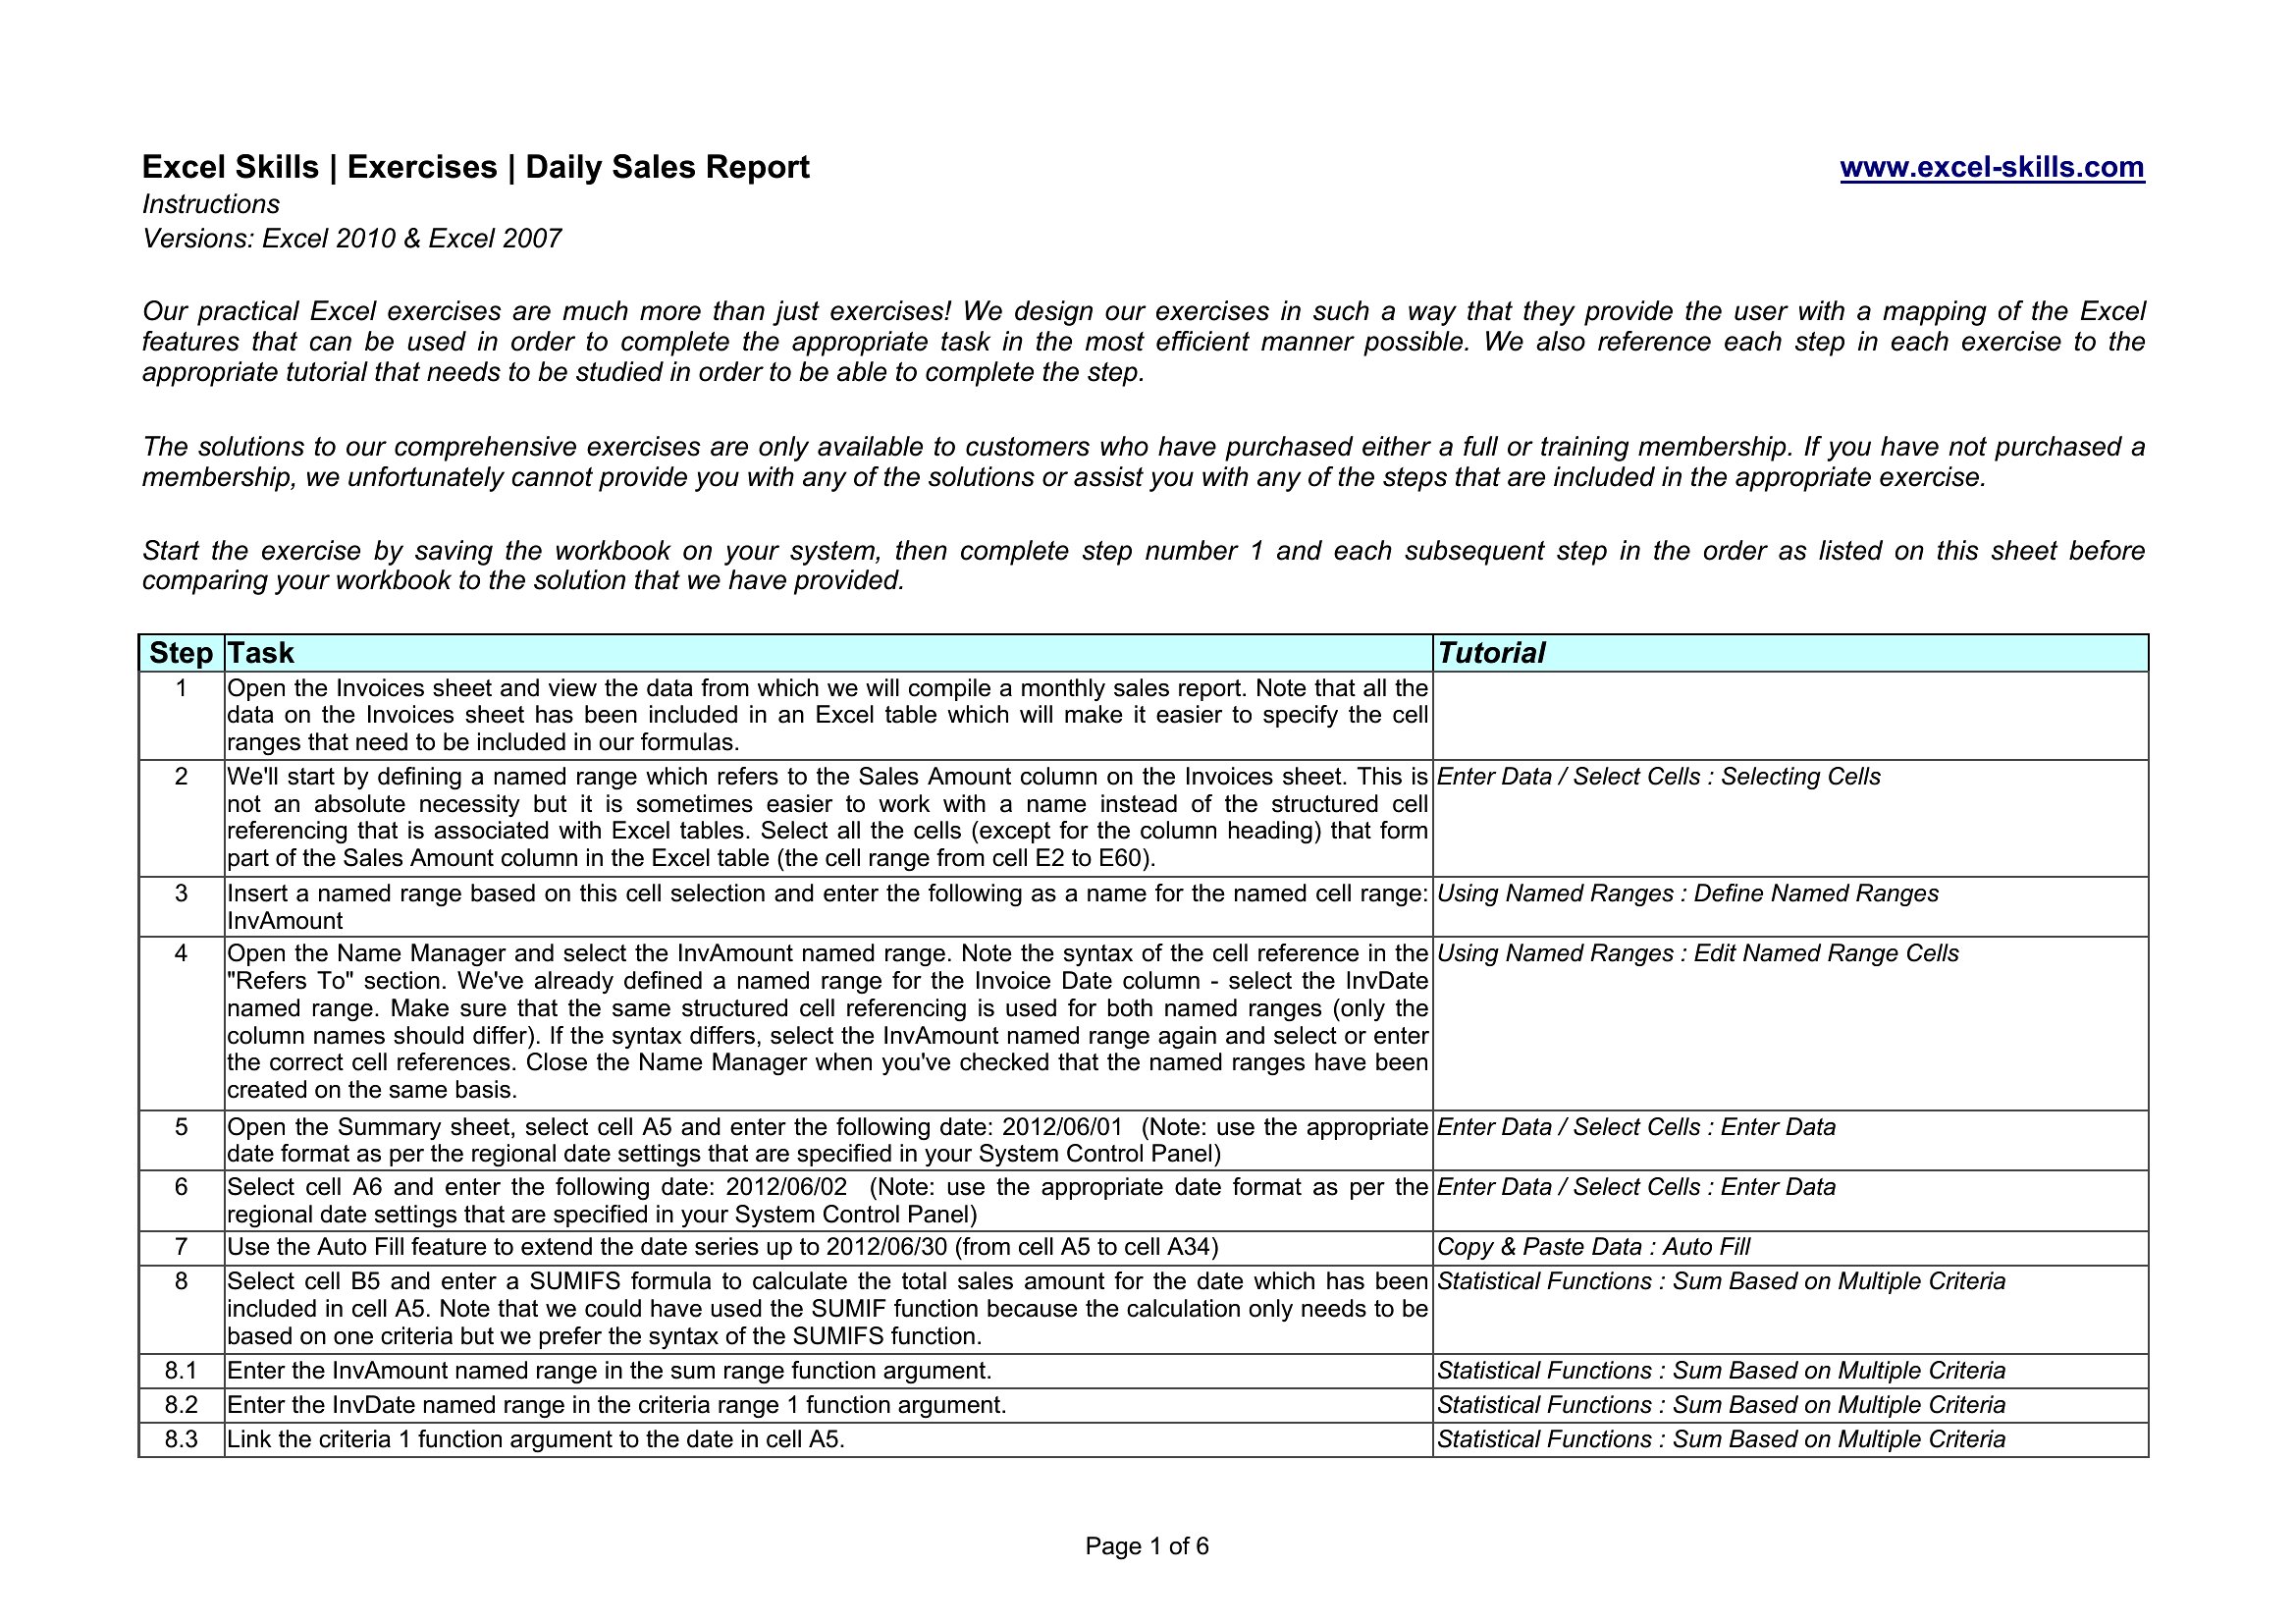
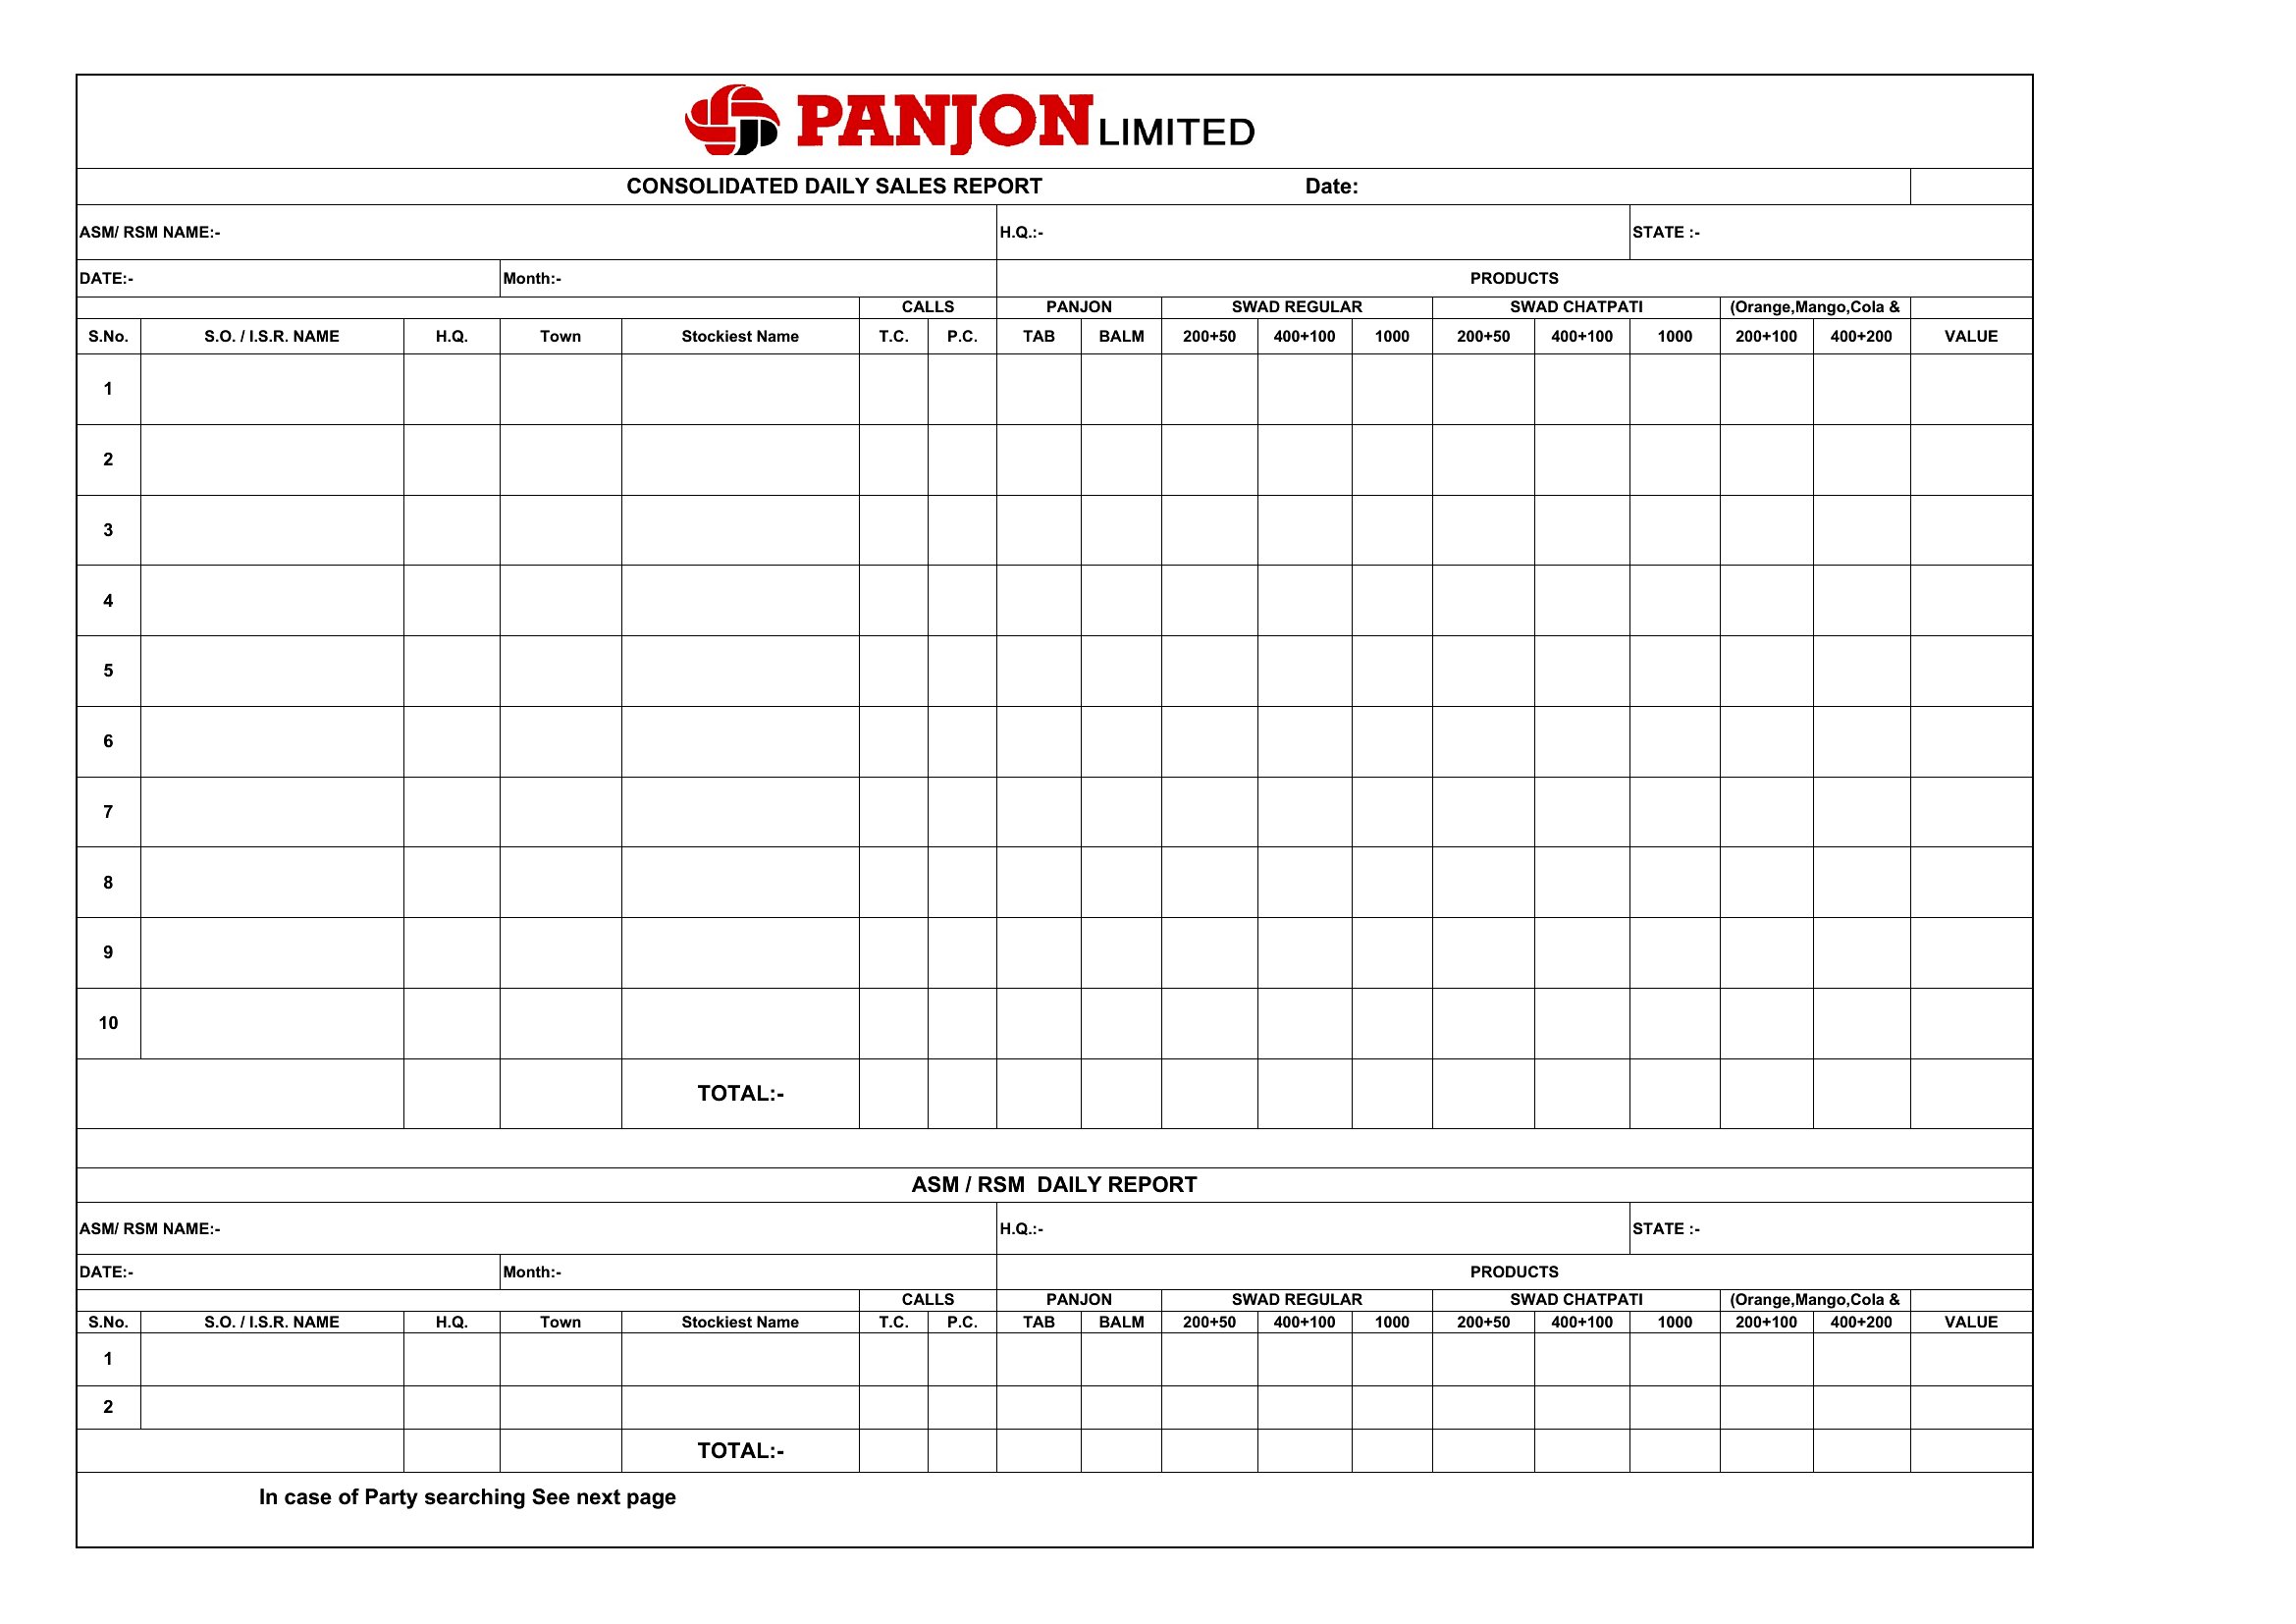
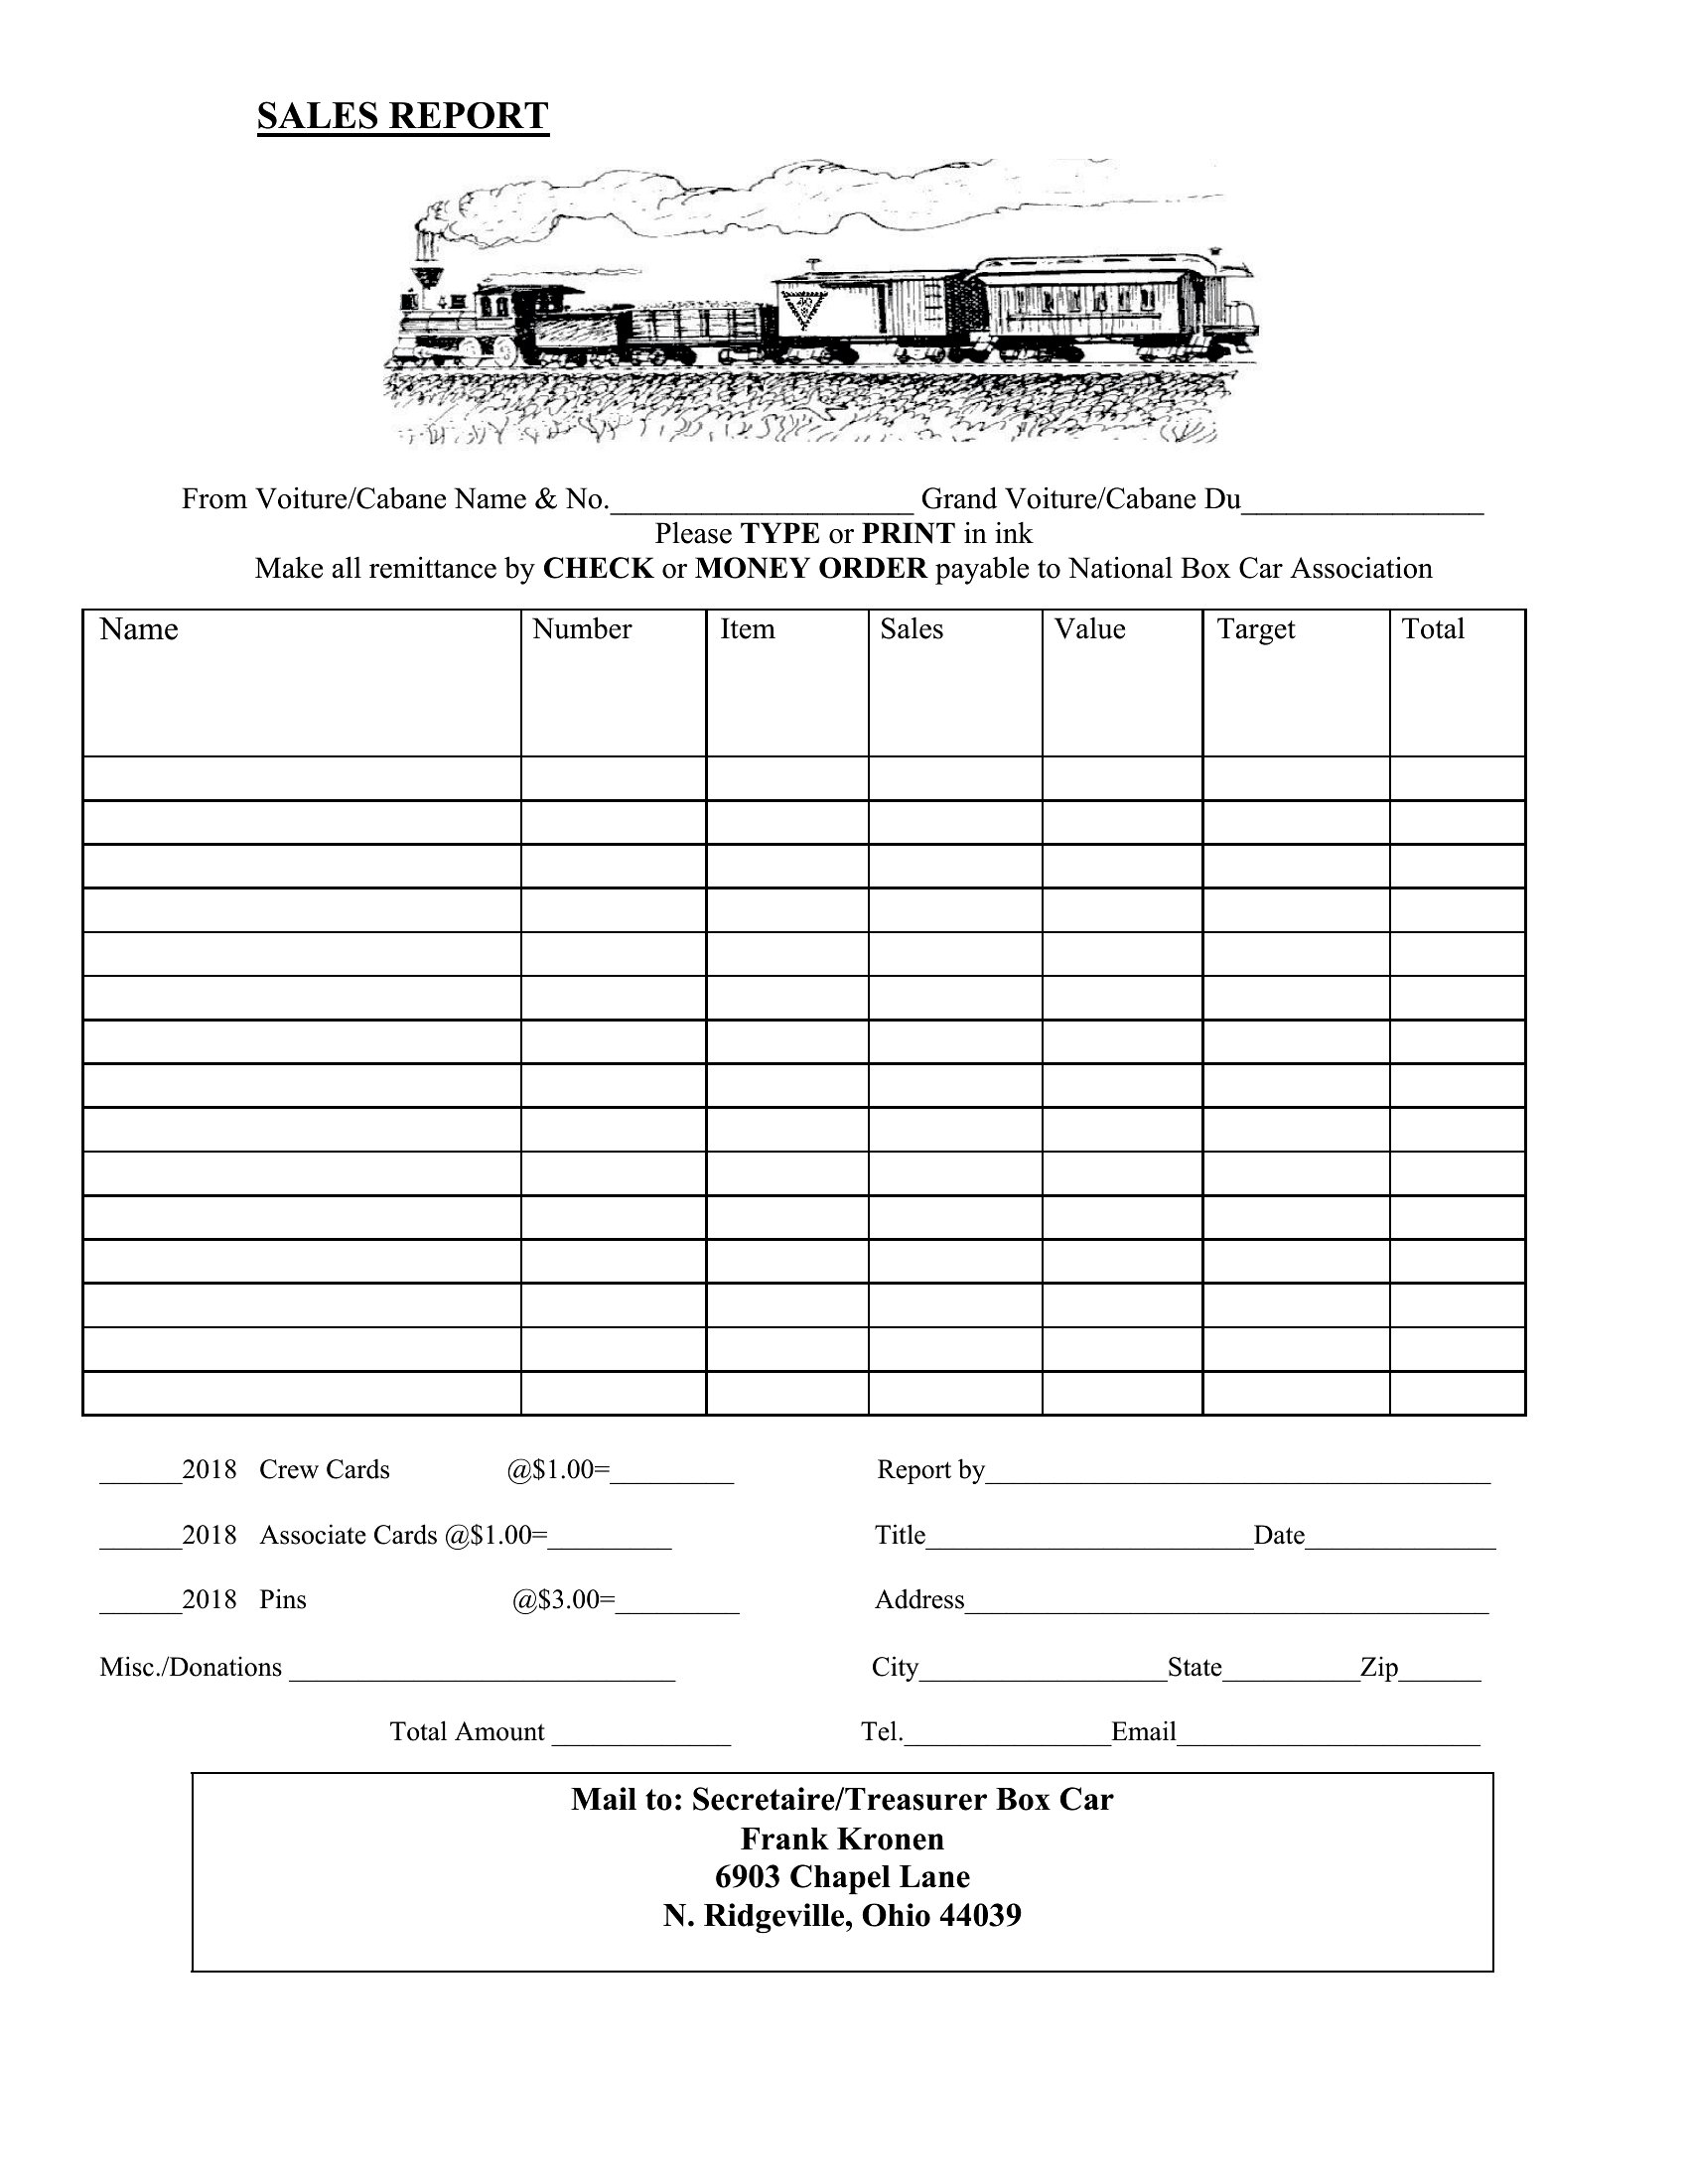
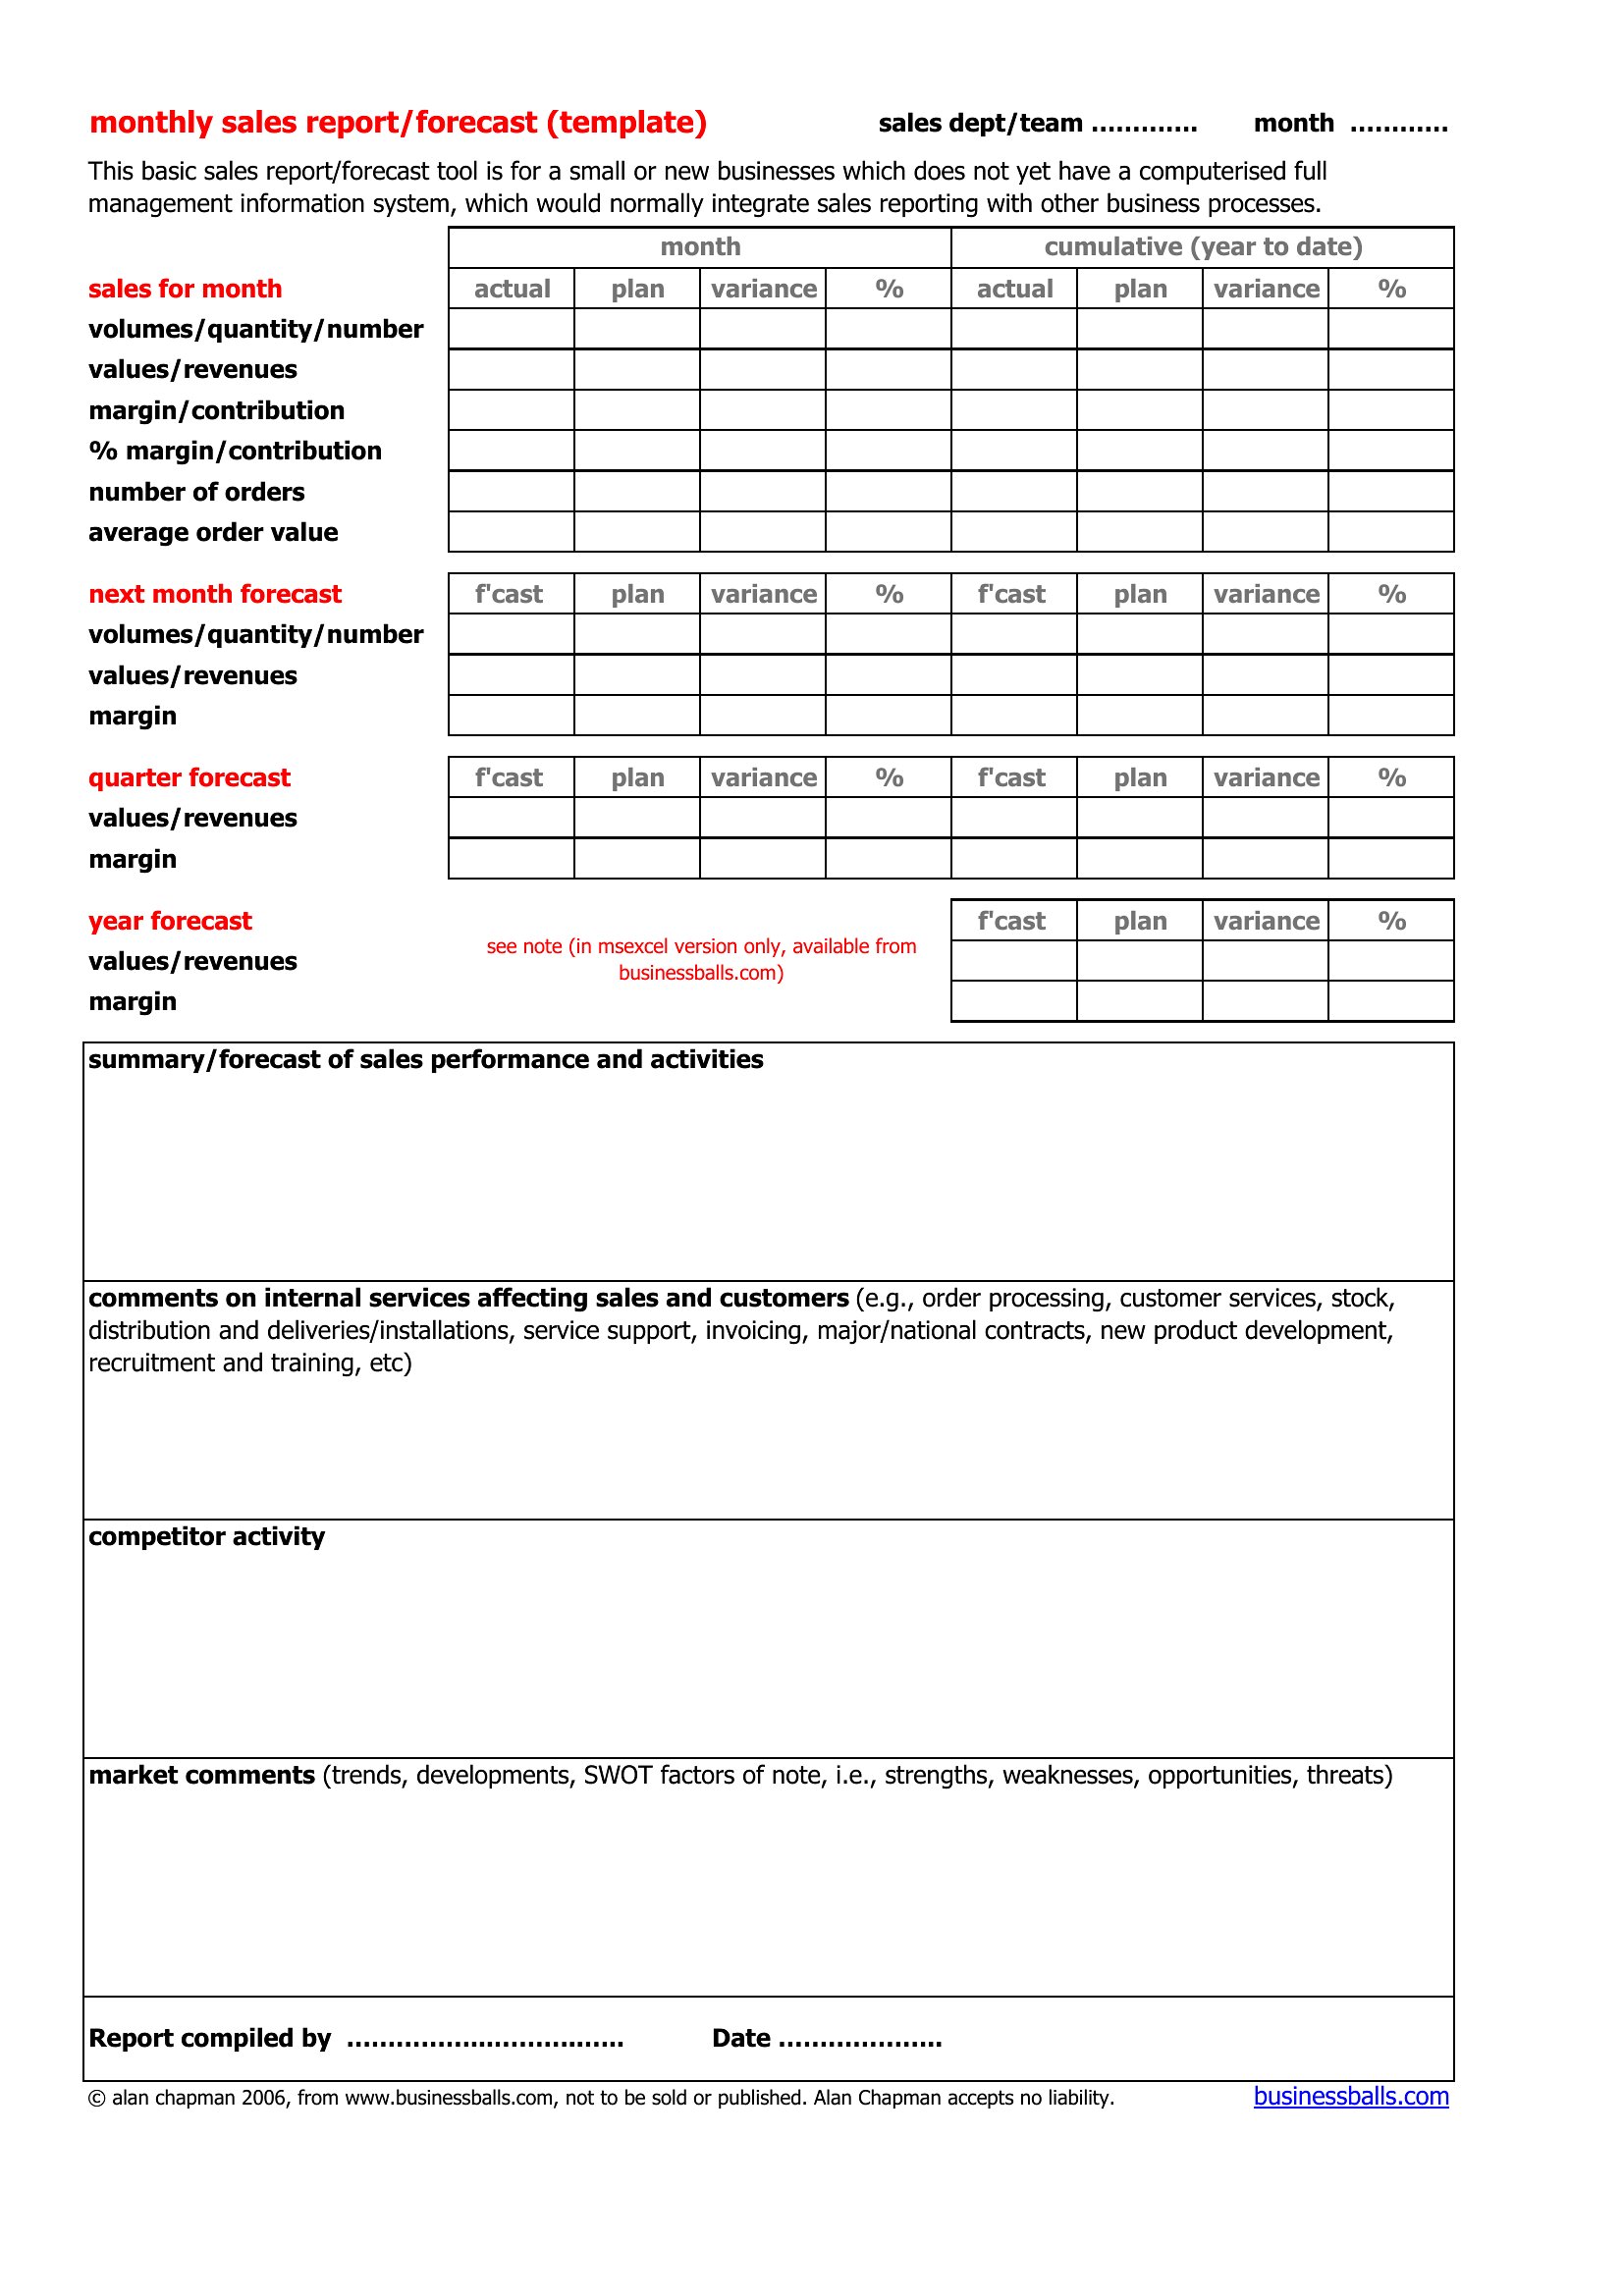
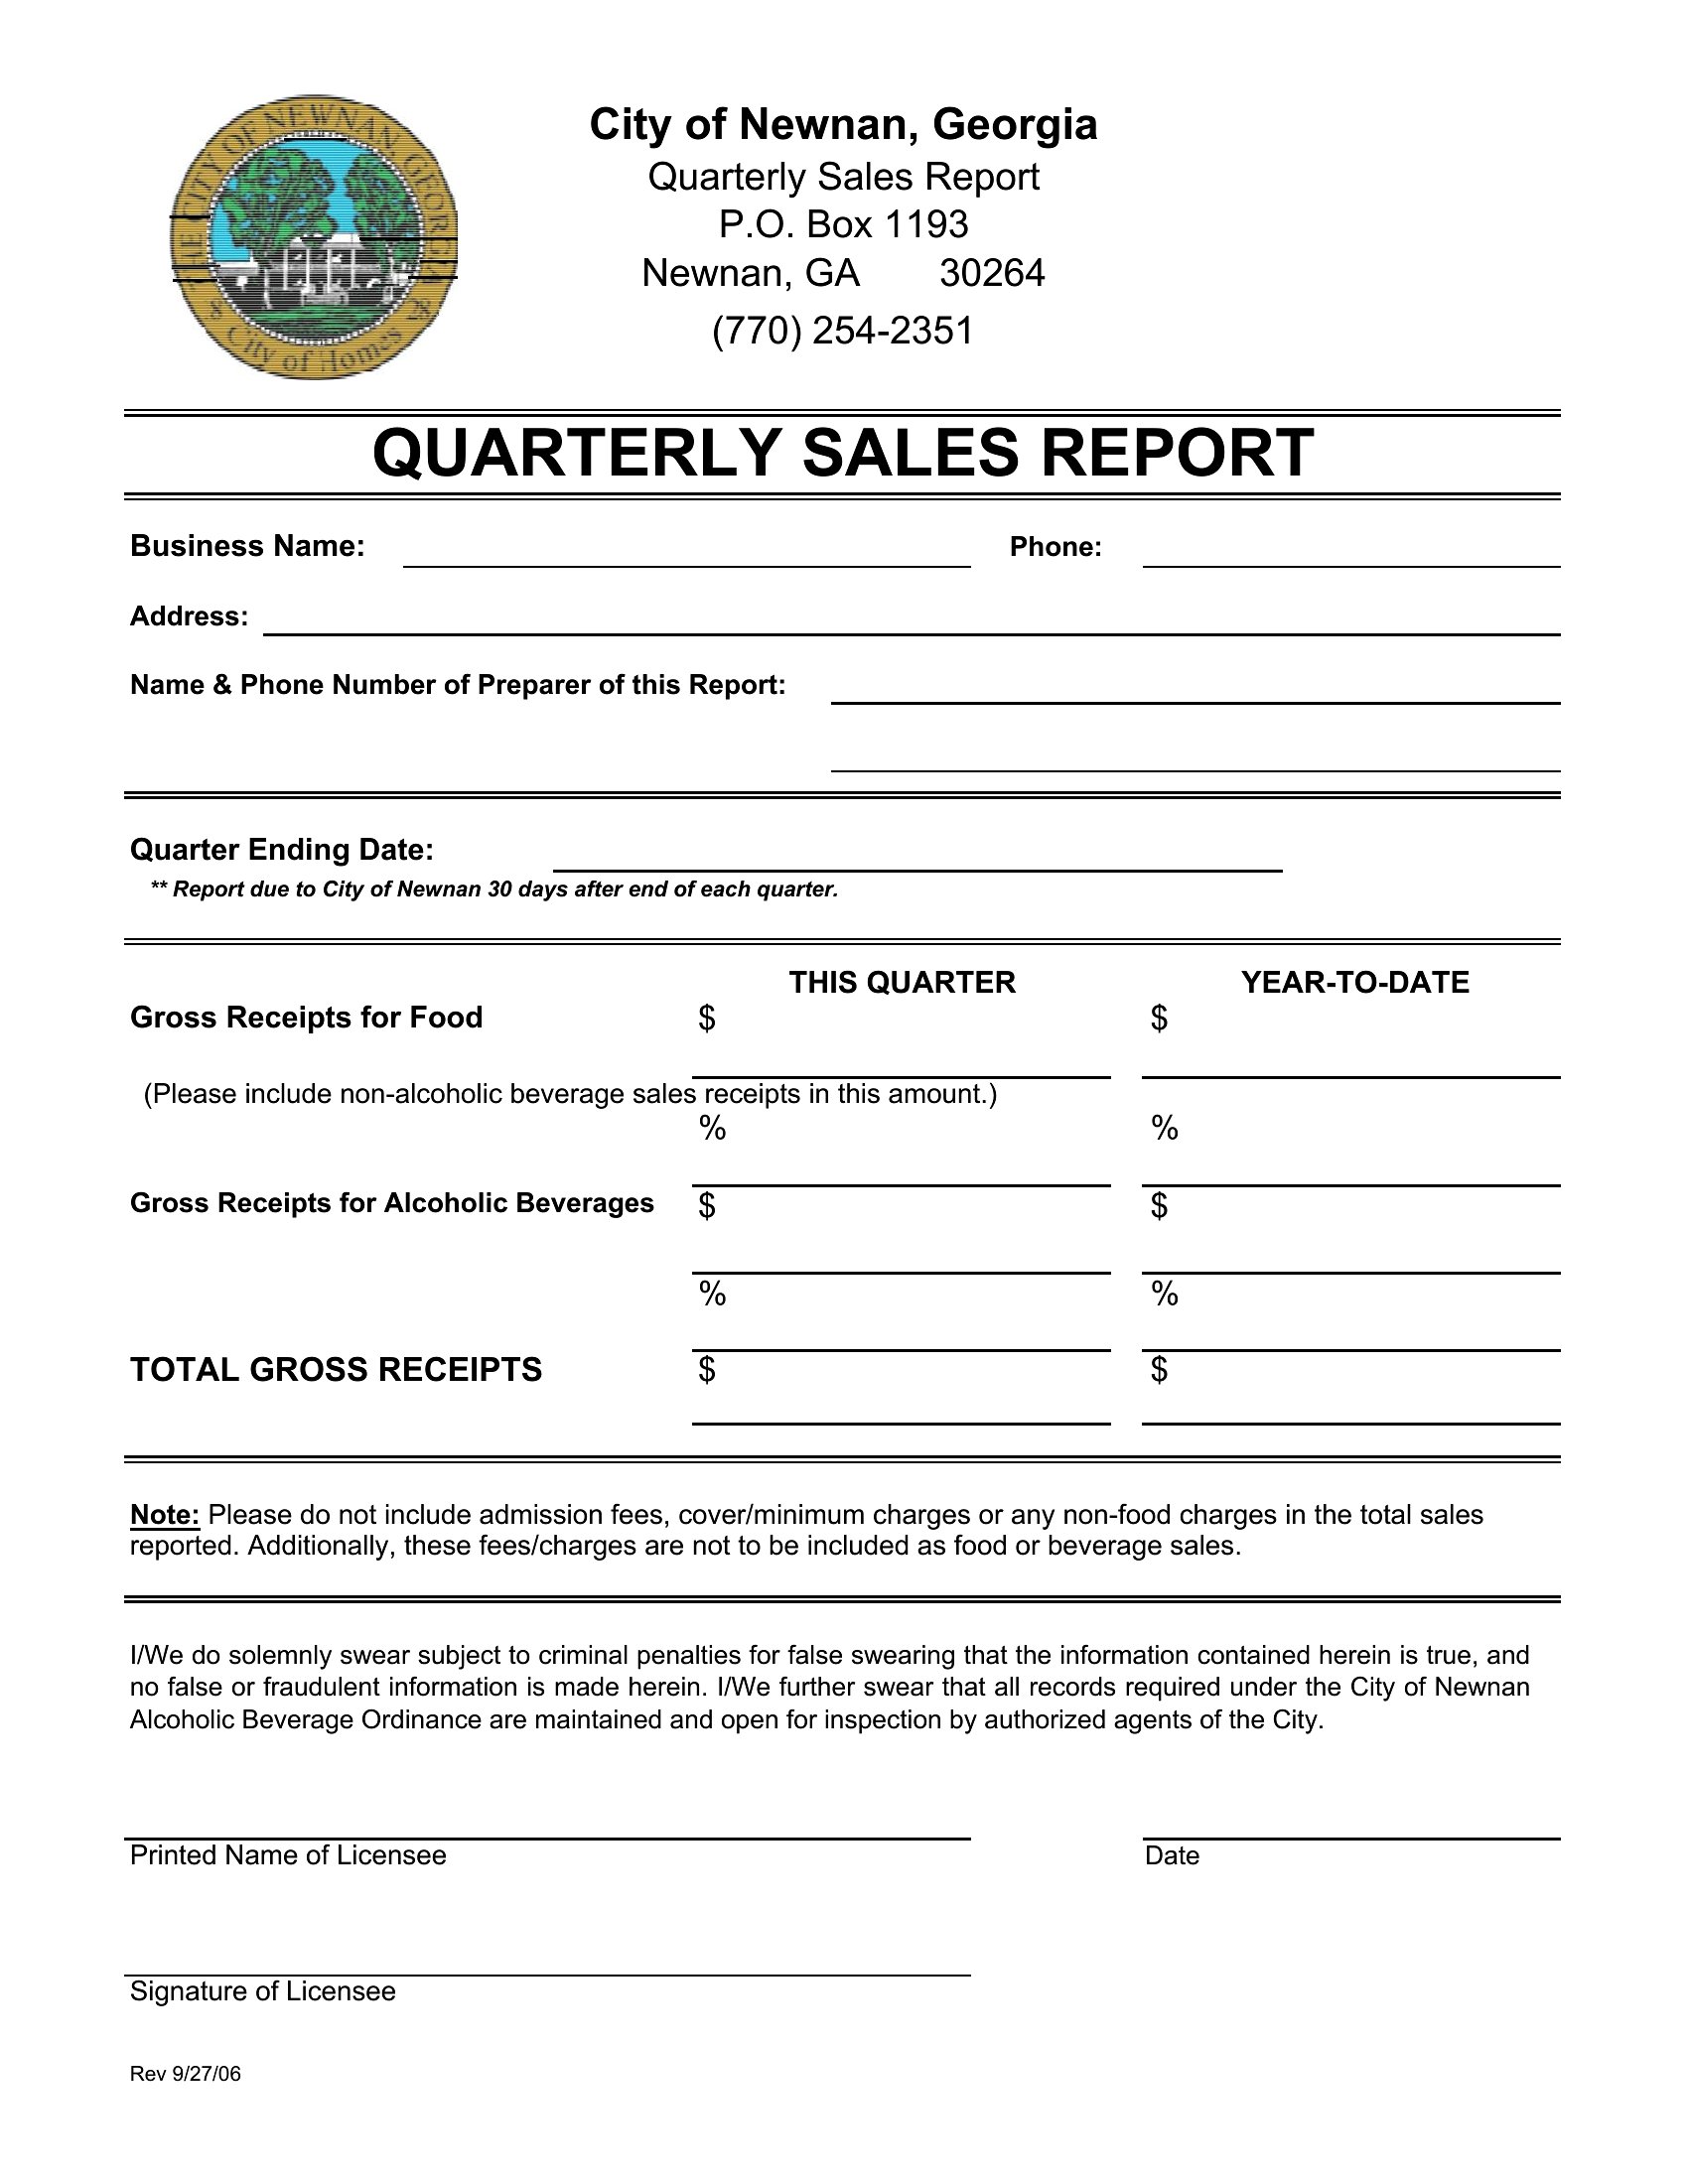
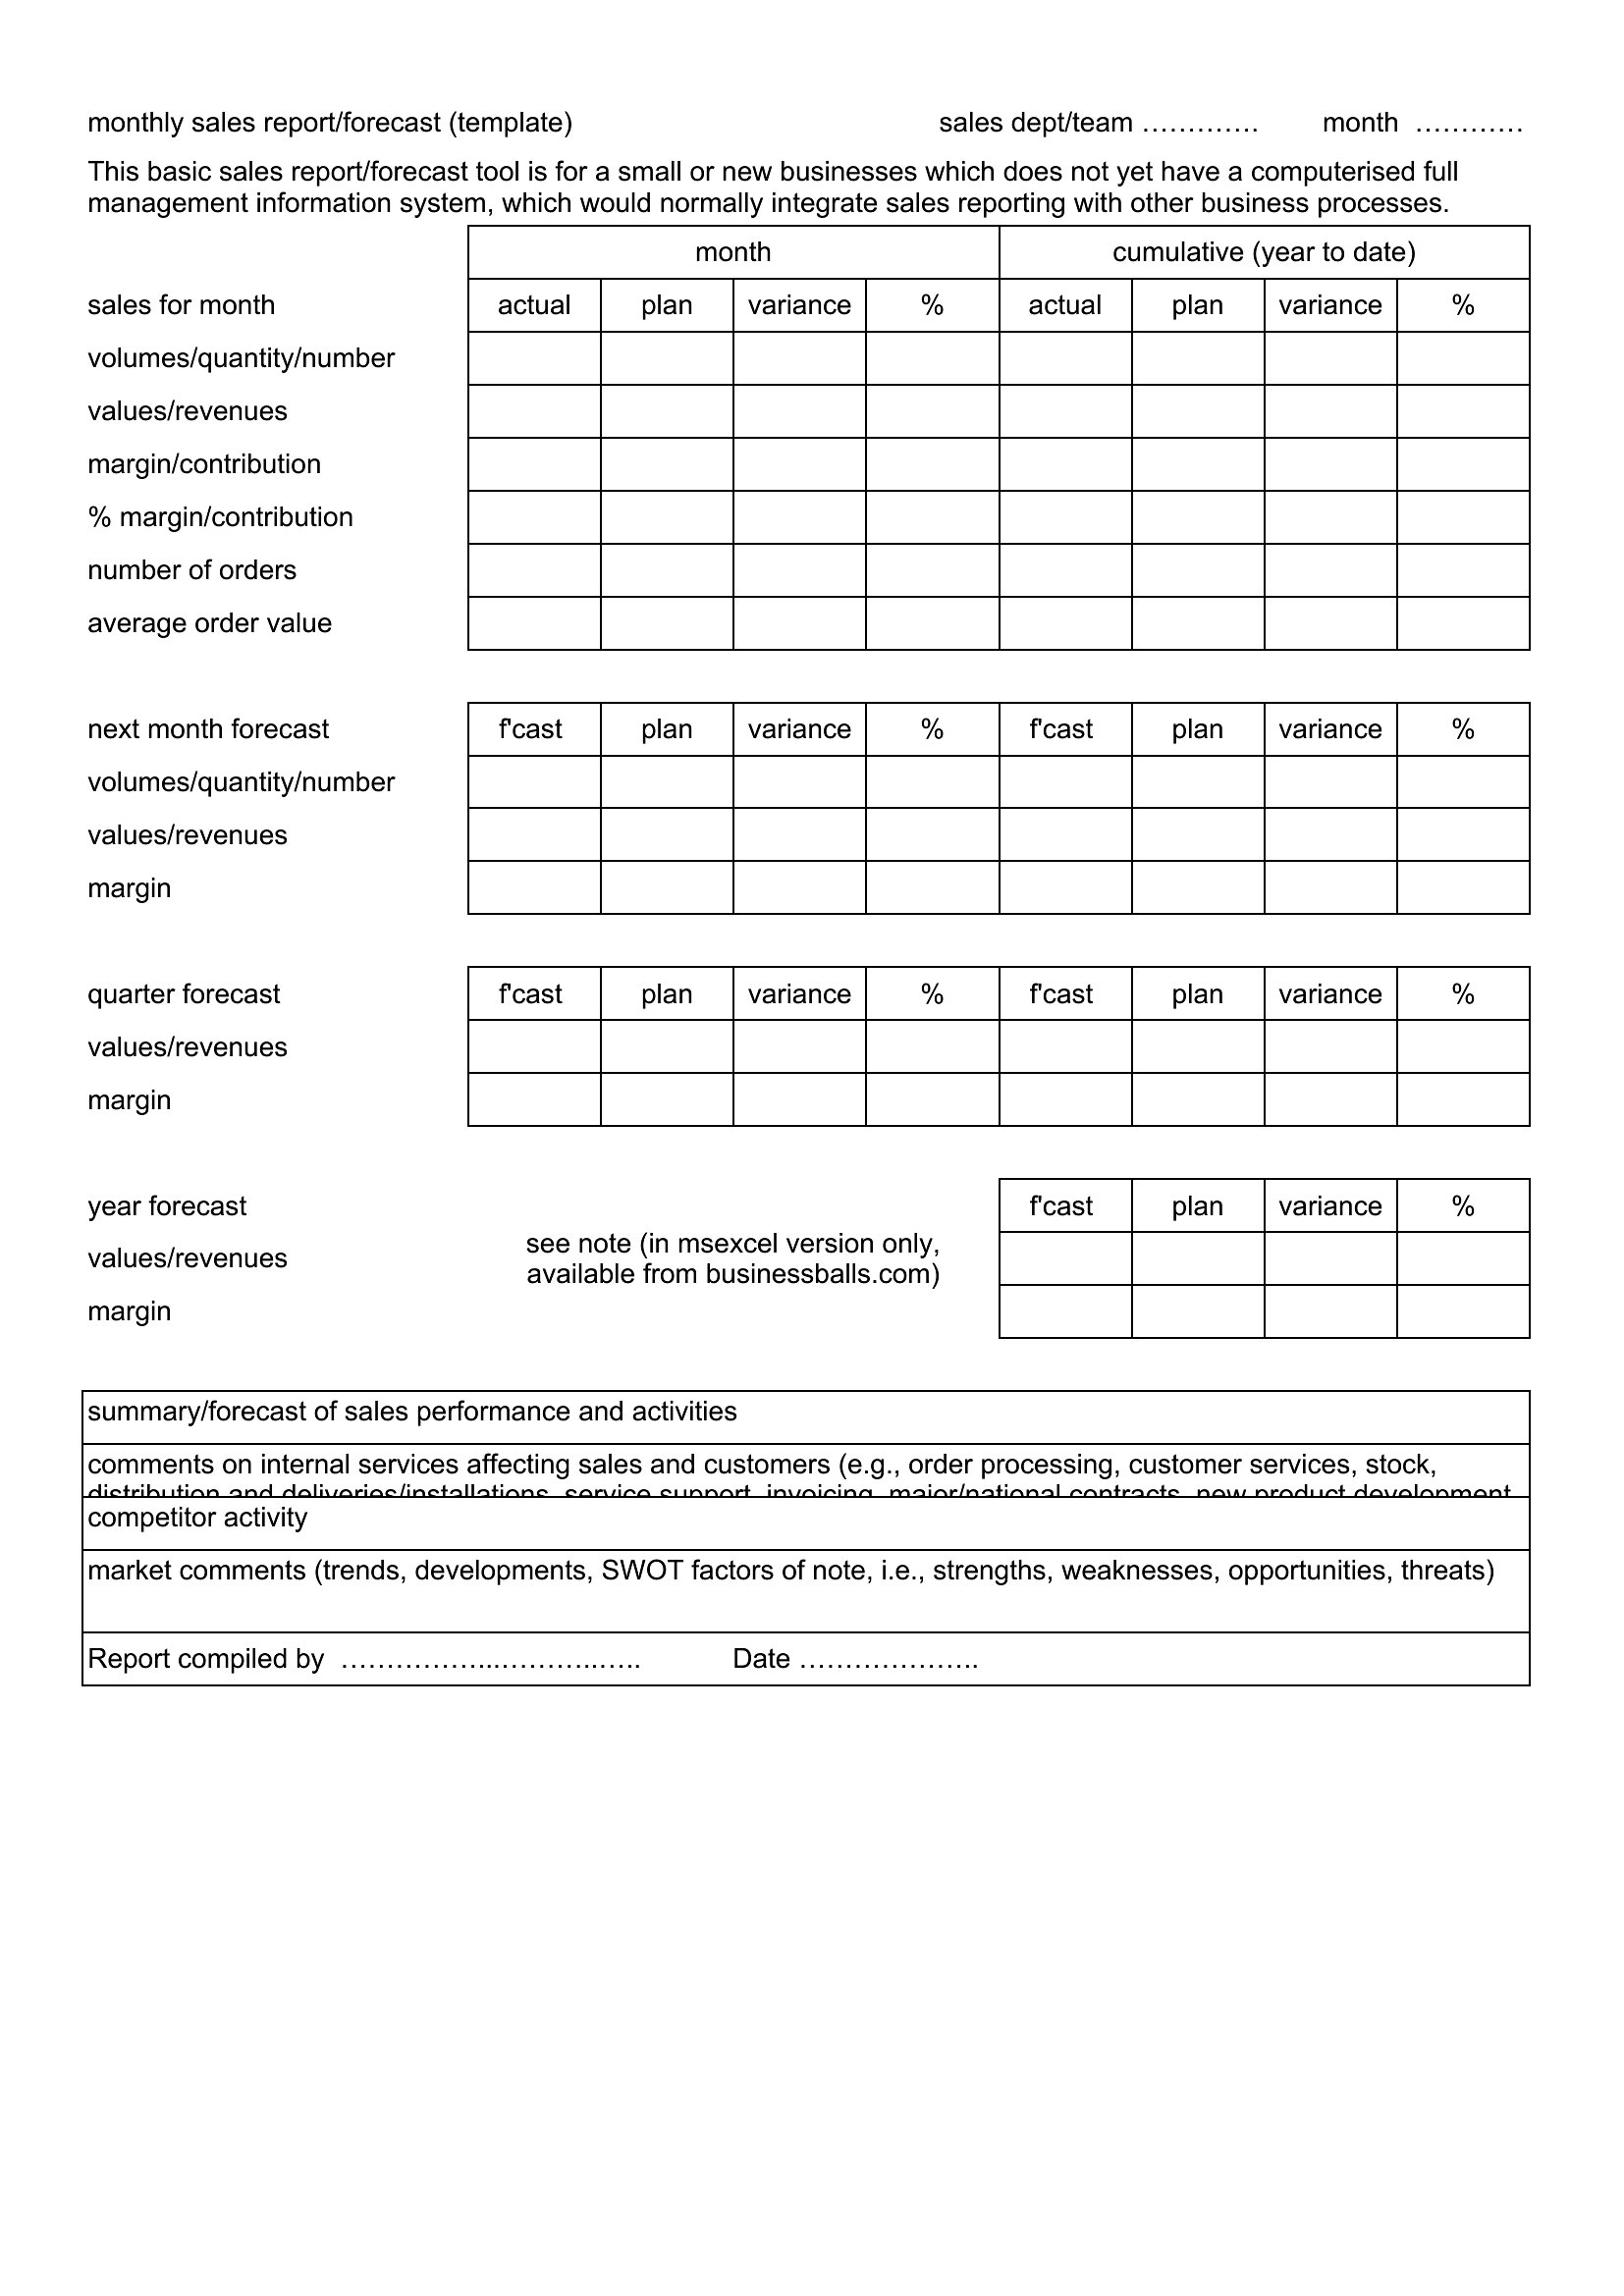
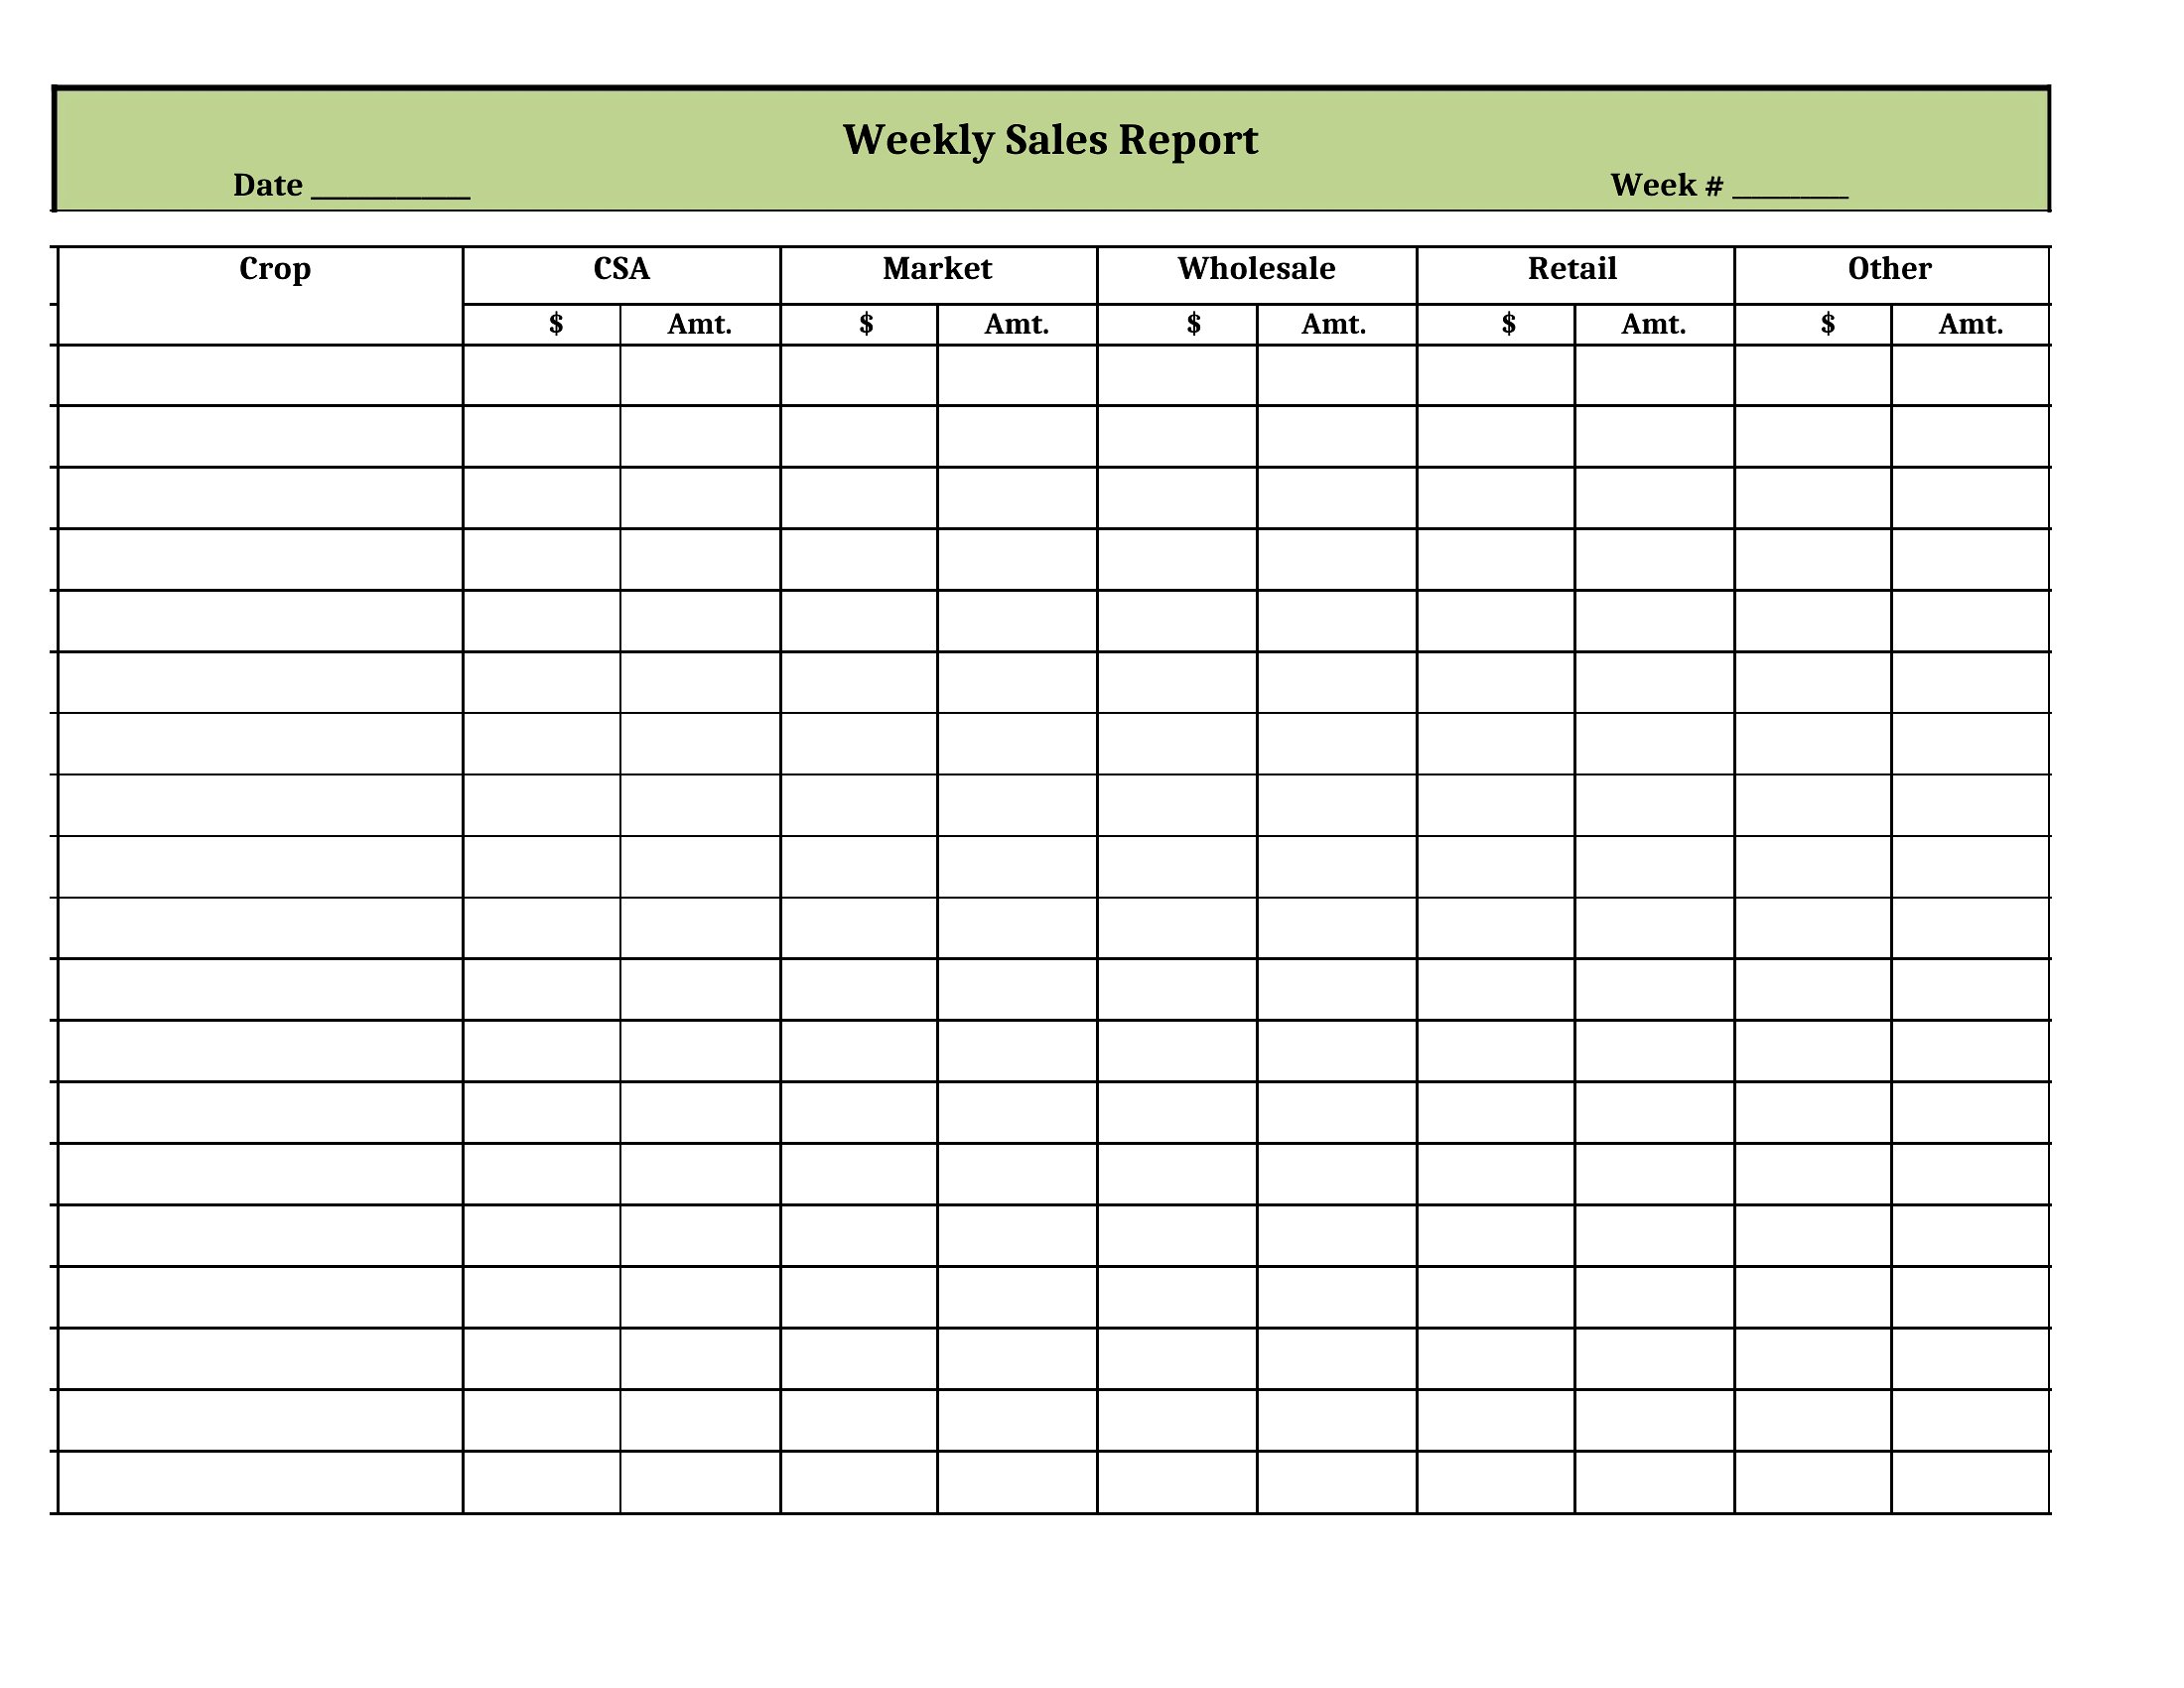
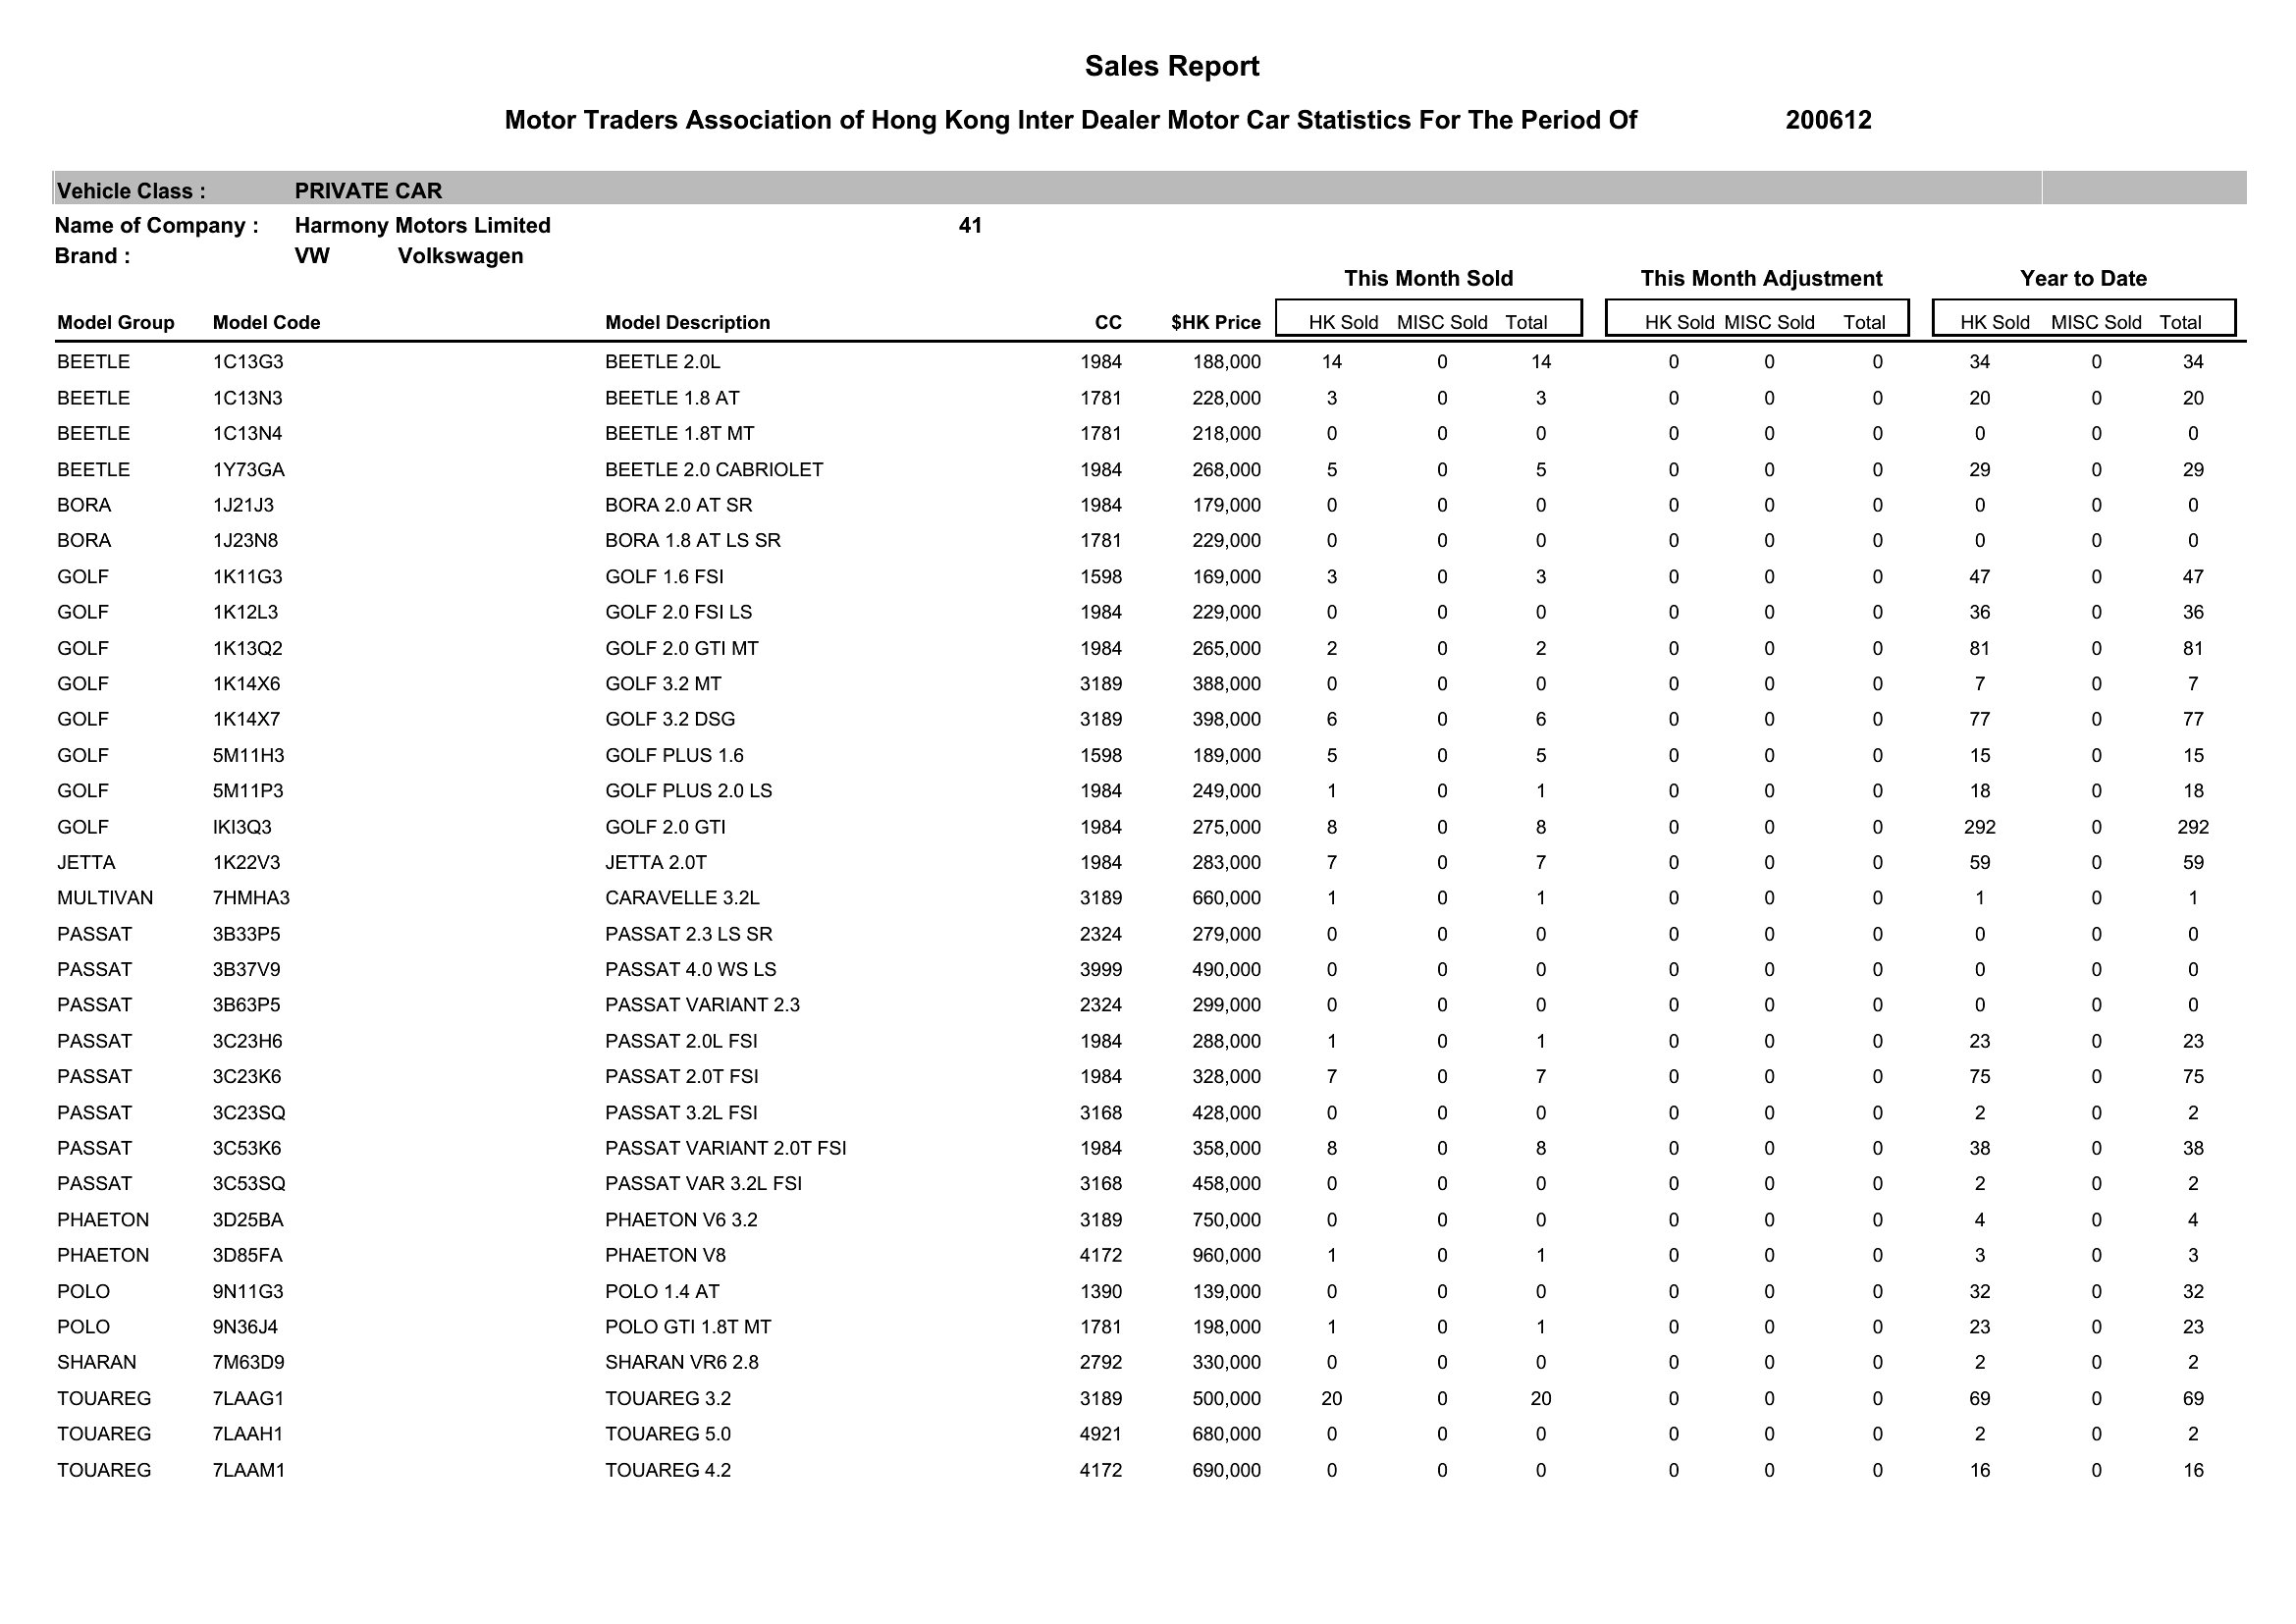
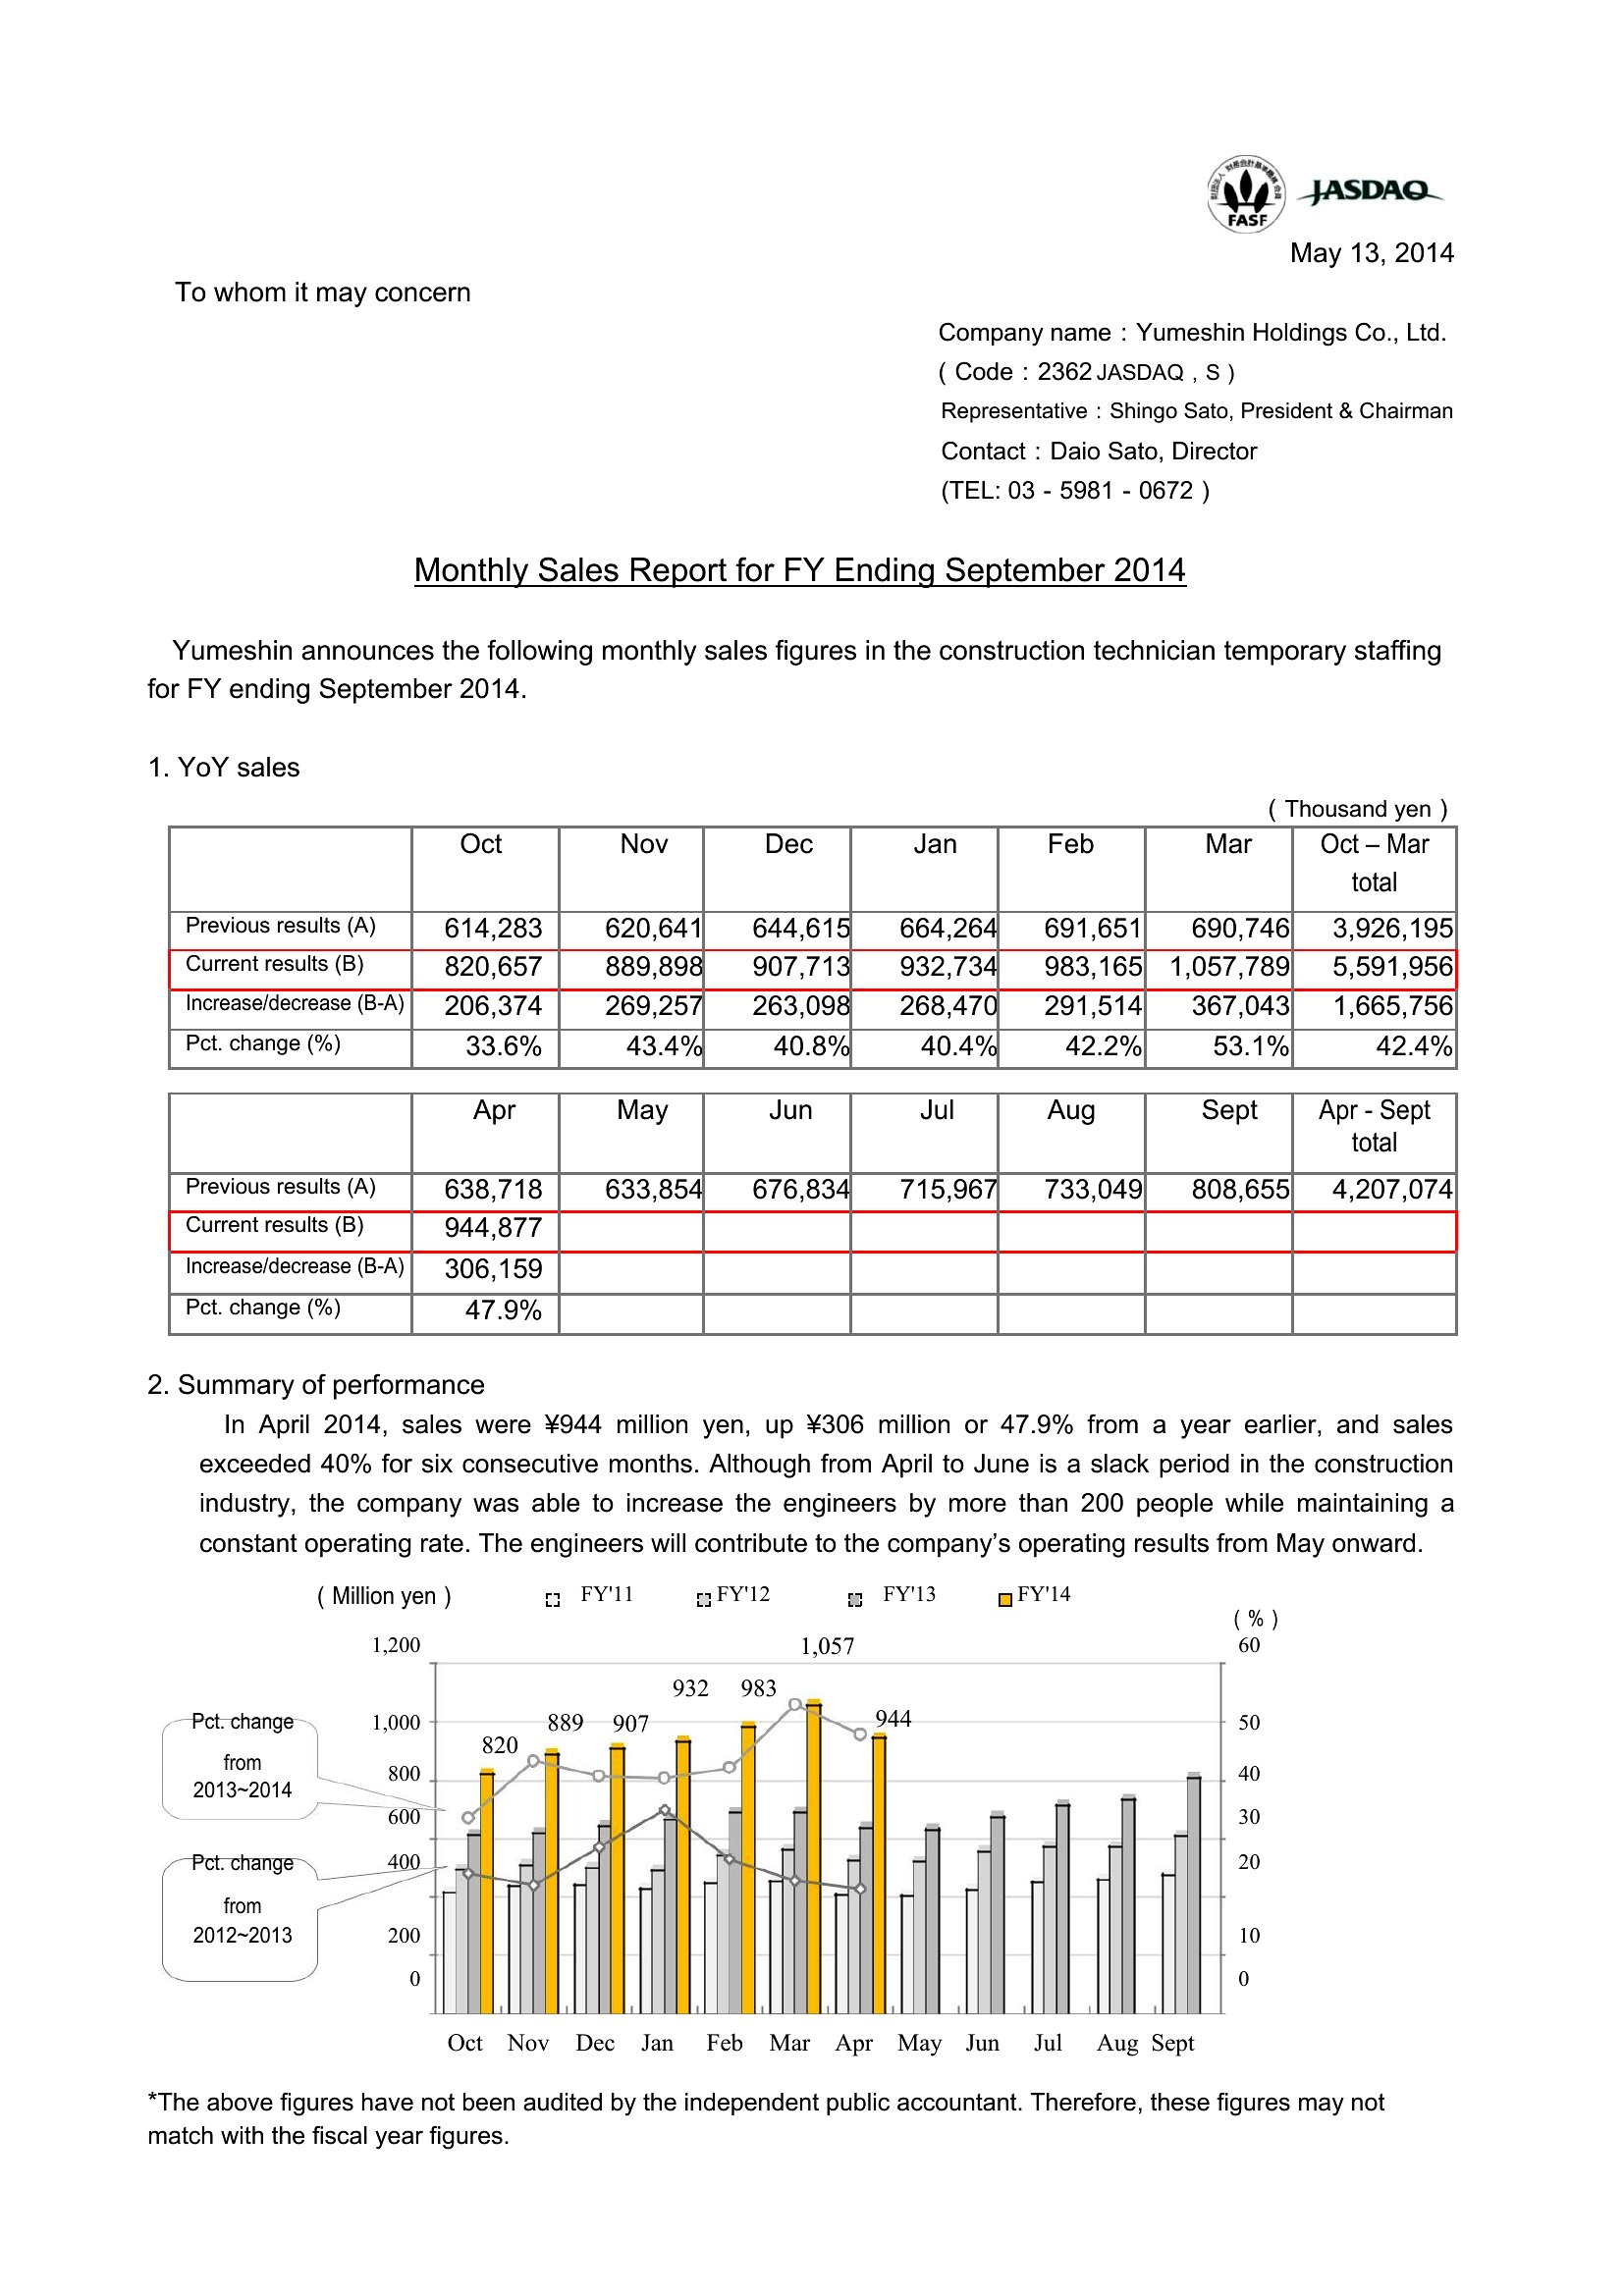
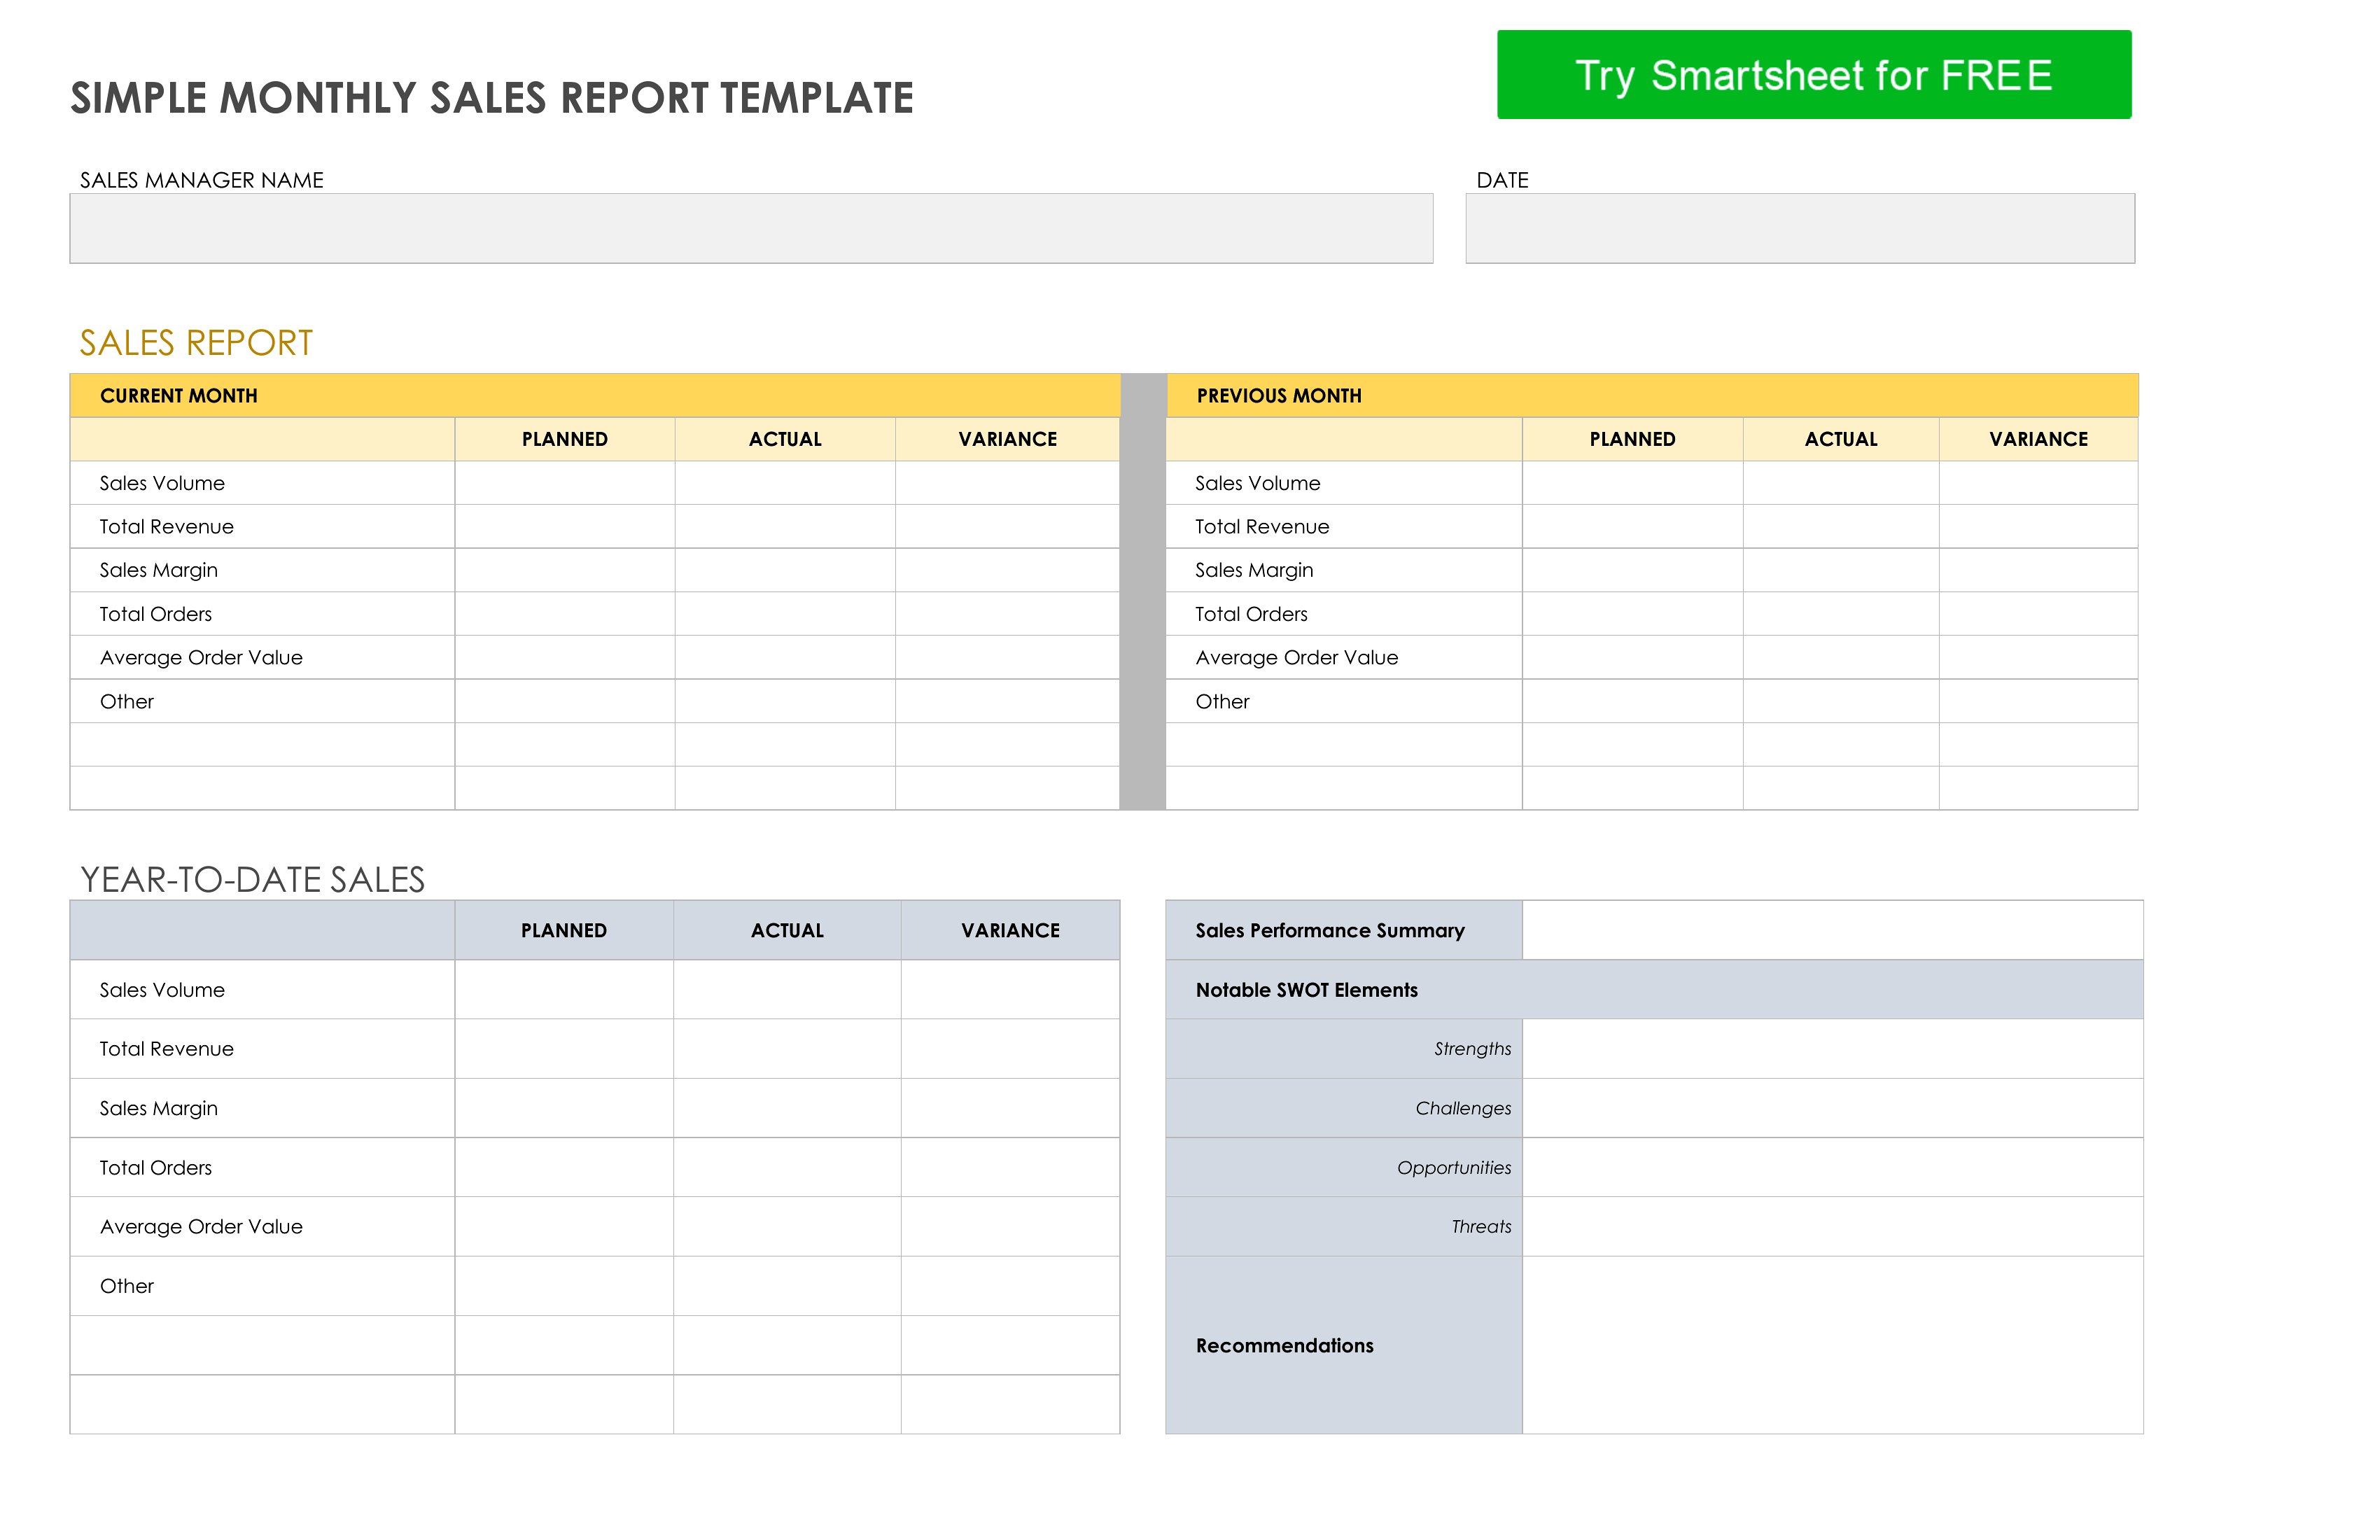
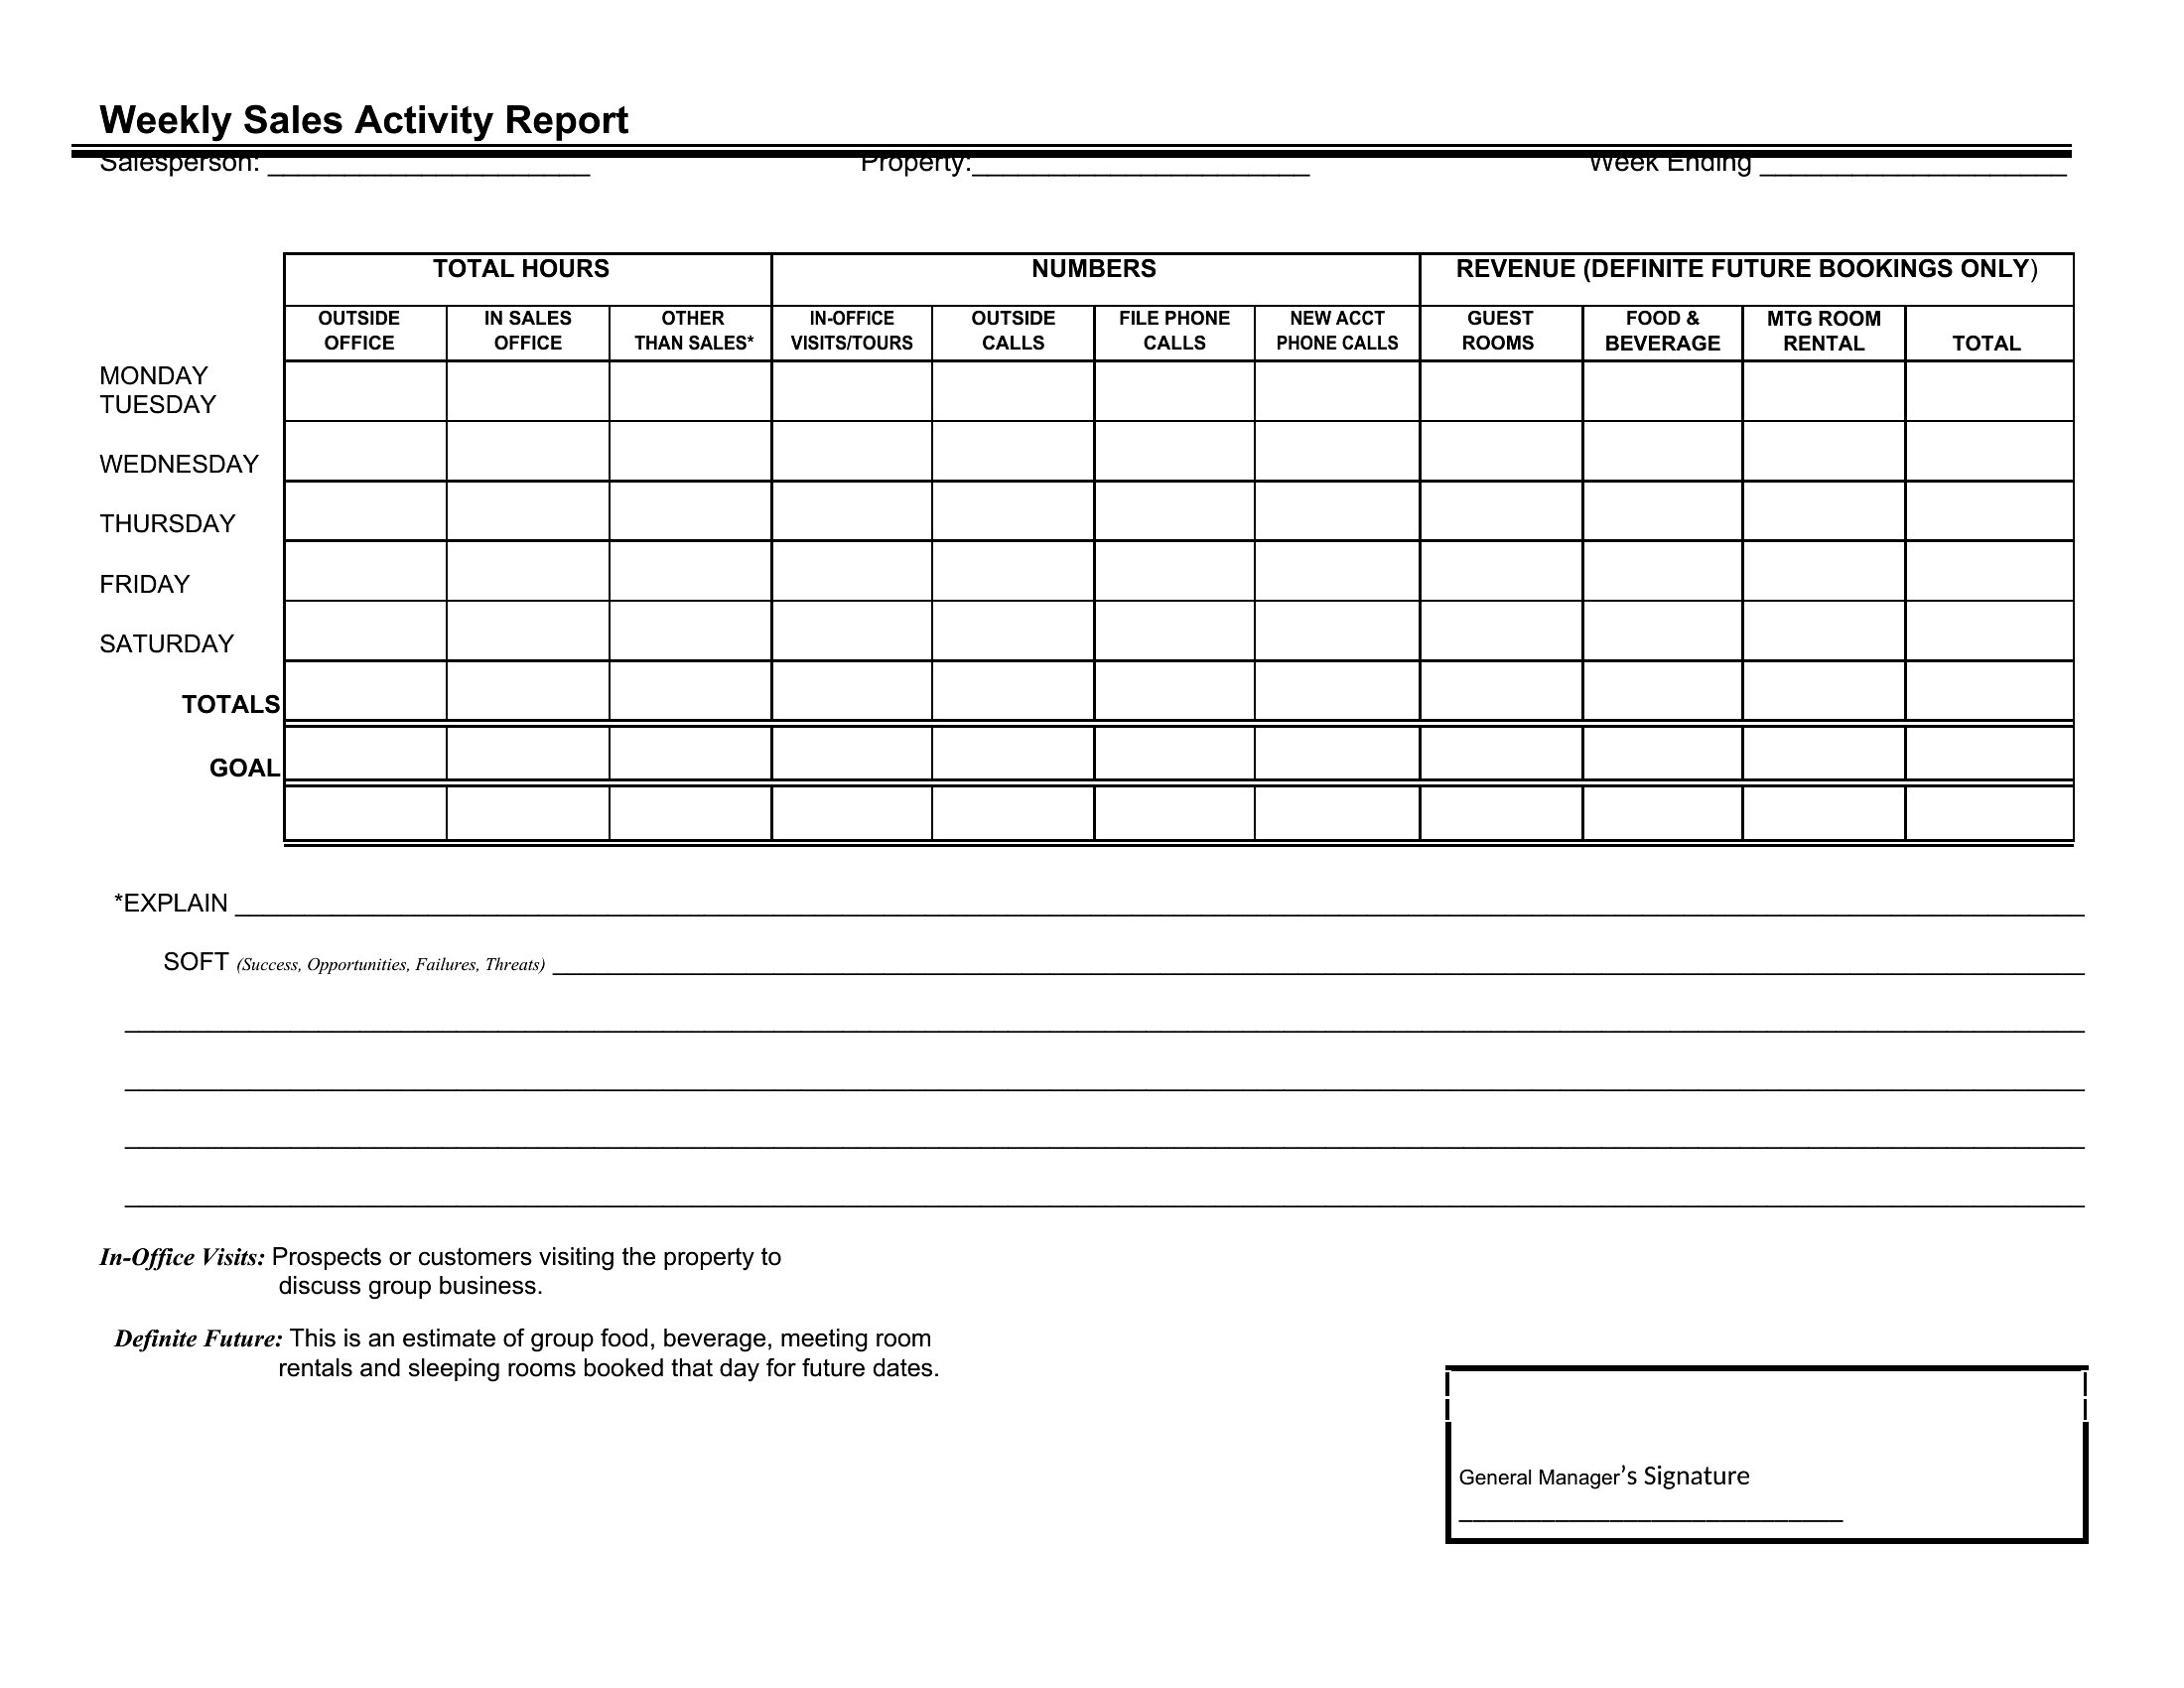
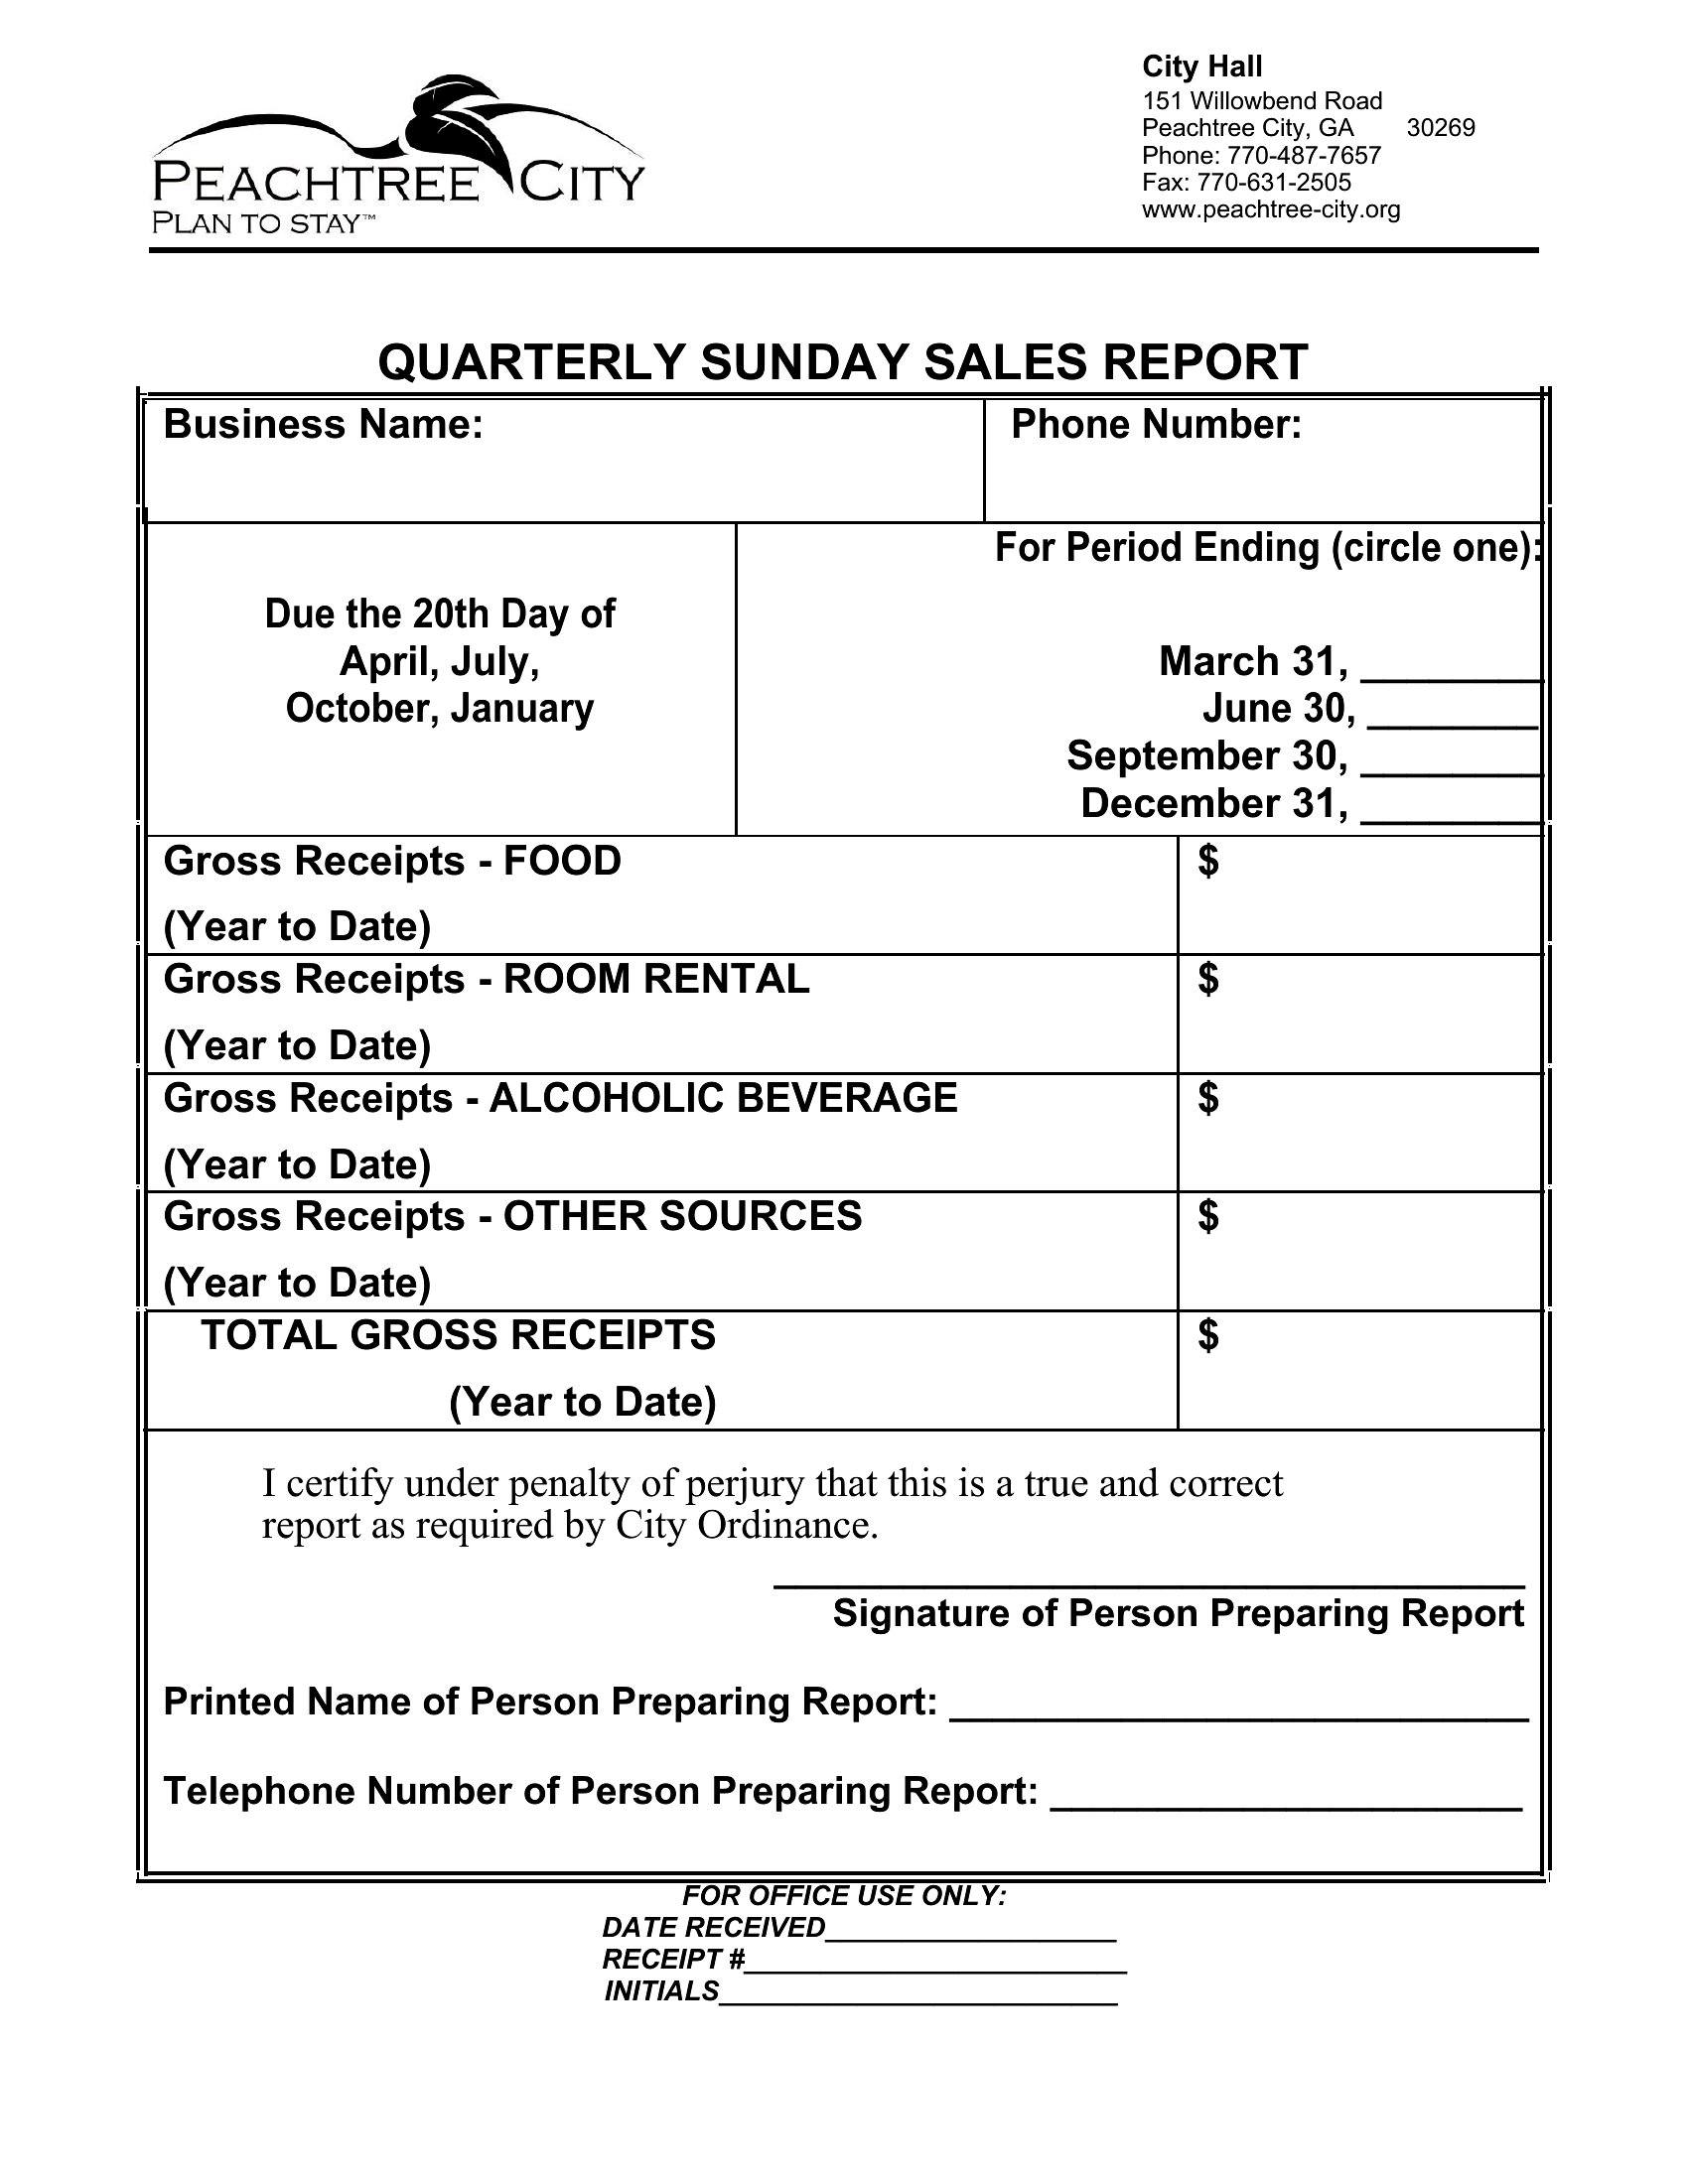
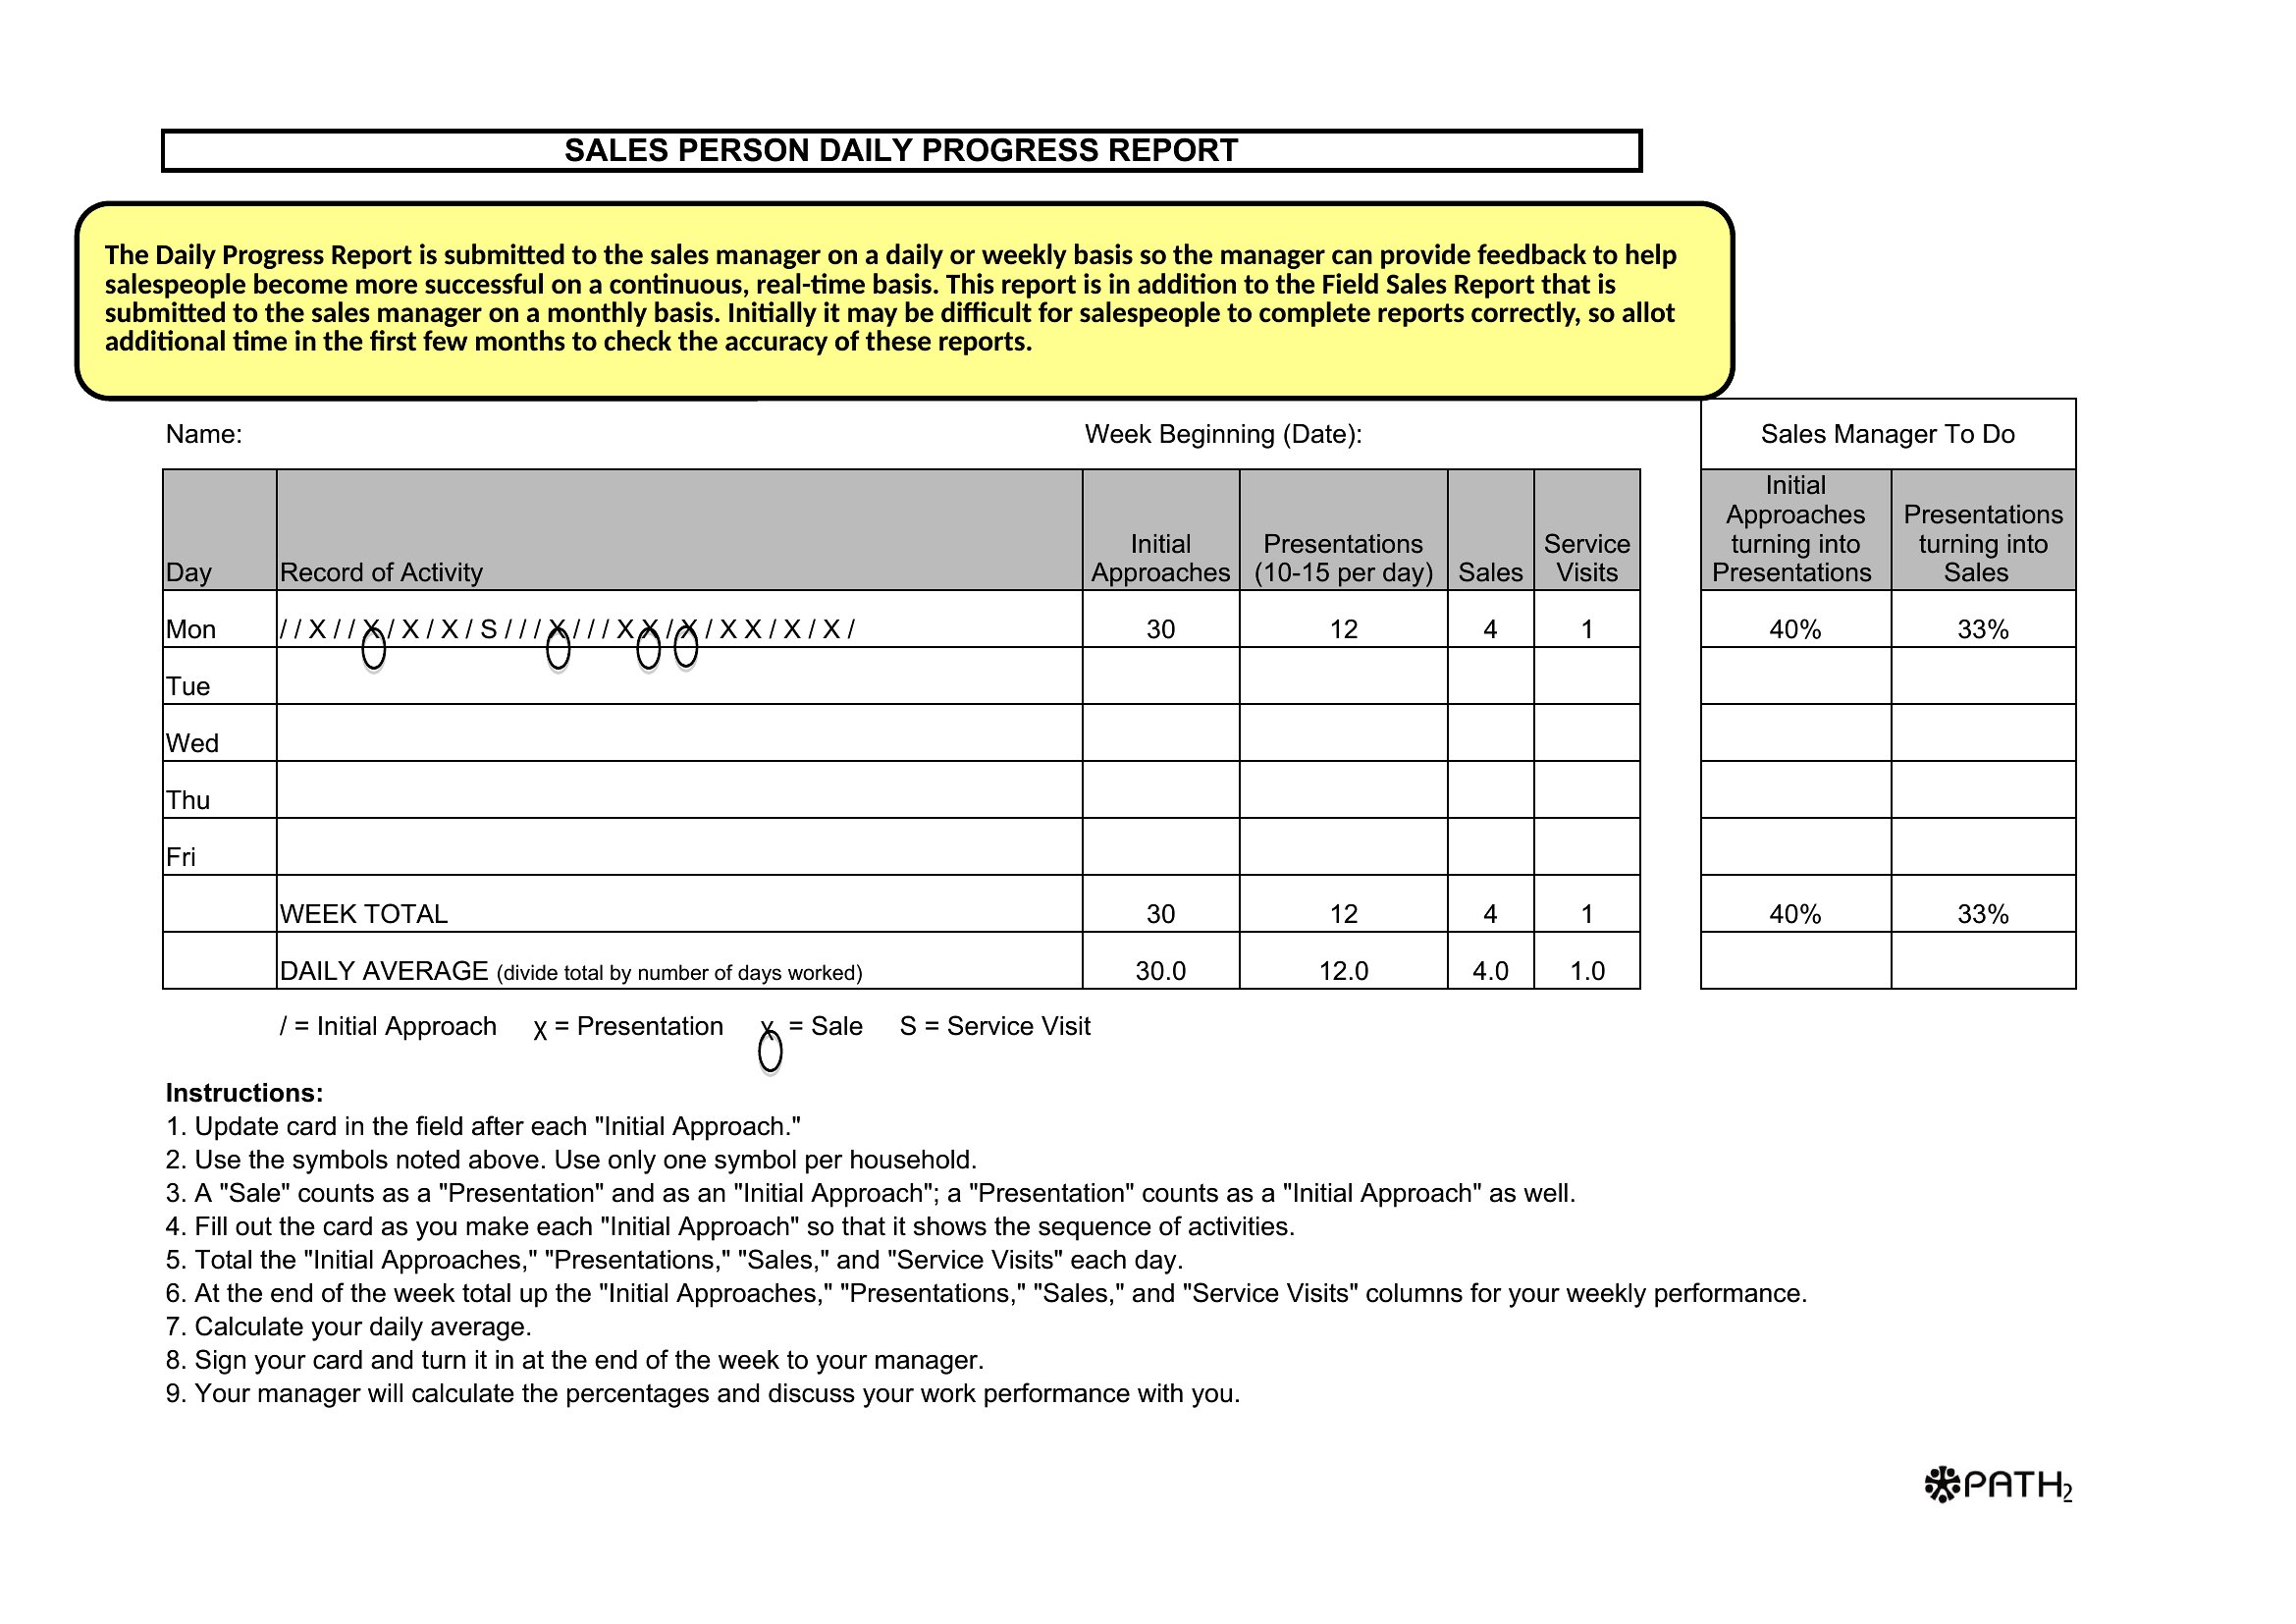
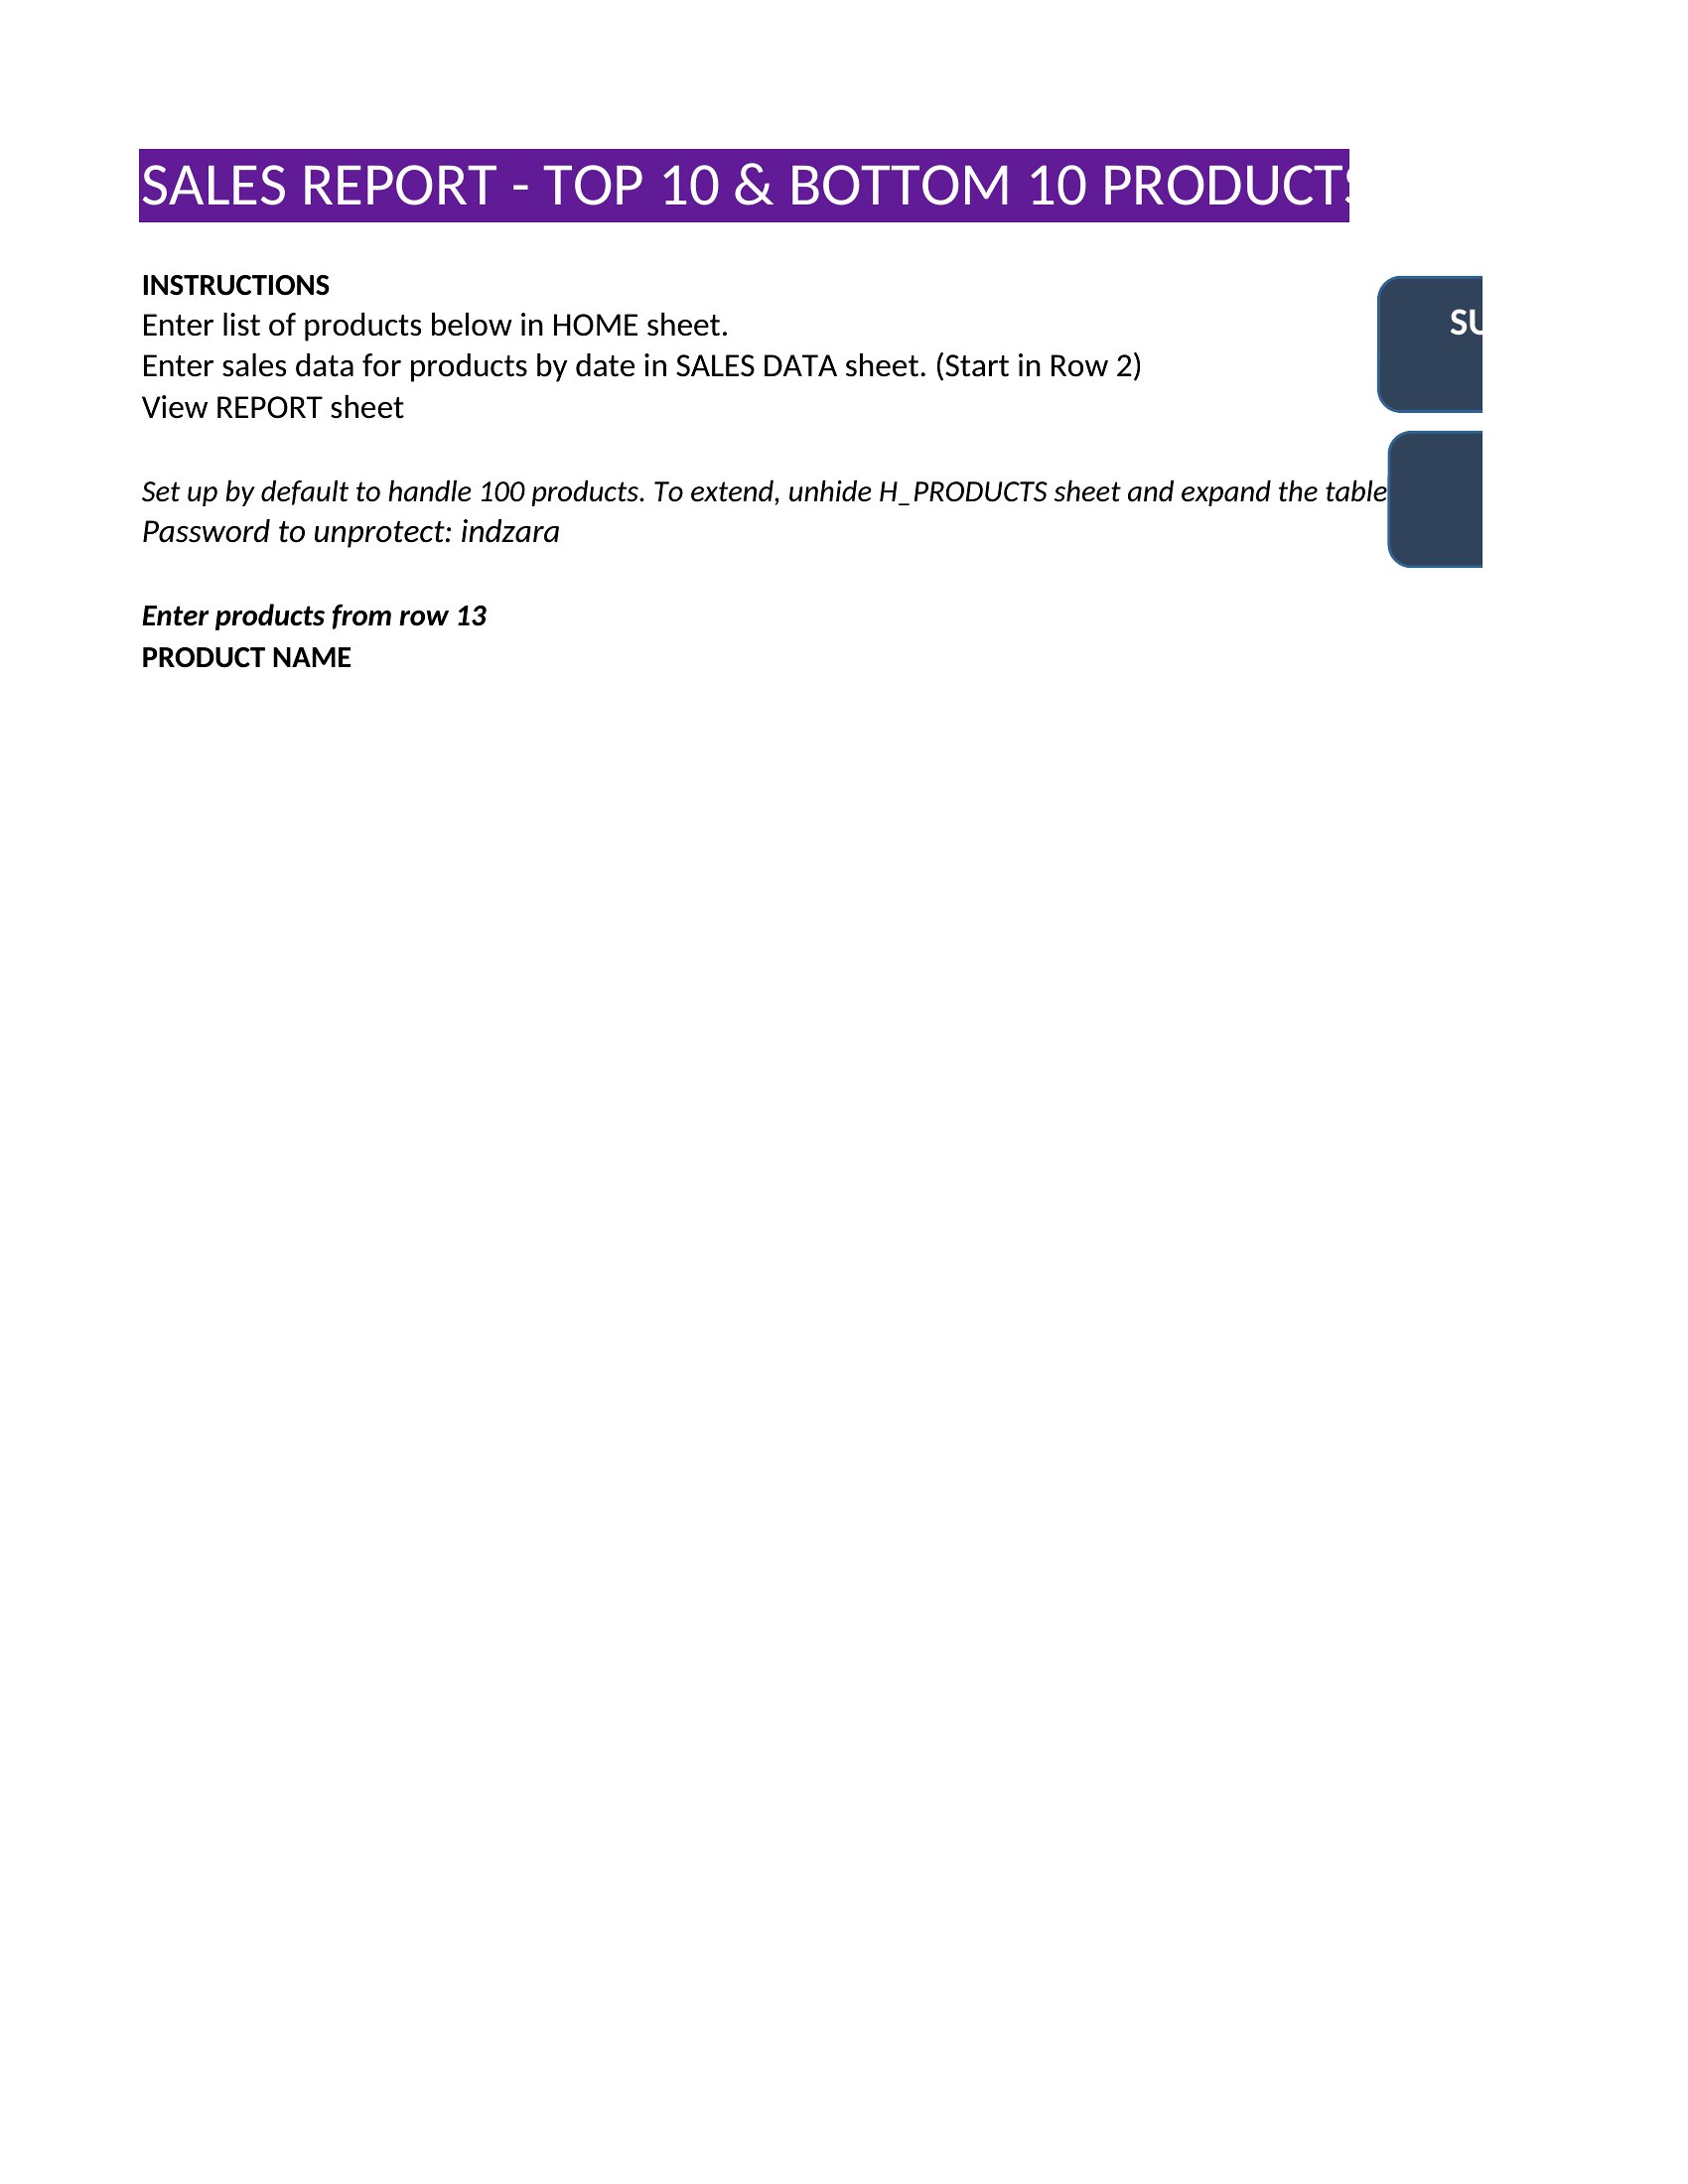
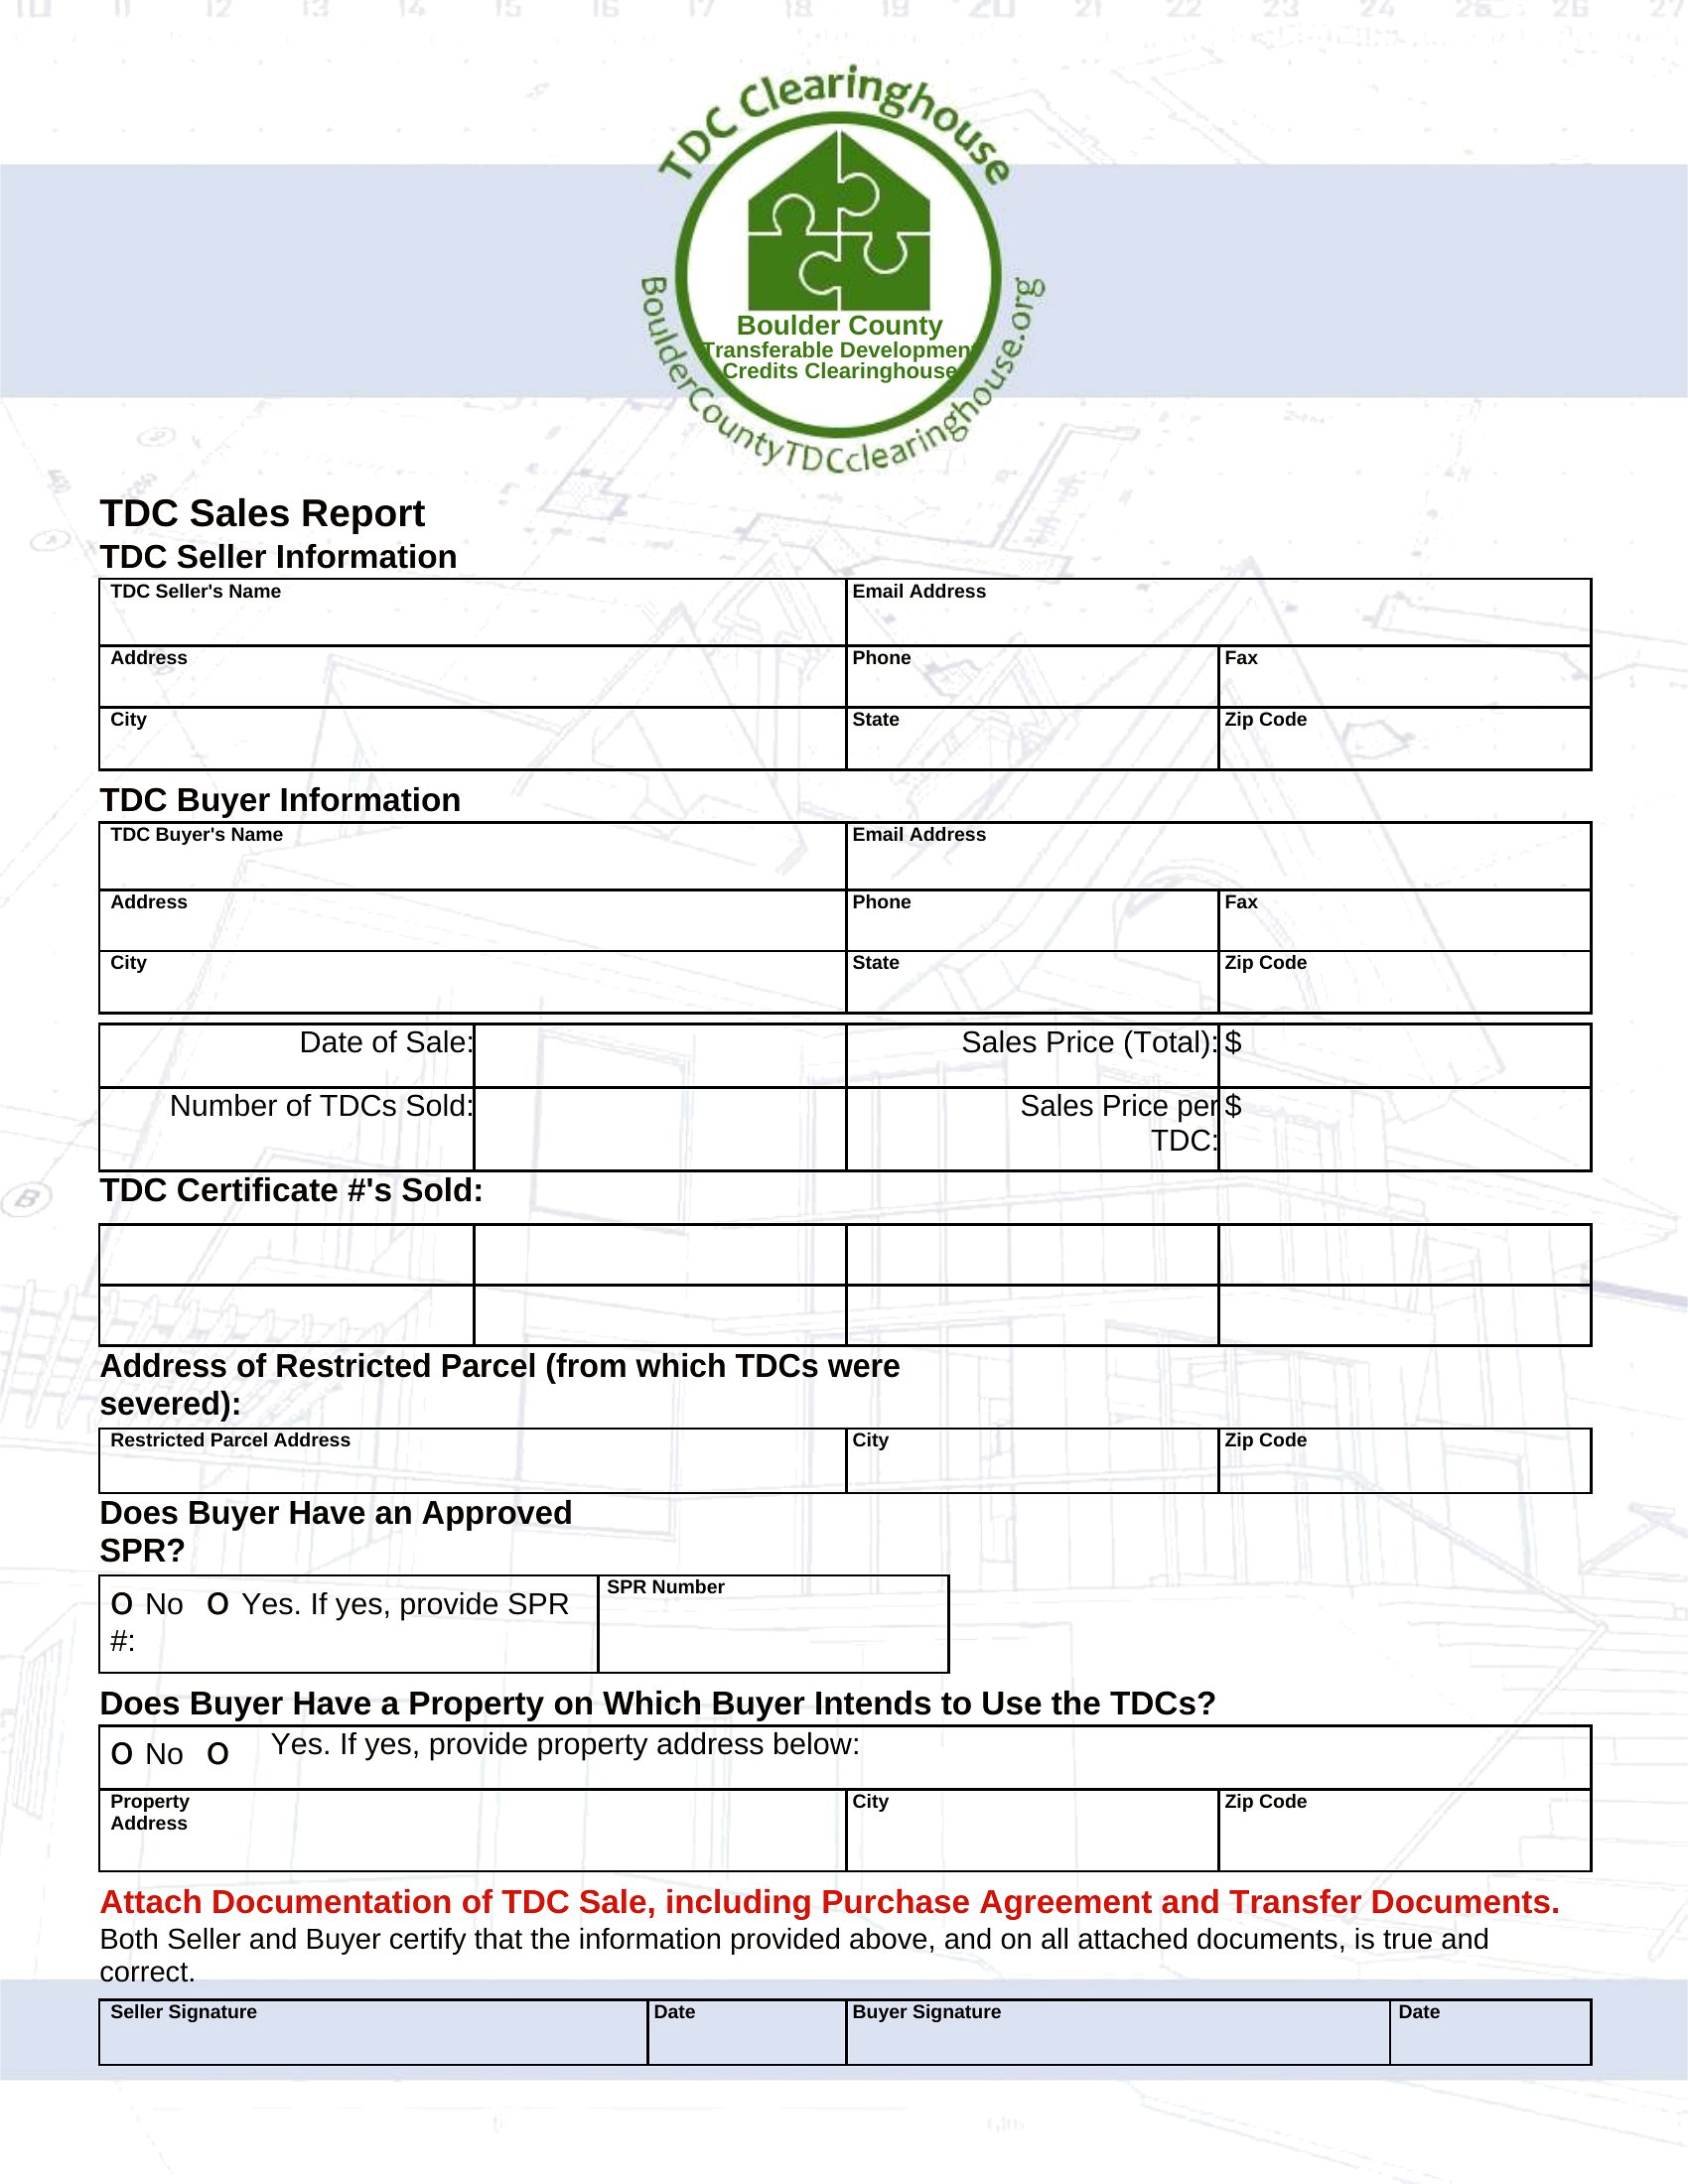
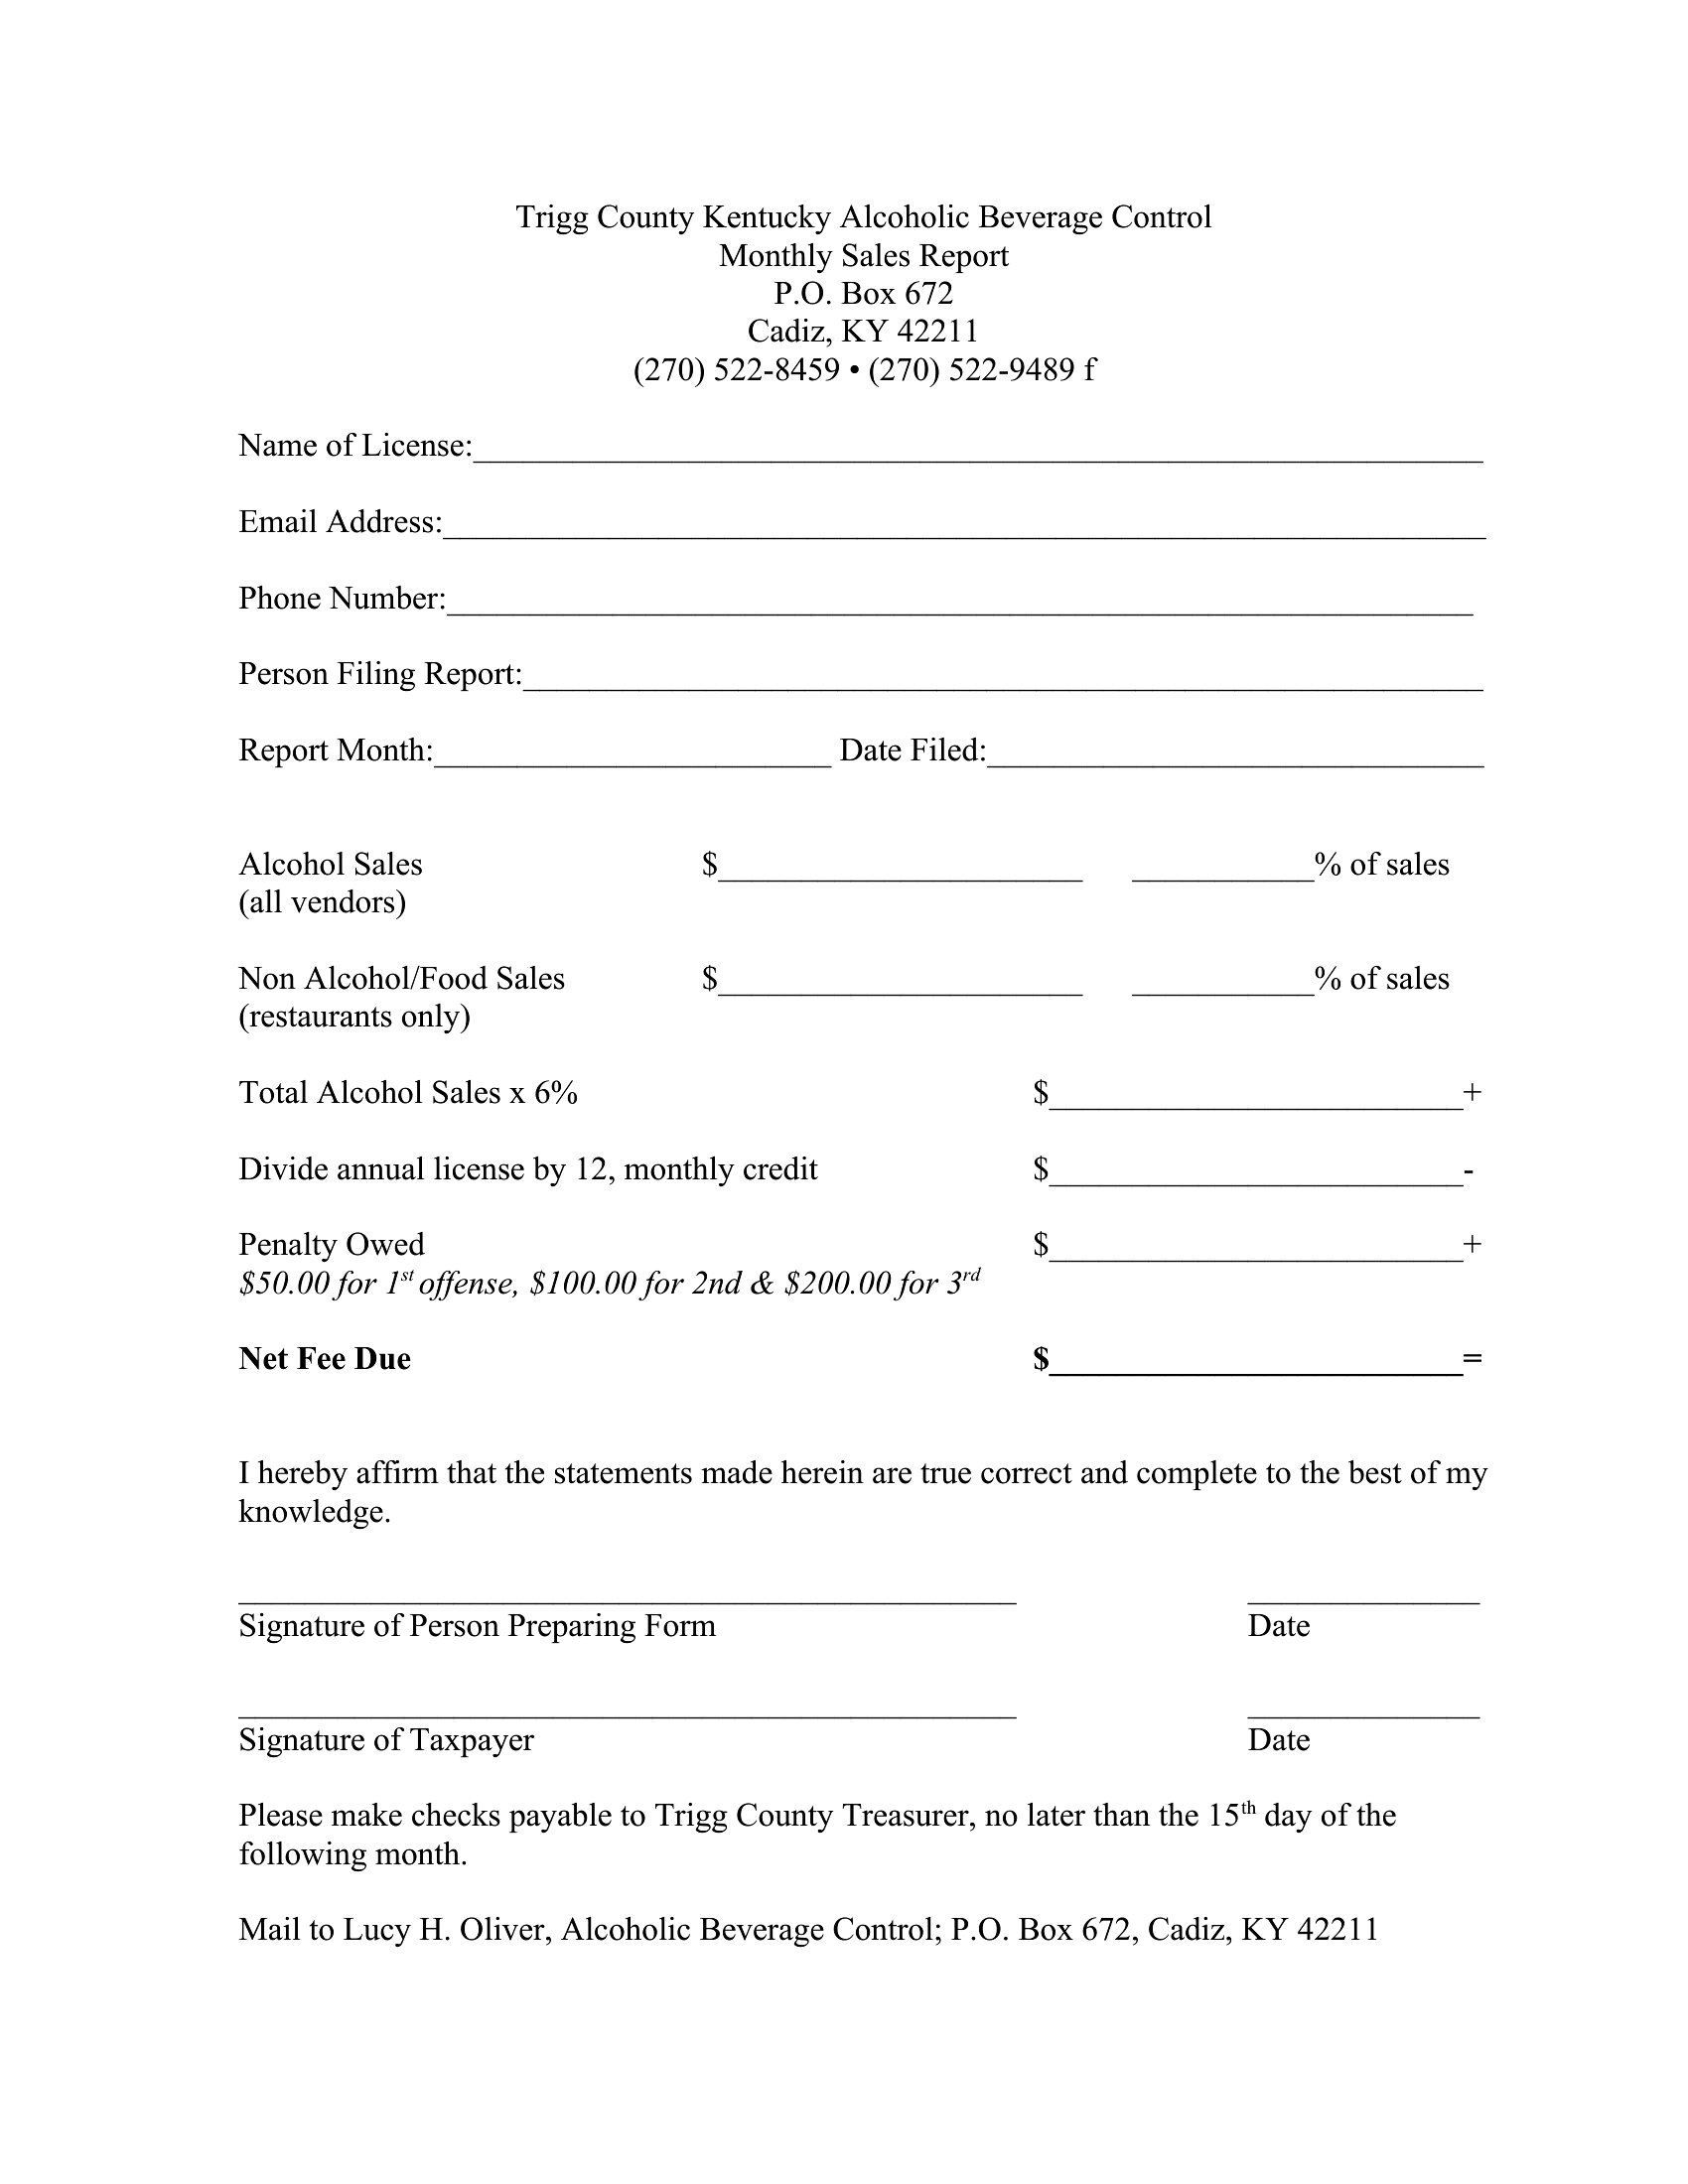
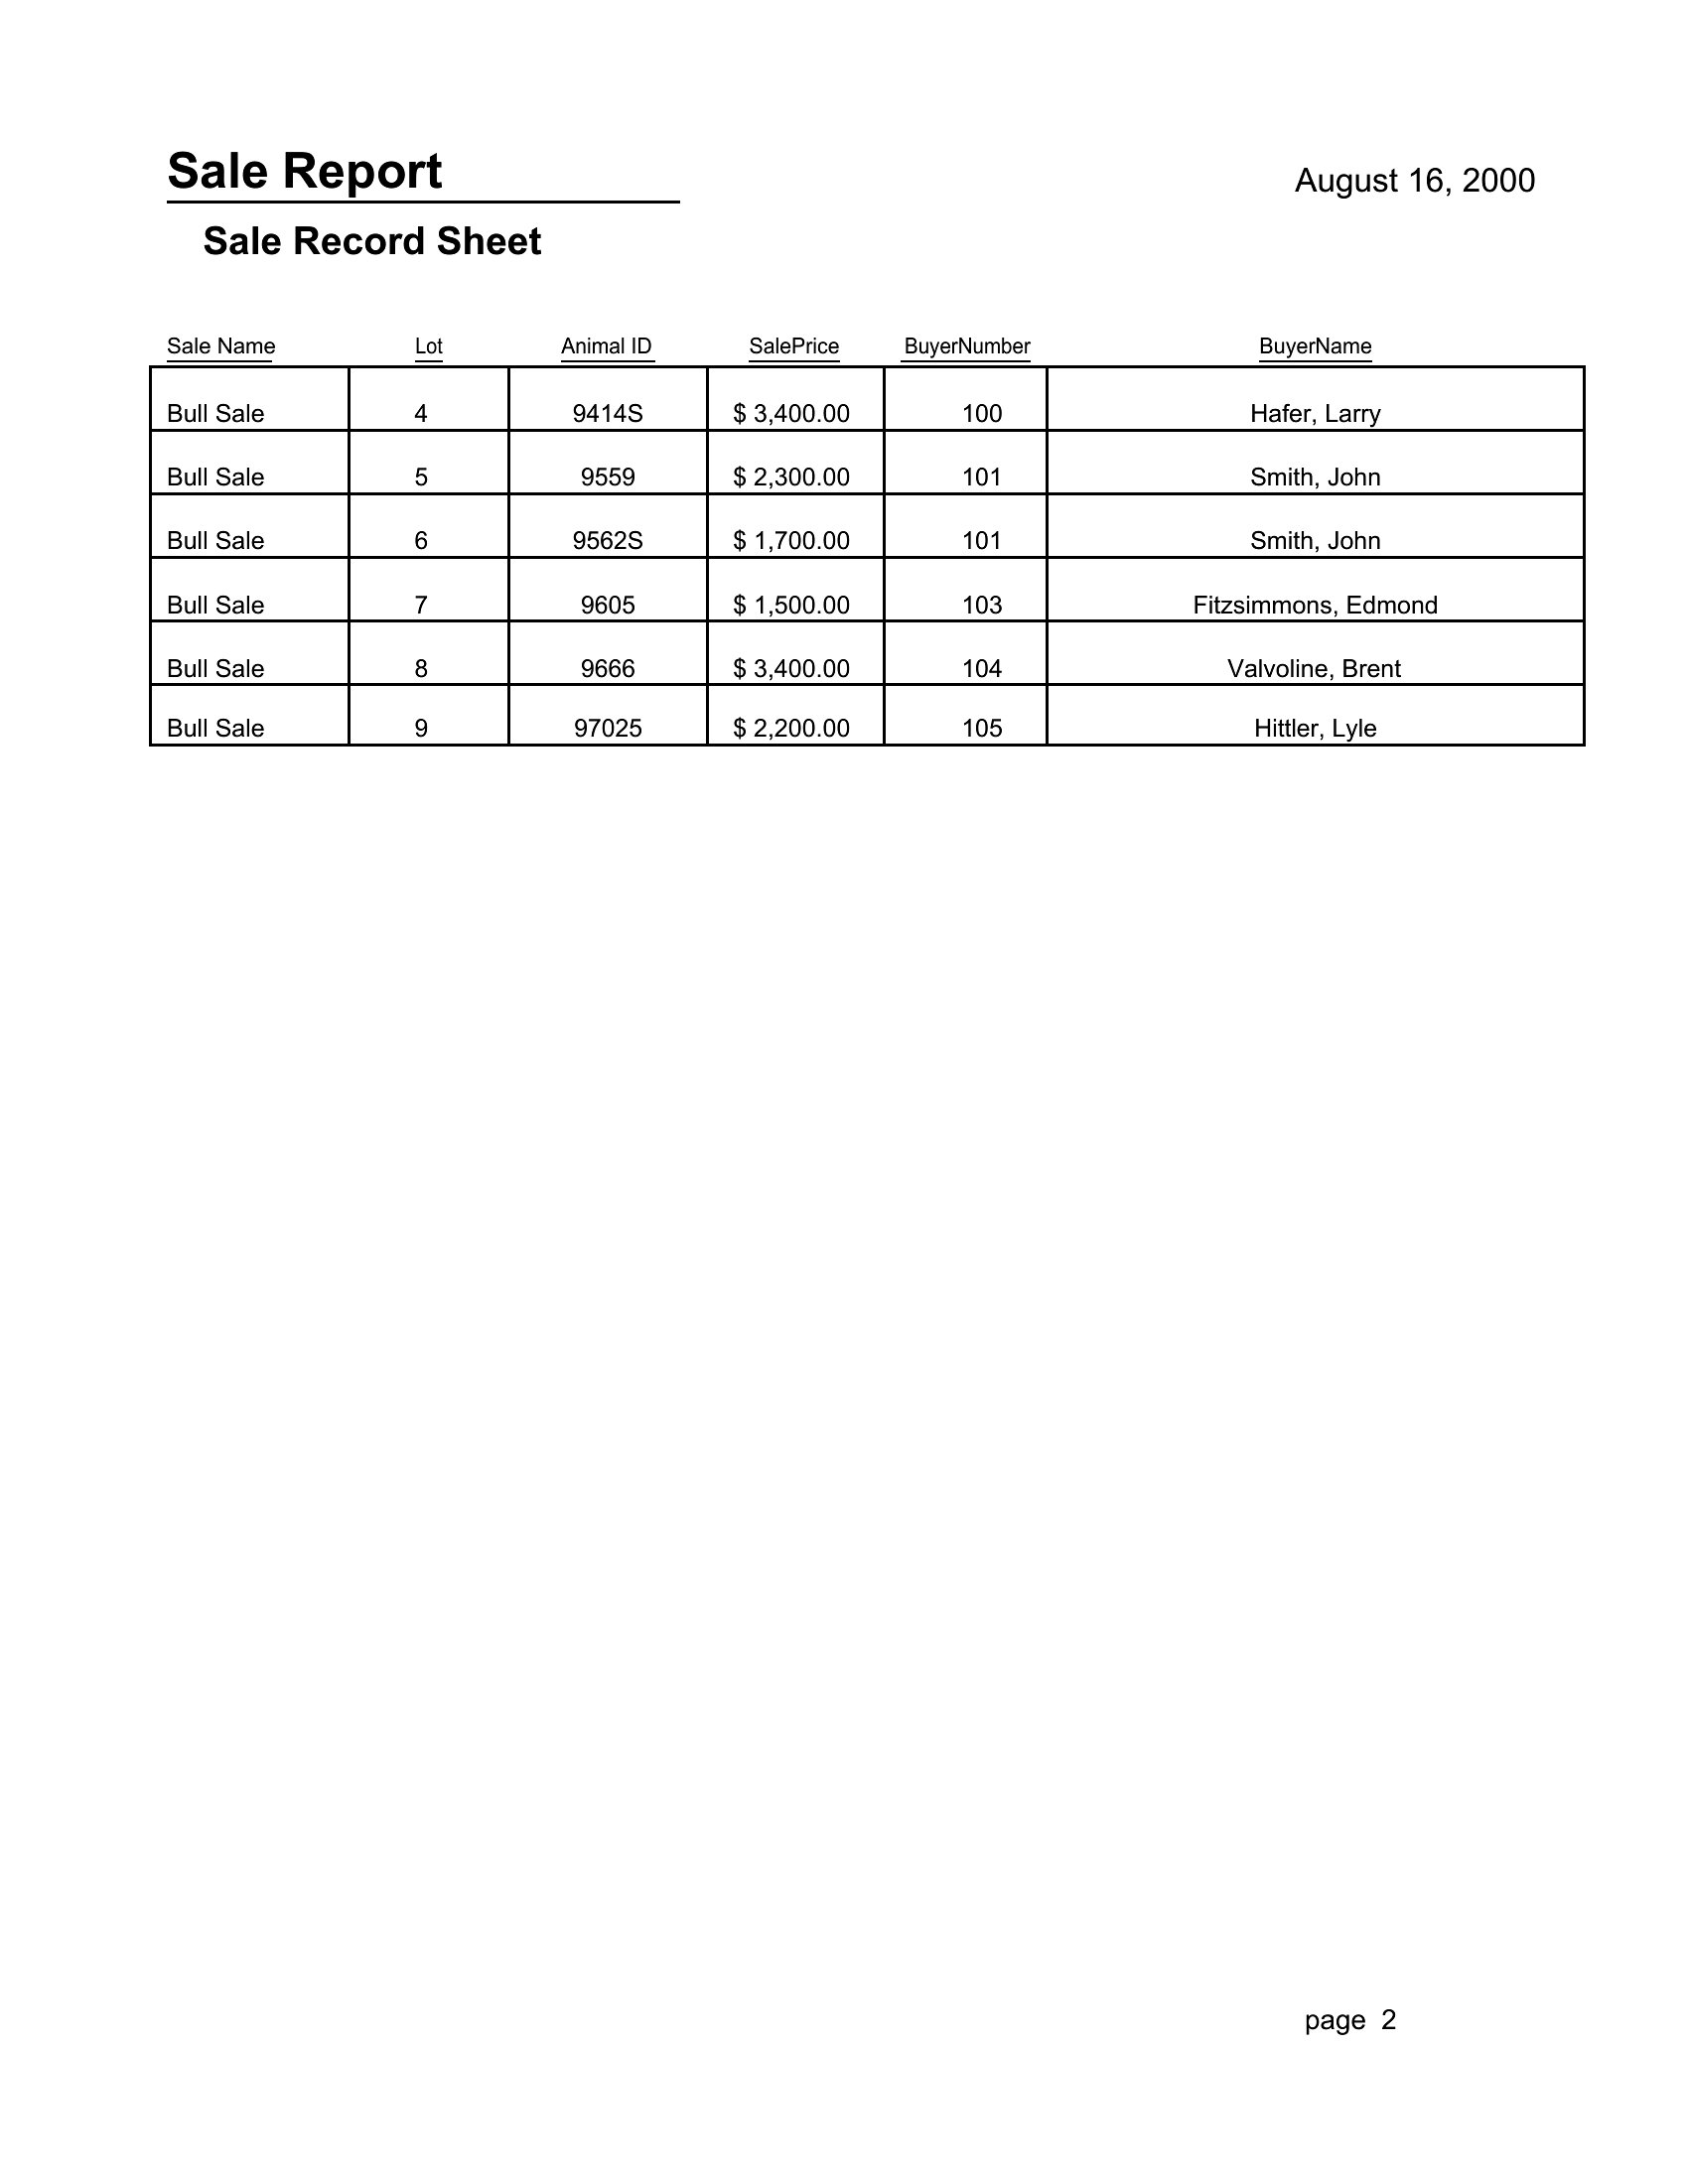
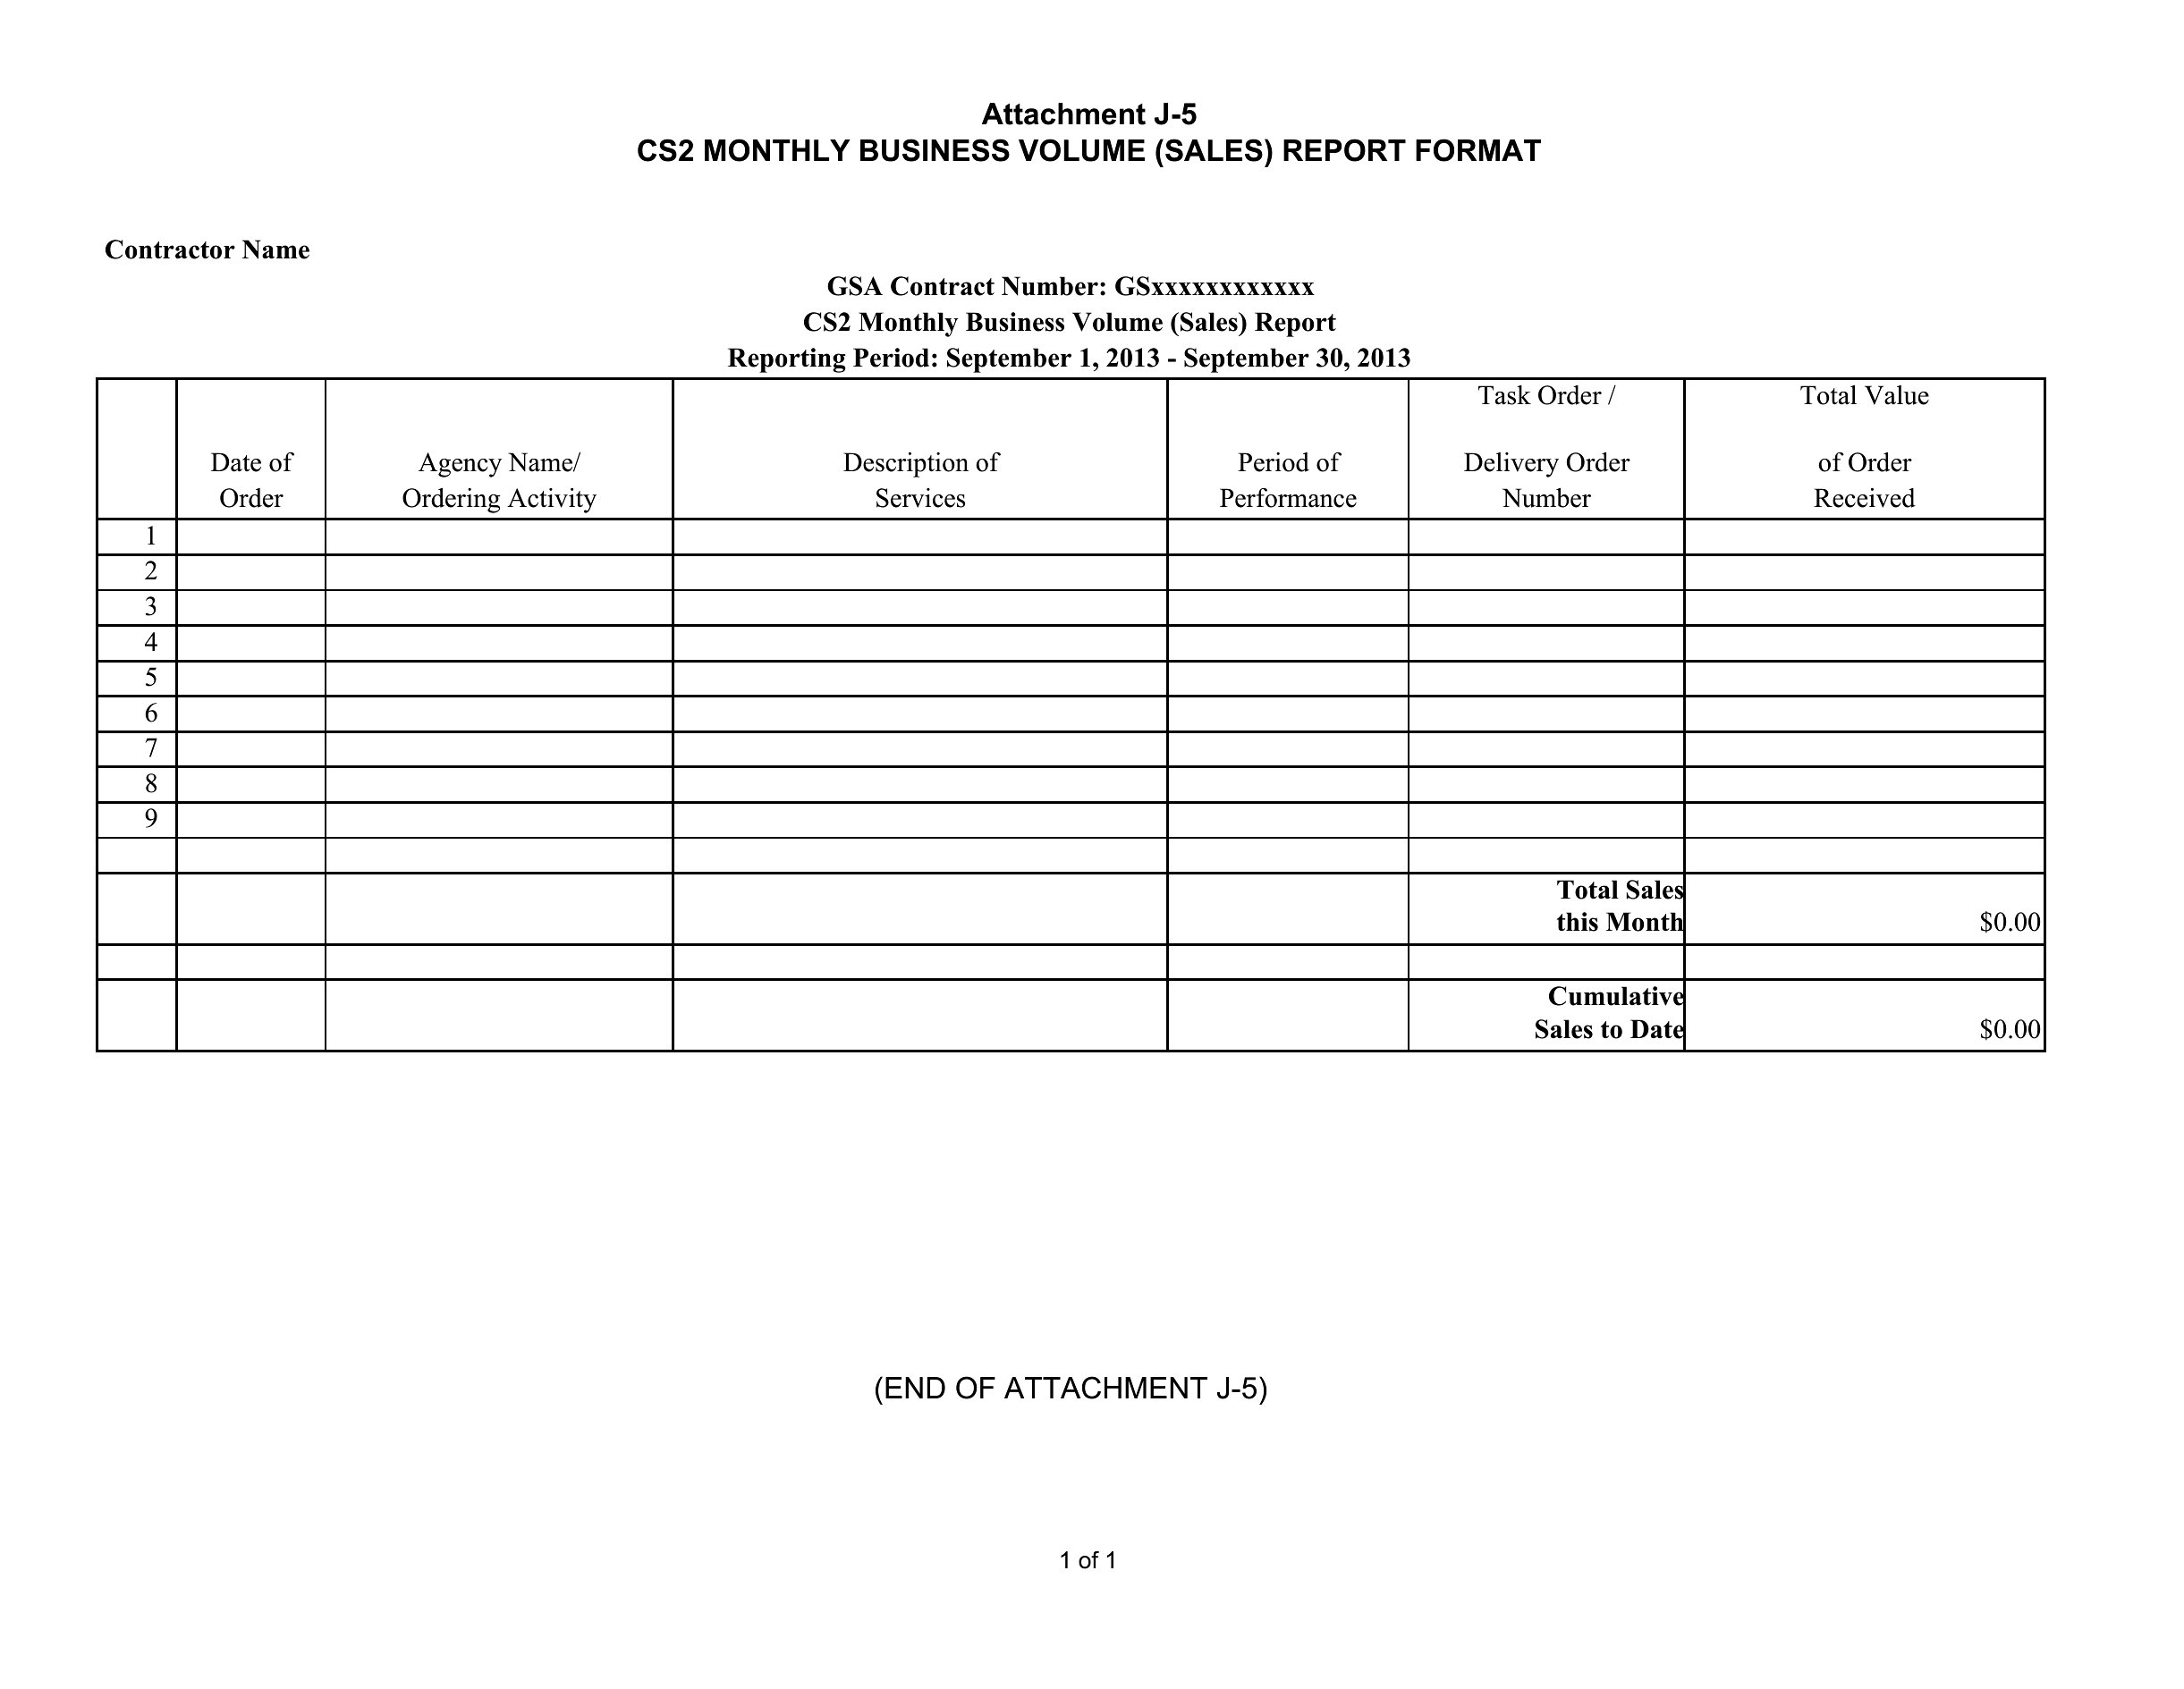
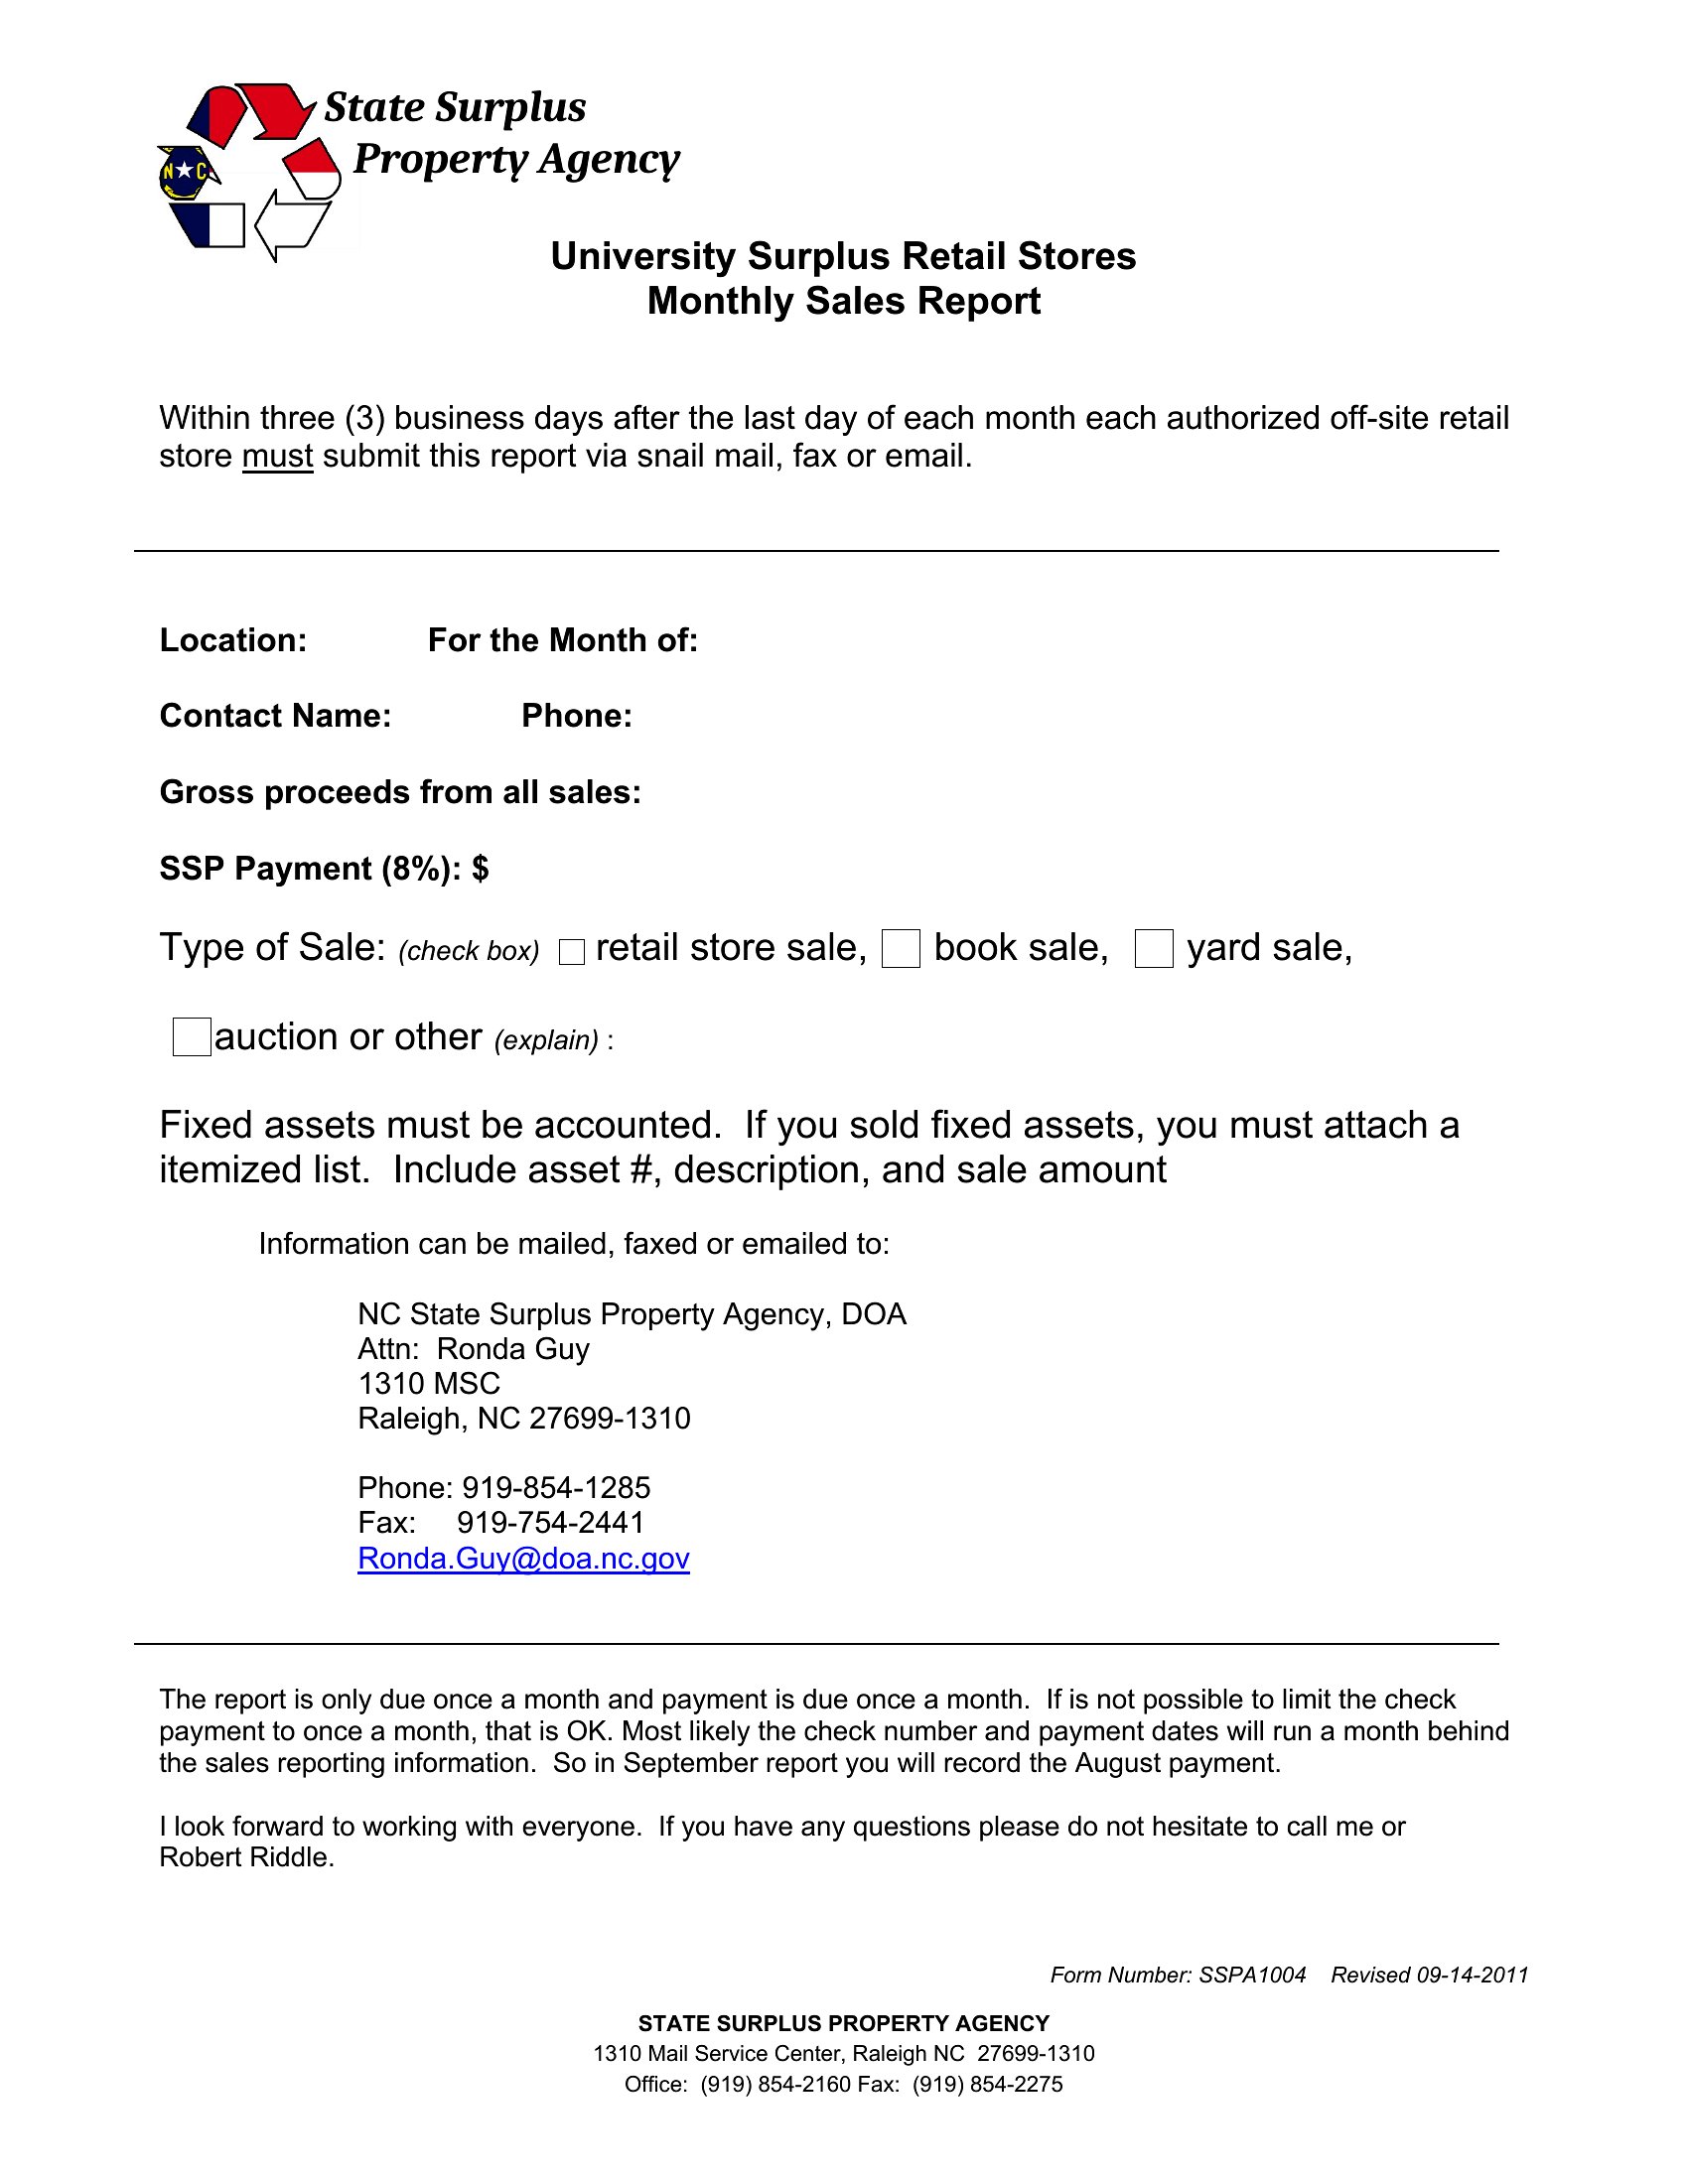
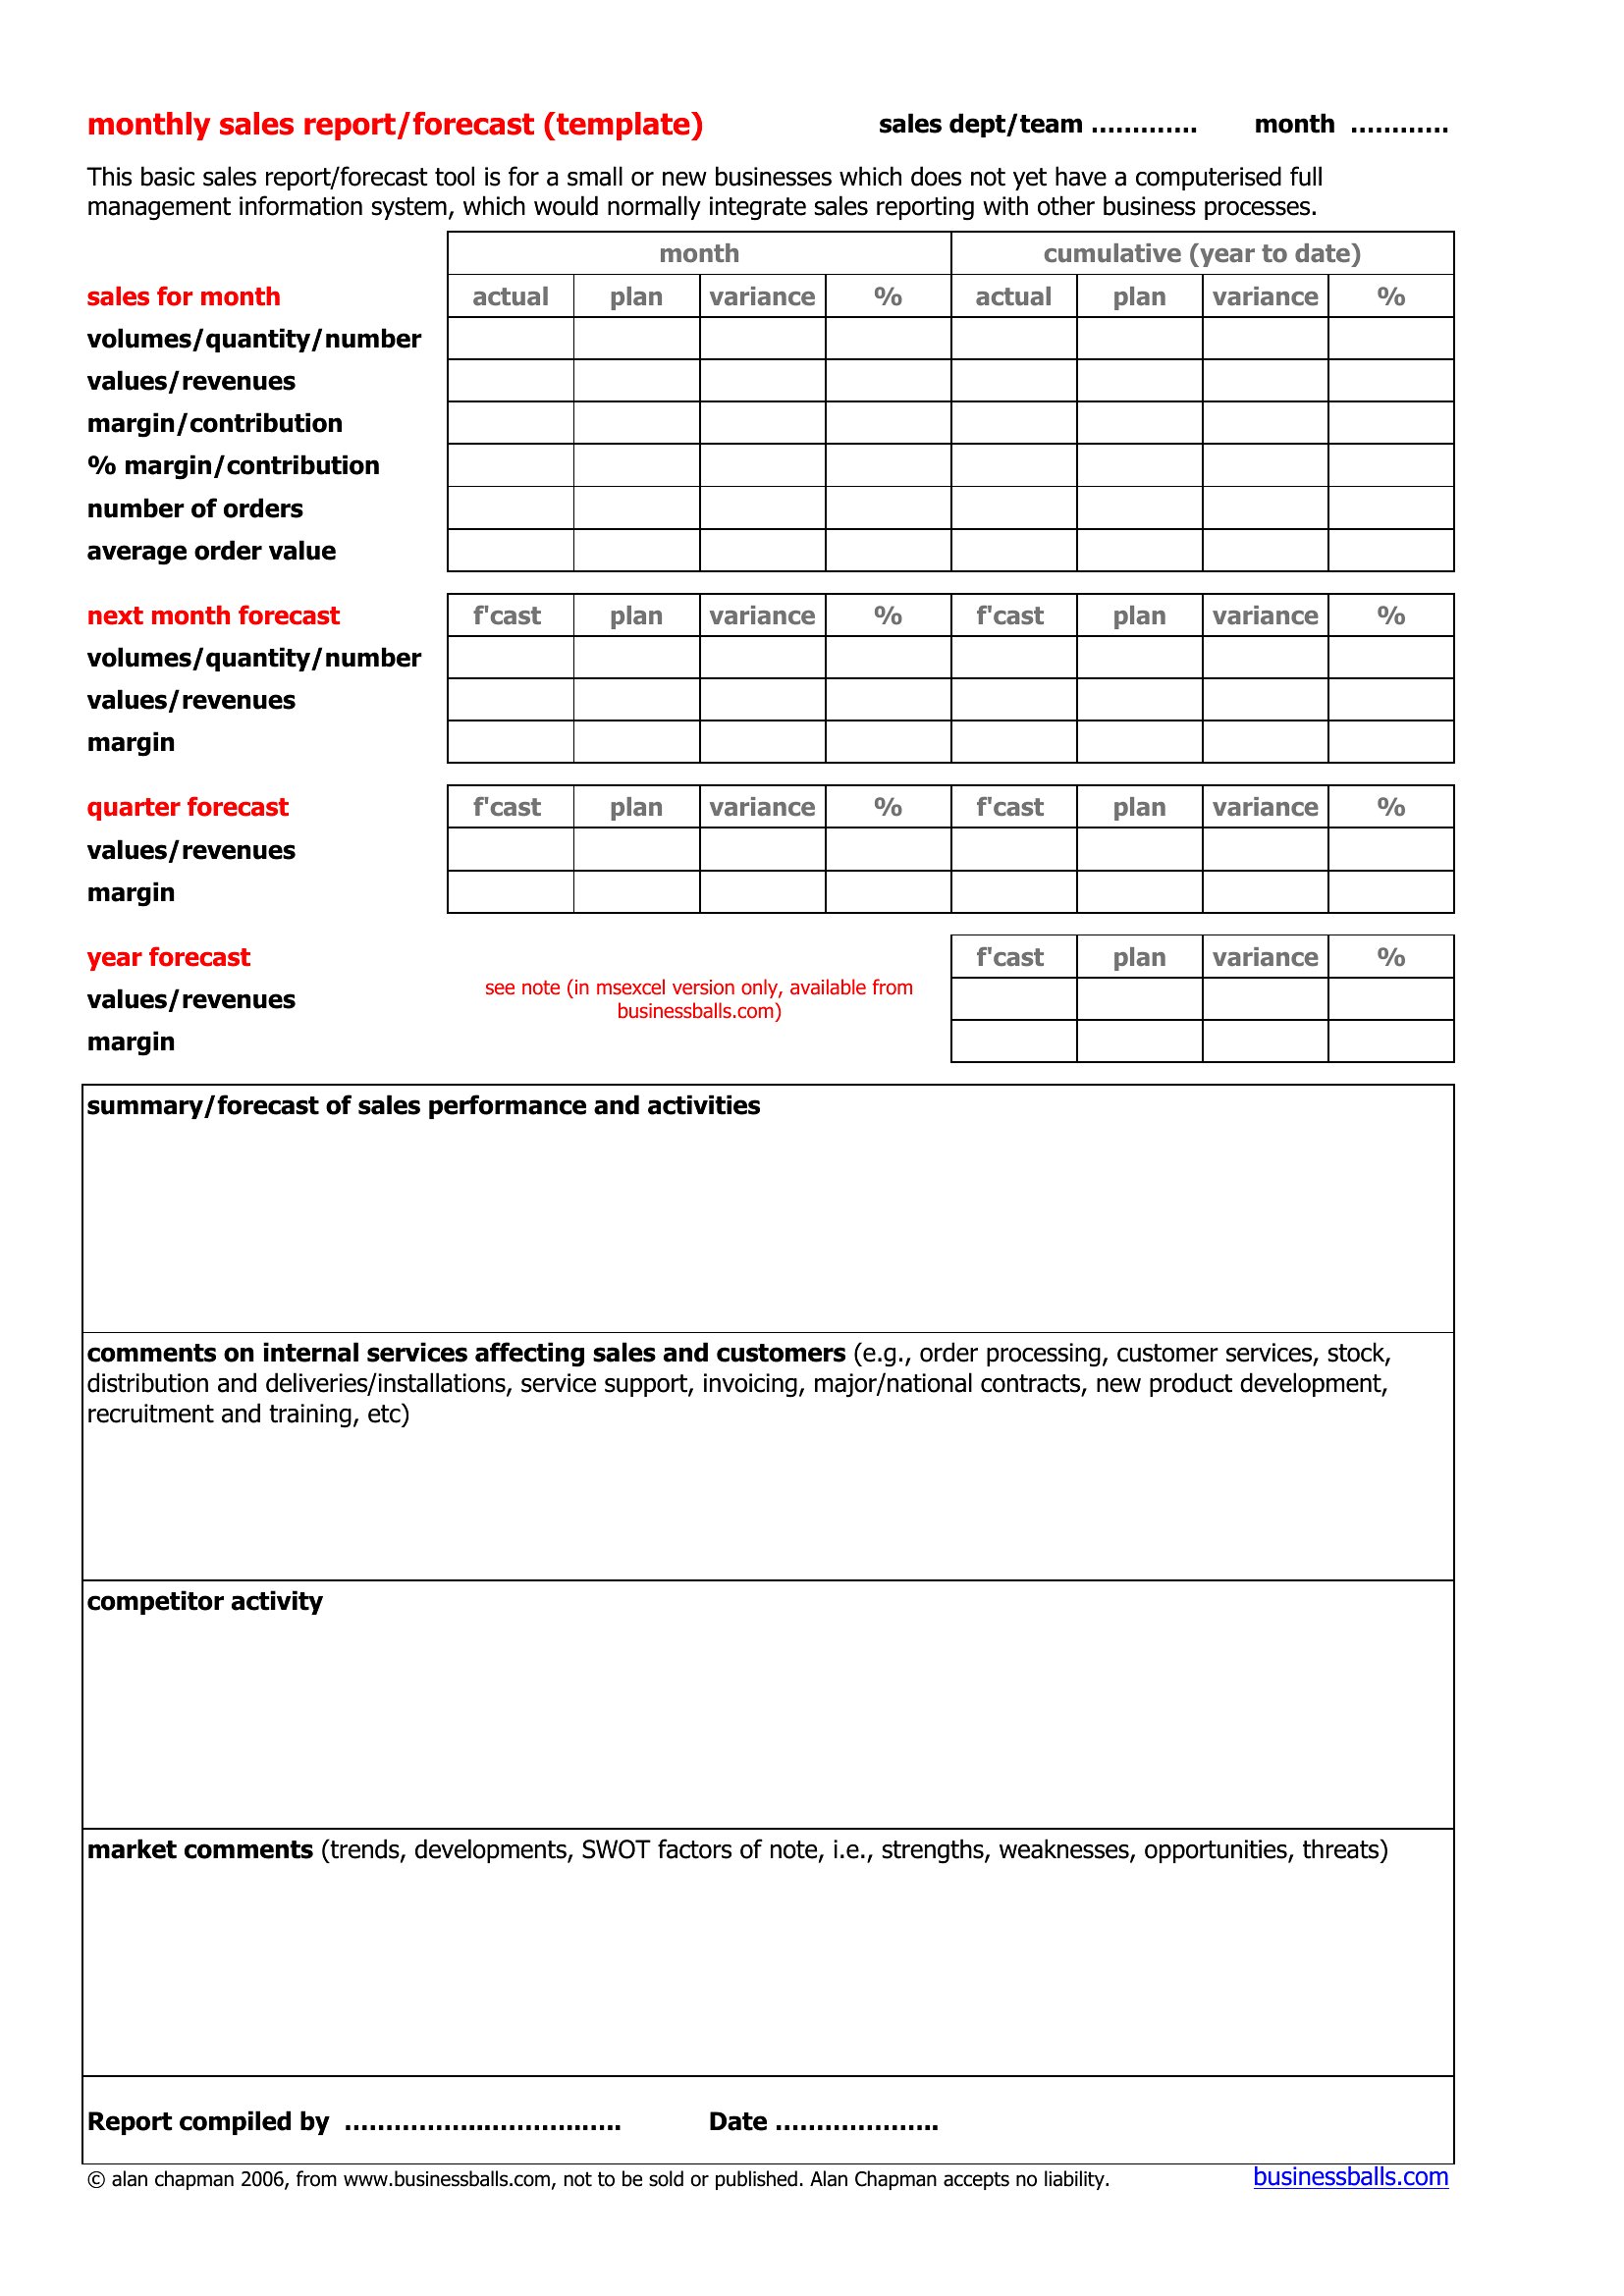
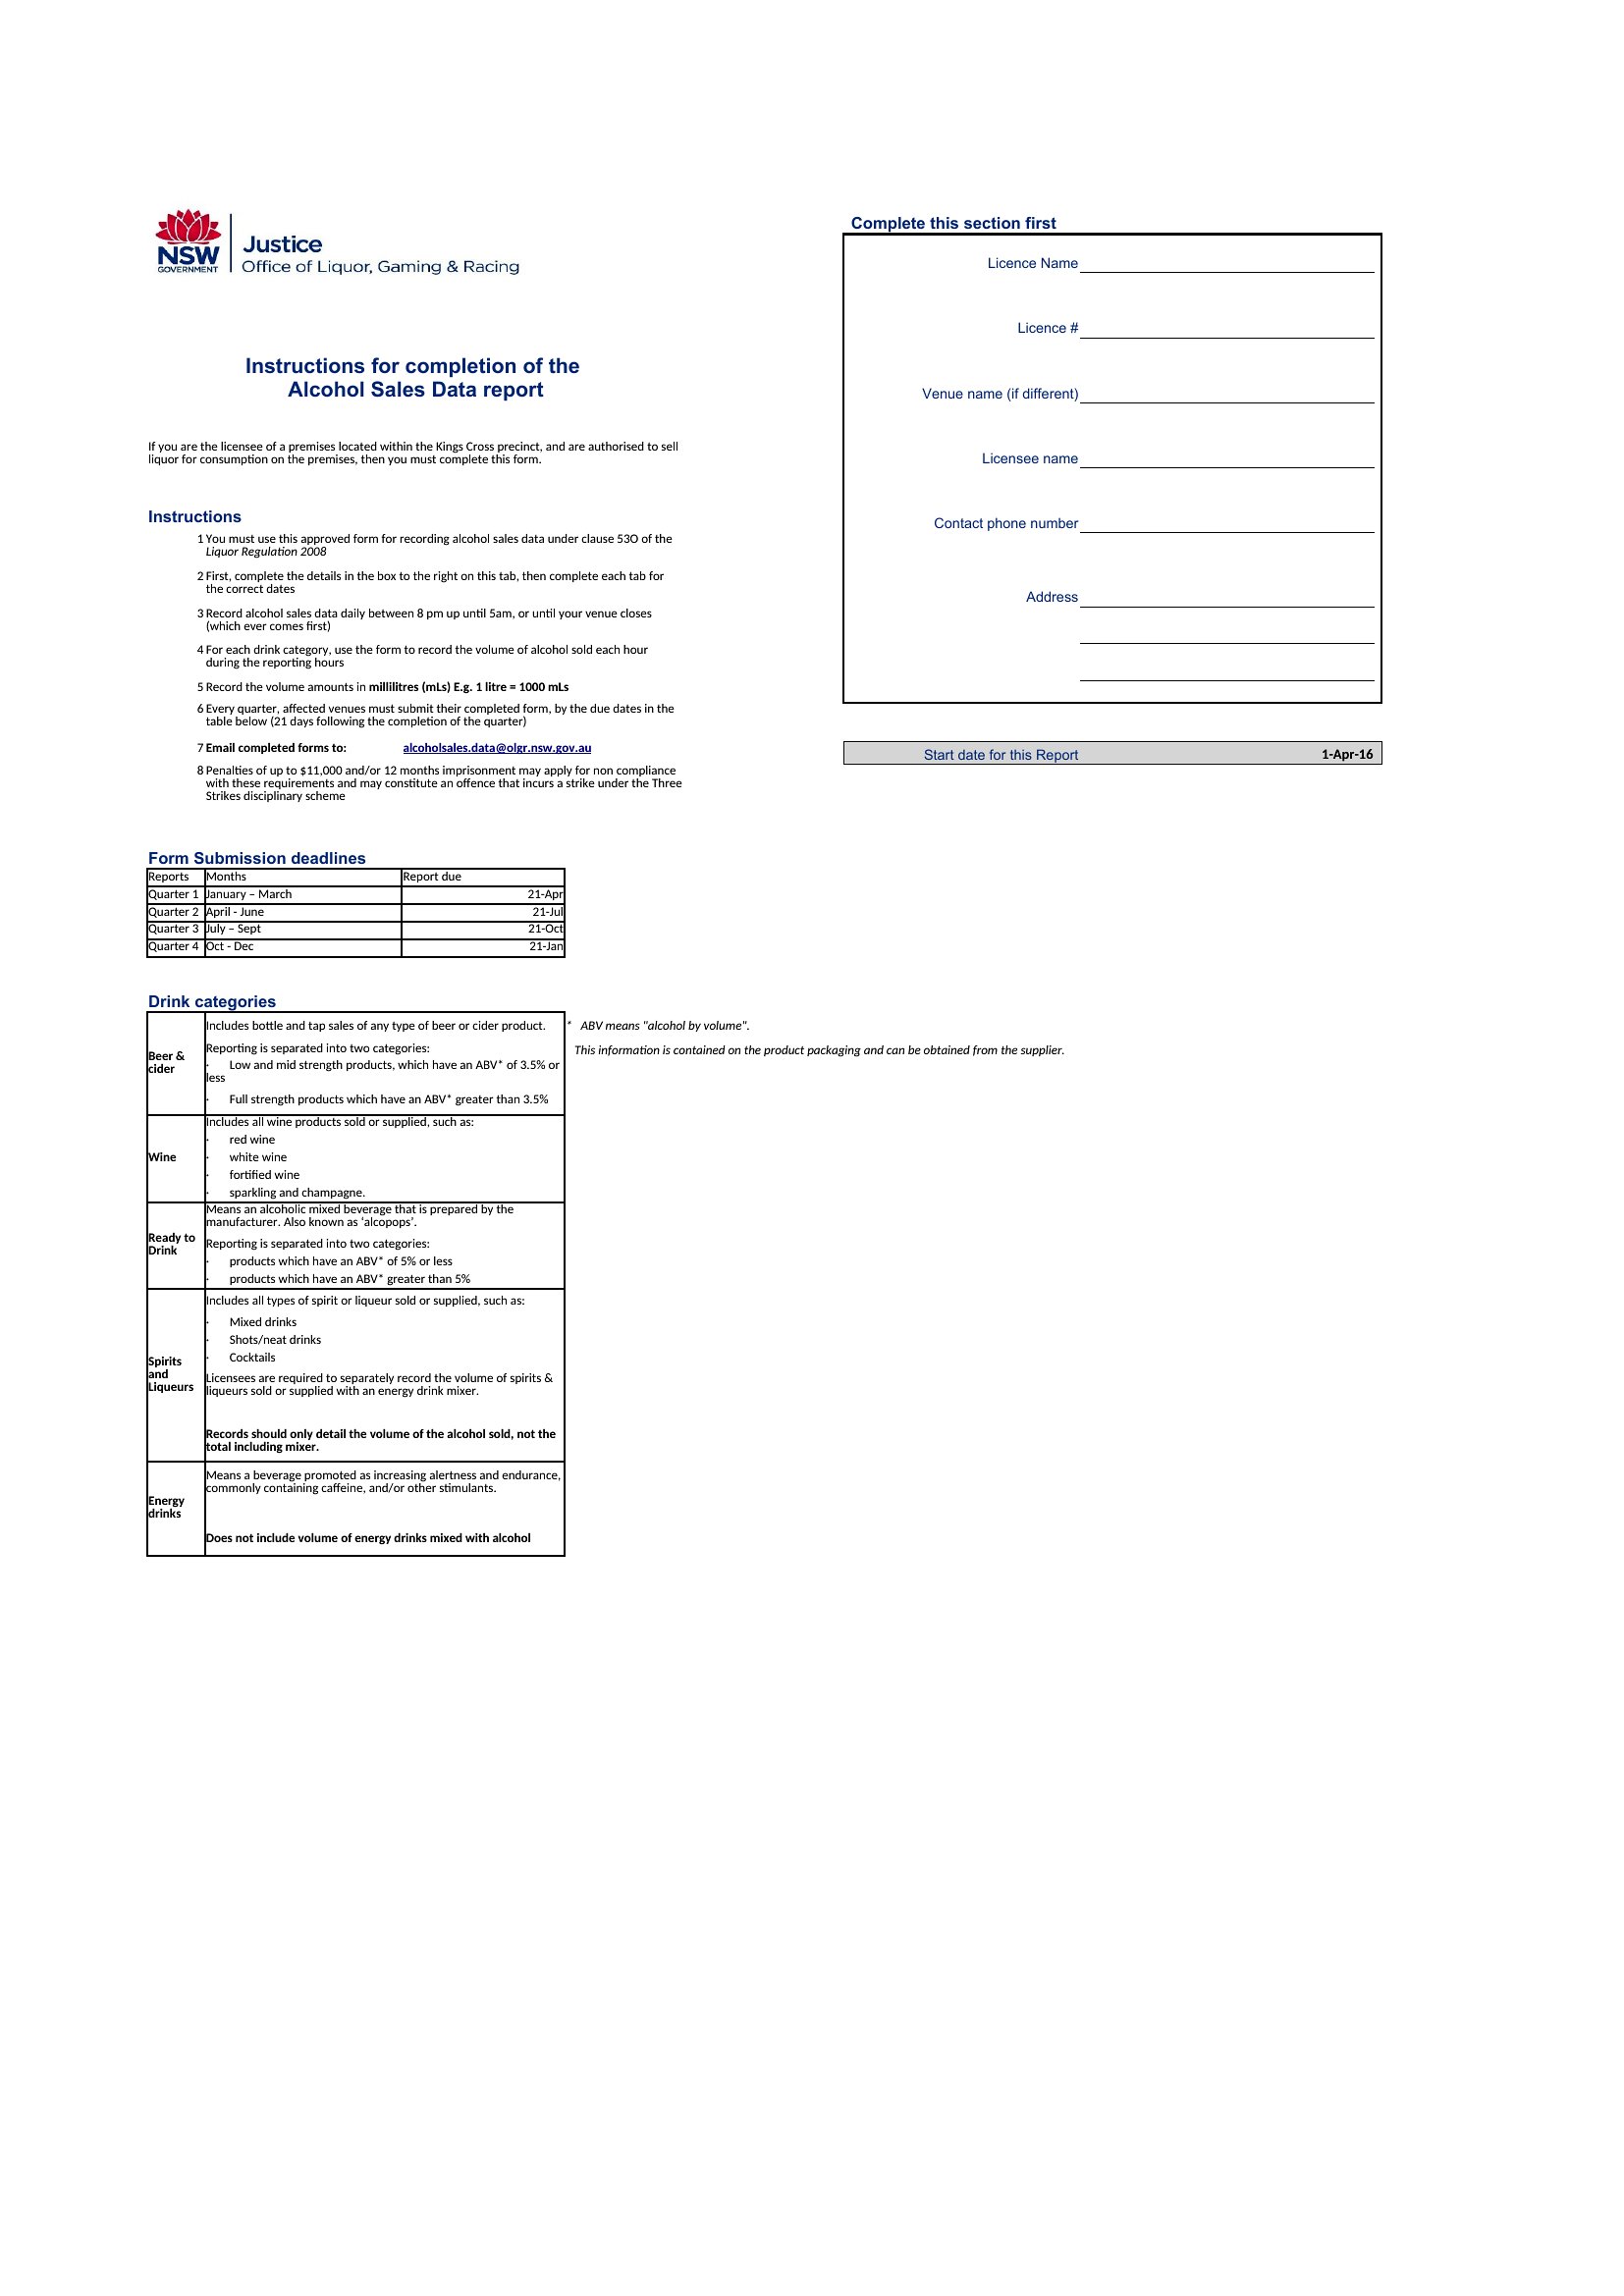
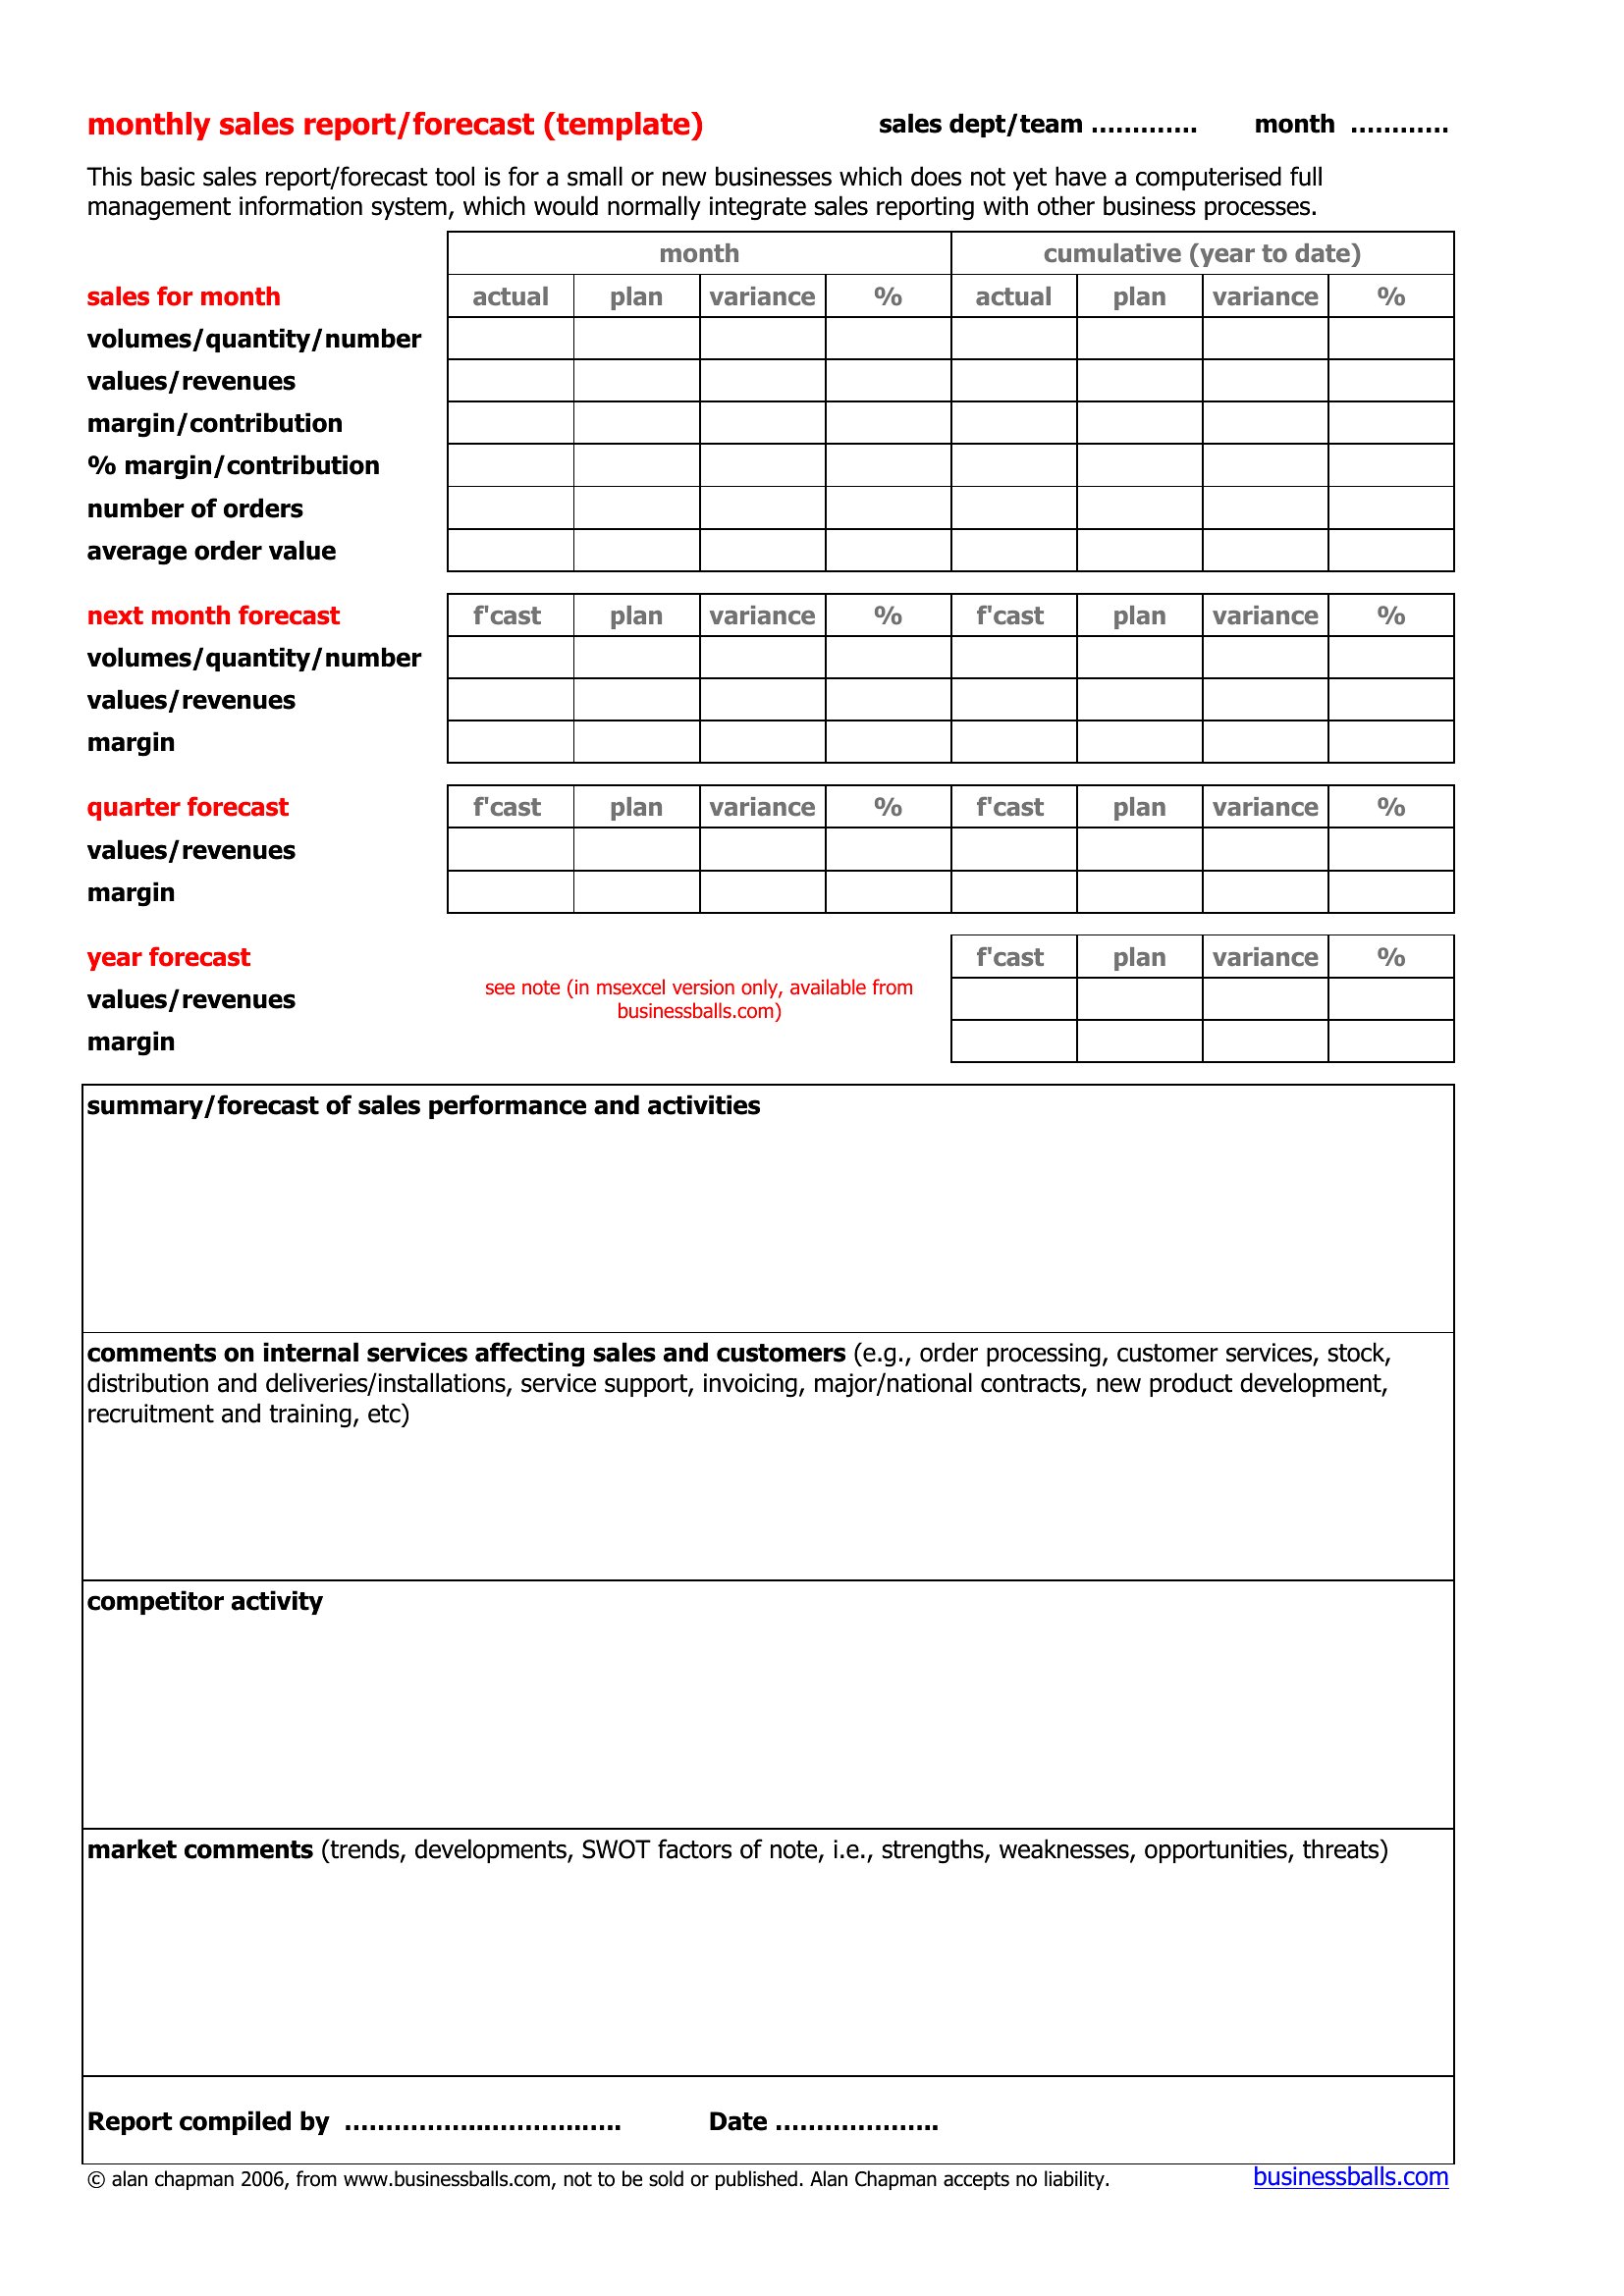
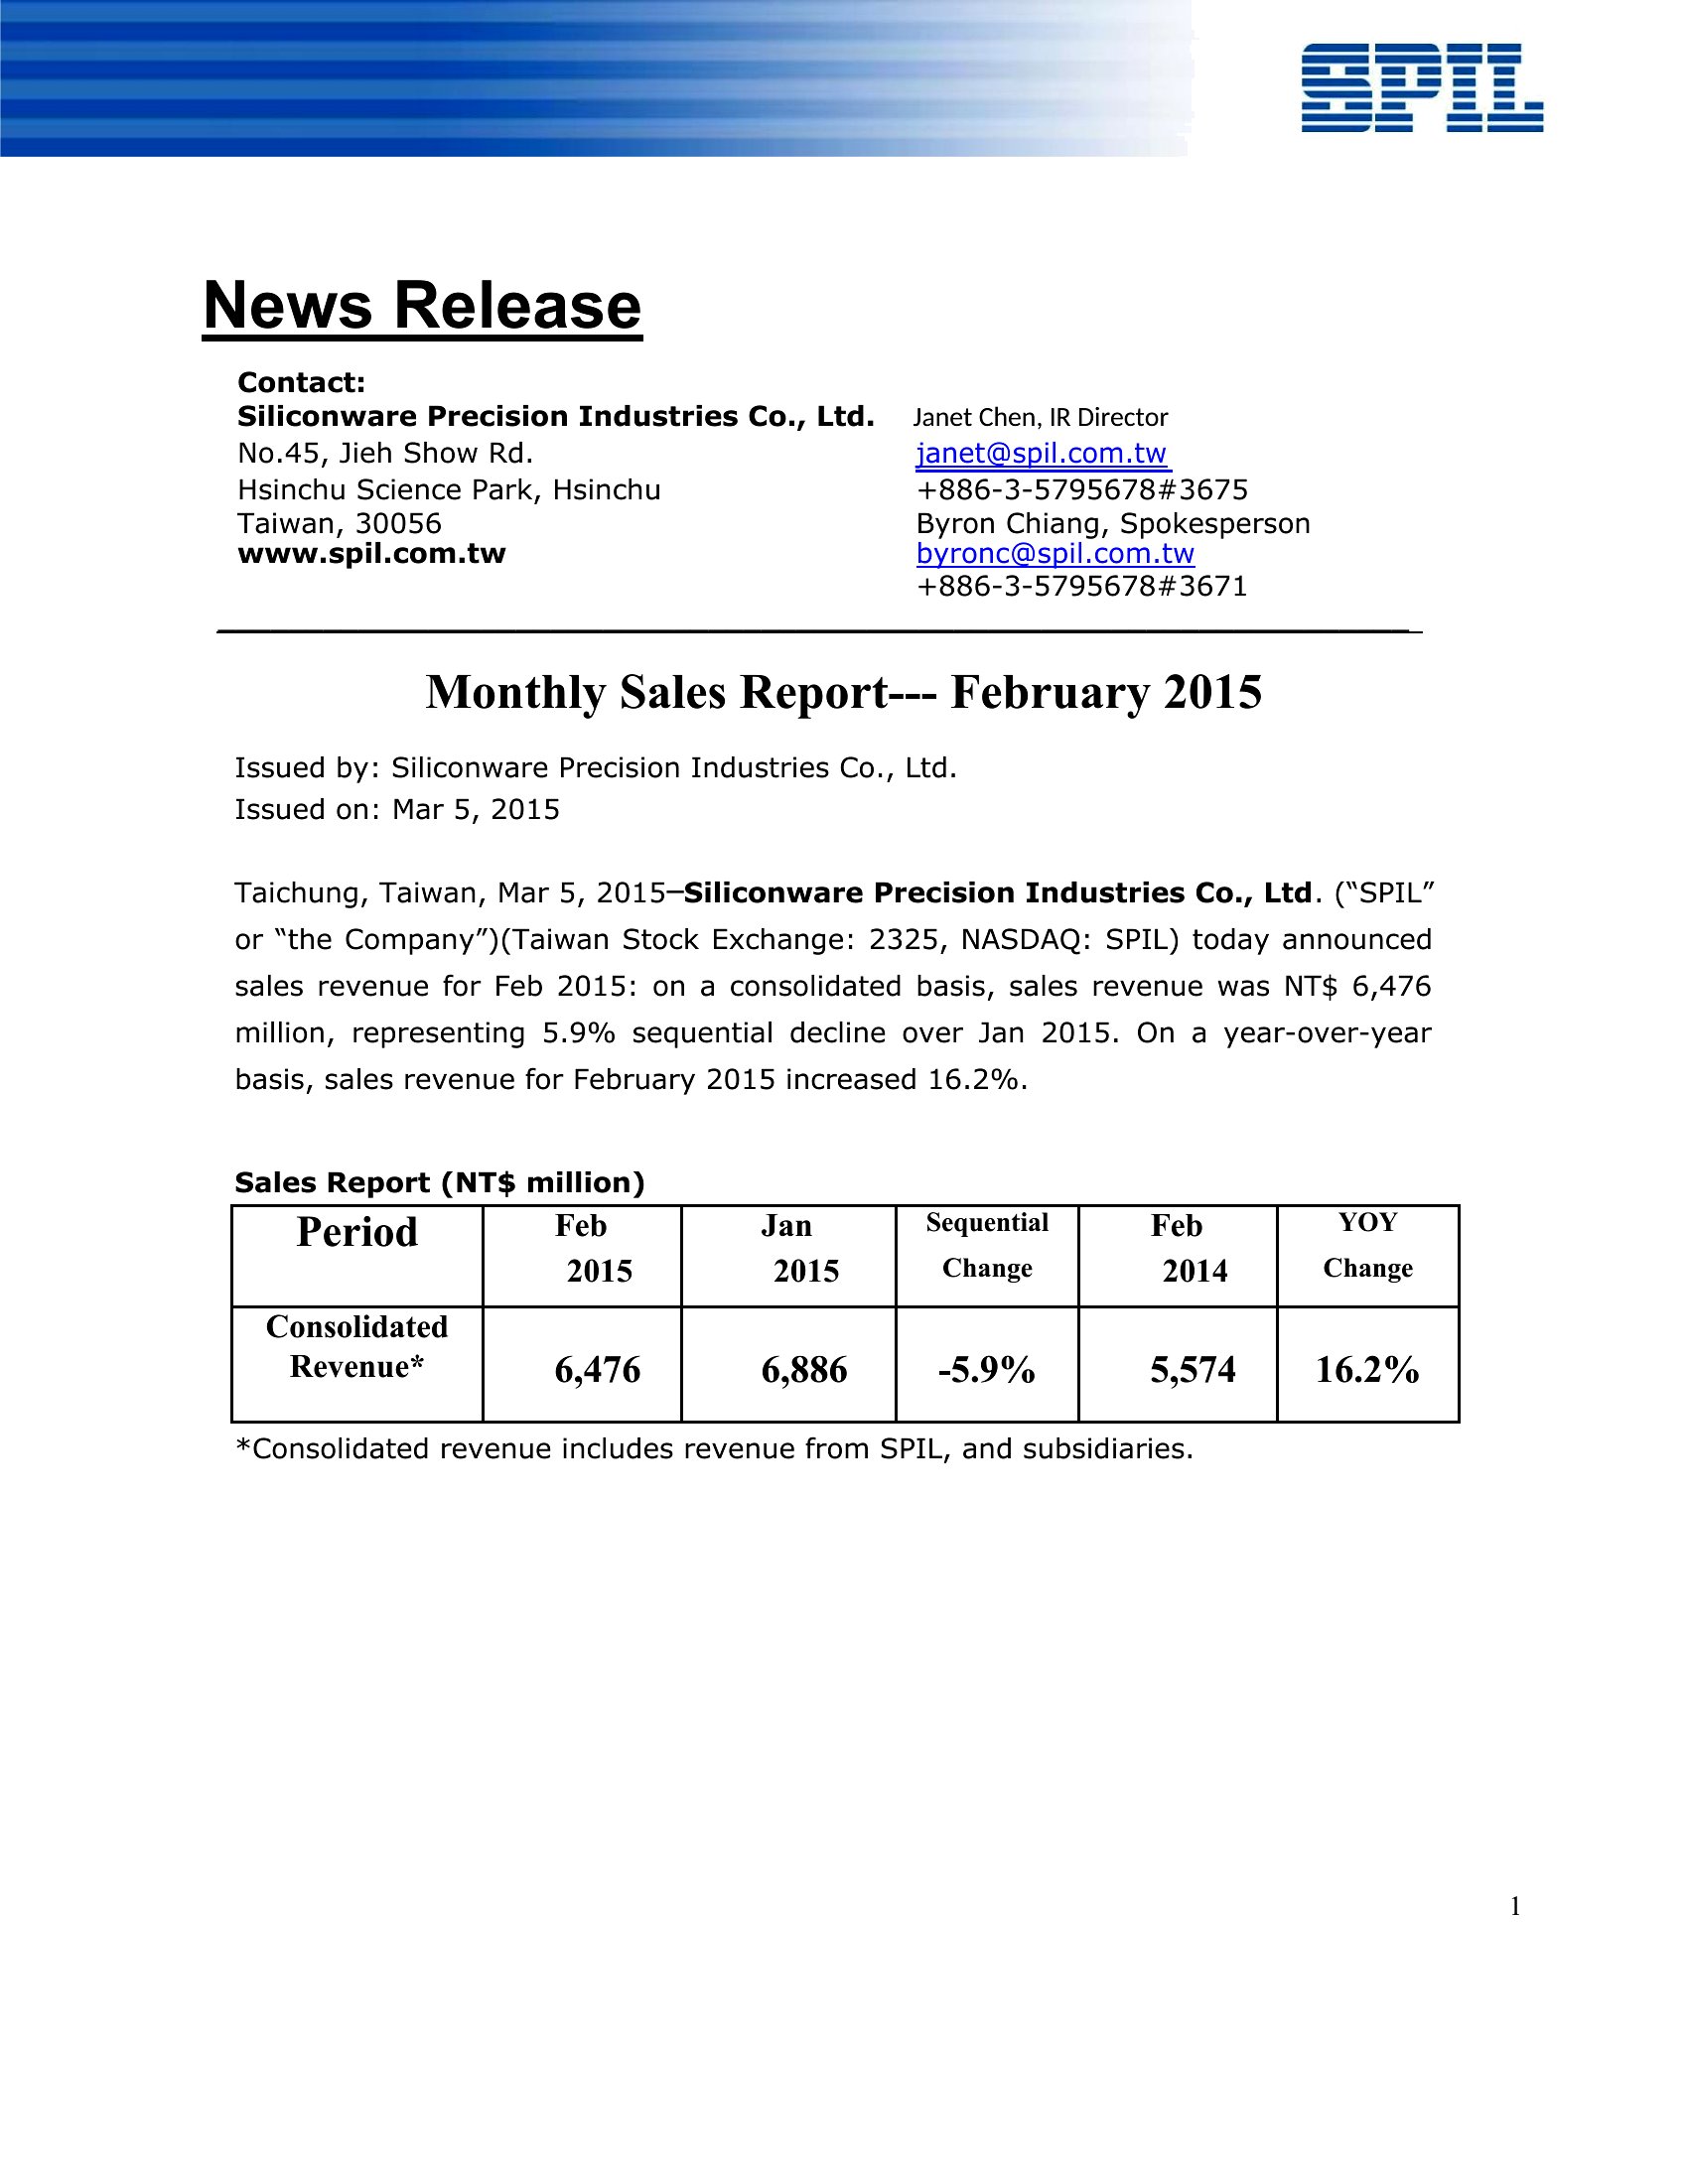
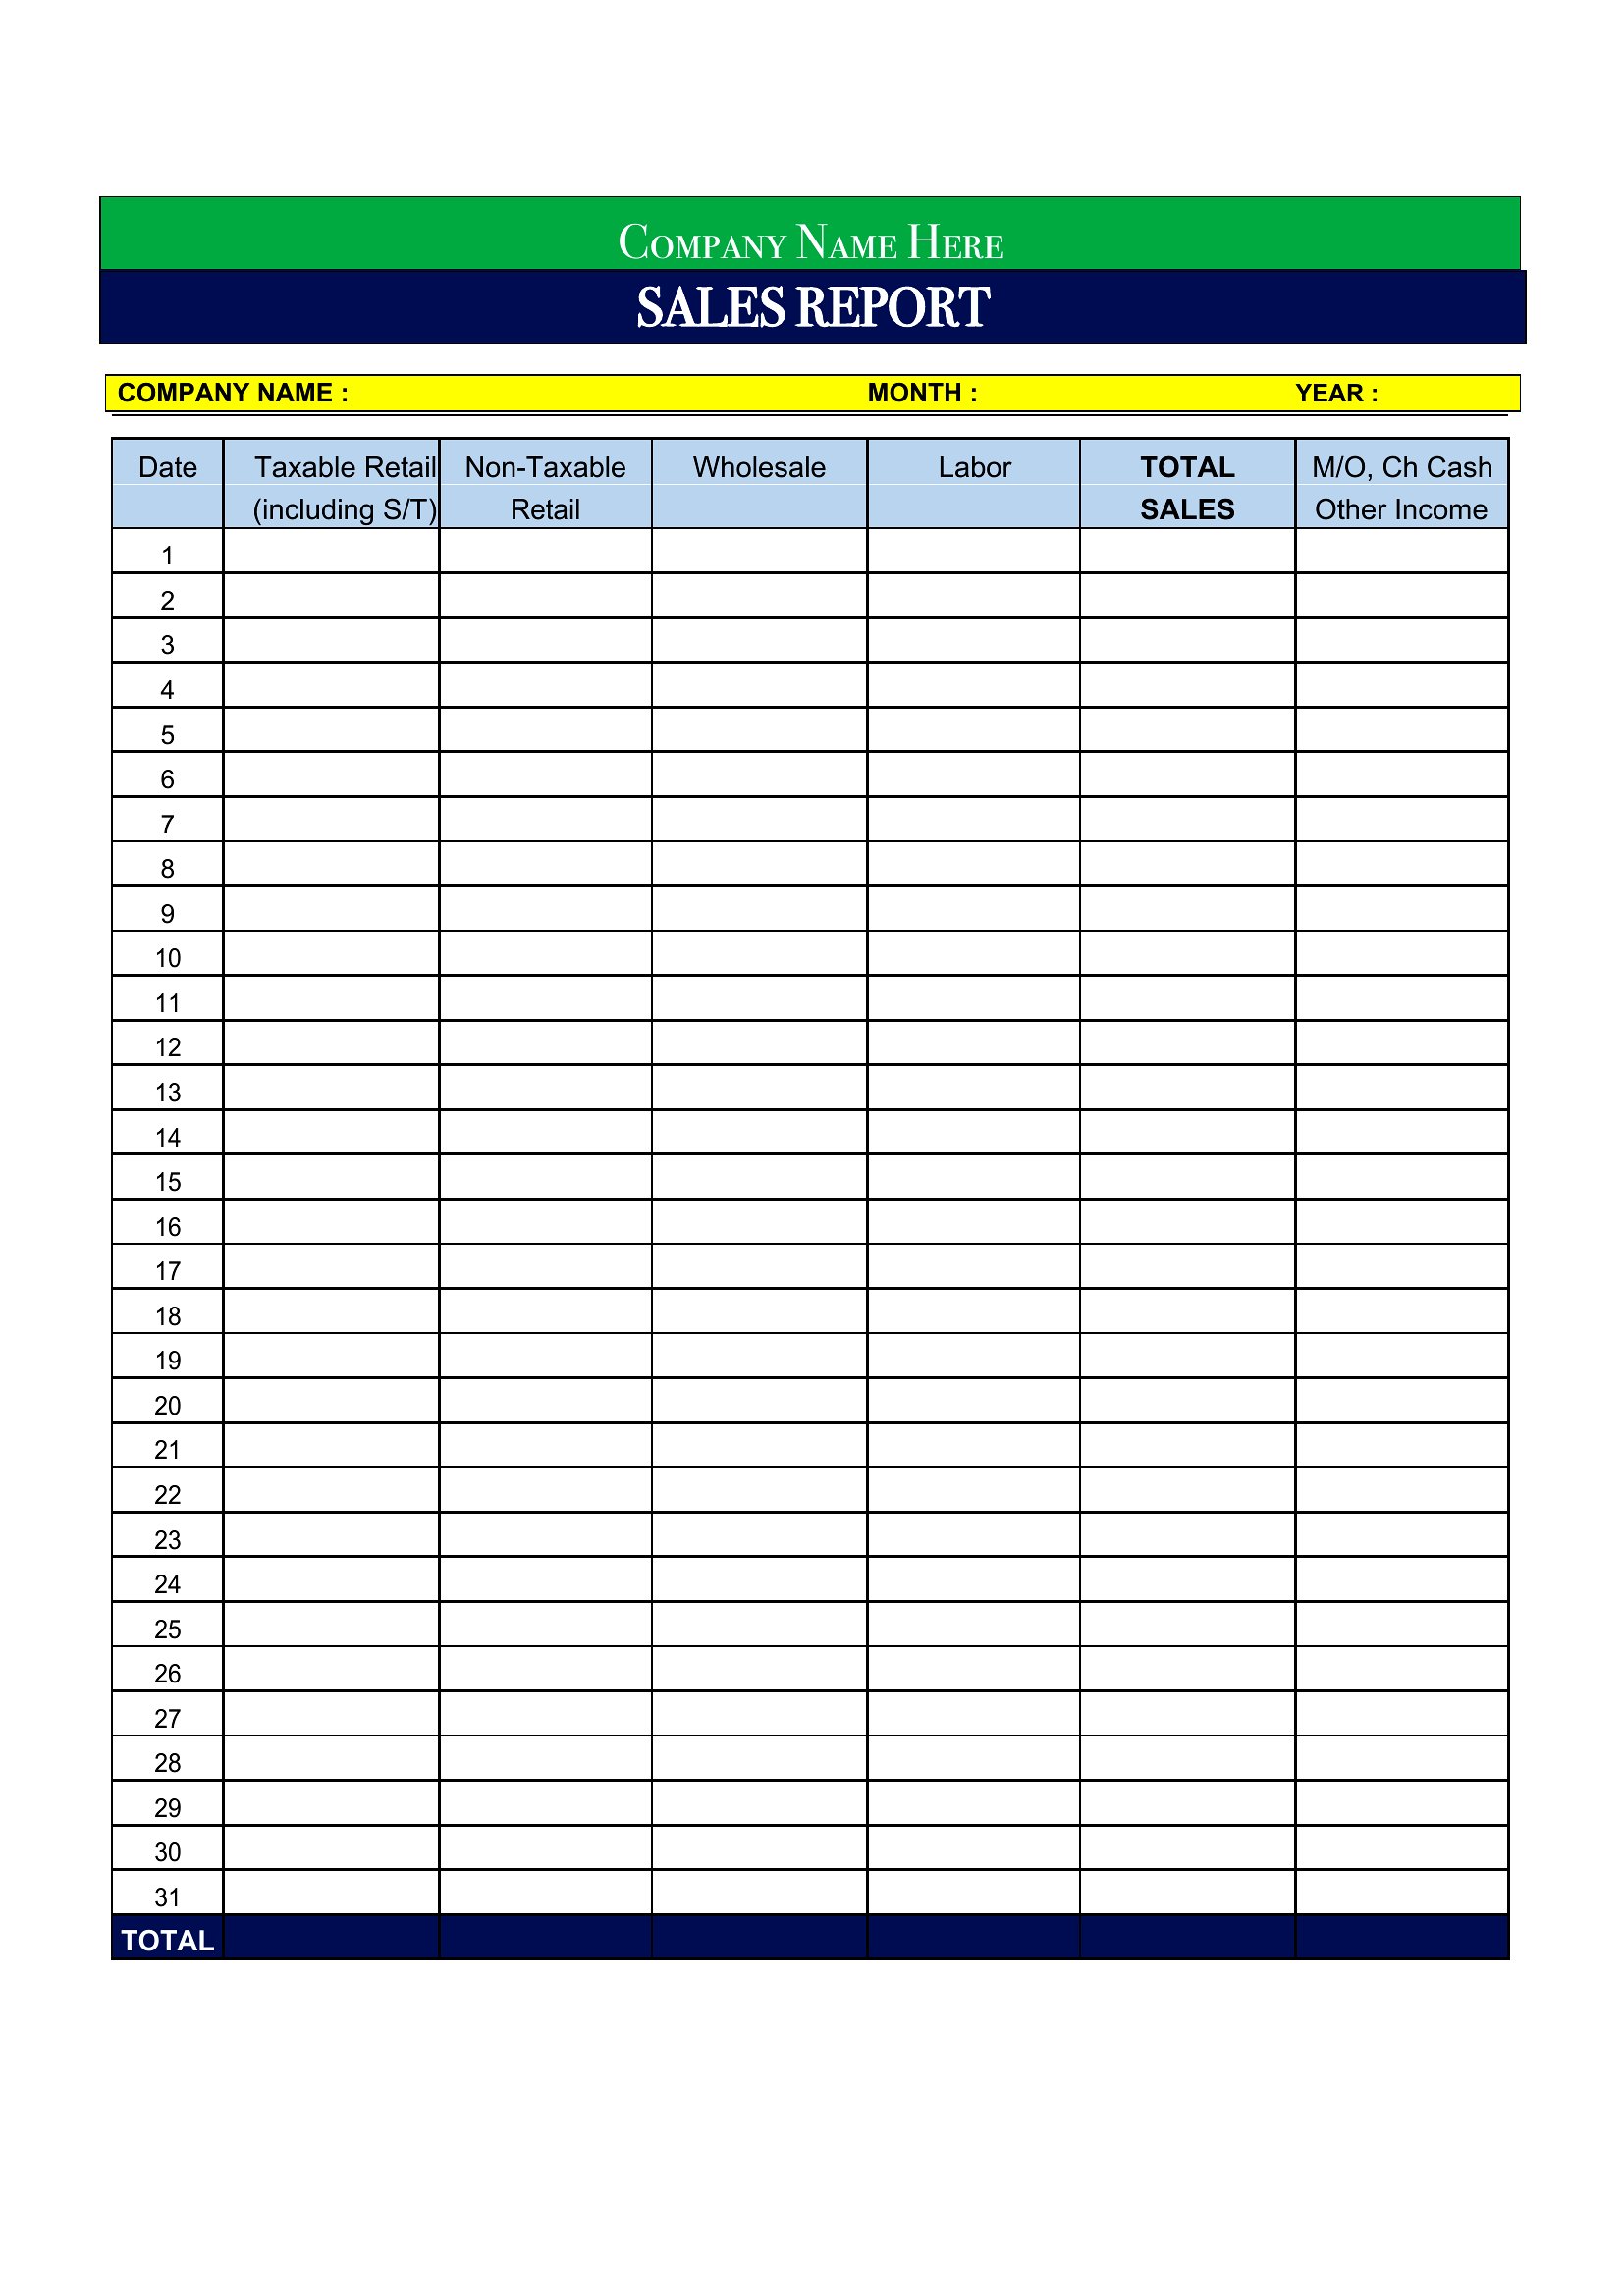
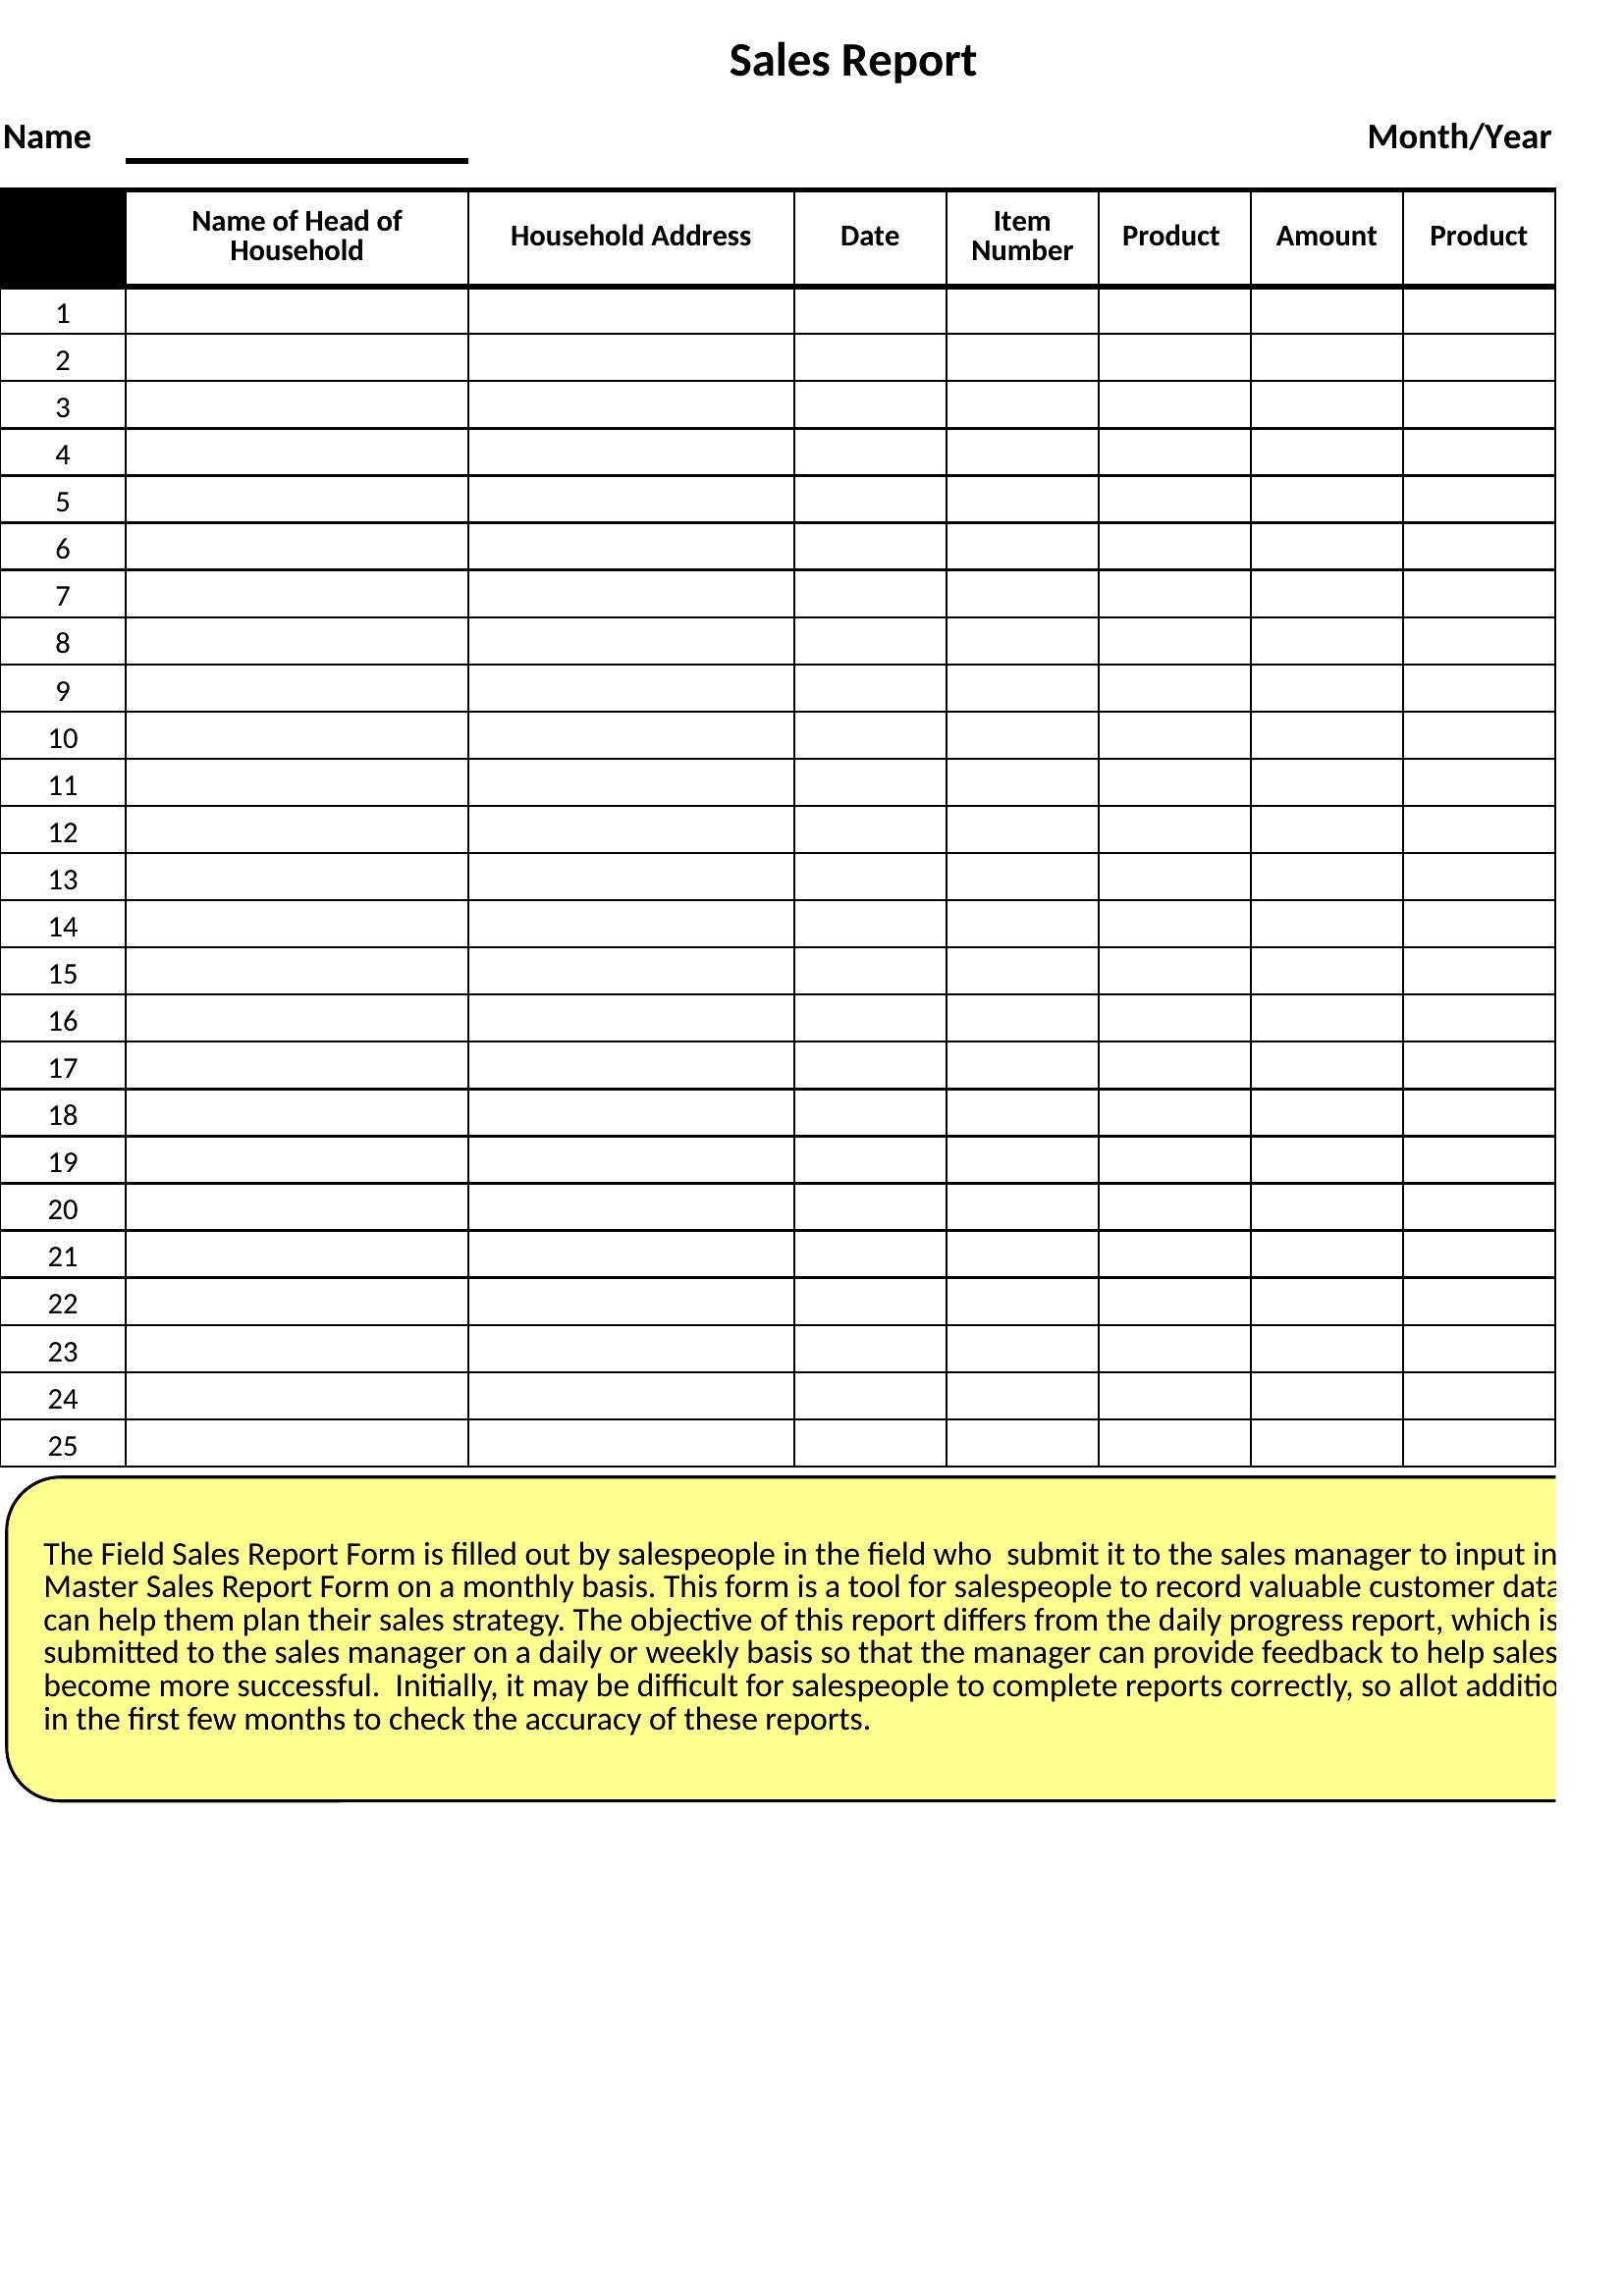
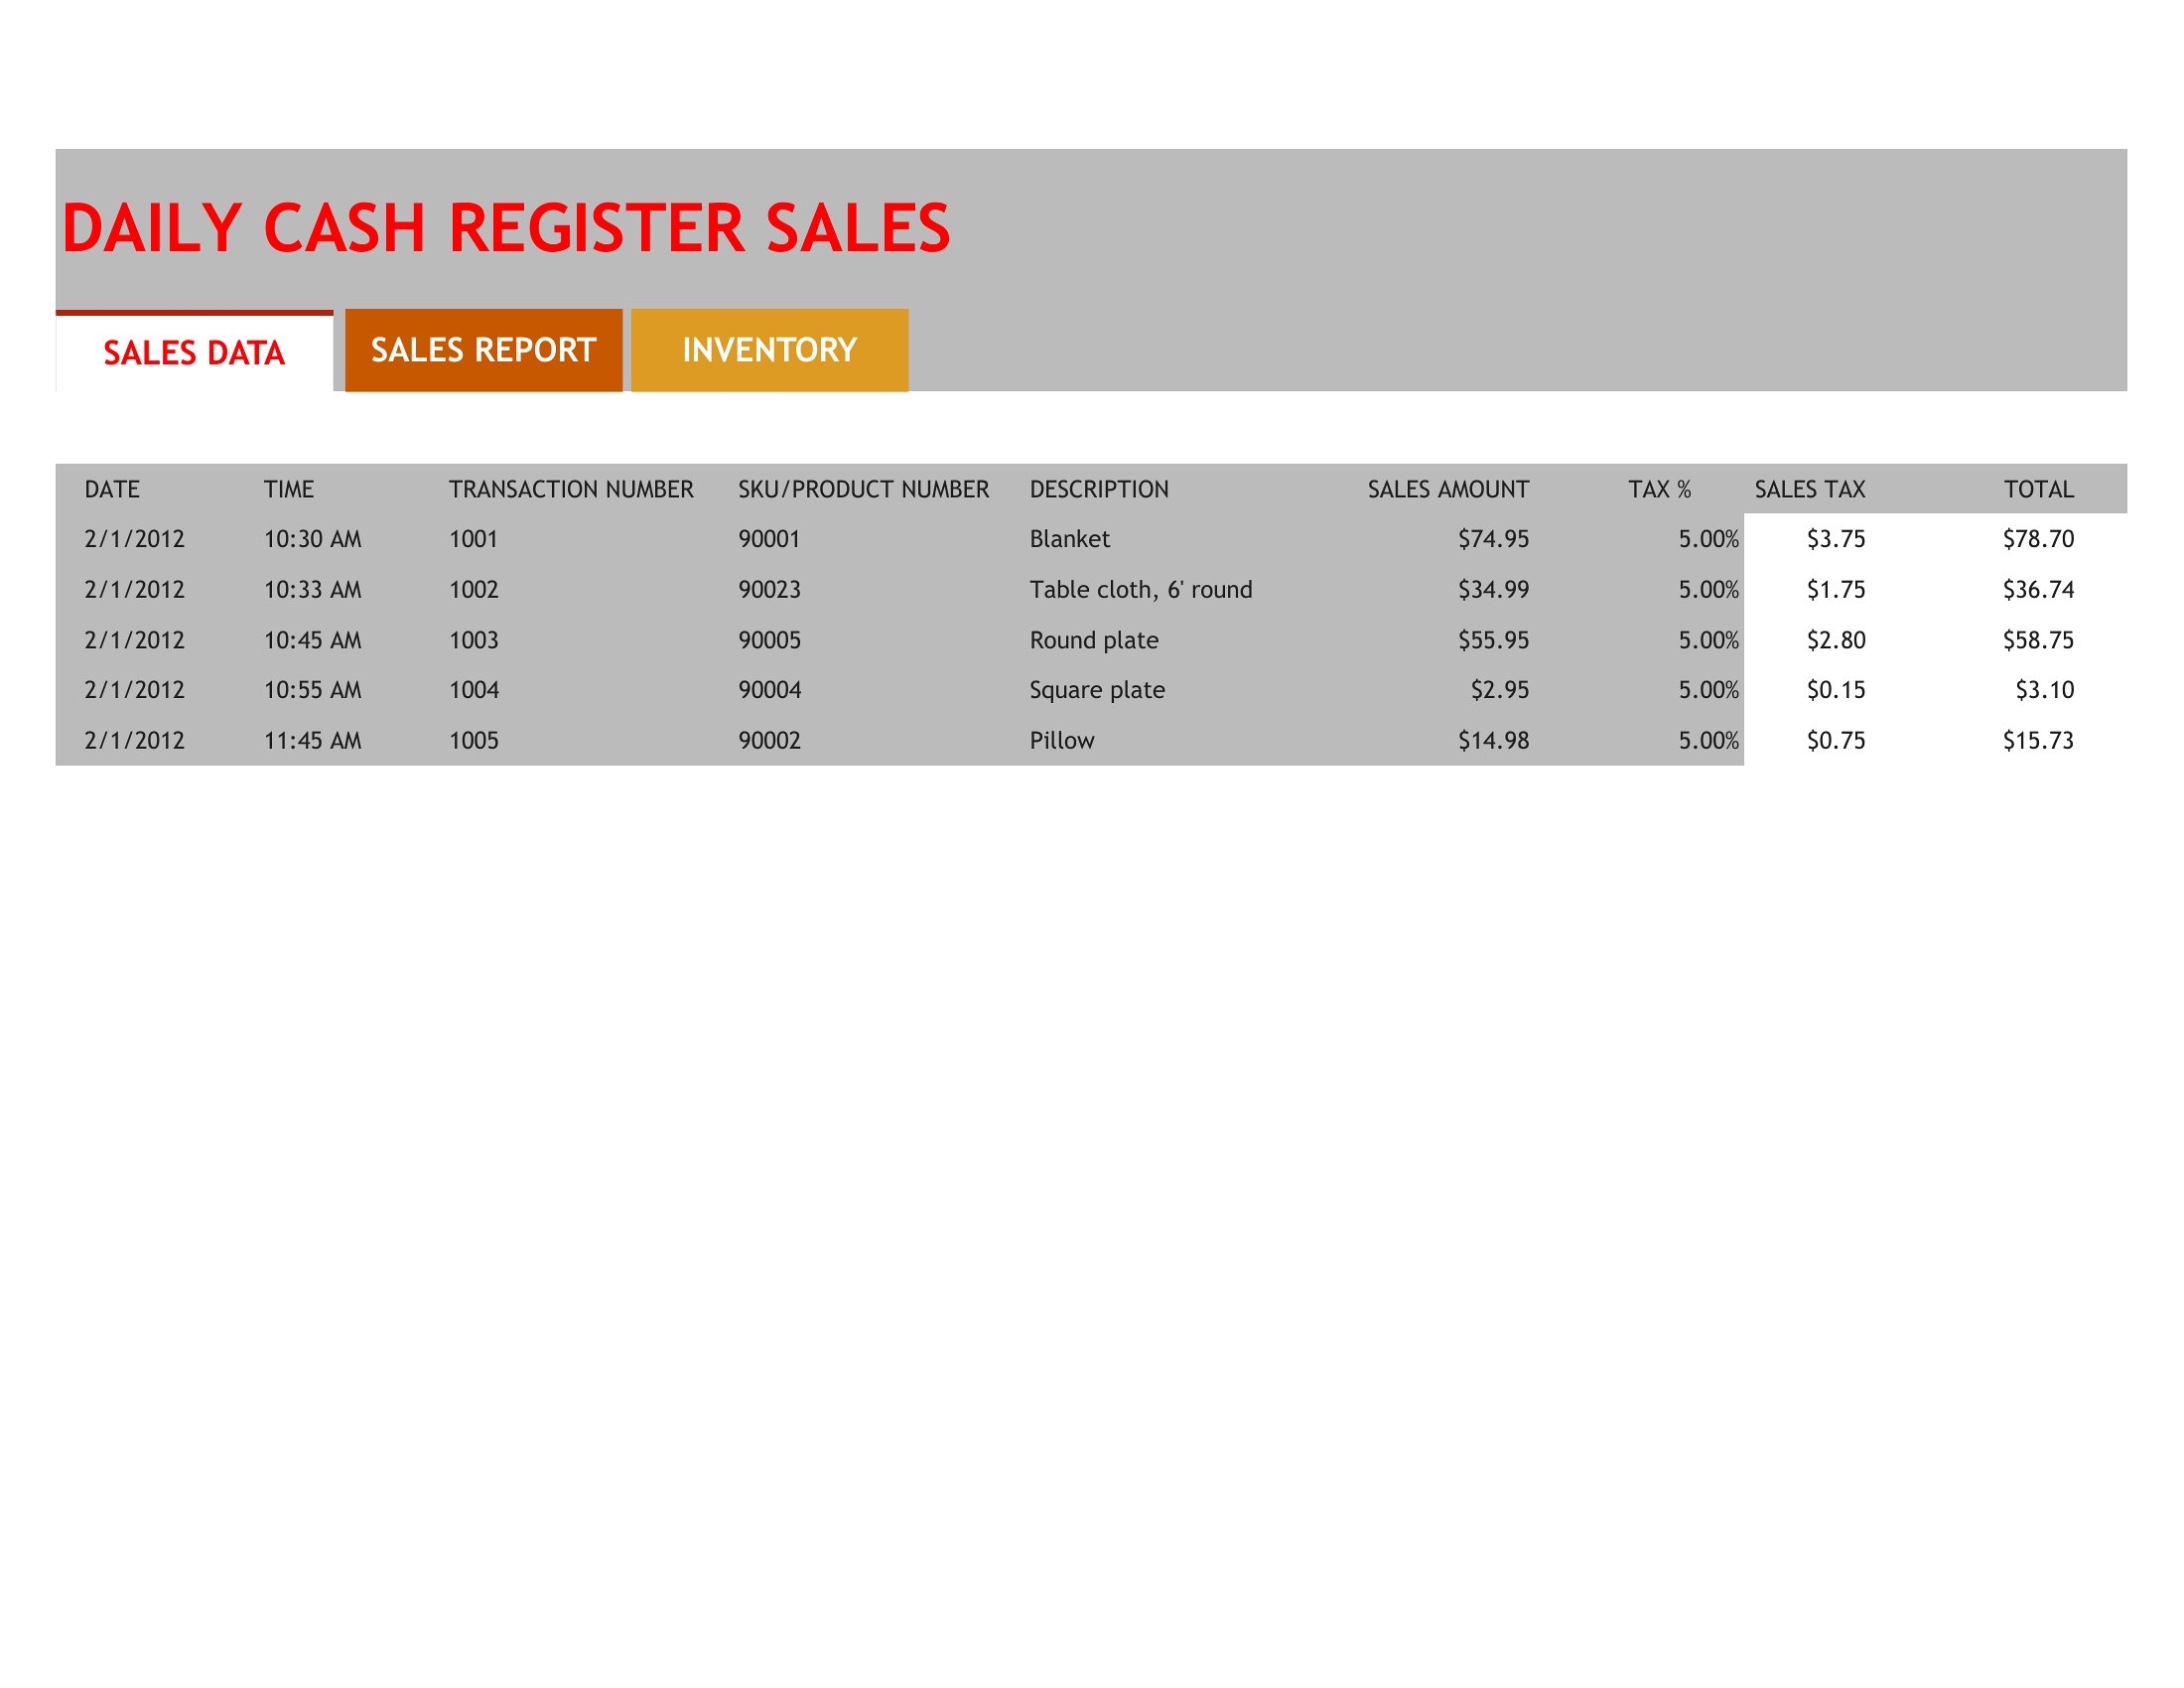
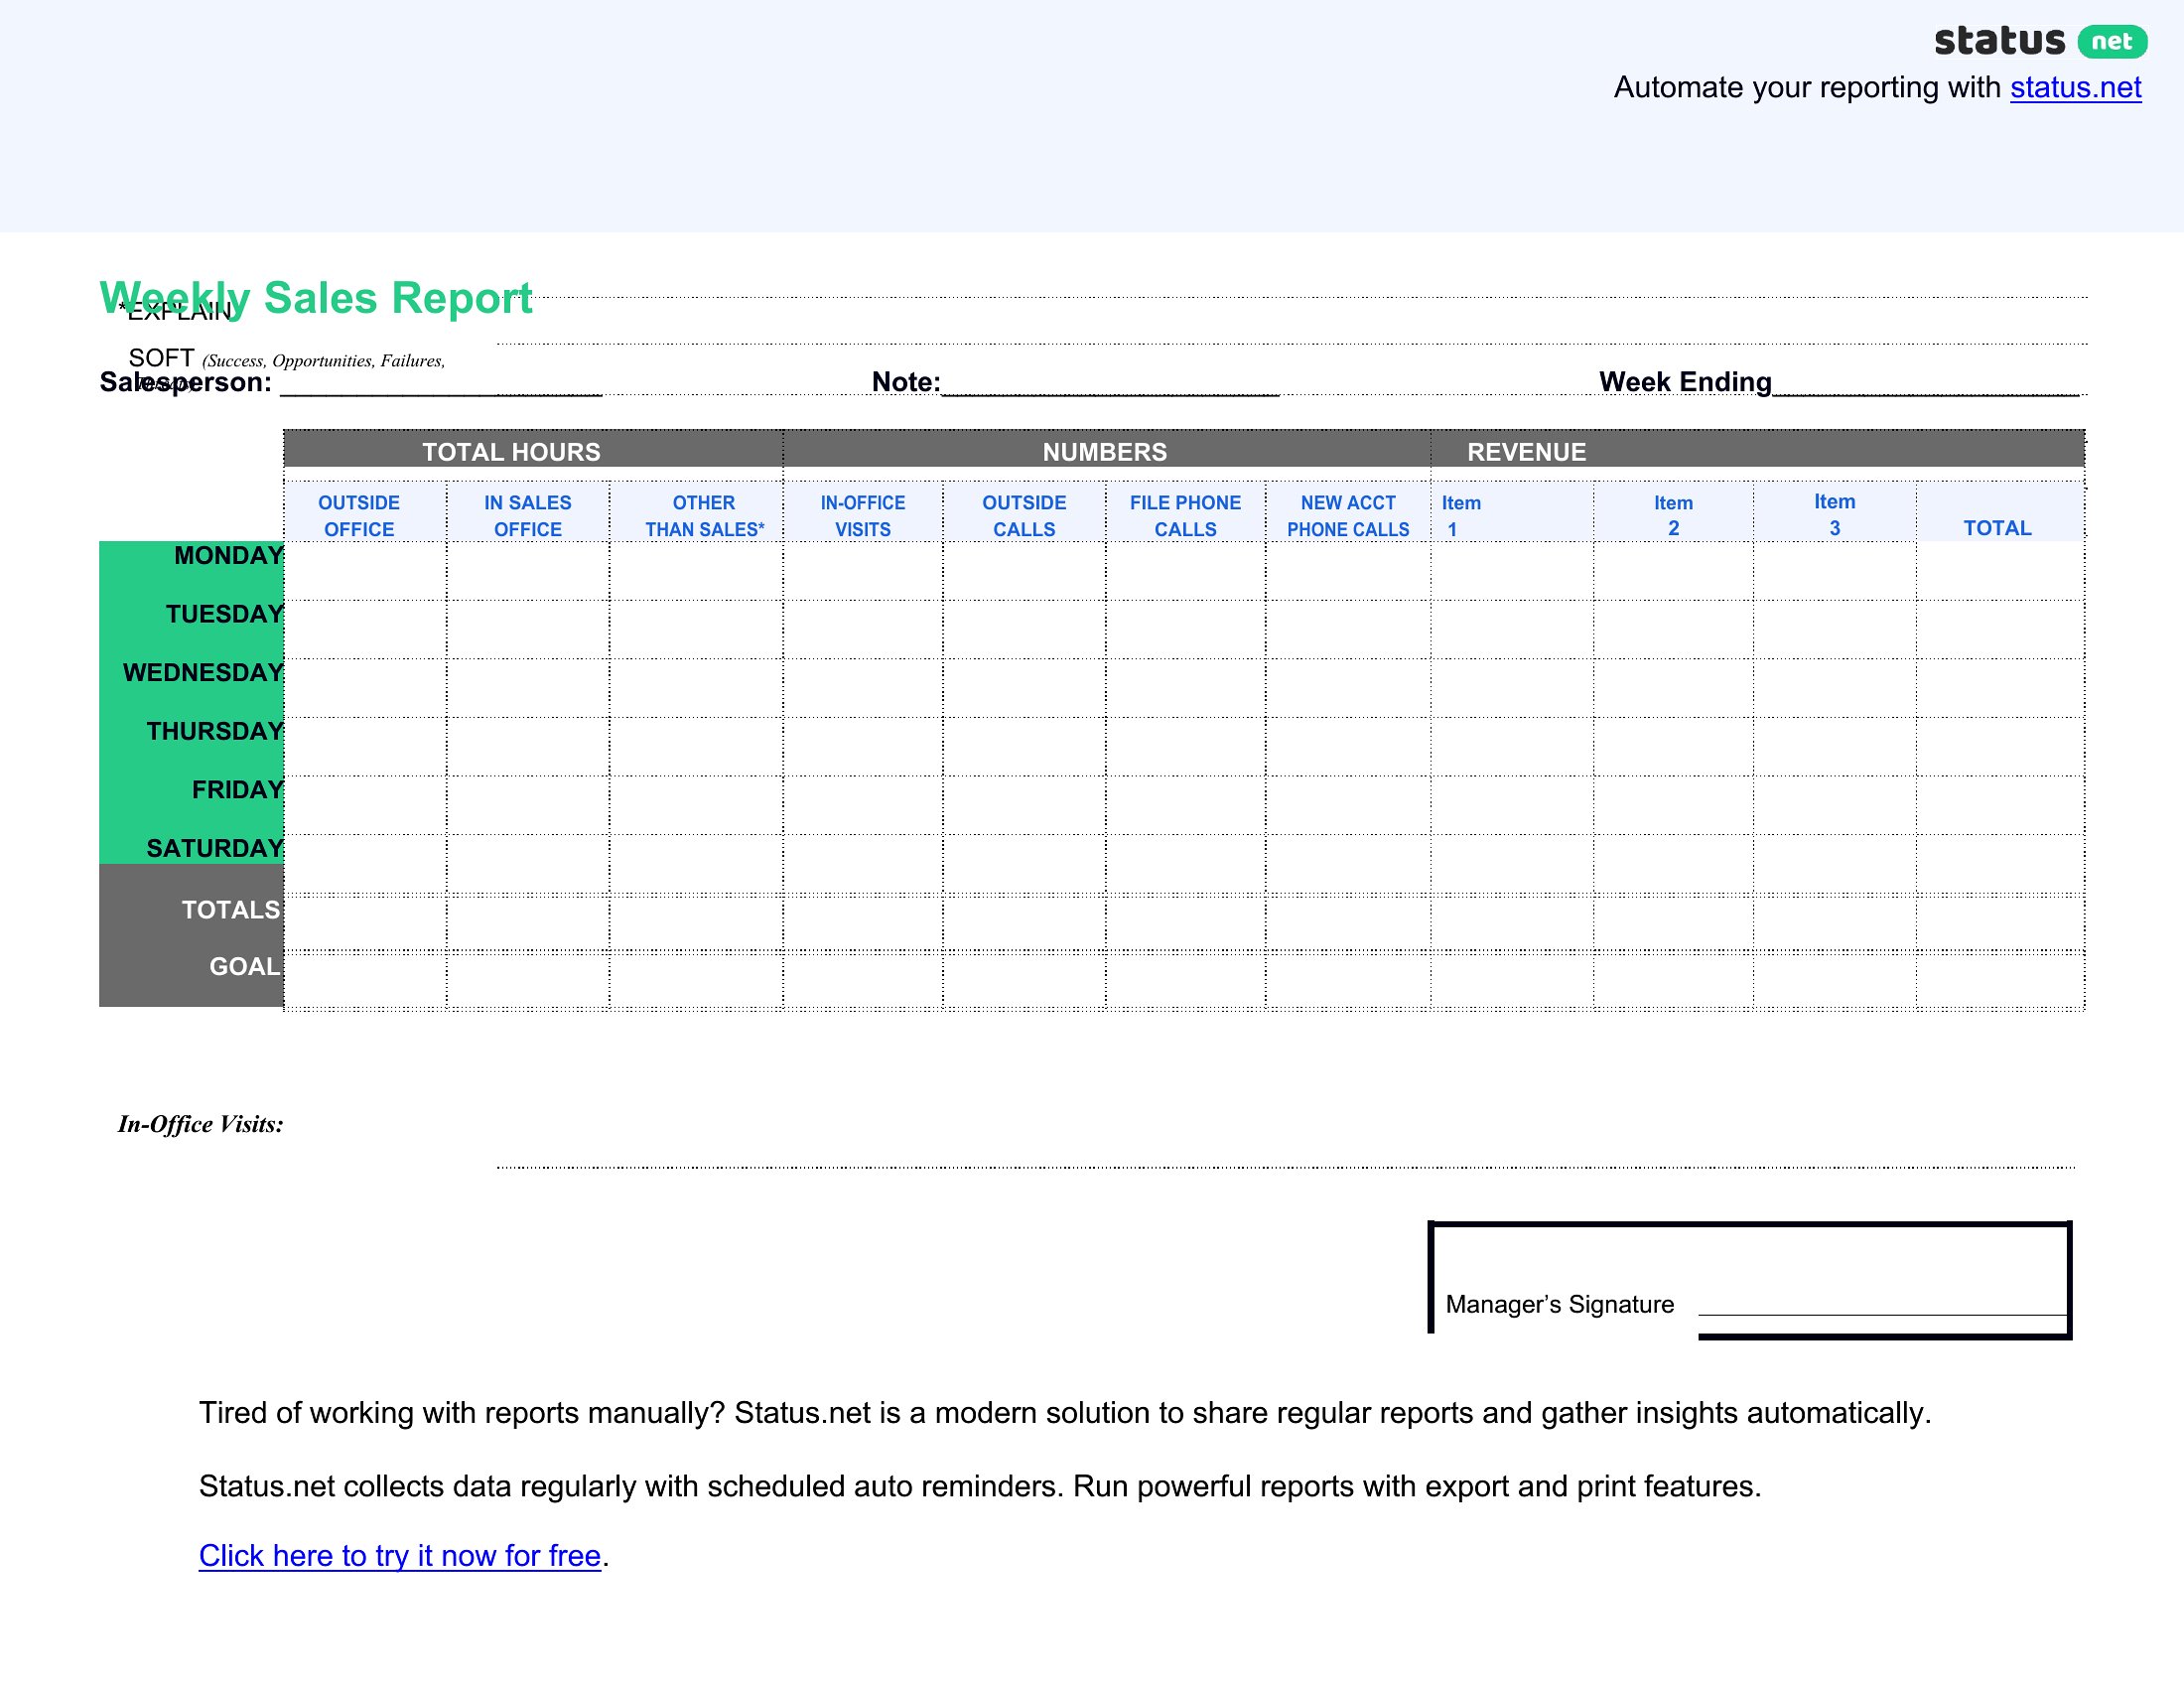
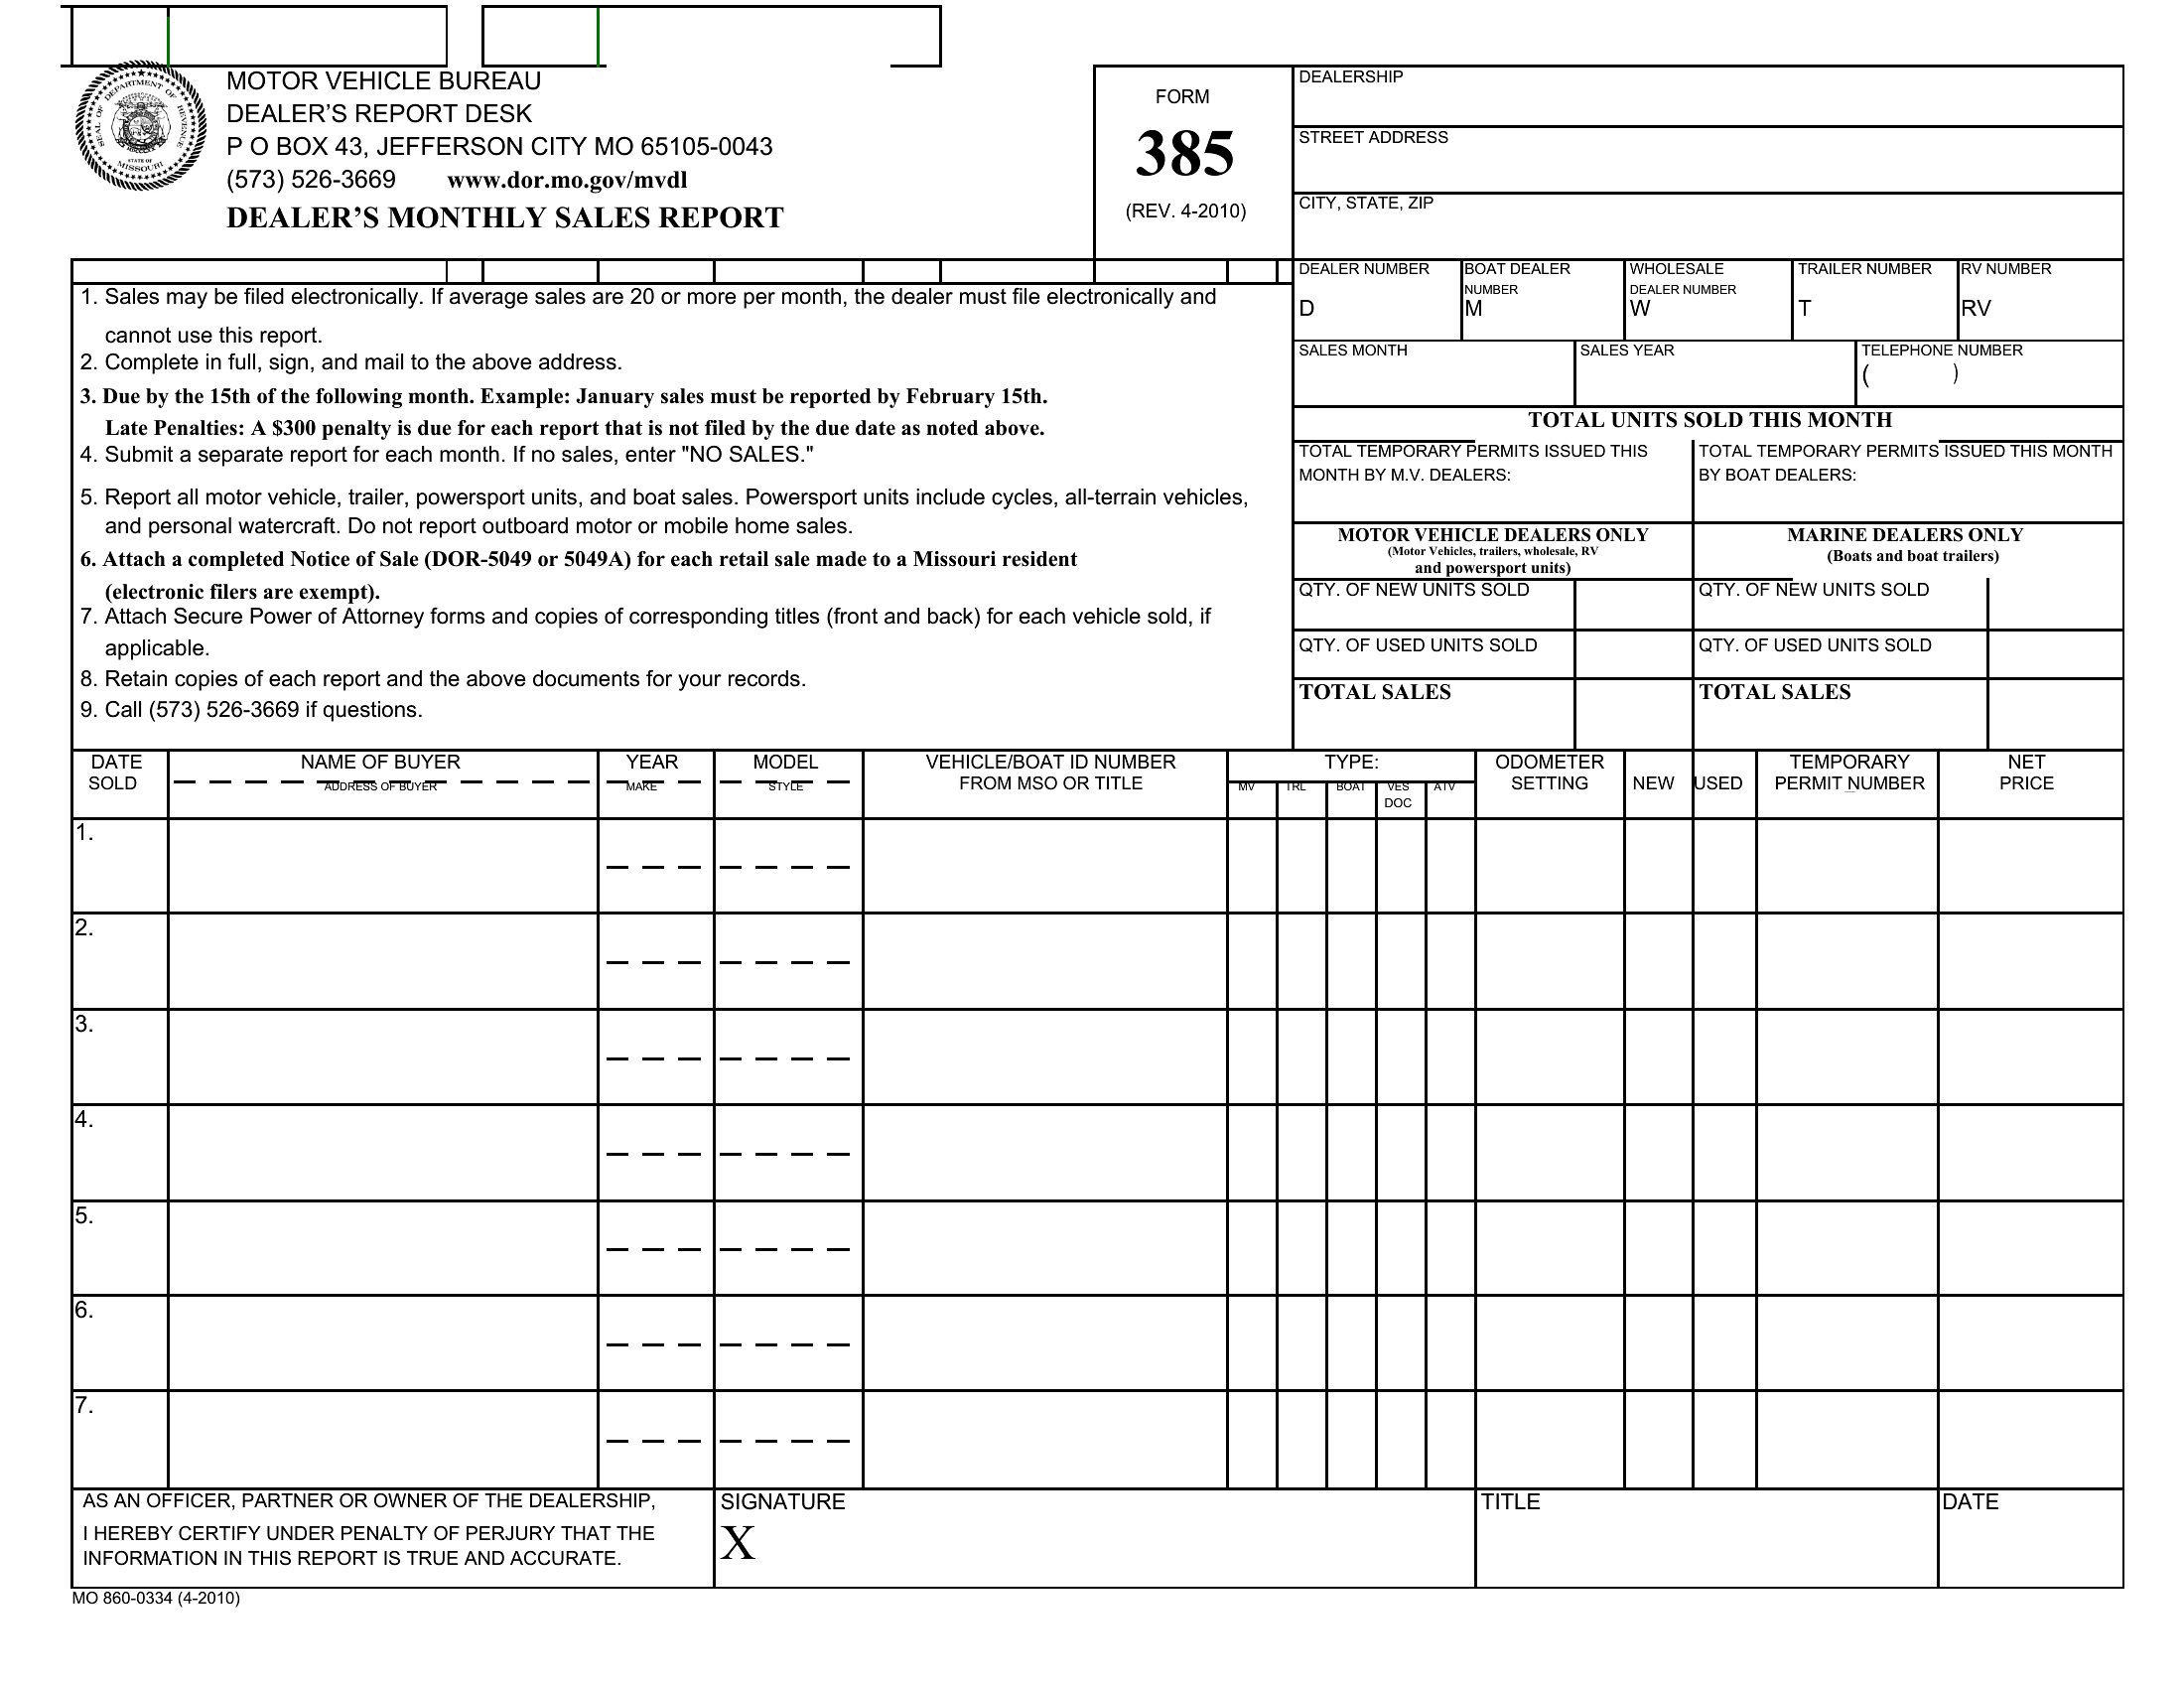
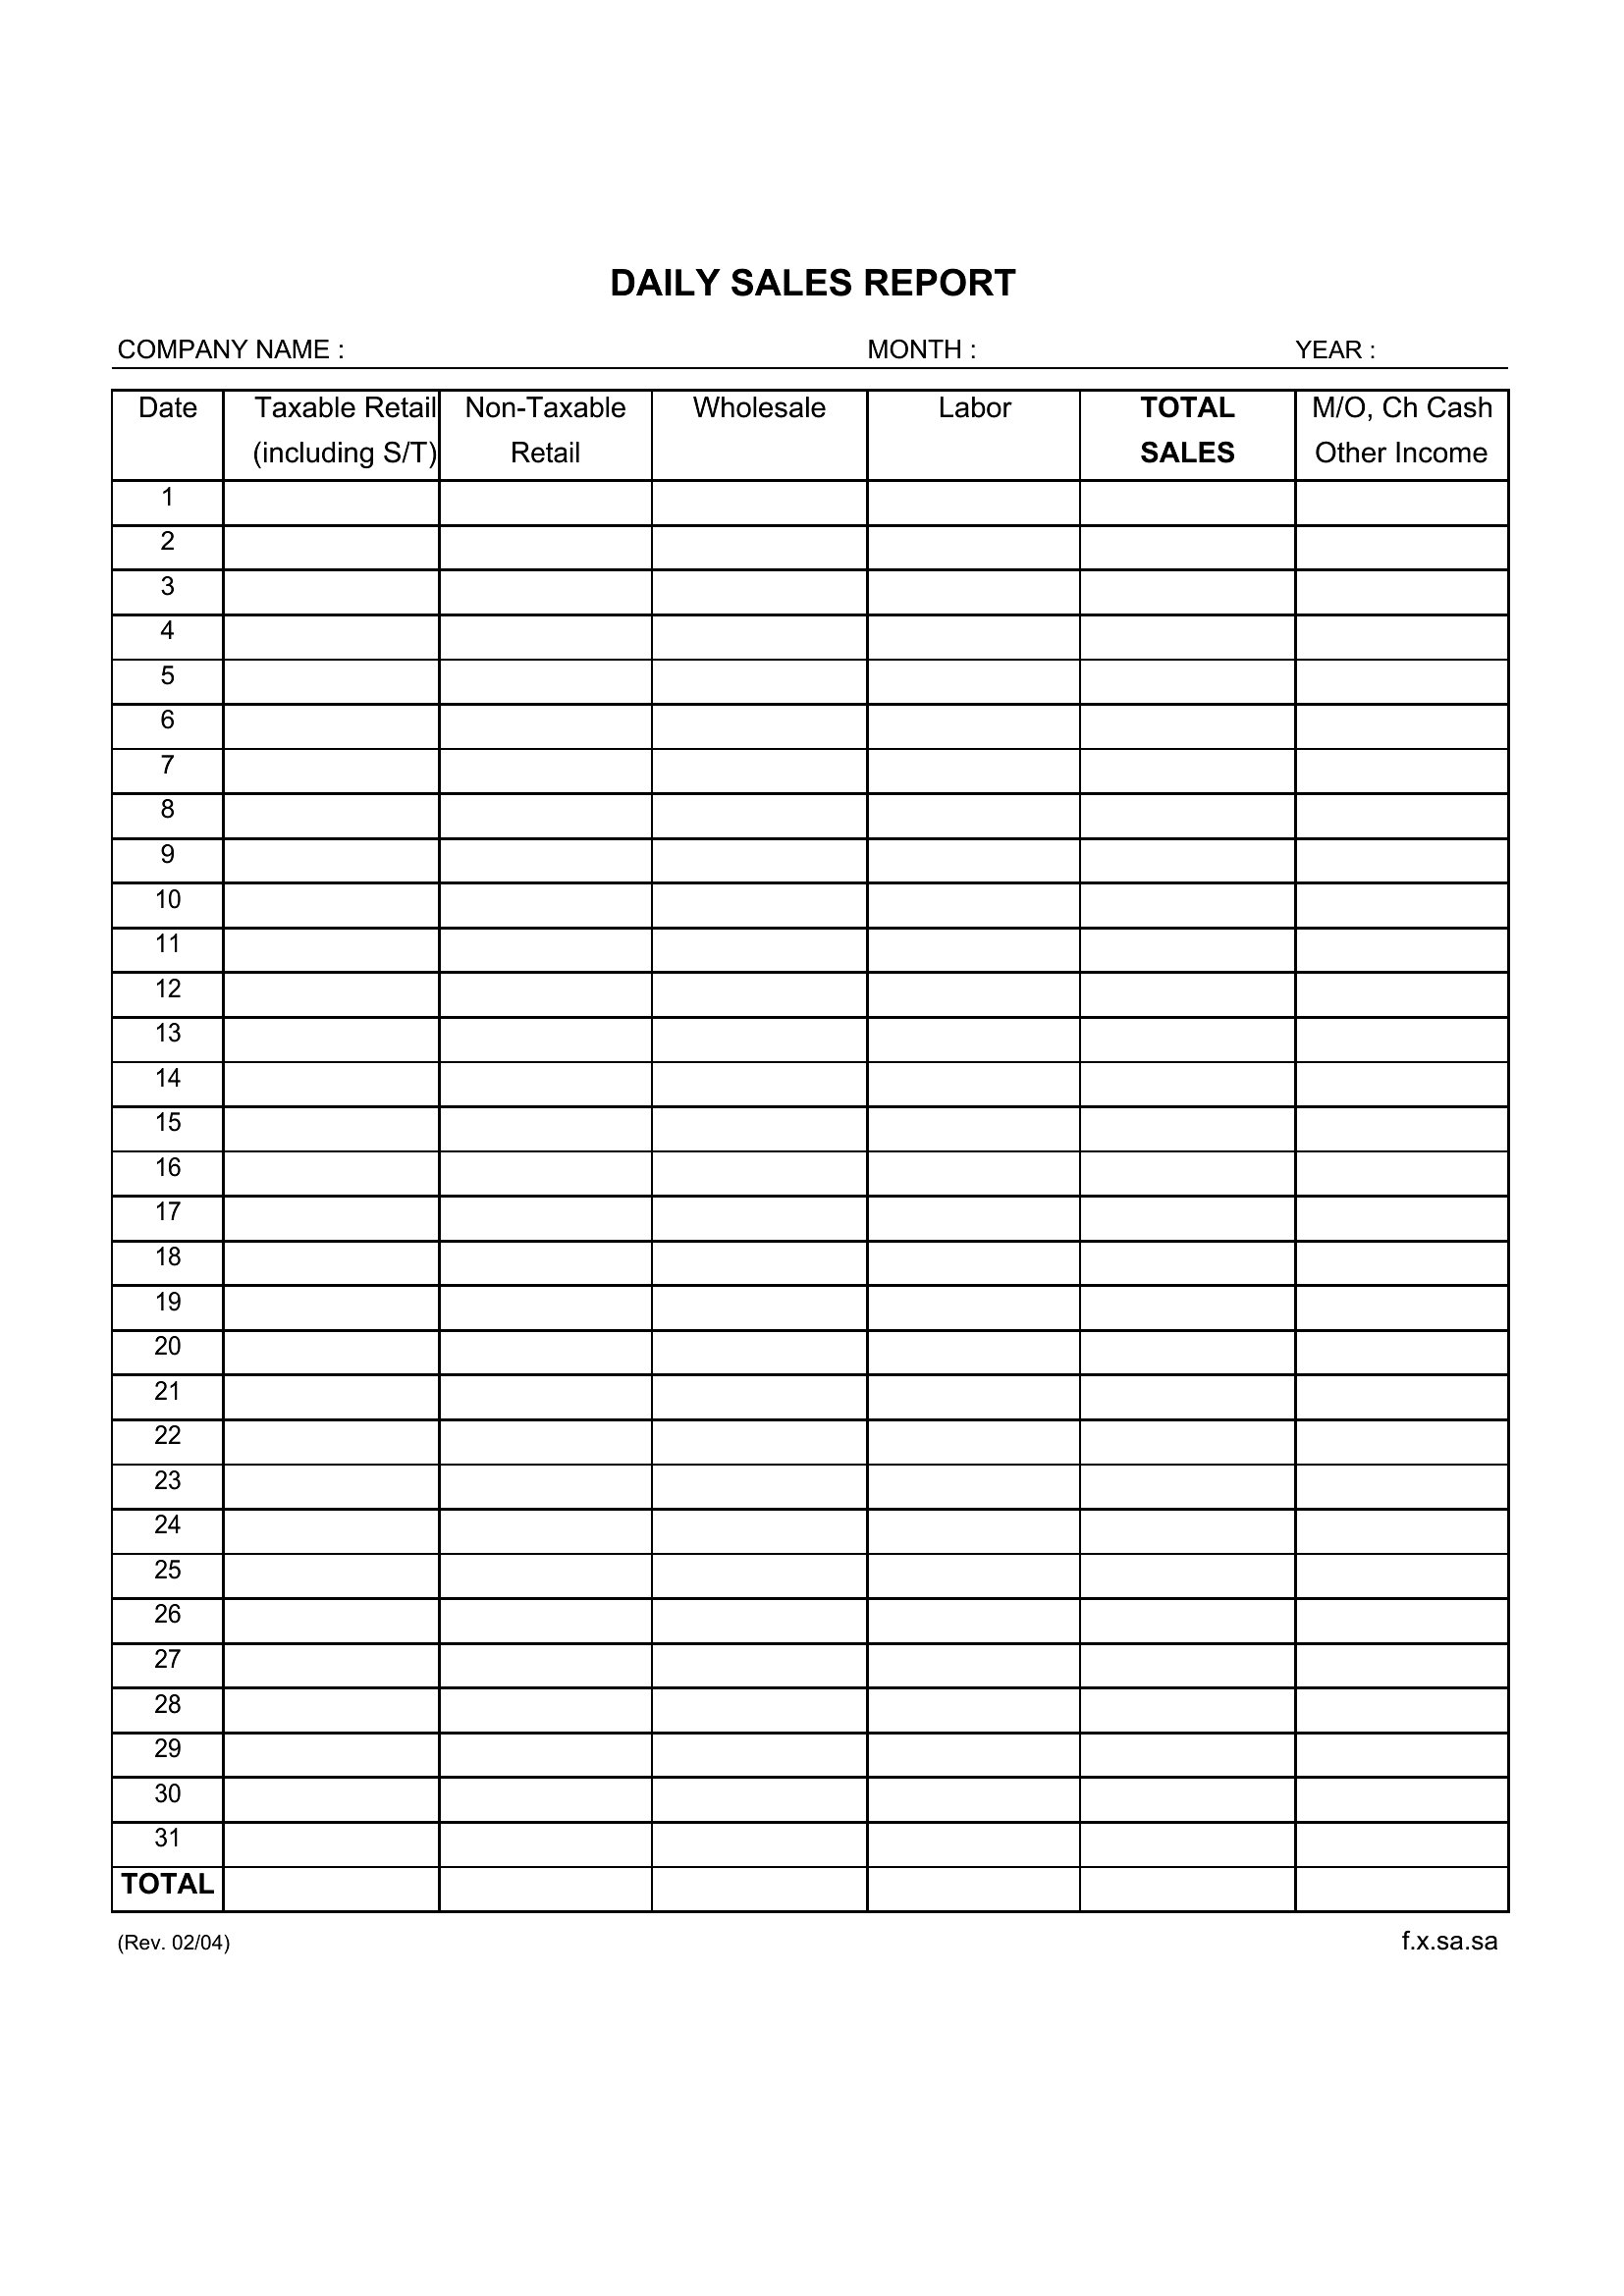
A sales report takes a stretch of numbers and tells the story behind them, showing what sold, when, and how it stacks up against the goal. This set of 47 sales report templates helps reps and managers summarize daily, weekly, or monthly performance for a quick read at the next meeting. Each layout organizes totals, comparisons, and notes.
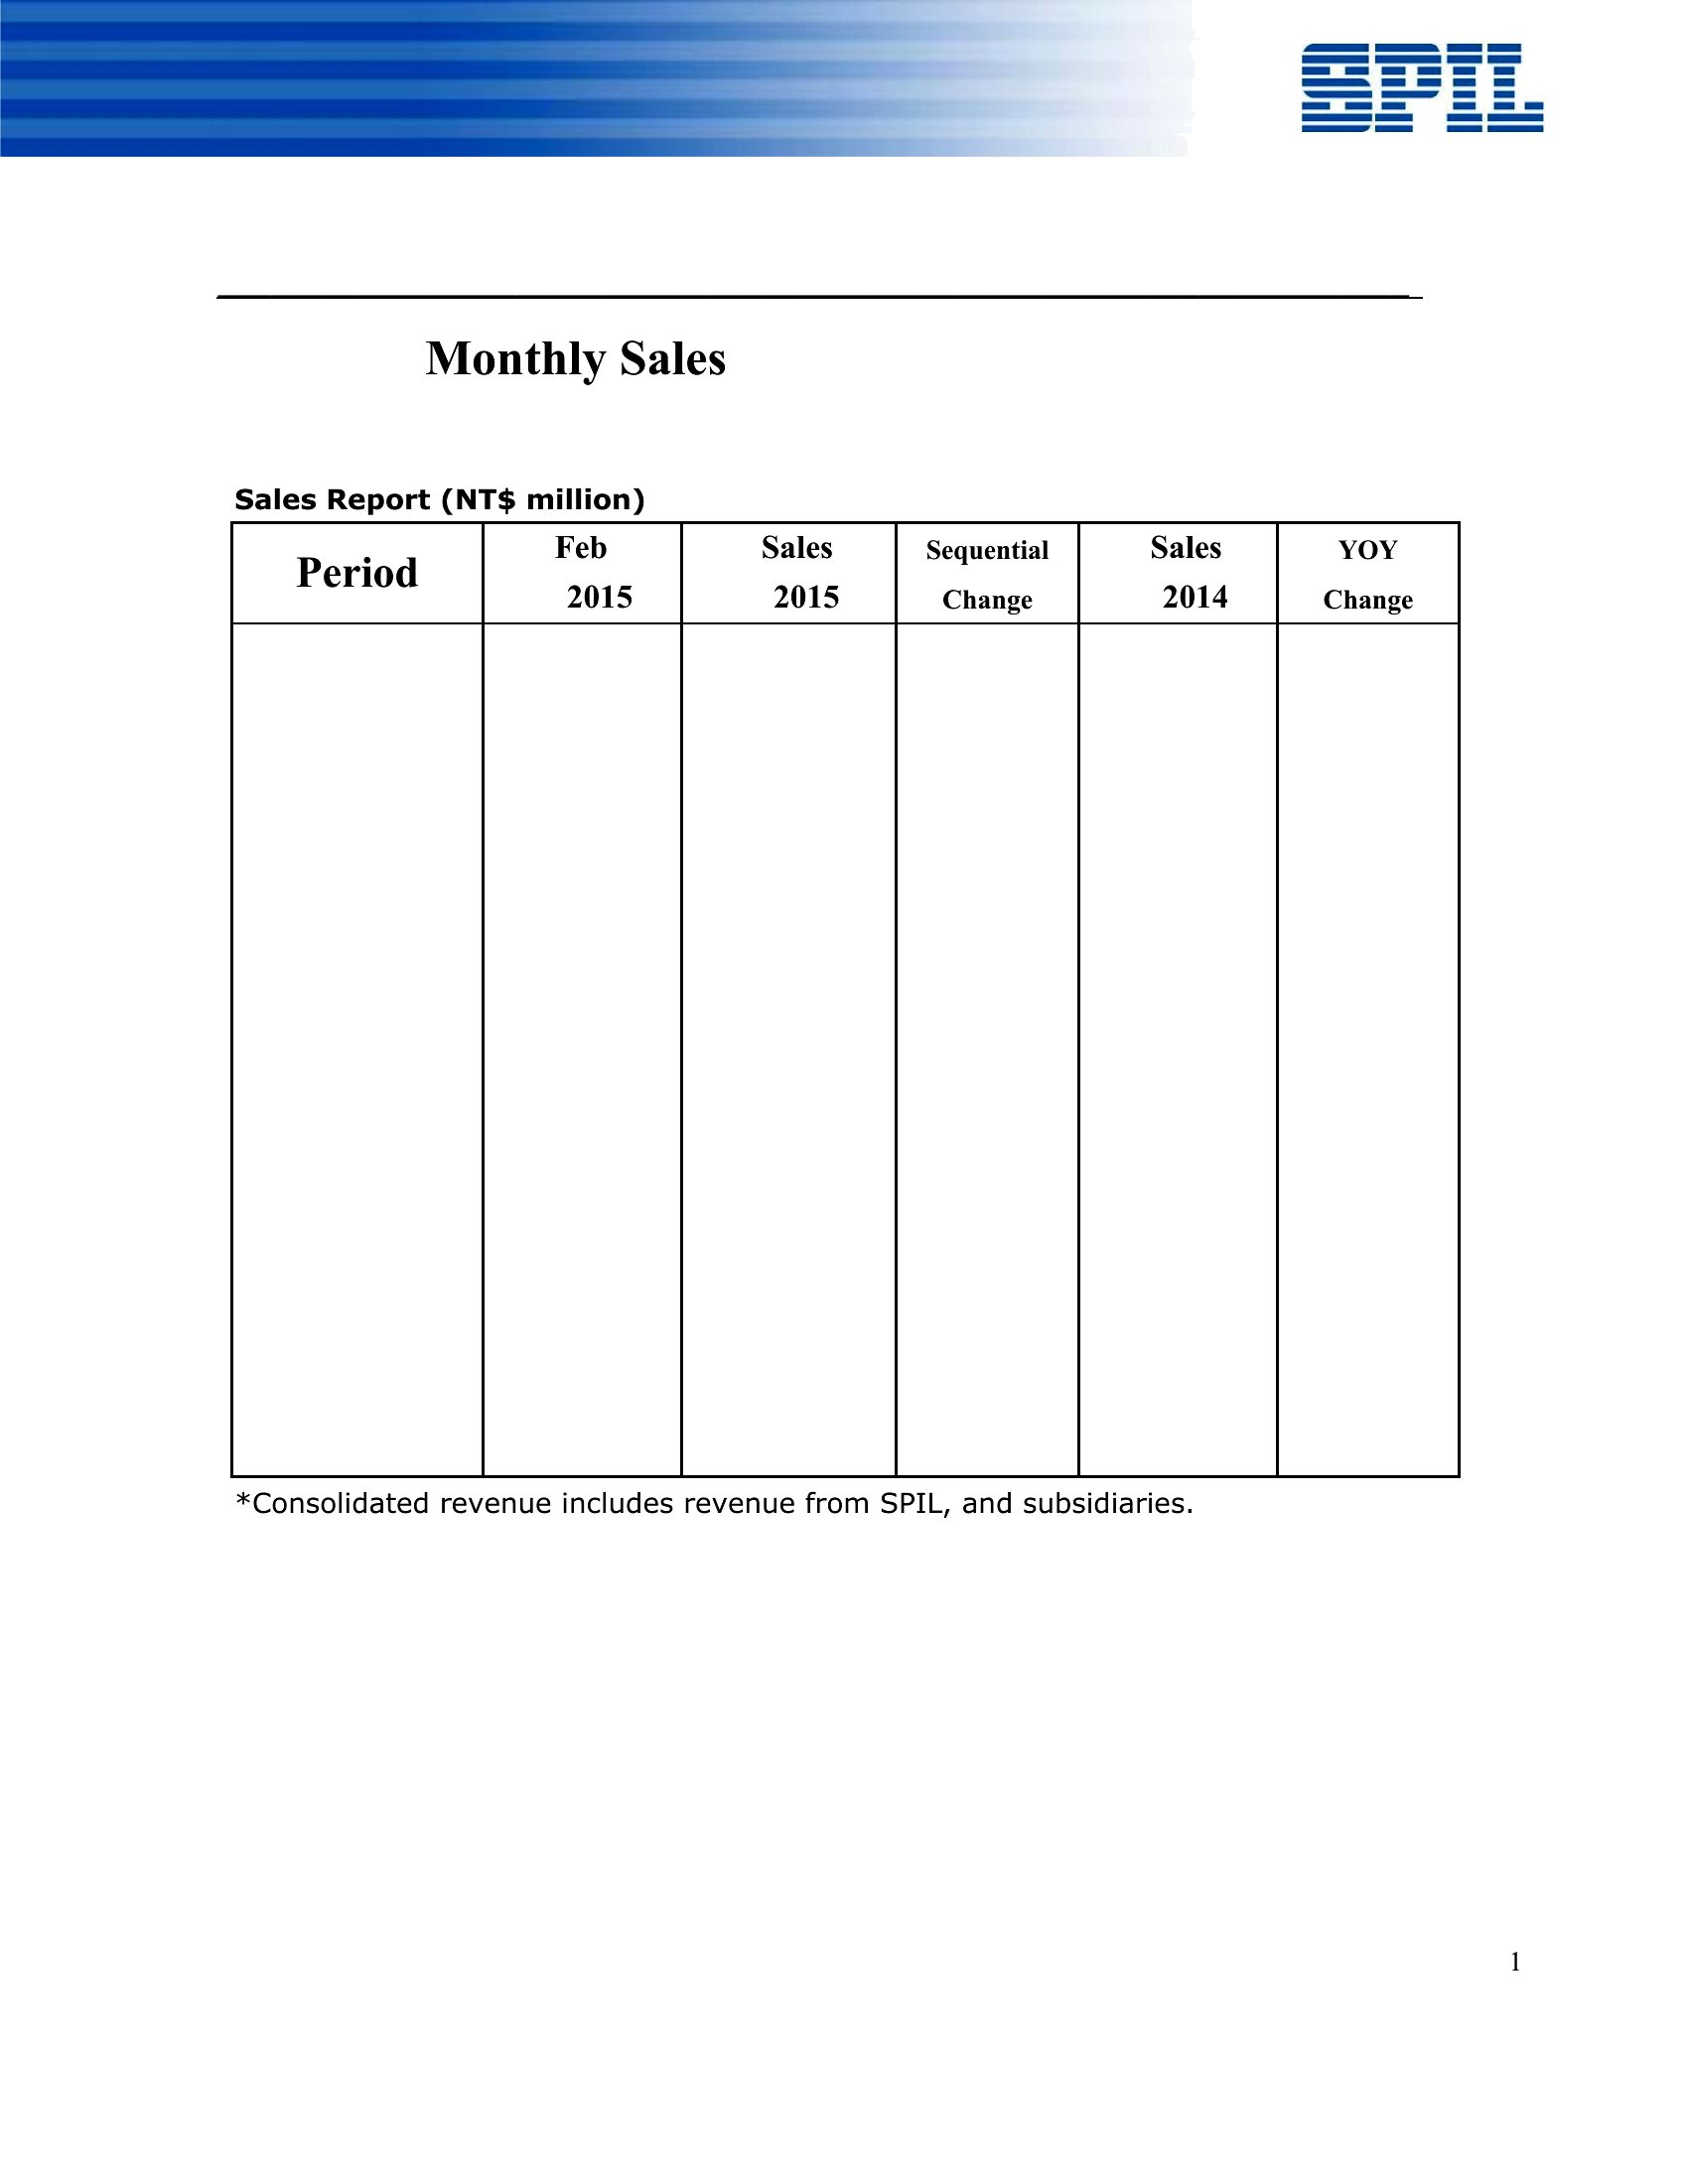
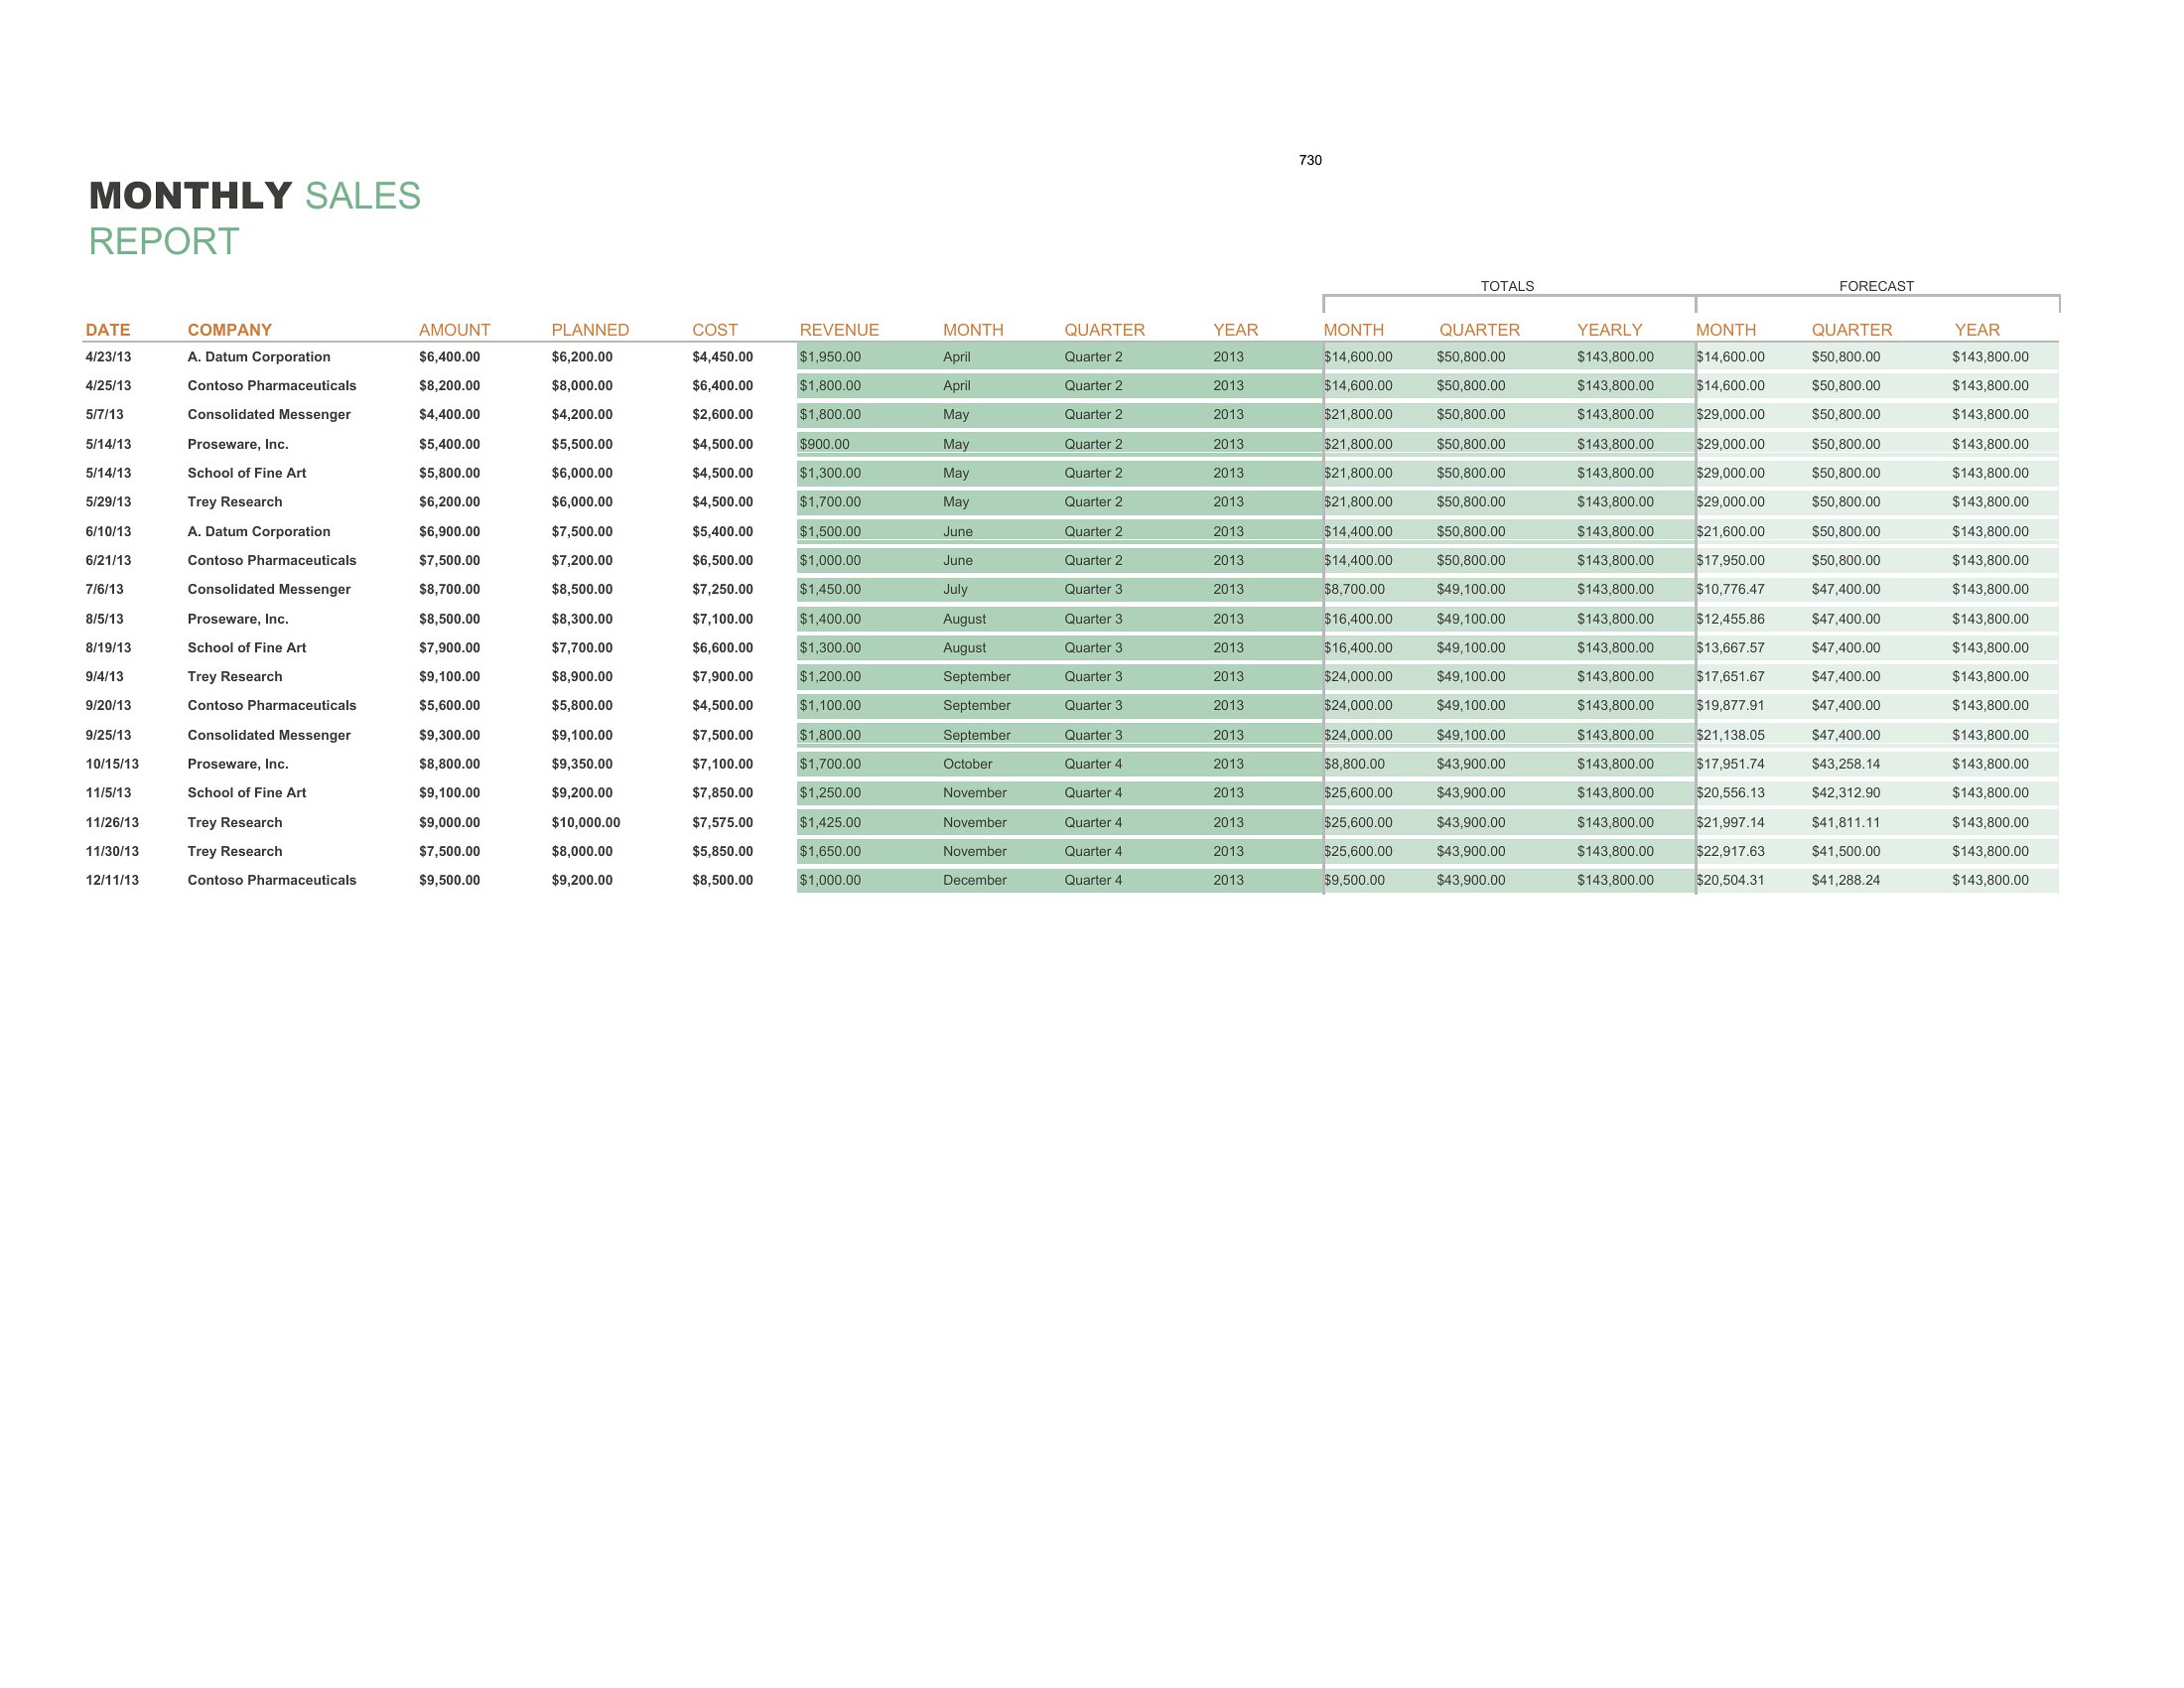
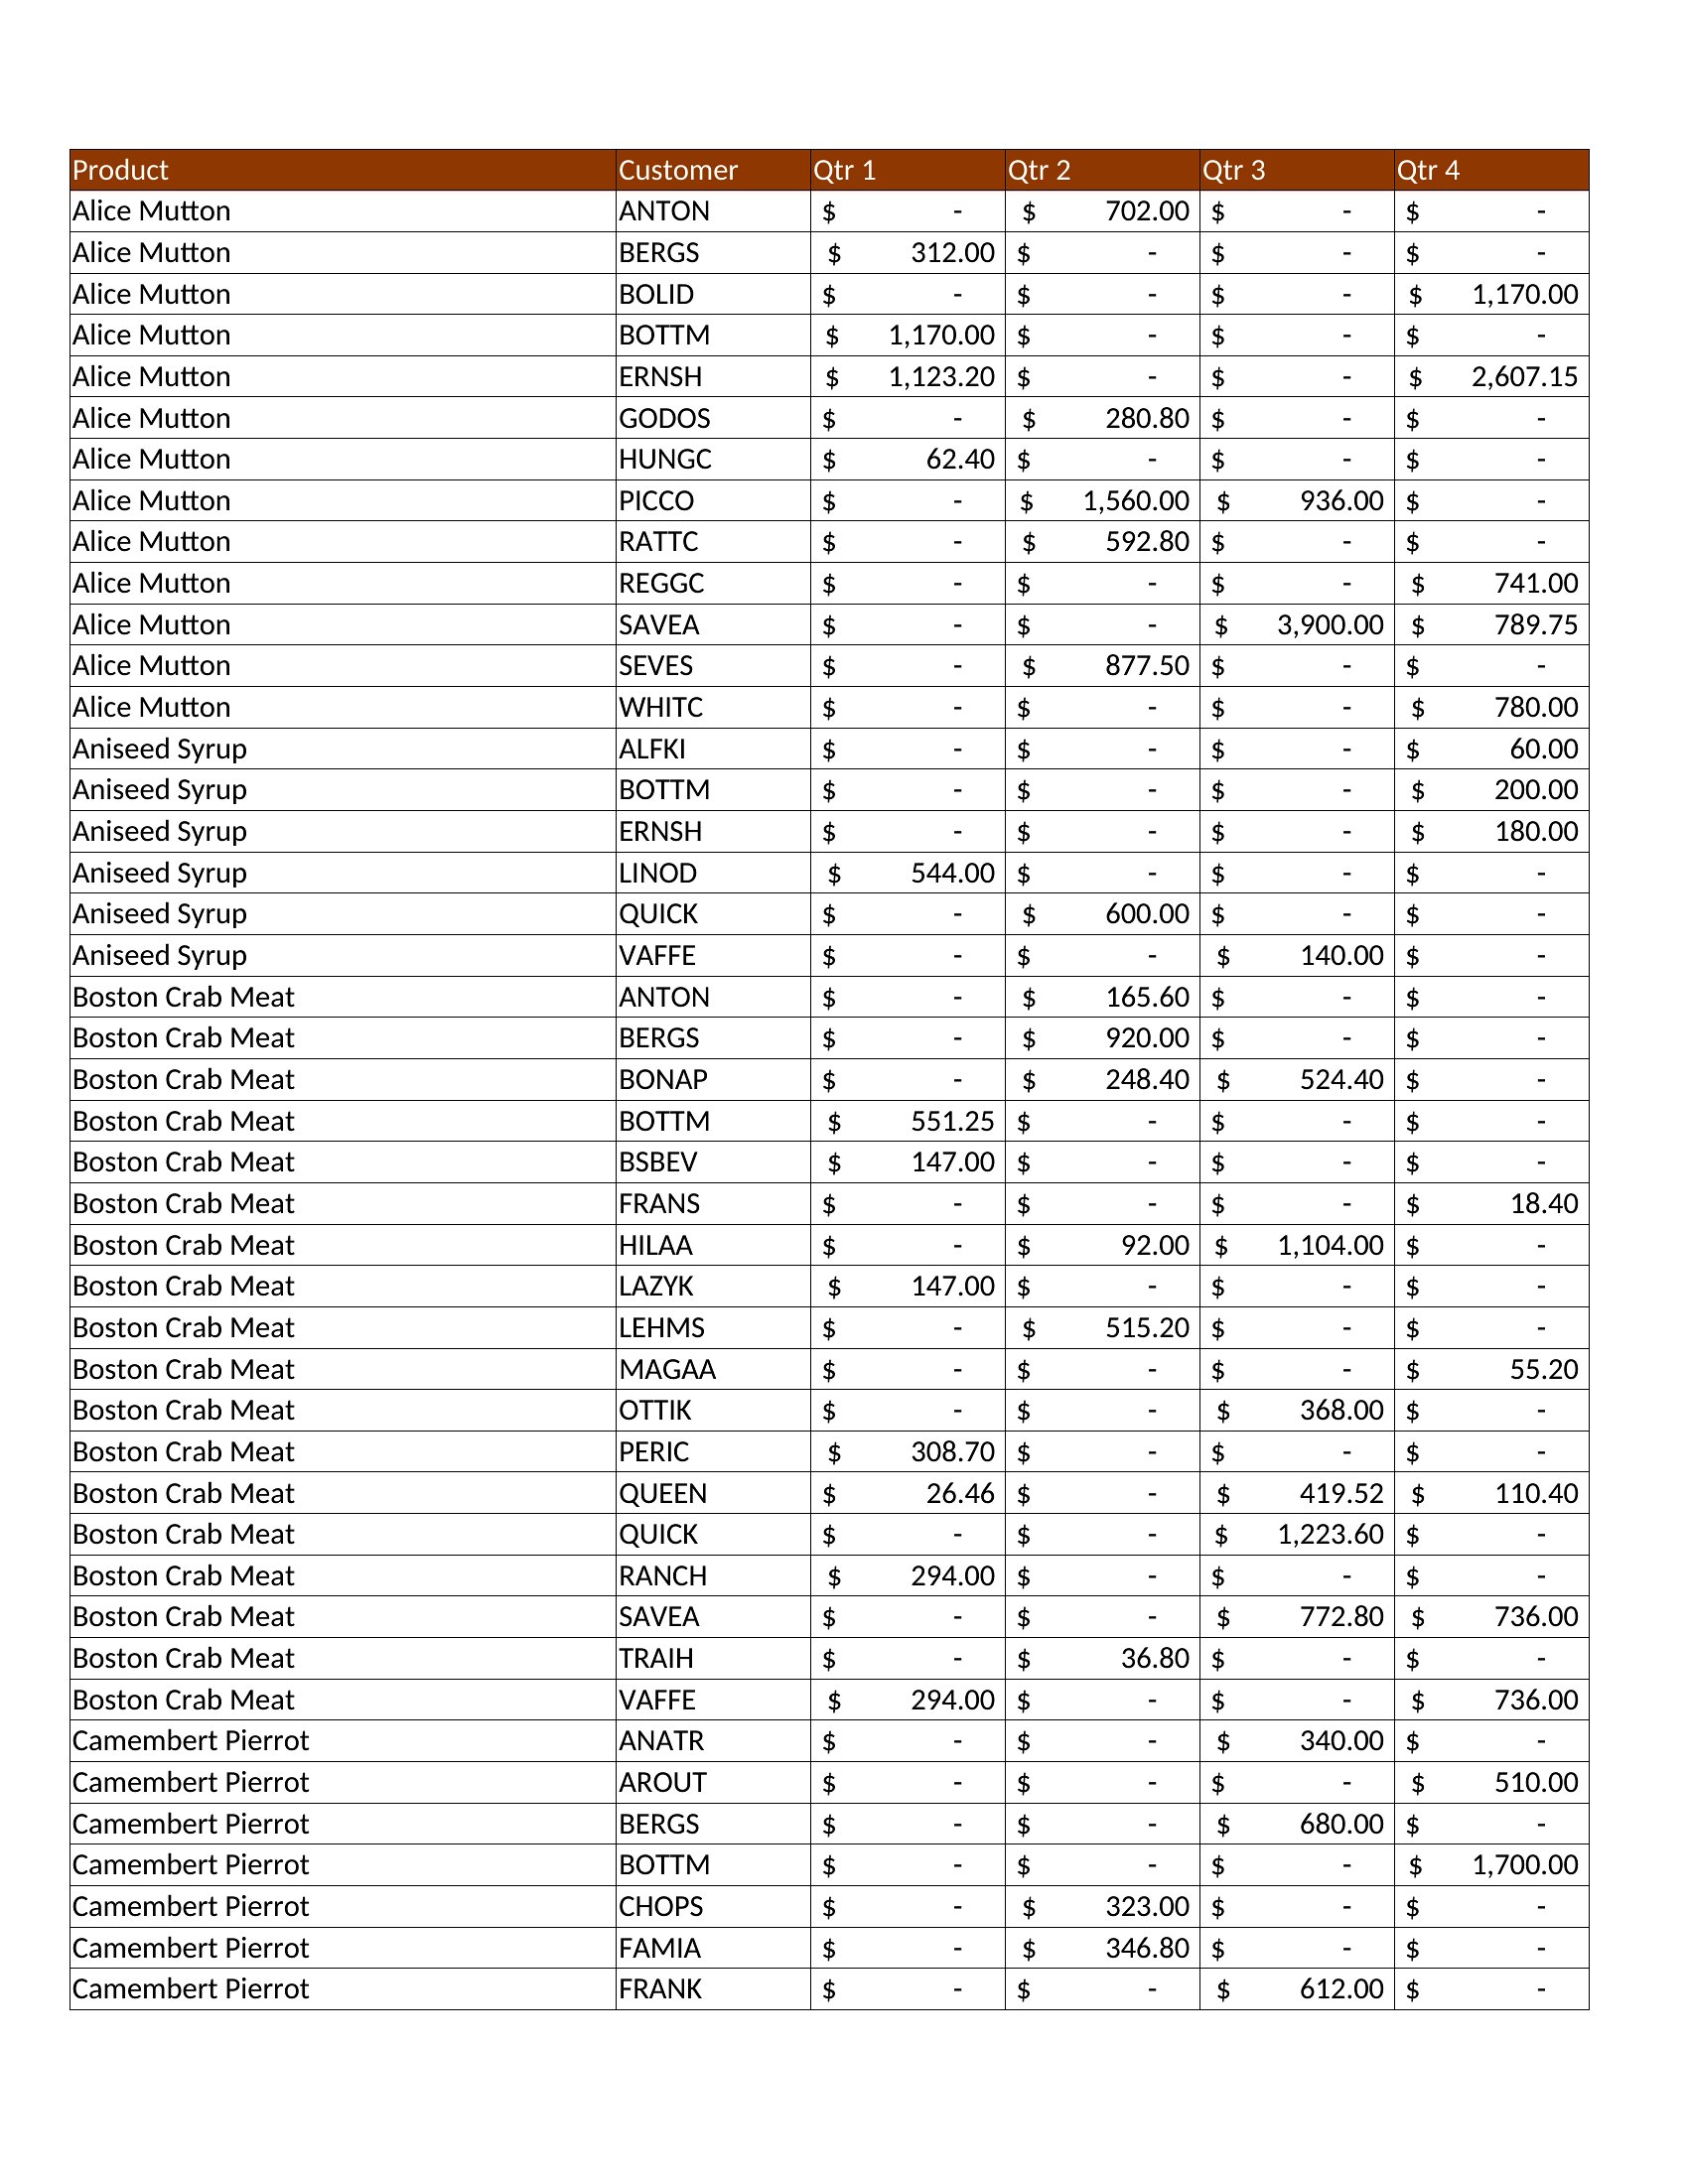
The Excel versions total figures and build simple charts as you enter data, the Word files suit a written summary, and the PDFs print for a handout. Drop in your numbers, add a line on what drove them, and share a report that's easy to act on. Download the format that fits your team and put your latest results on paper.

When to use this Sales Report template

  • A small business owner tracking quarterly sales trends to adjust inventory and marketing budgets before the holiday rush.
  • Regional sales managers comparing team performance against district targets to identify coaching opportunities or celebrate wins before Monday’s leadership review.
  • E-commerce store owners analyzing weekly sales spikes to replicate successful promotions or pivot underperforming product categories.
  • Sales reps summarizing their monthly pipeline for clients to demonstrate progress and secure approval for next quarter’s deals.

Which format should I download?

WordExcelPDF

Choose Word for a flexible, editable report that lets you tweak sections like executive summaries or client notes after drafting initial figures. Excel is ideal if your data includes complex calculations, trend charts, or automated comparisons to goals—use the built-in formulas to save time. Opt for PDF when sharing finalized reports with stakeholders who need a static, print-ready version with consistent formatting. Avoid PDFs for recurring edits; Word or Excel templates are more practical for updates.
Choose from 47 Sales Report Templates
How to use this Sales Report template

How can I make sure my sales report highlights key insights without overwhelming readers?

Start with a one-line summary at the top (e.g., ‘Revenue up 12% YoY, driven by Product X’), then use bullet points for top 3 takeaways. The Excel templates include chart placeholders to visualize trends—pair these with annotations like ‘Notice the dip in Q2’ to guide attention. Keep tables clean: group similar metrics (e.g., all regional sales) and leave space for handwritten notes if reviewing in meetings.
What details should I include if my team sells both products and services?

Break out revenue by category in a separate table, but tie them to shared metrics like customer acquisition cost or average deal size. Use the Word templates’ section dividers to separate product margins from service hours billed. For Excel, consider a pivot table to compare contribution margins side by side. Note if any services require follow-up work (e.g., ‘30% of service revenue pending Phase 2 approval’).

Can these templates help explain sales drops to skeptical leadership?
Yes—the Excel templates include trend lines and ‘% change’ columns to frame declines as part of a larger pattern (e.g., ‘Q1 dip aligns with industry benchmark of -8%’). Add a ‘Root Cause’ section in Word or a highlighted comment in Excel to address external factors like supply chain delays or internal issues like onboarding delays. Use the ‘Notes’ field to outline proposed actions, like reallocating the marketing budget or retraining the team on a specific product line.
Comments

Join the conversation

Sign in to share your thoughts and leave a comment on this resource.

Newsletter

Get Weekly Design Updates

Join our community to receive curated resources and inspiration.

Weekly Tips Resources Early Access

We respect your privacy. Confirmation email required. Privacy Policy