Free Waterfall Chart Templates (Word, Excel)
DiagramsTemplates
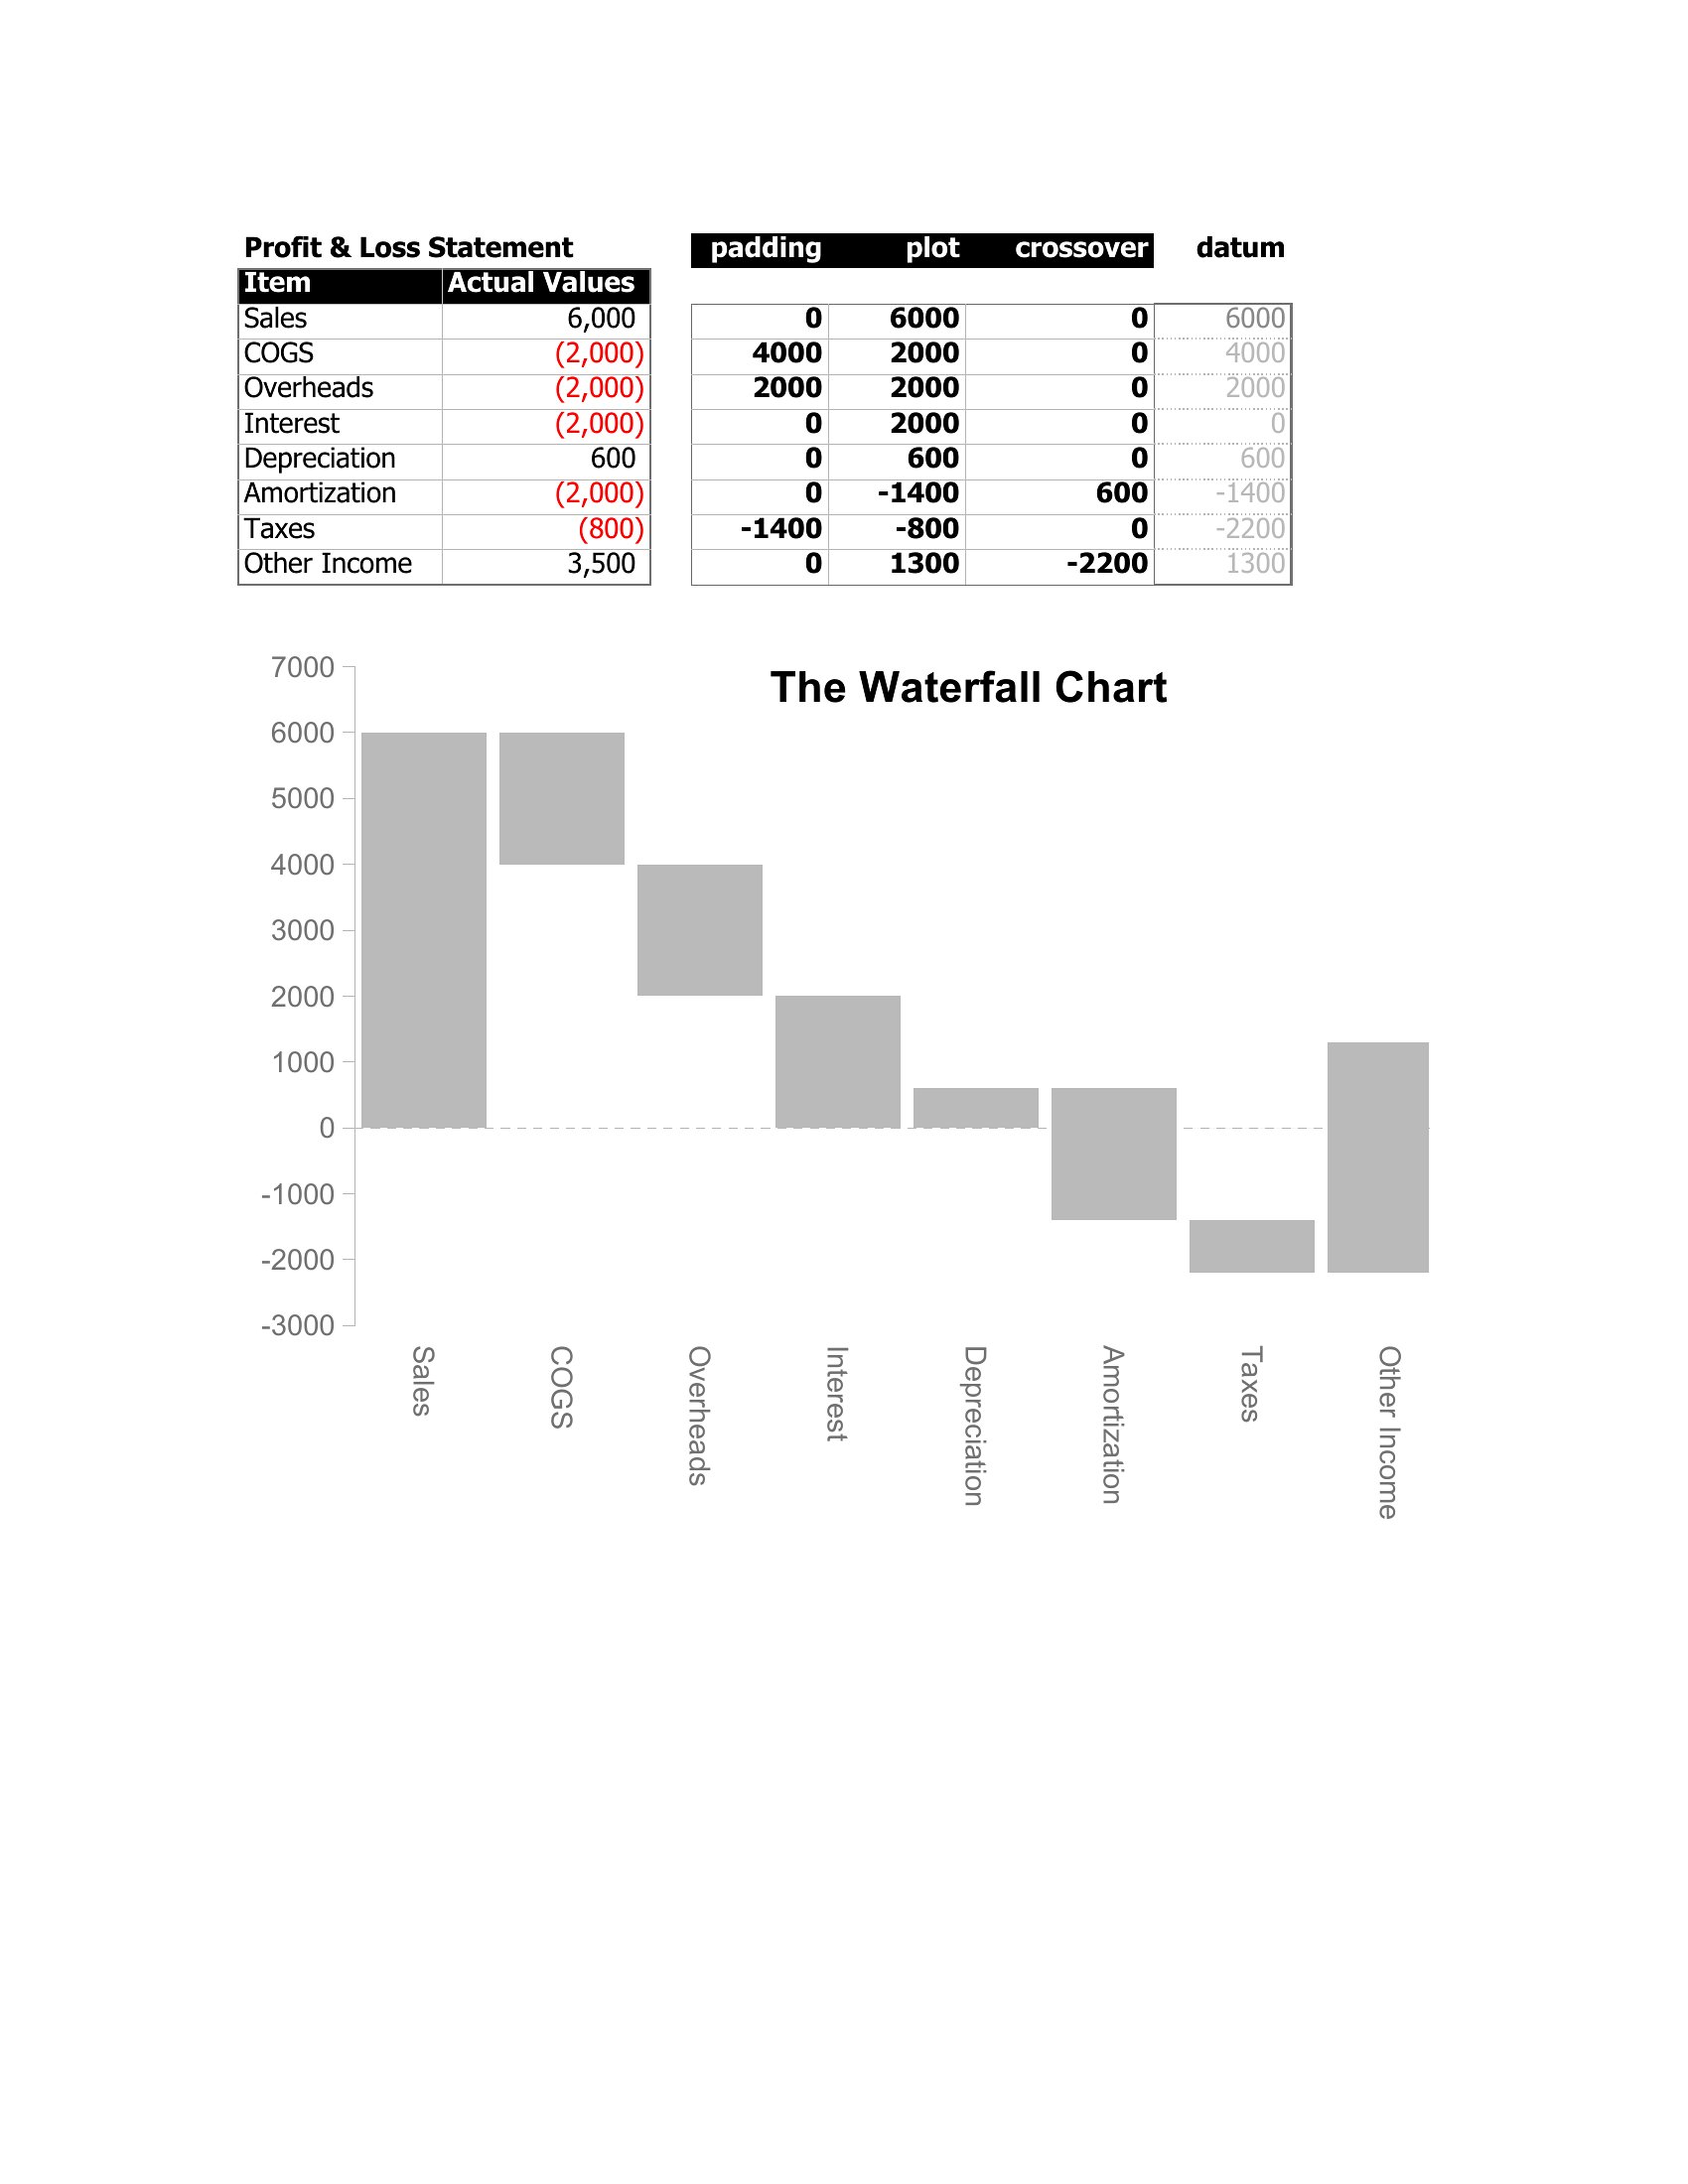
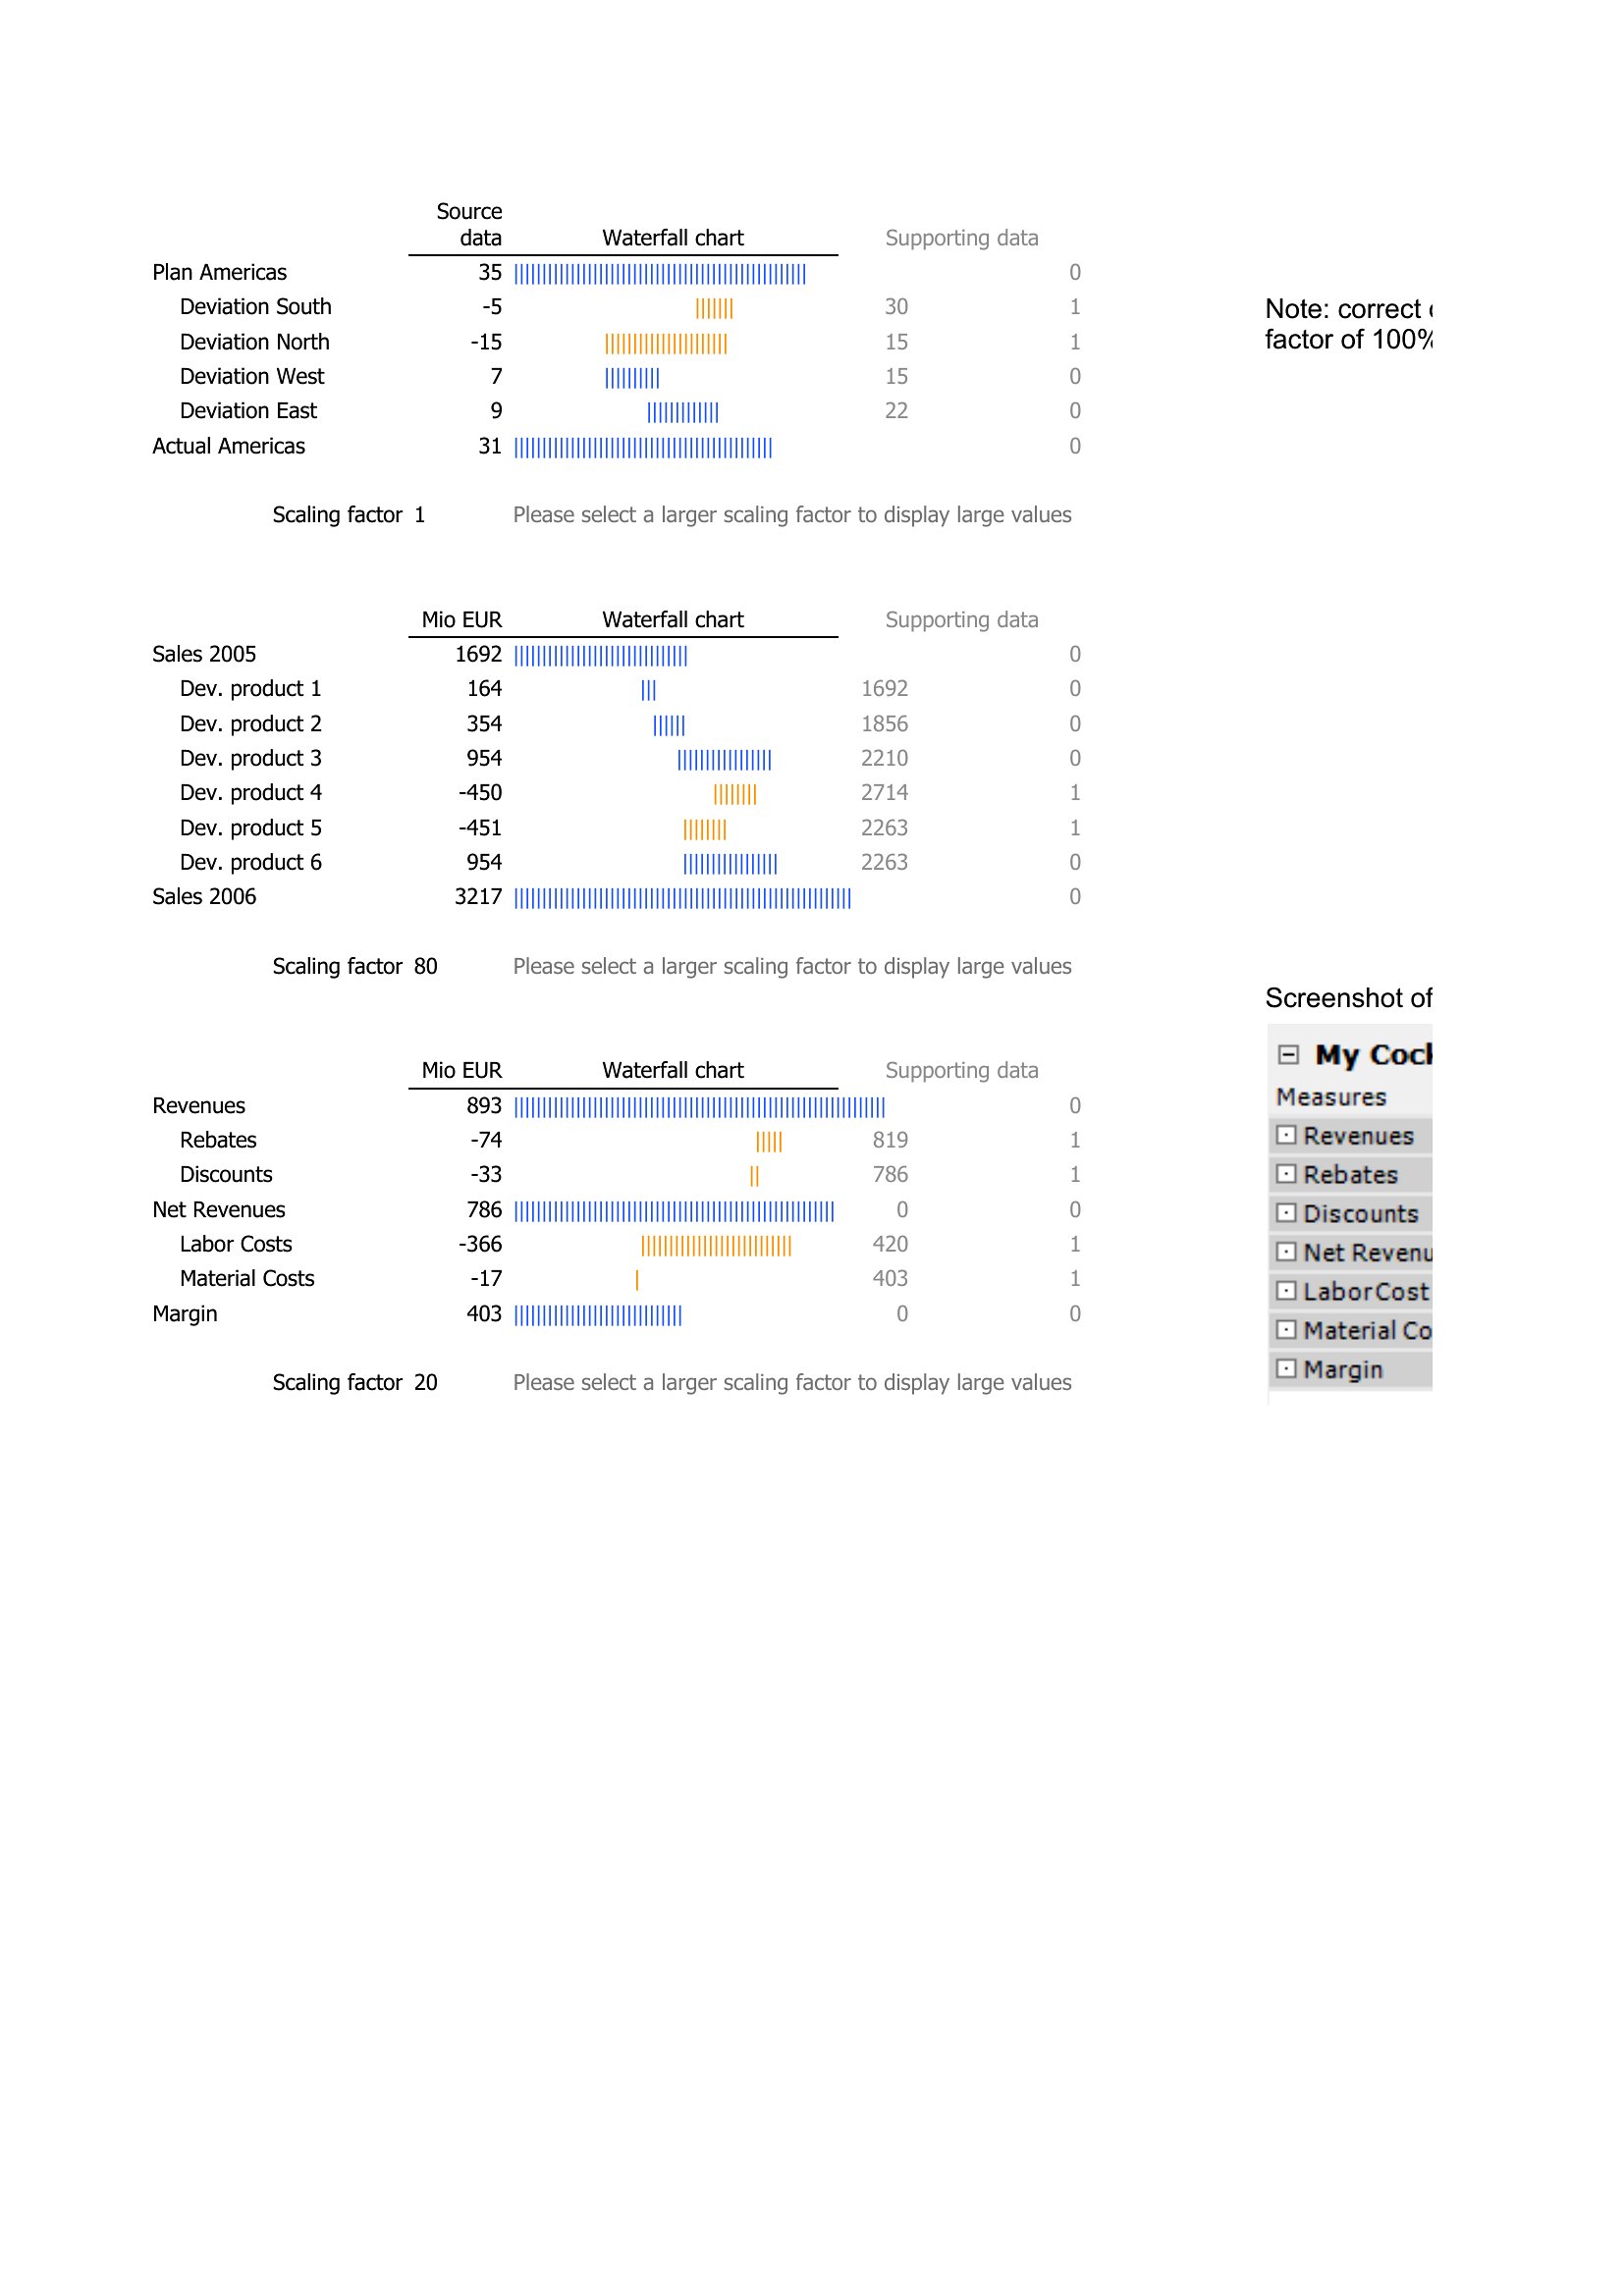
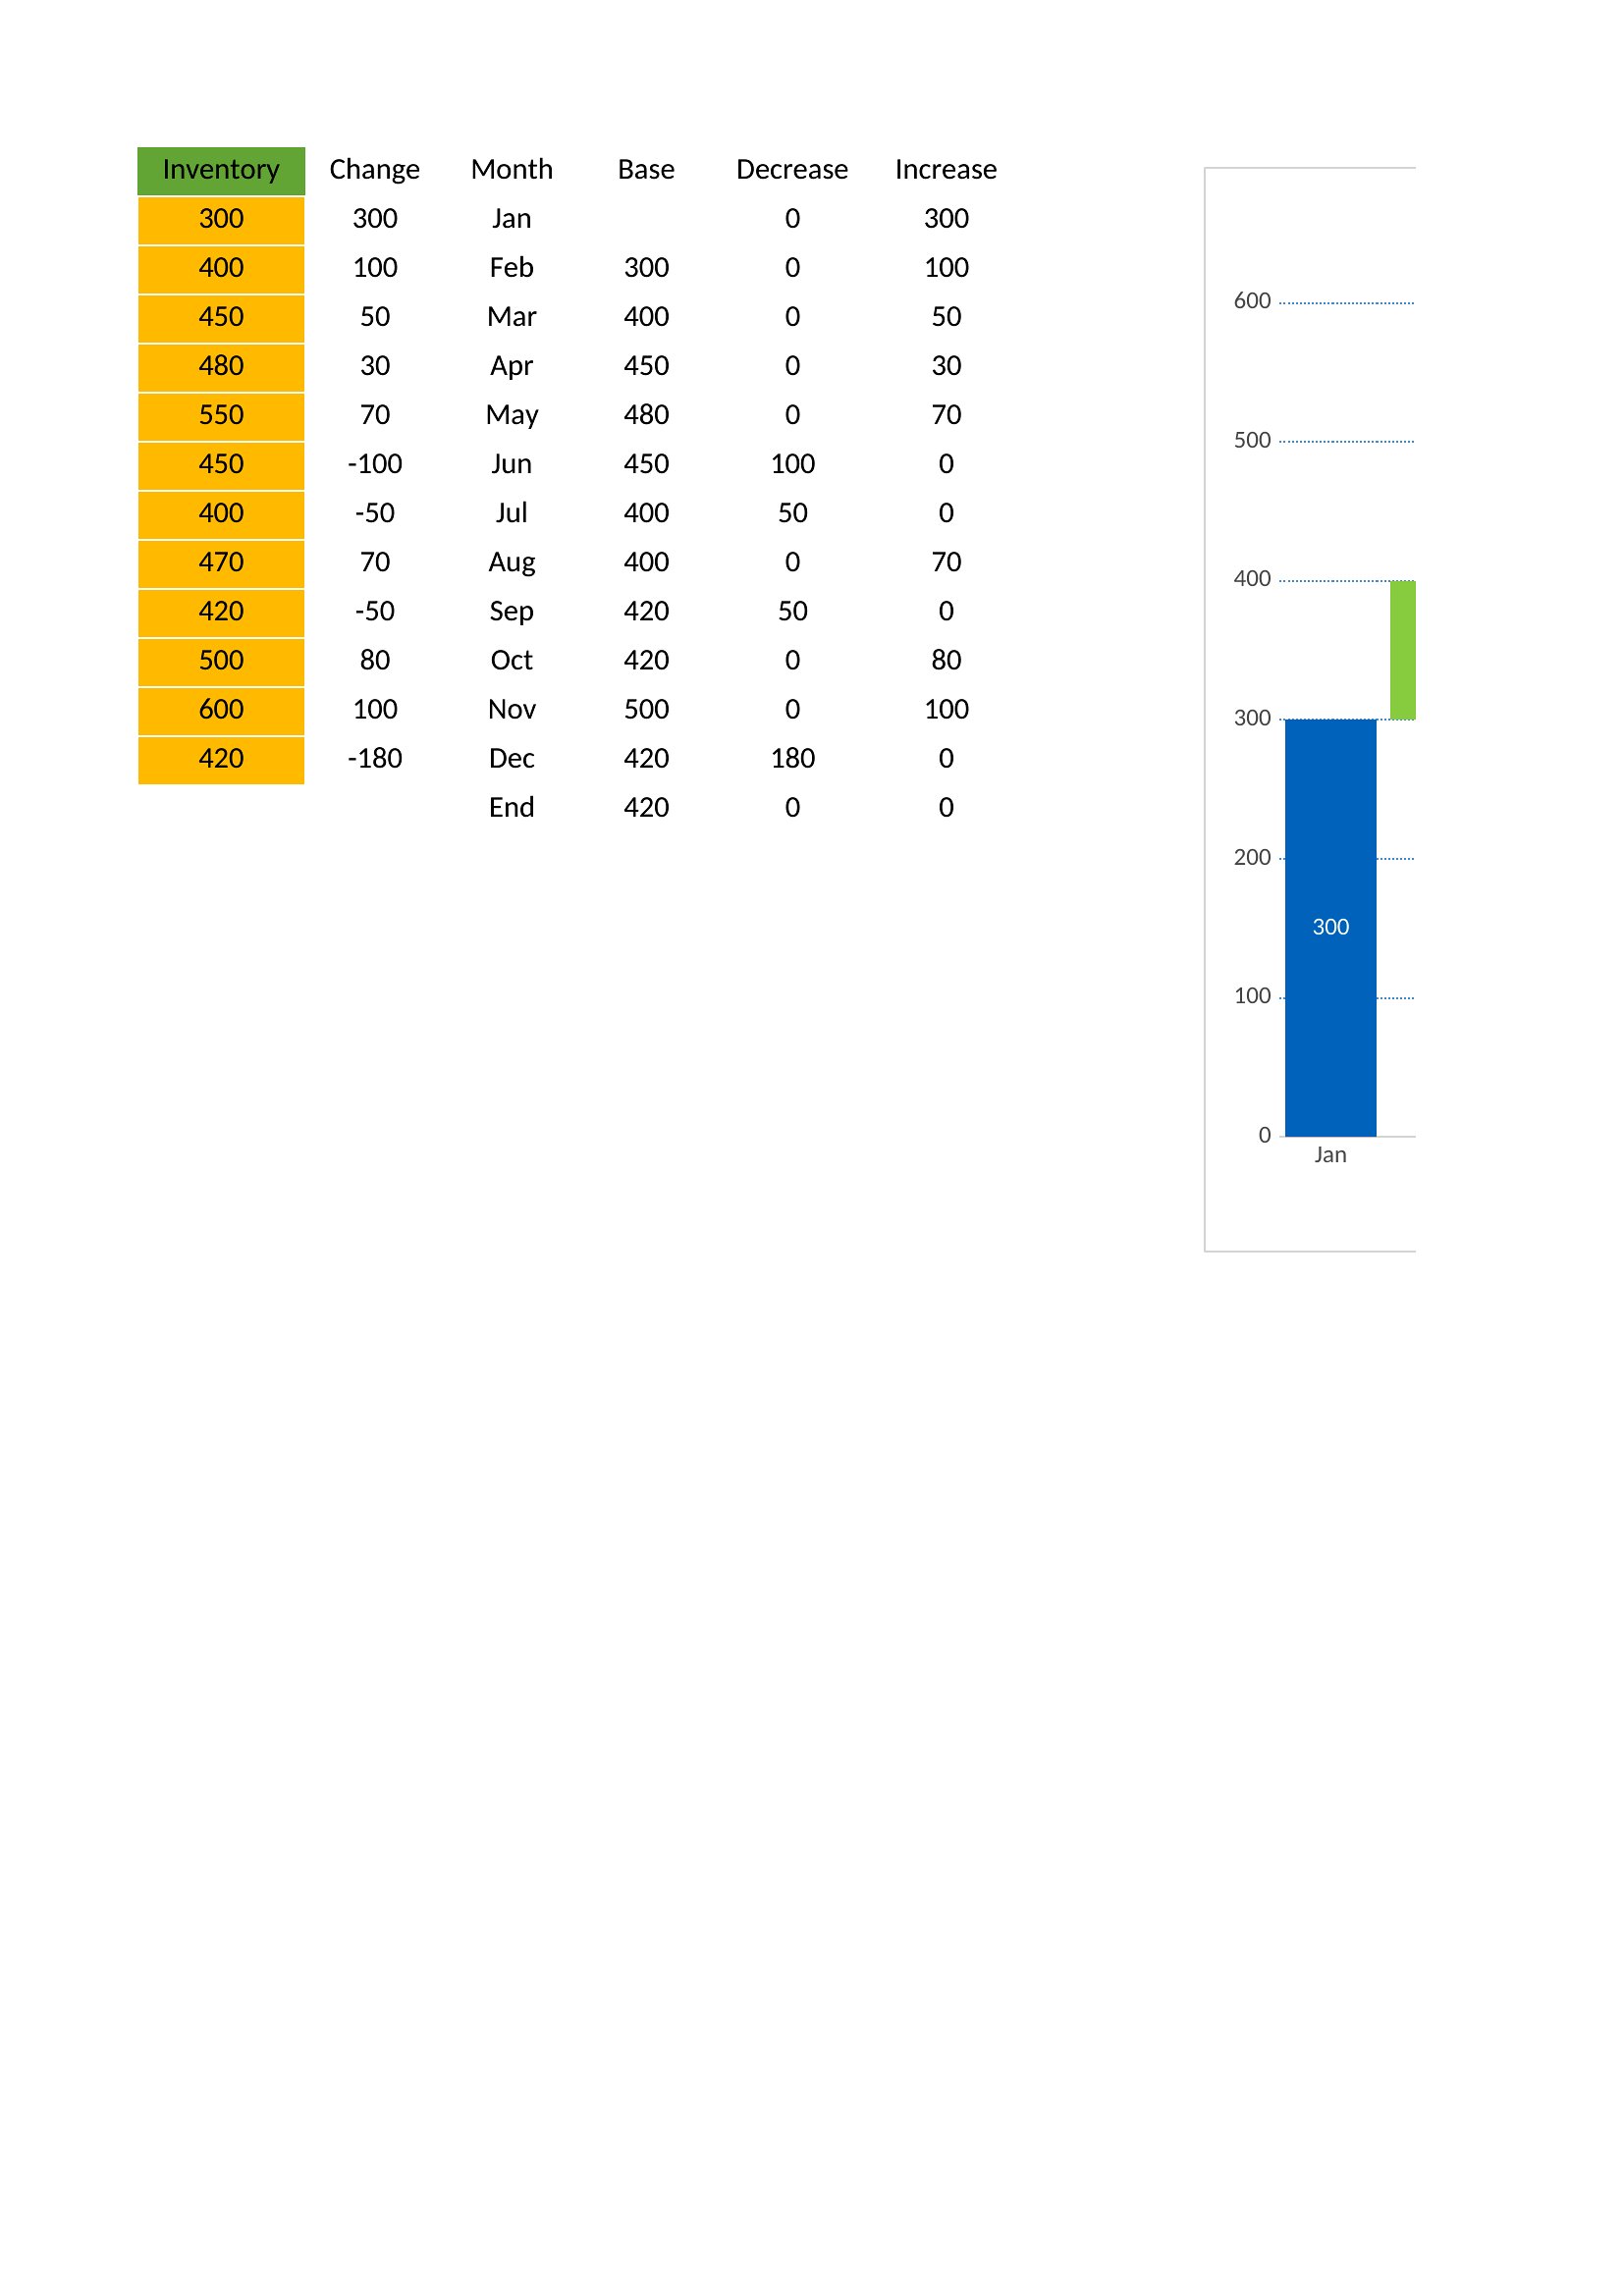
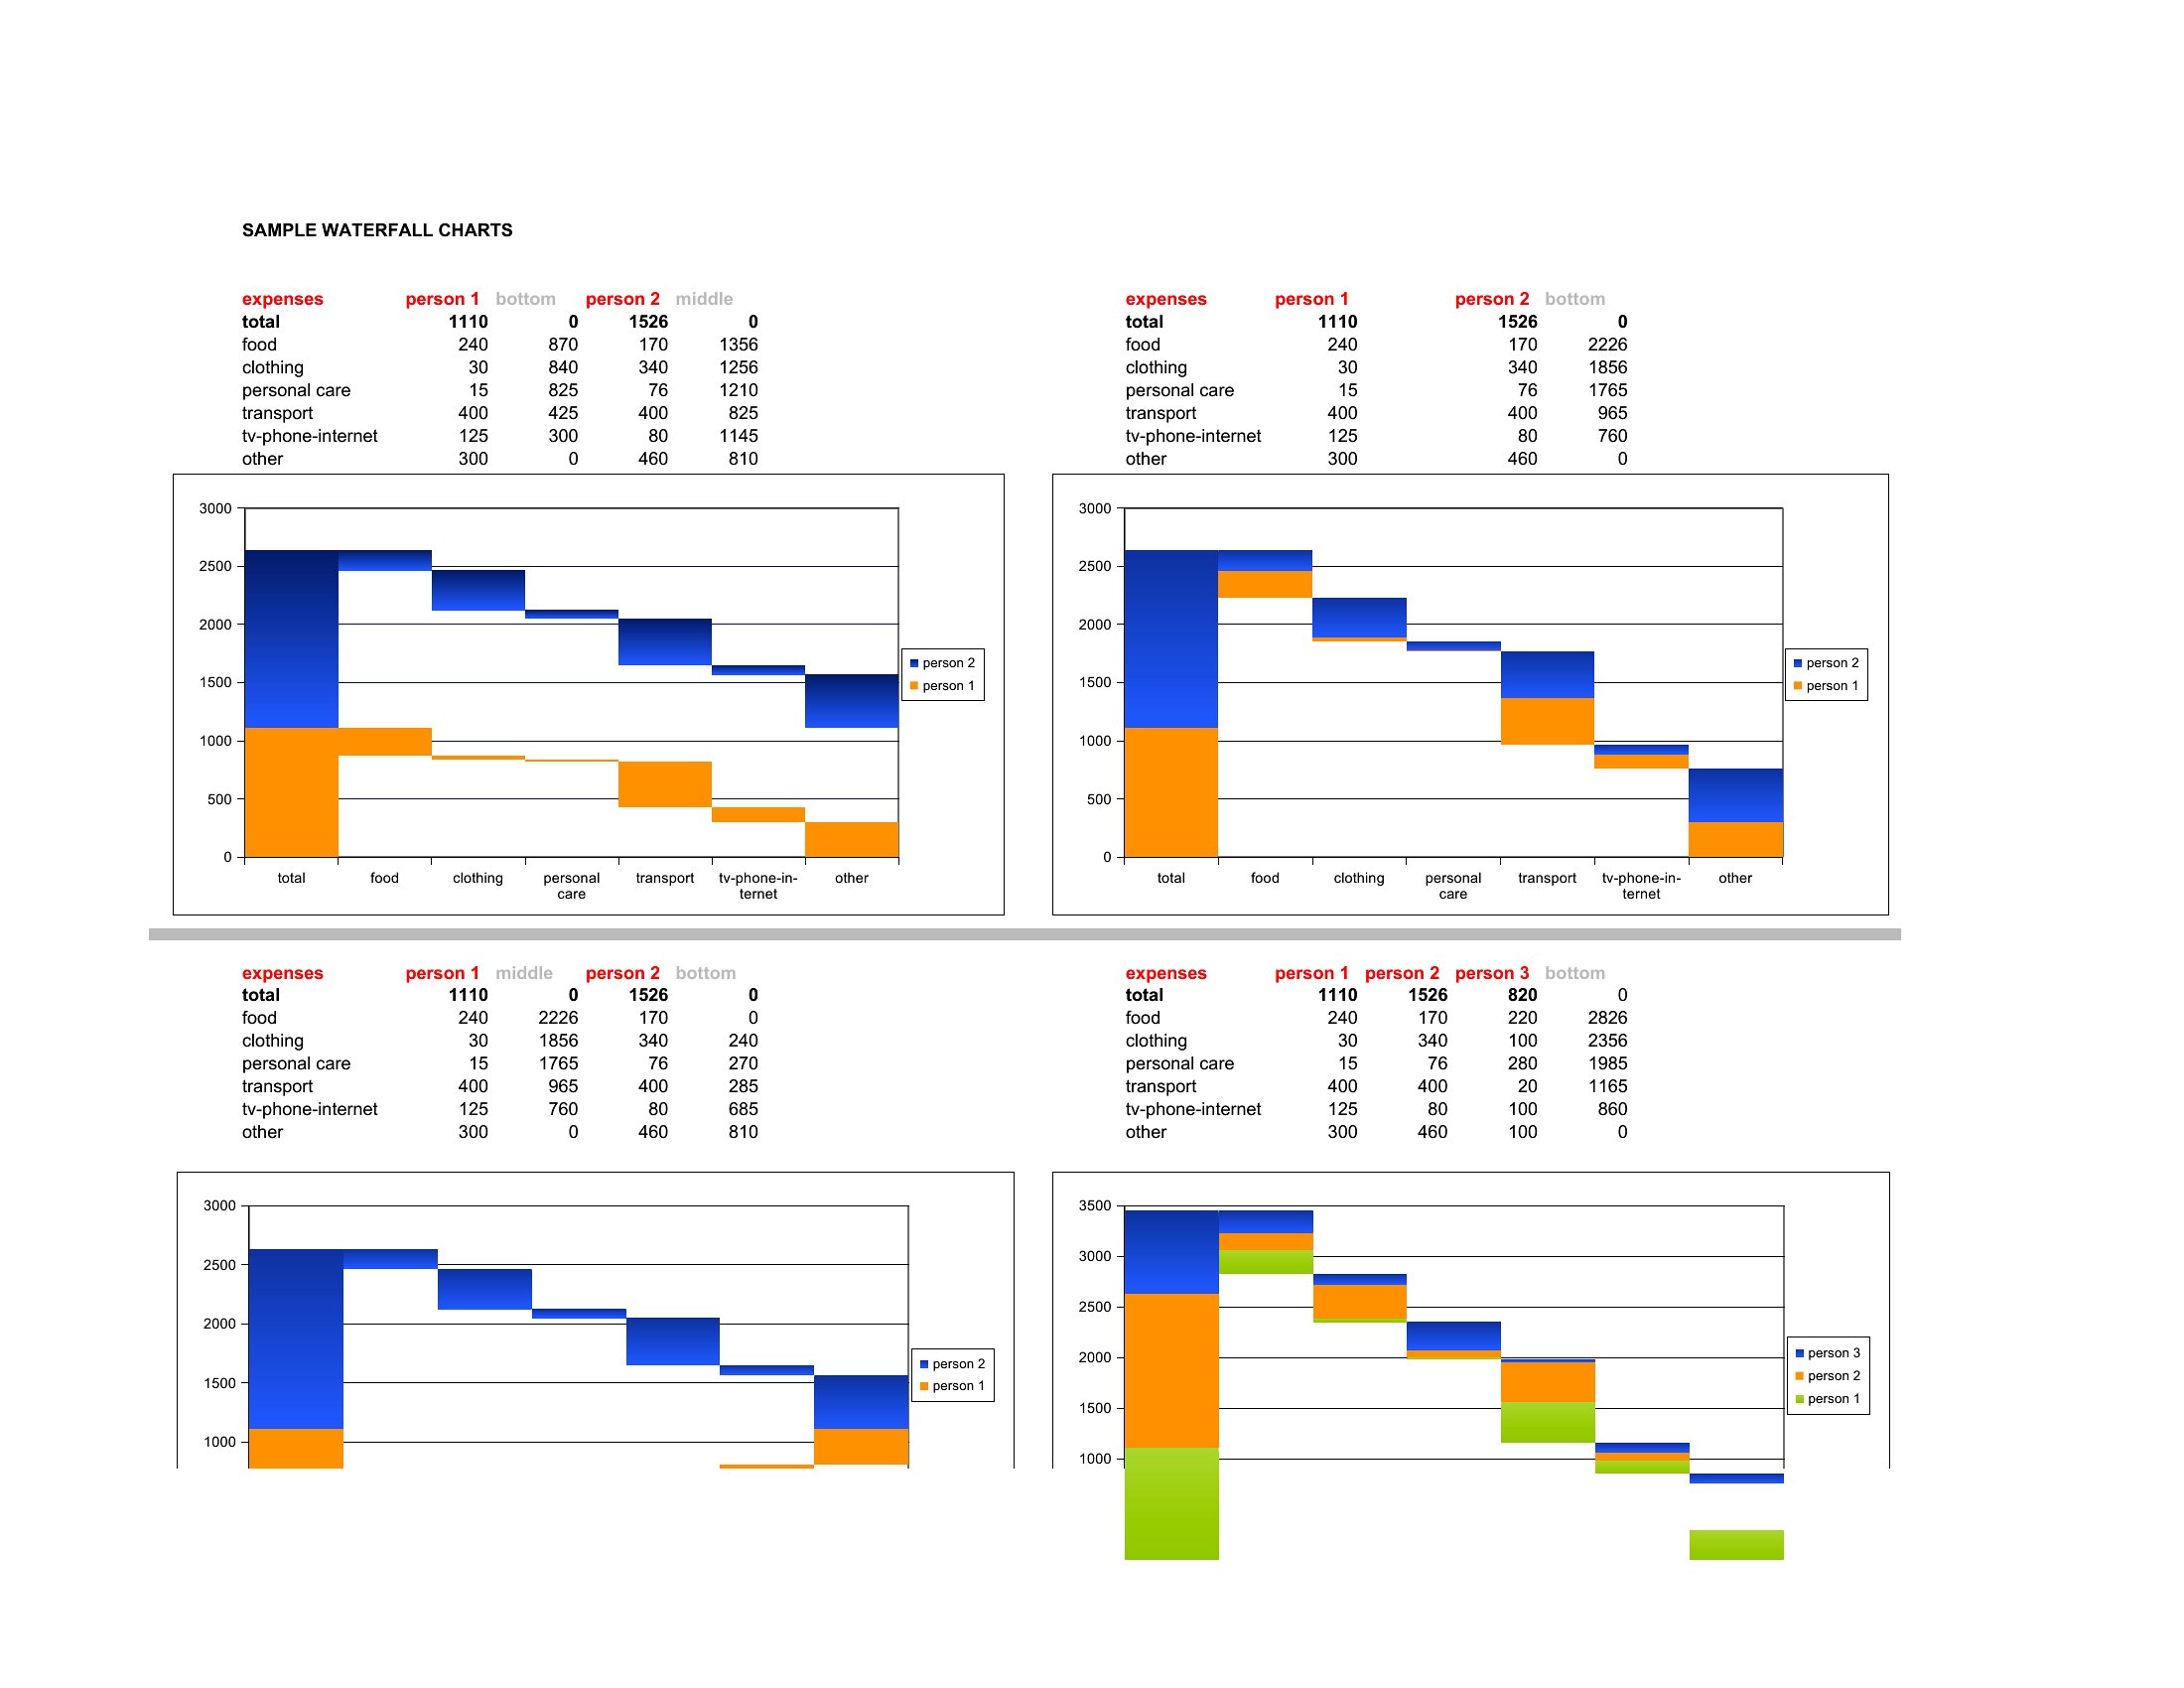

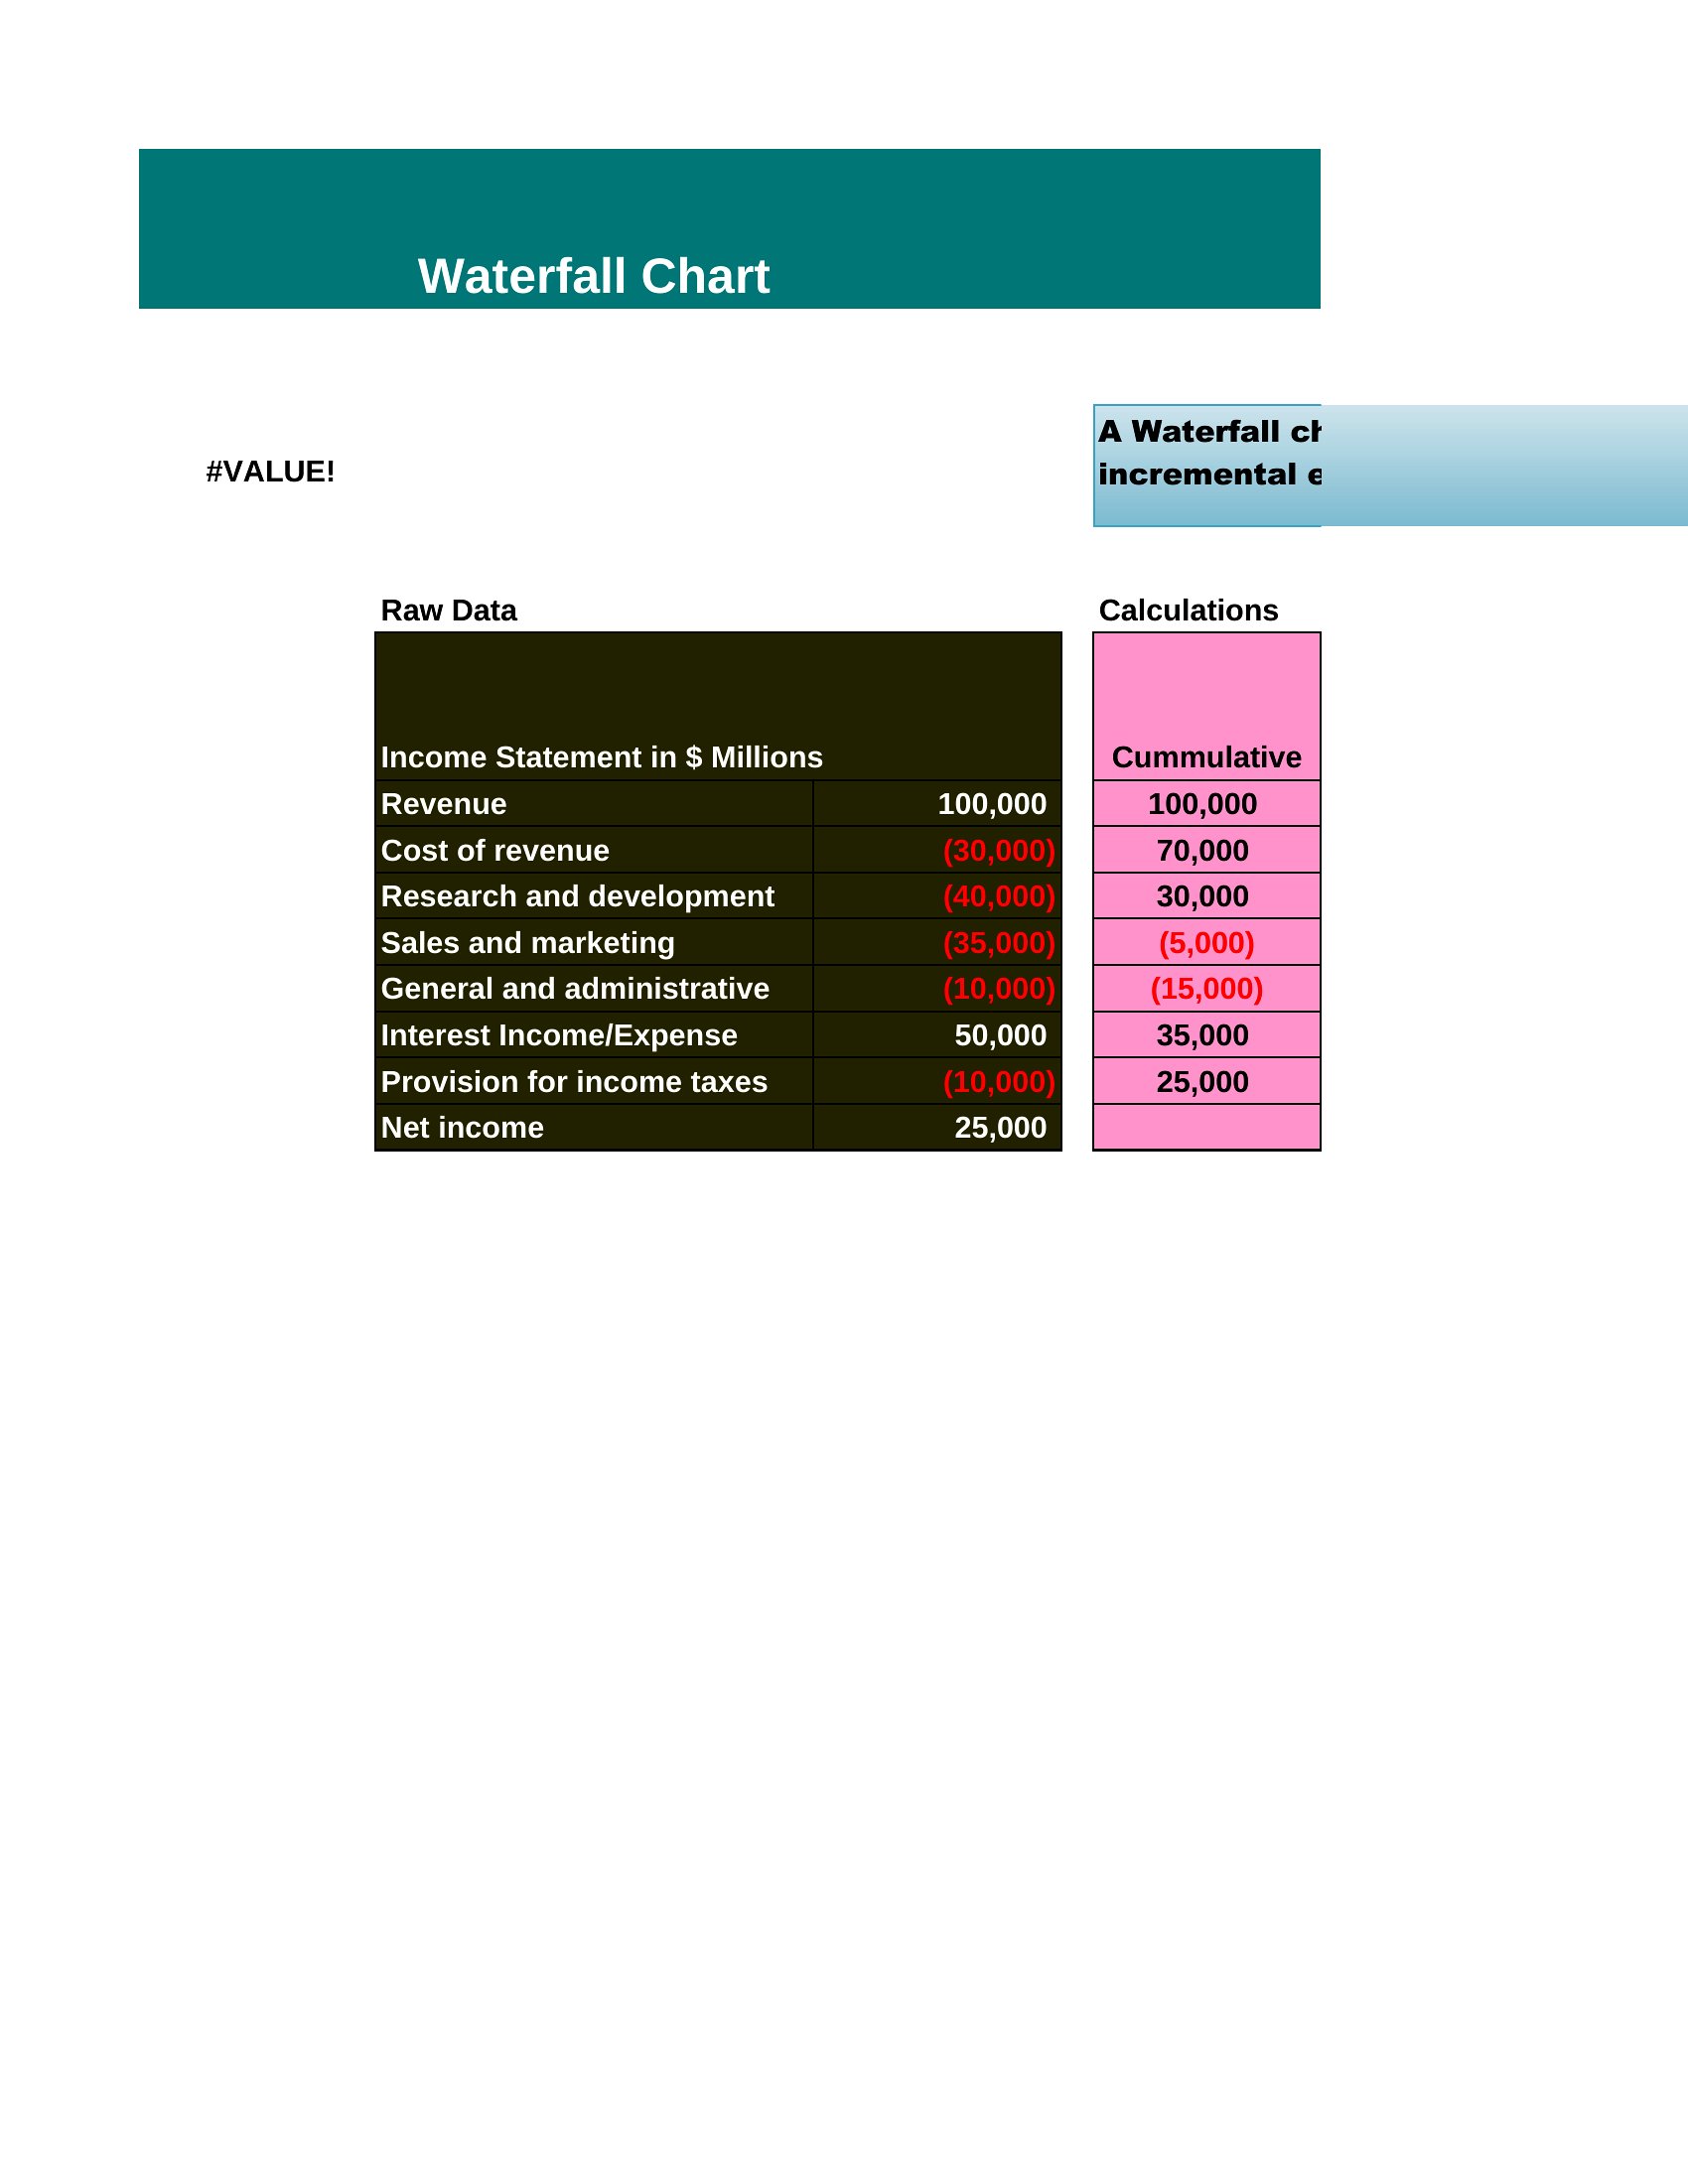
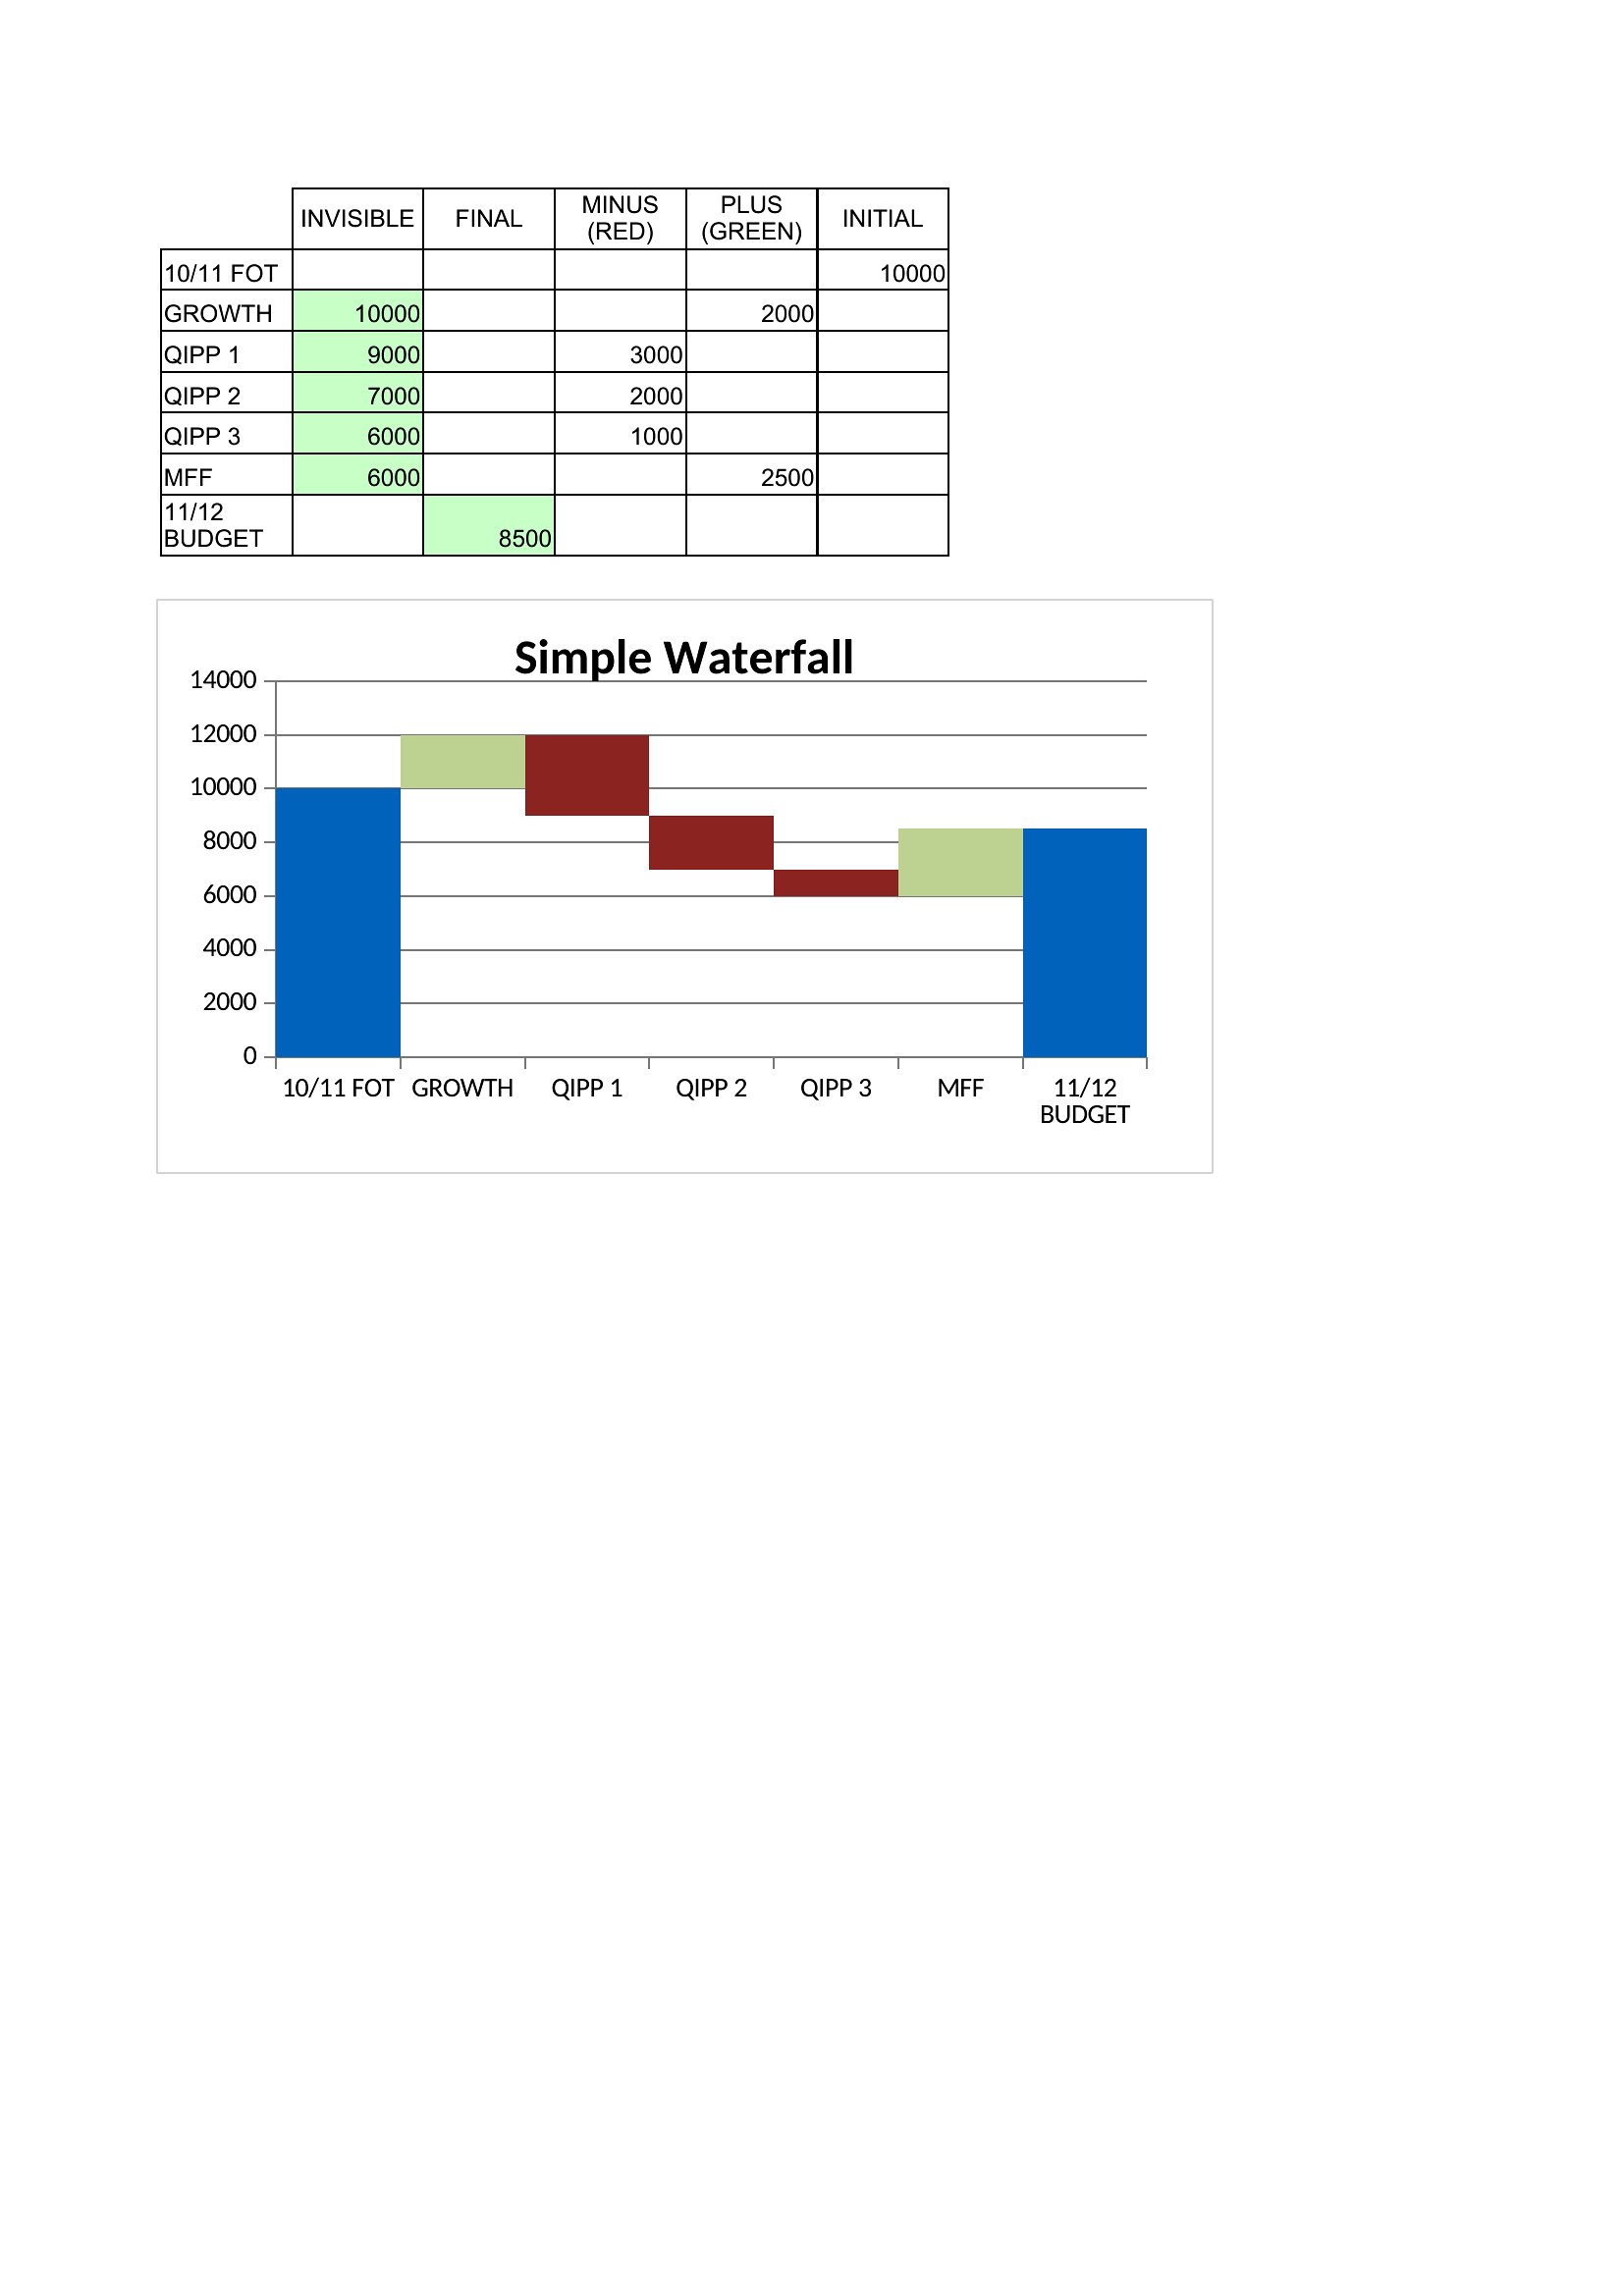

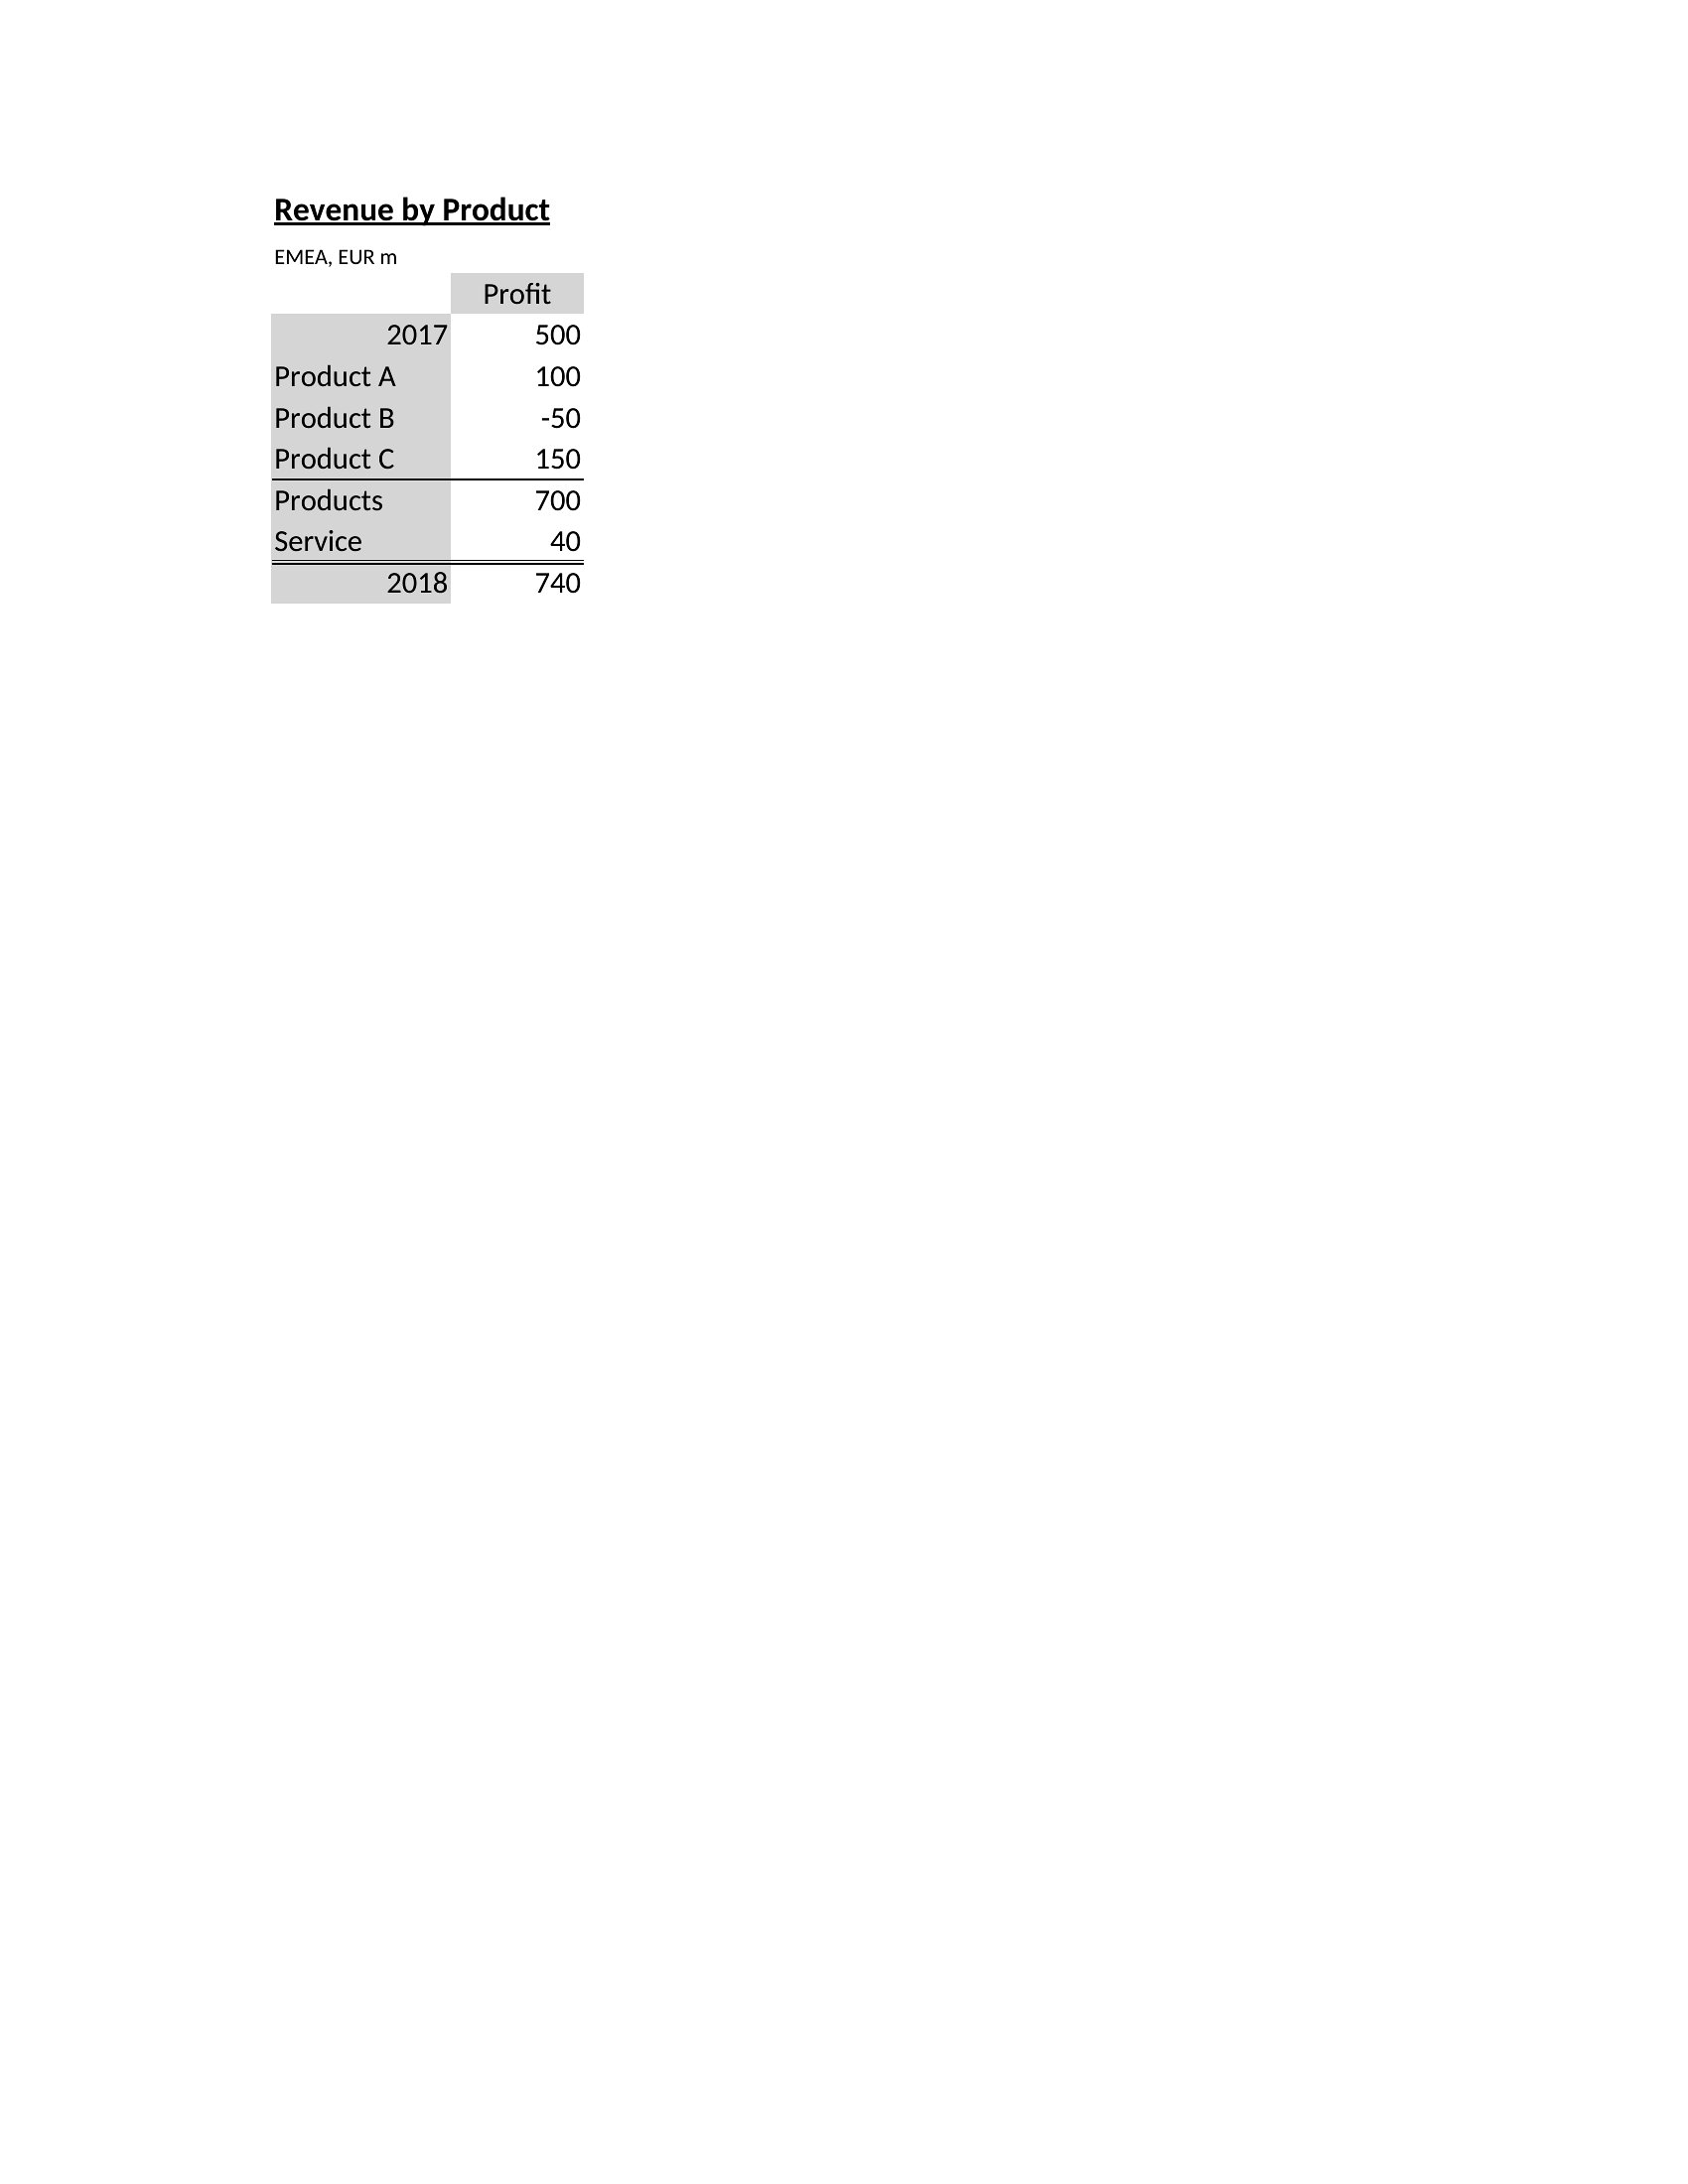
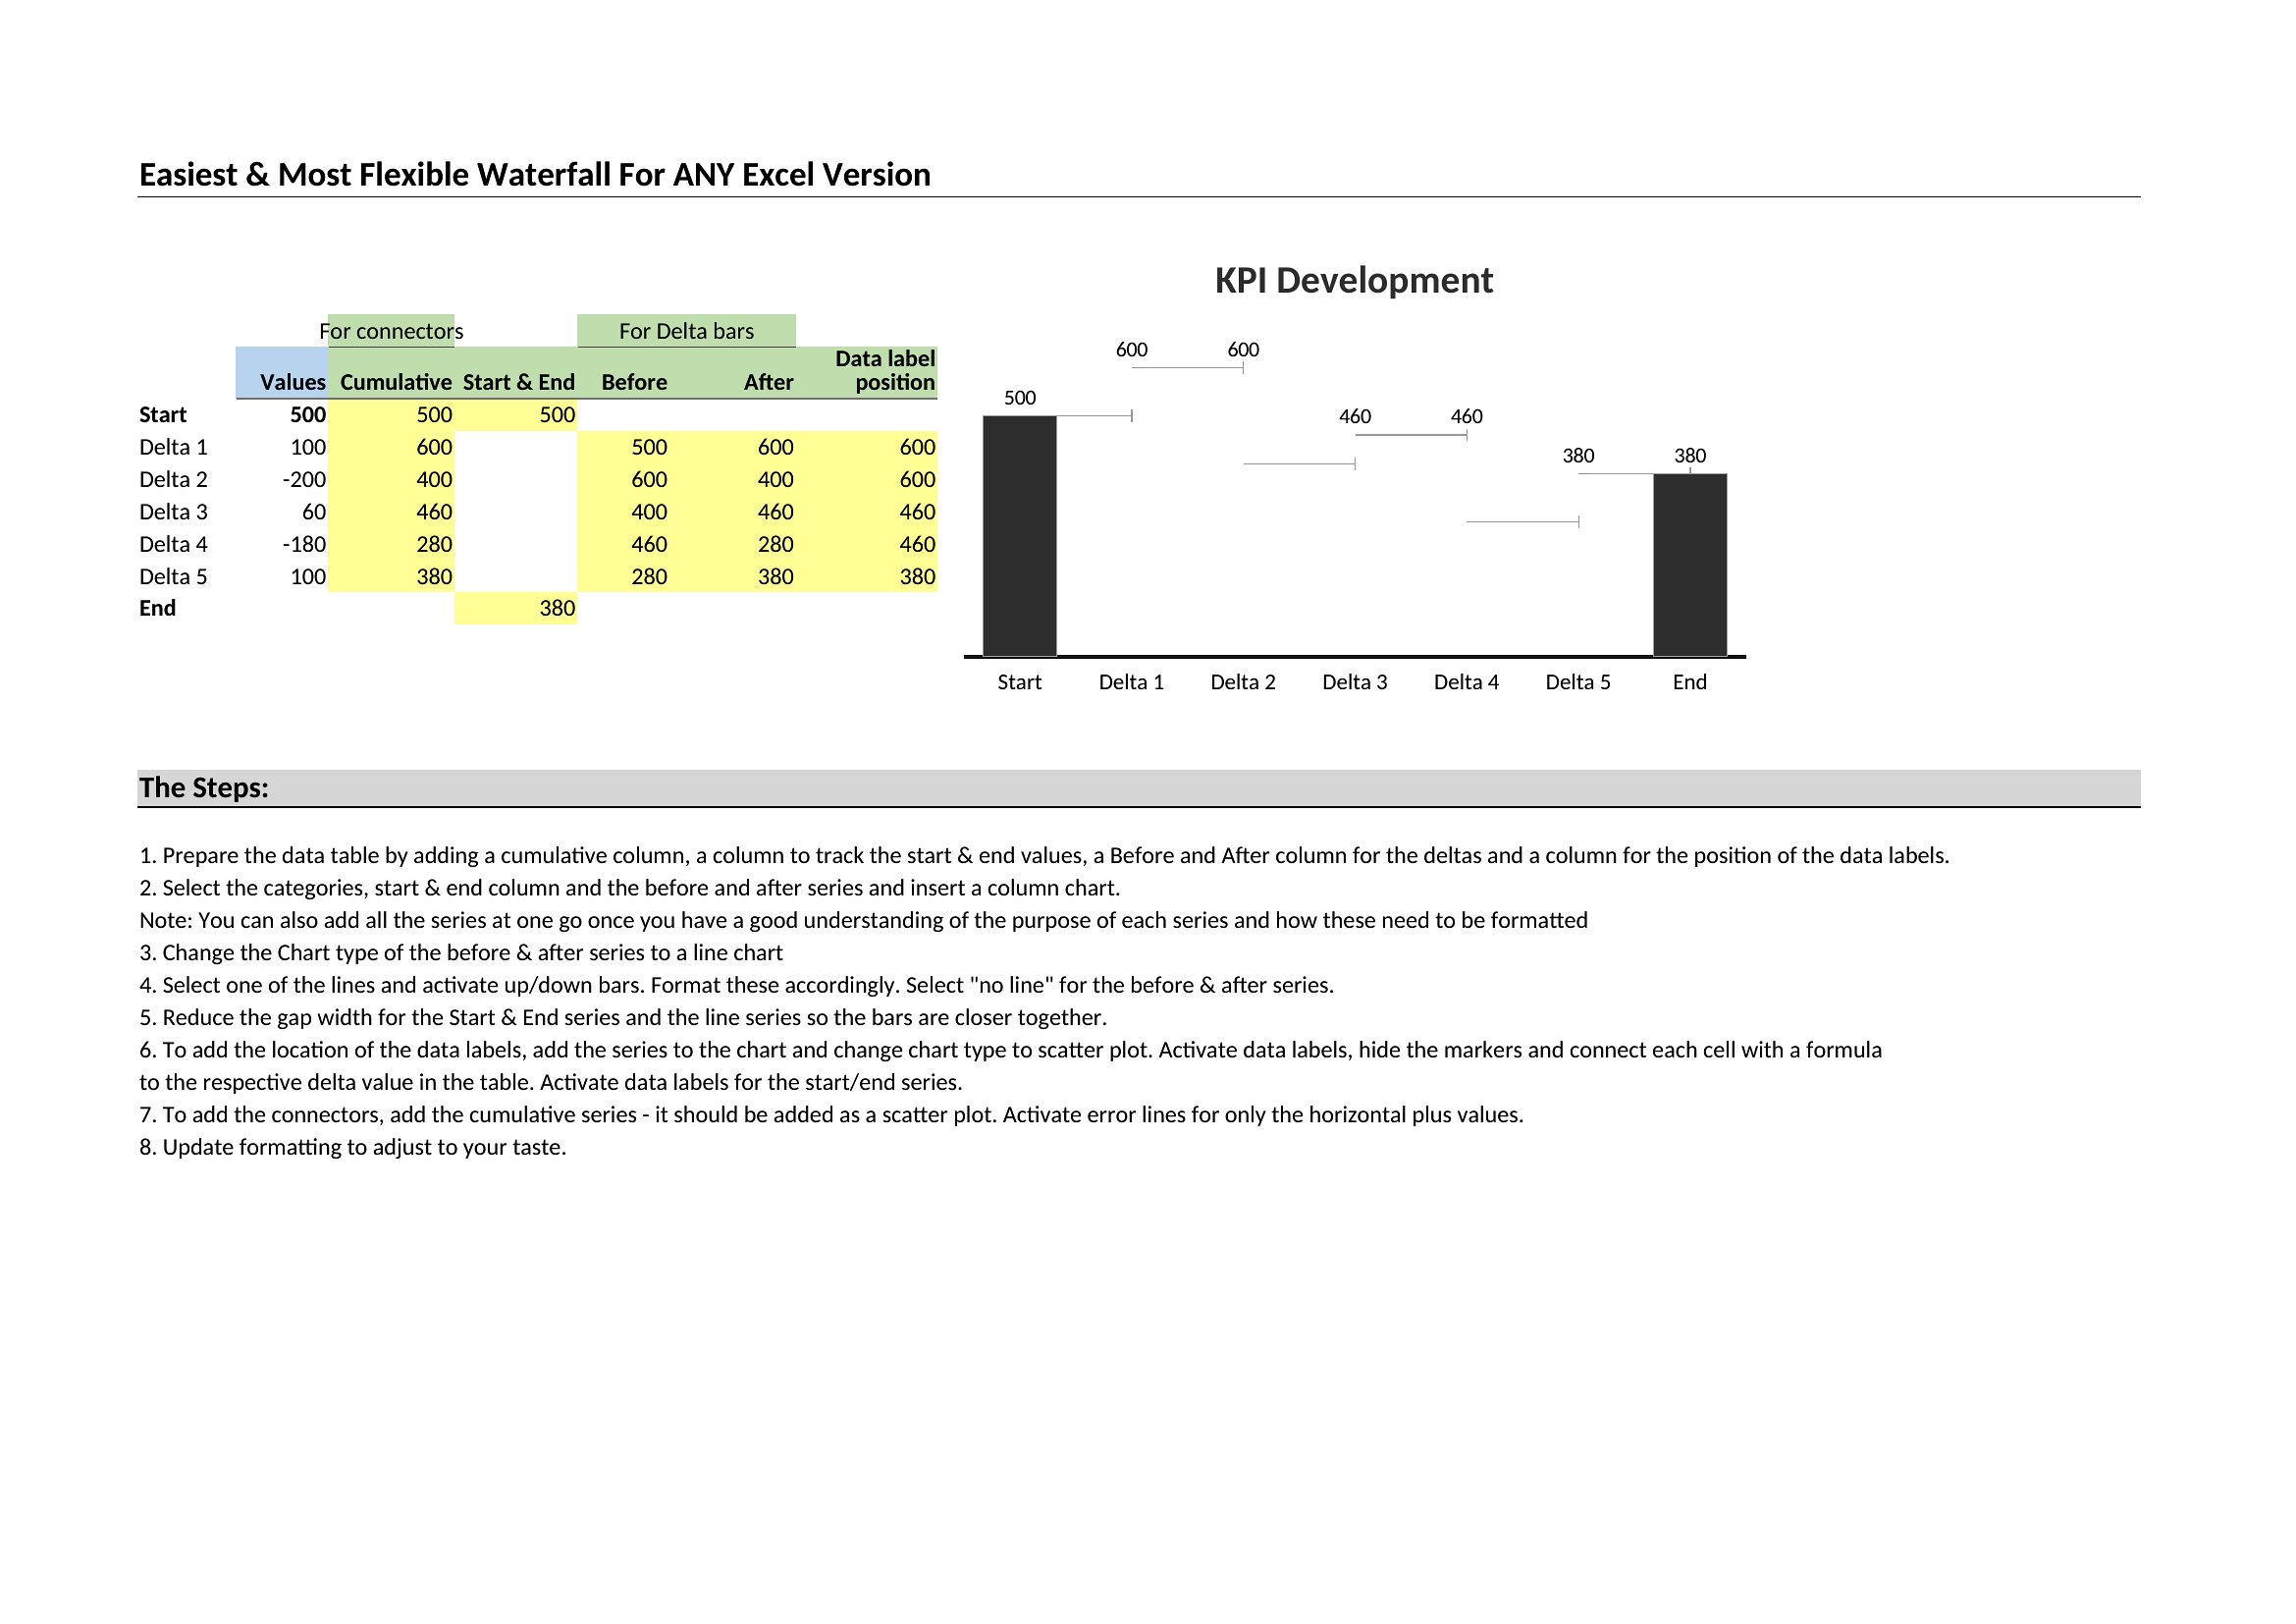
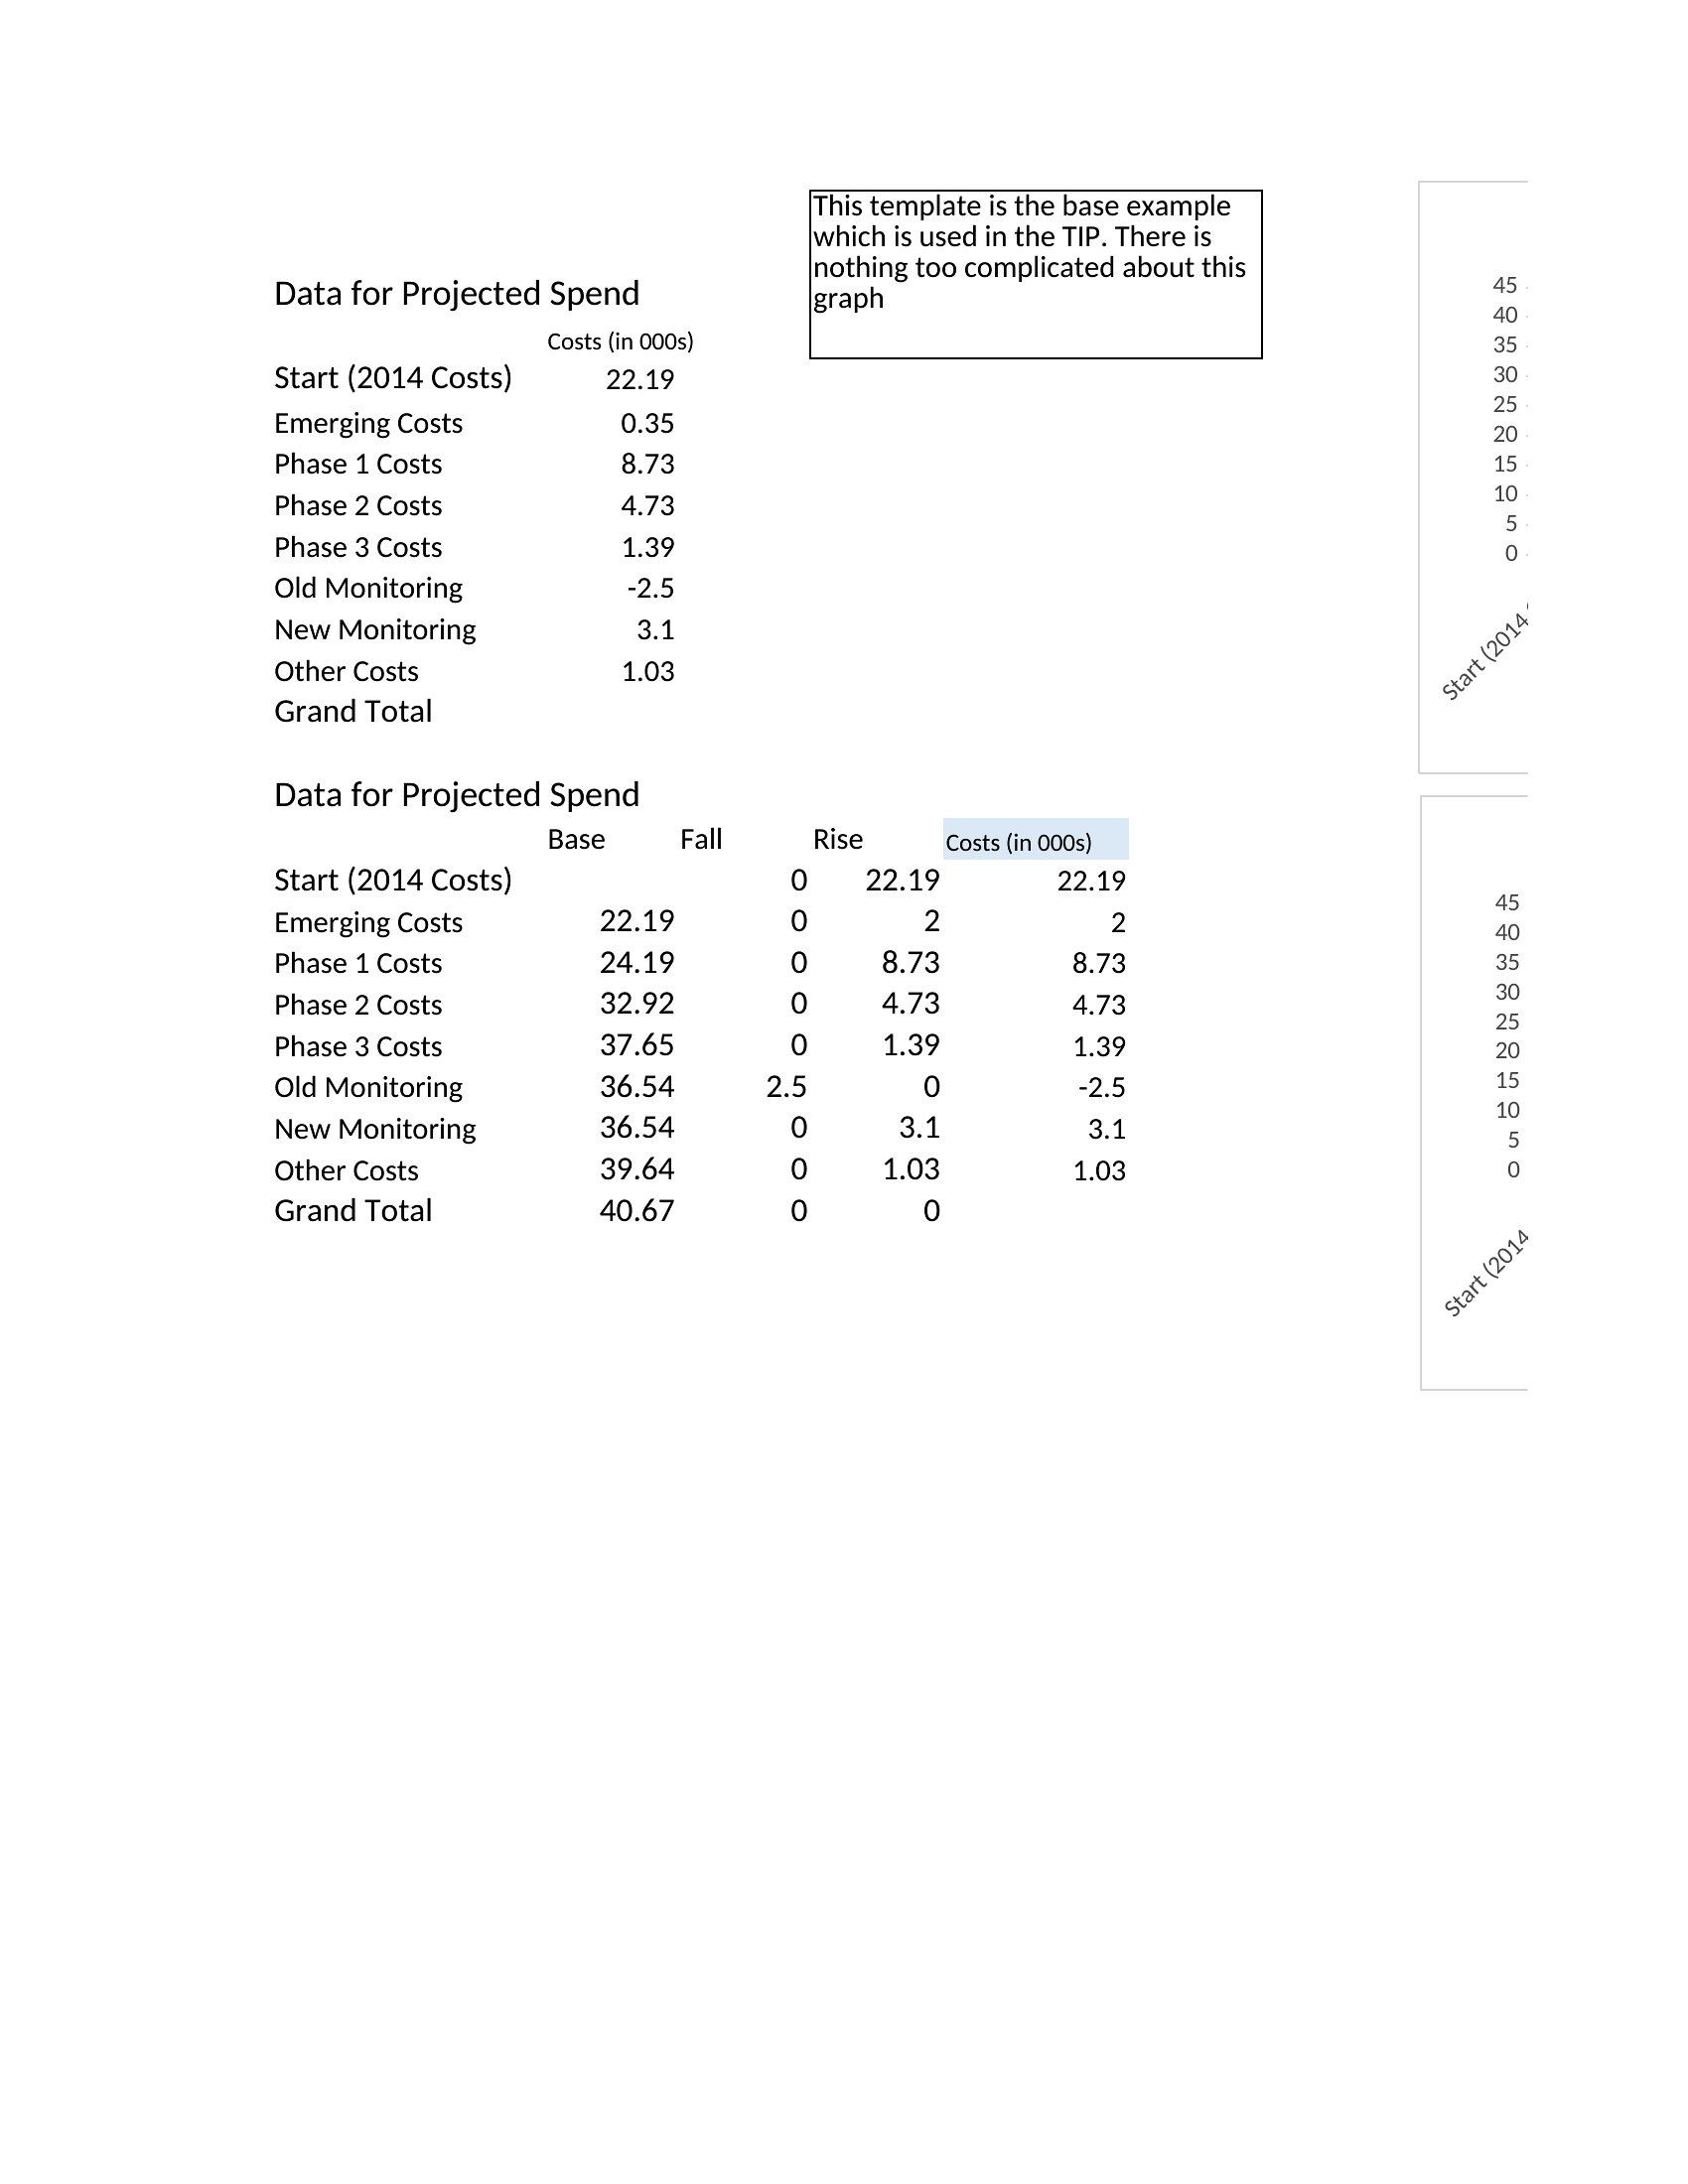
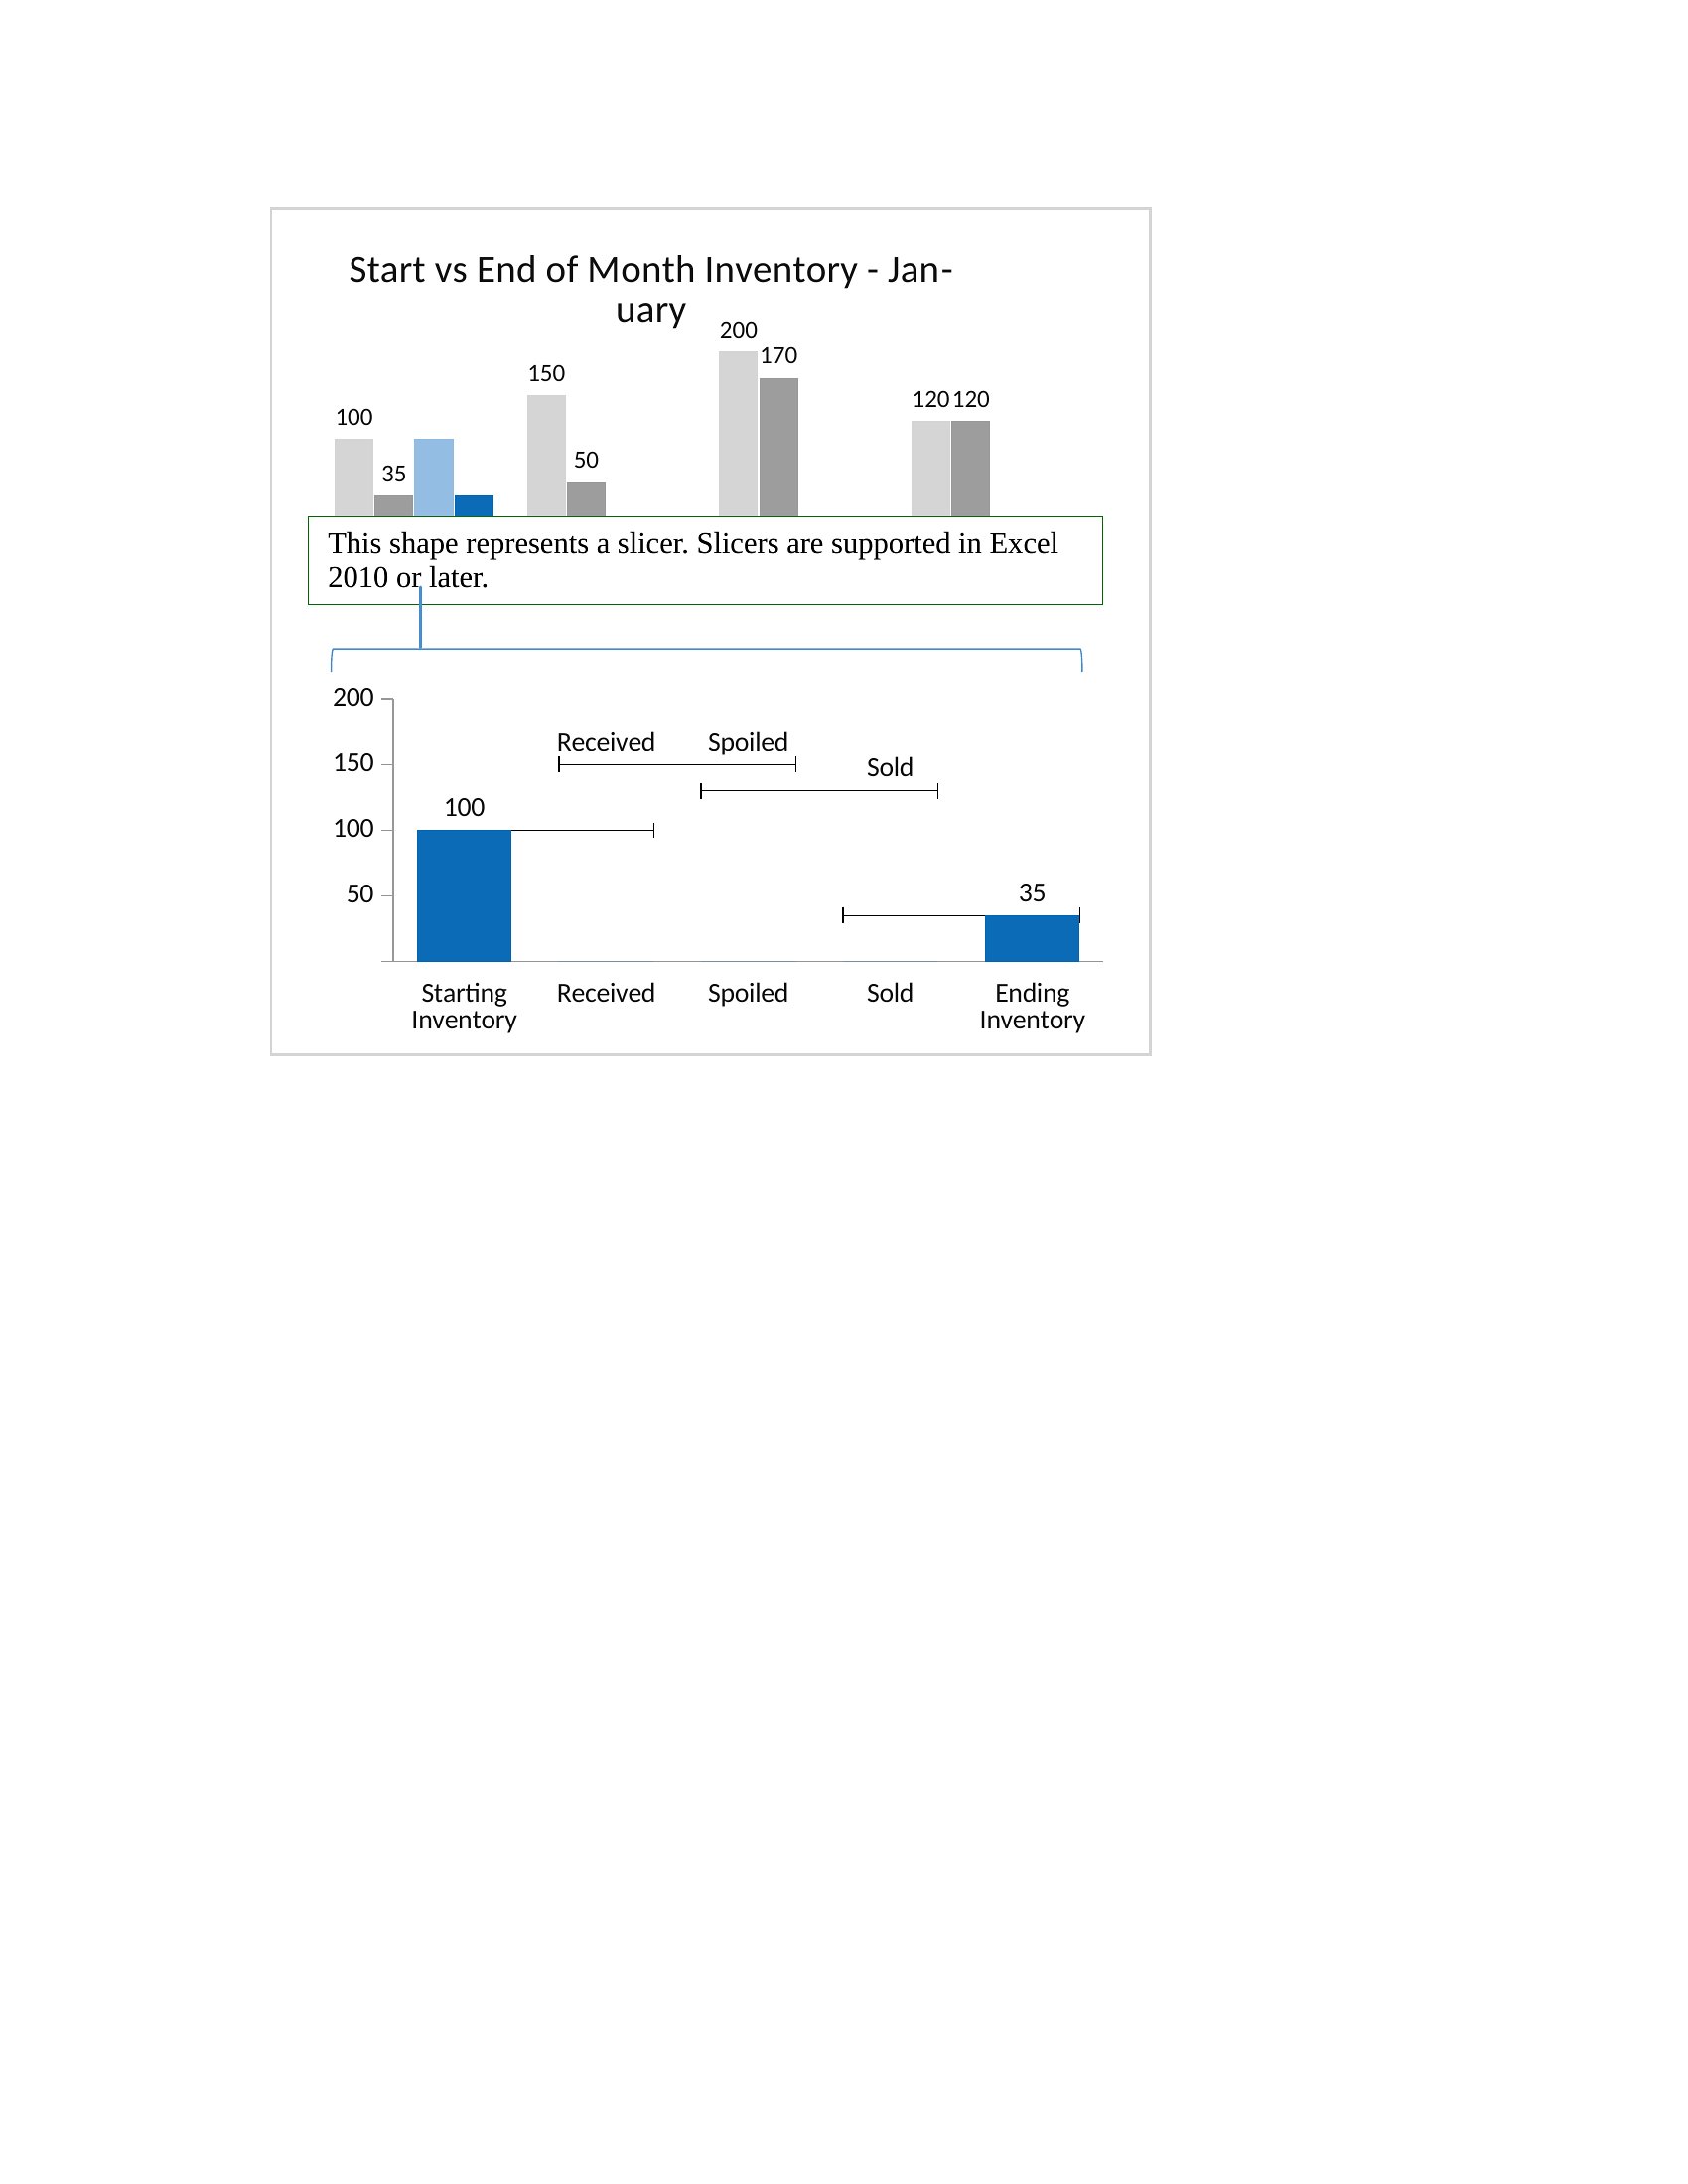
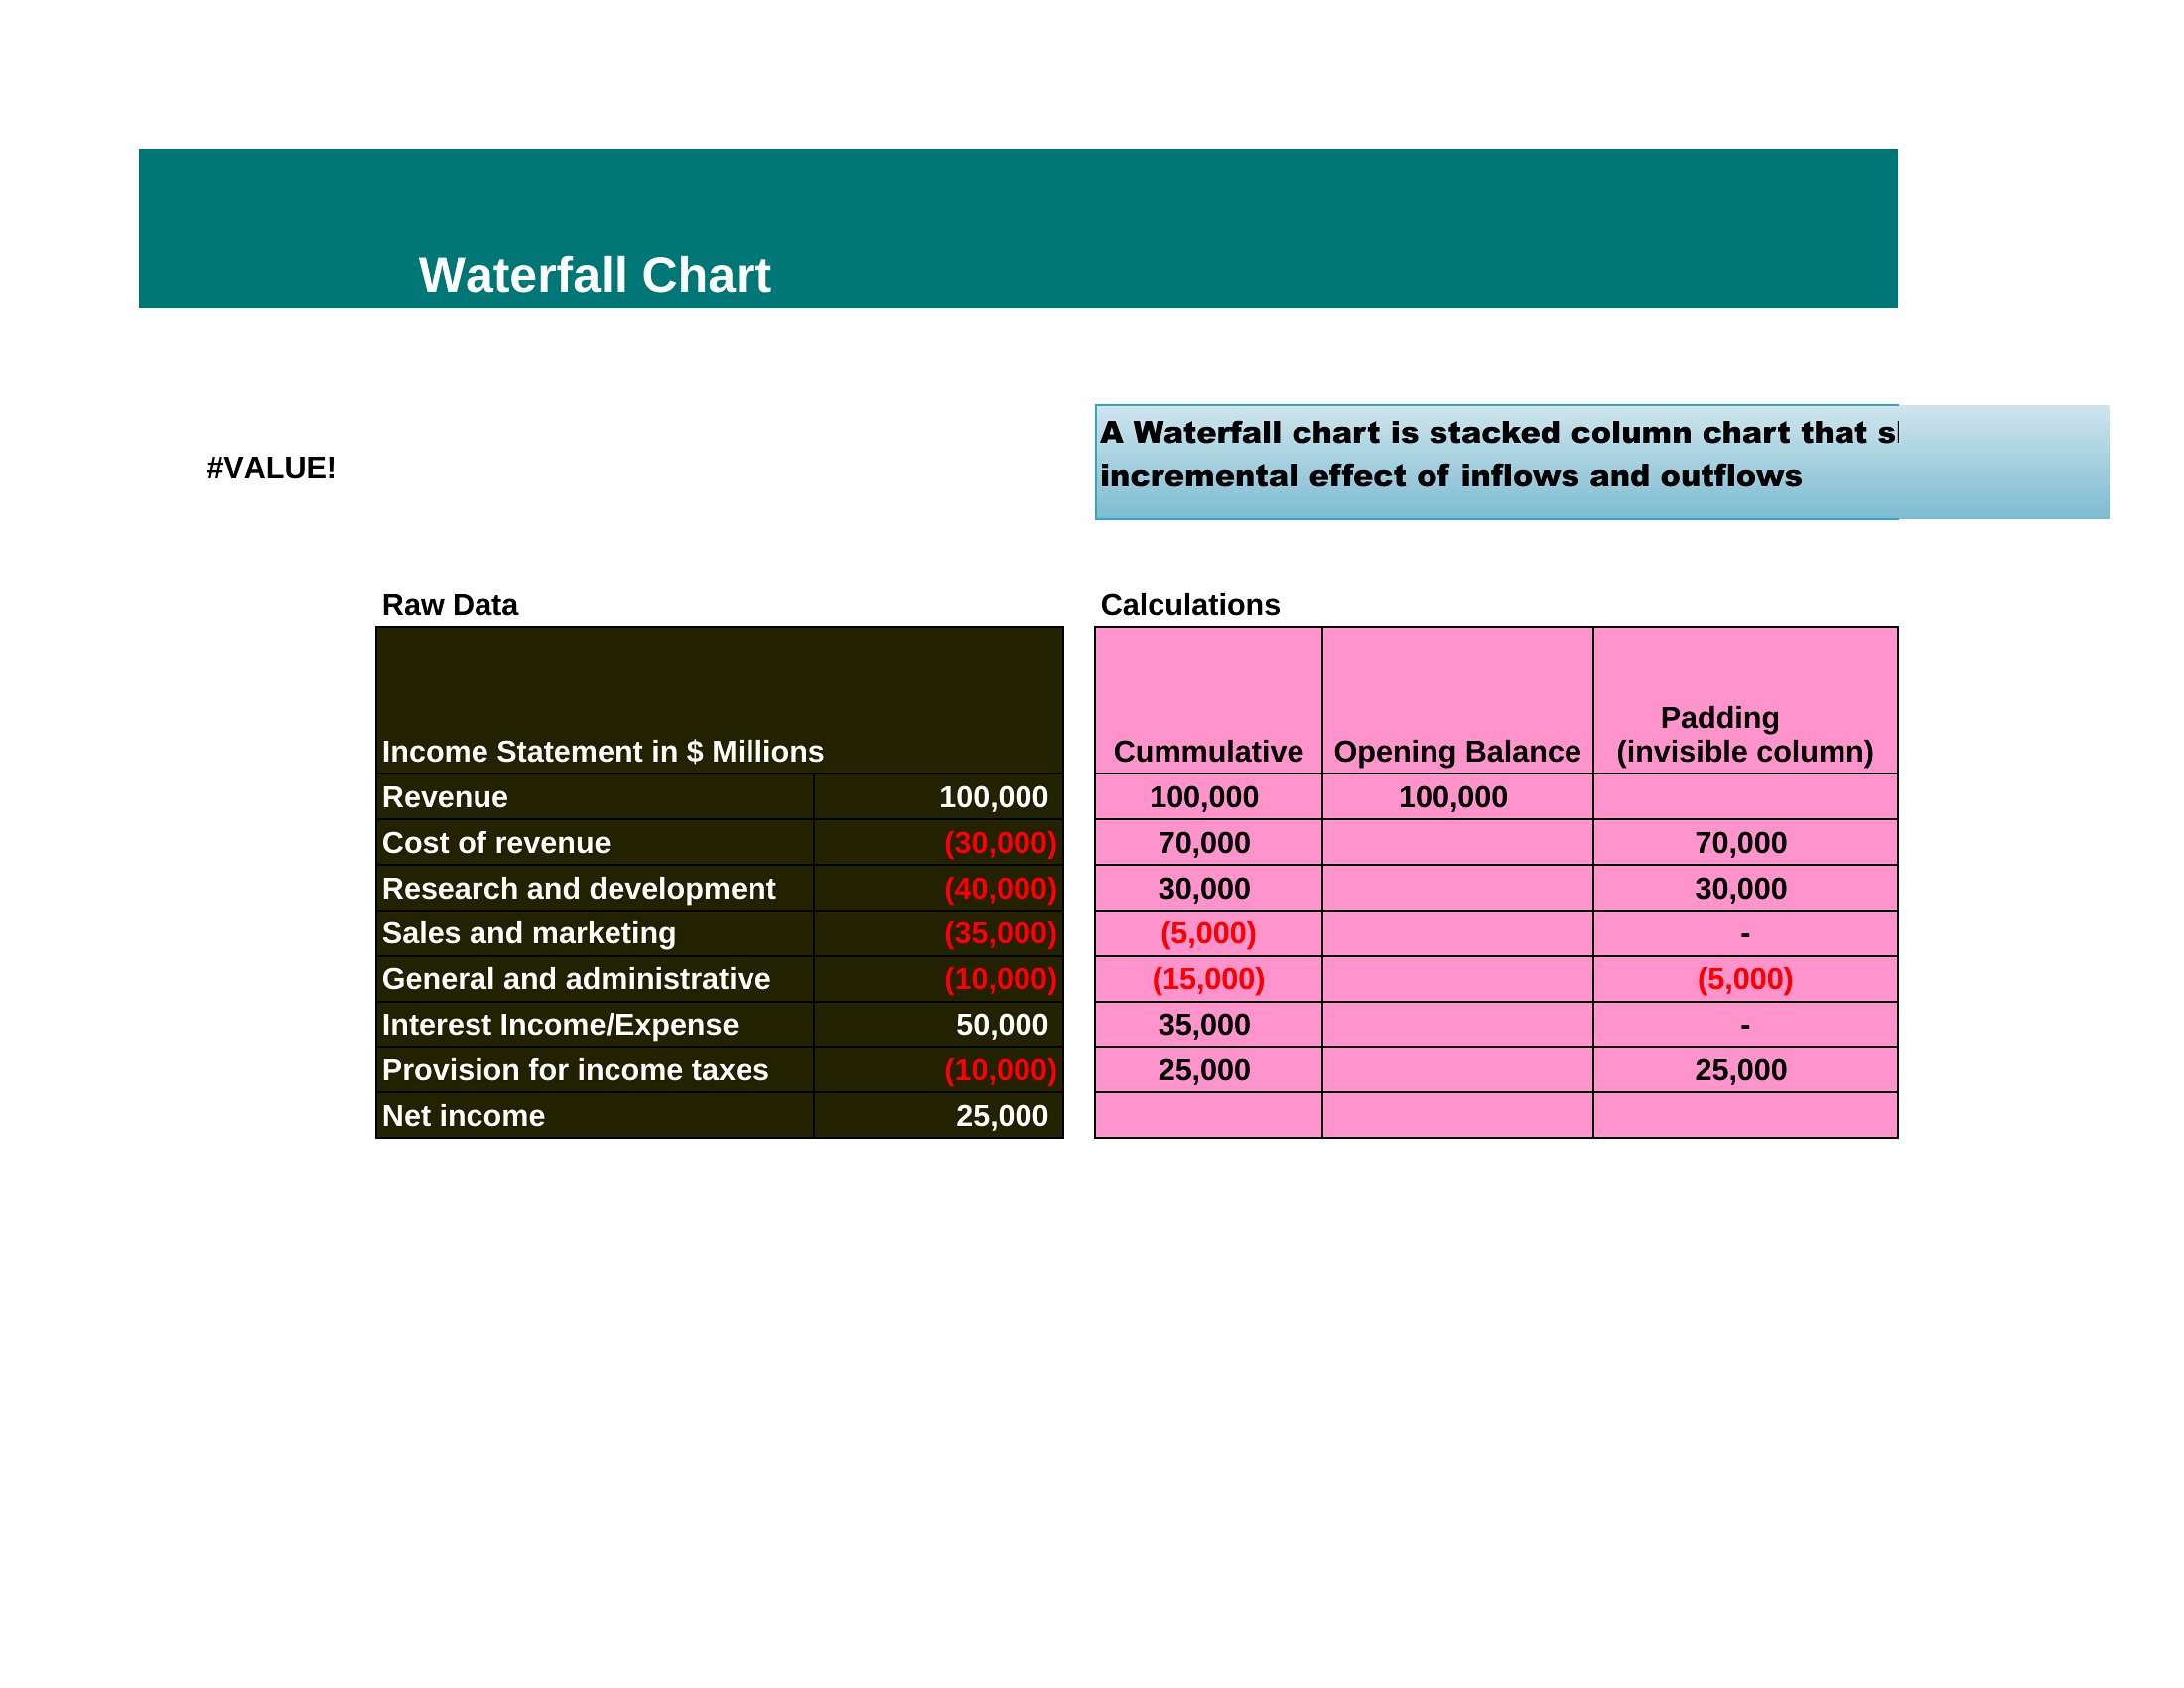
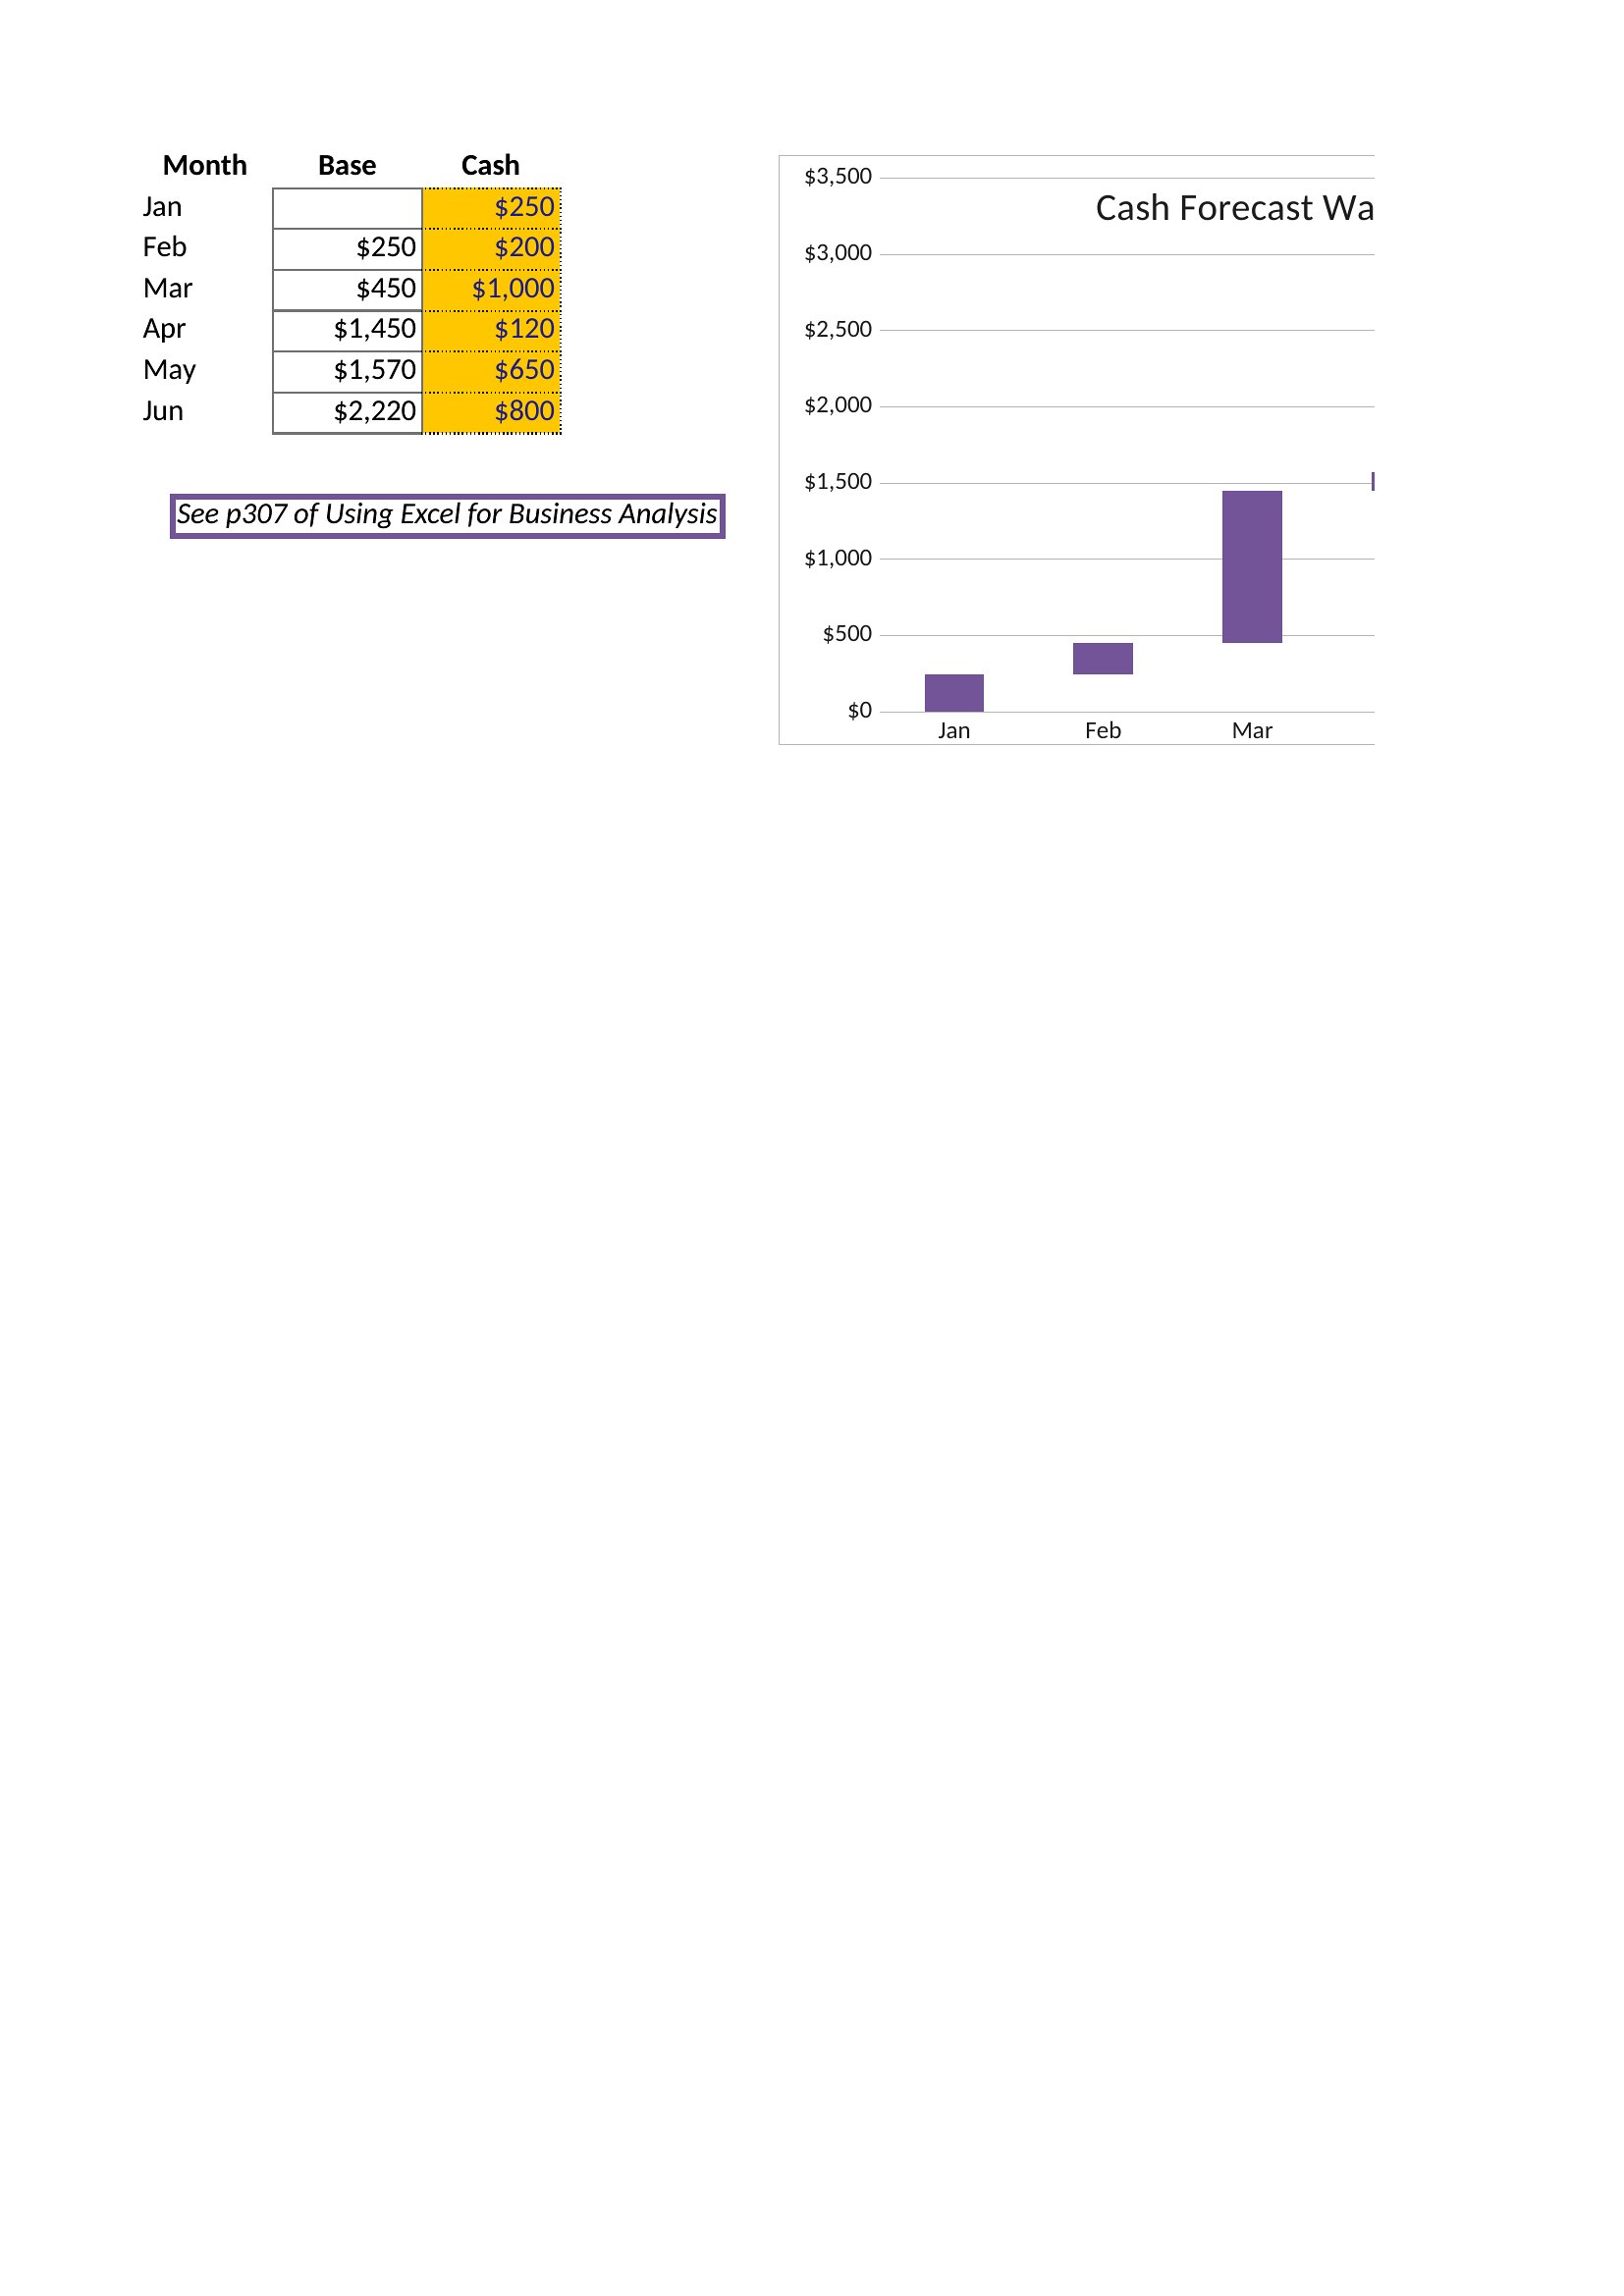
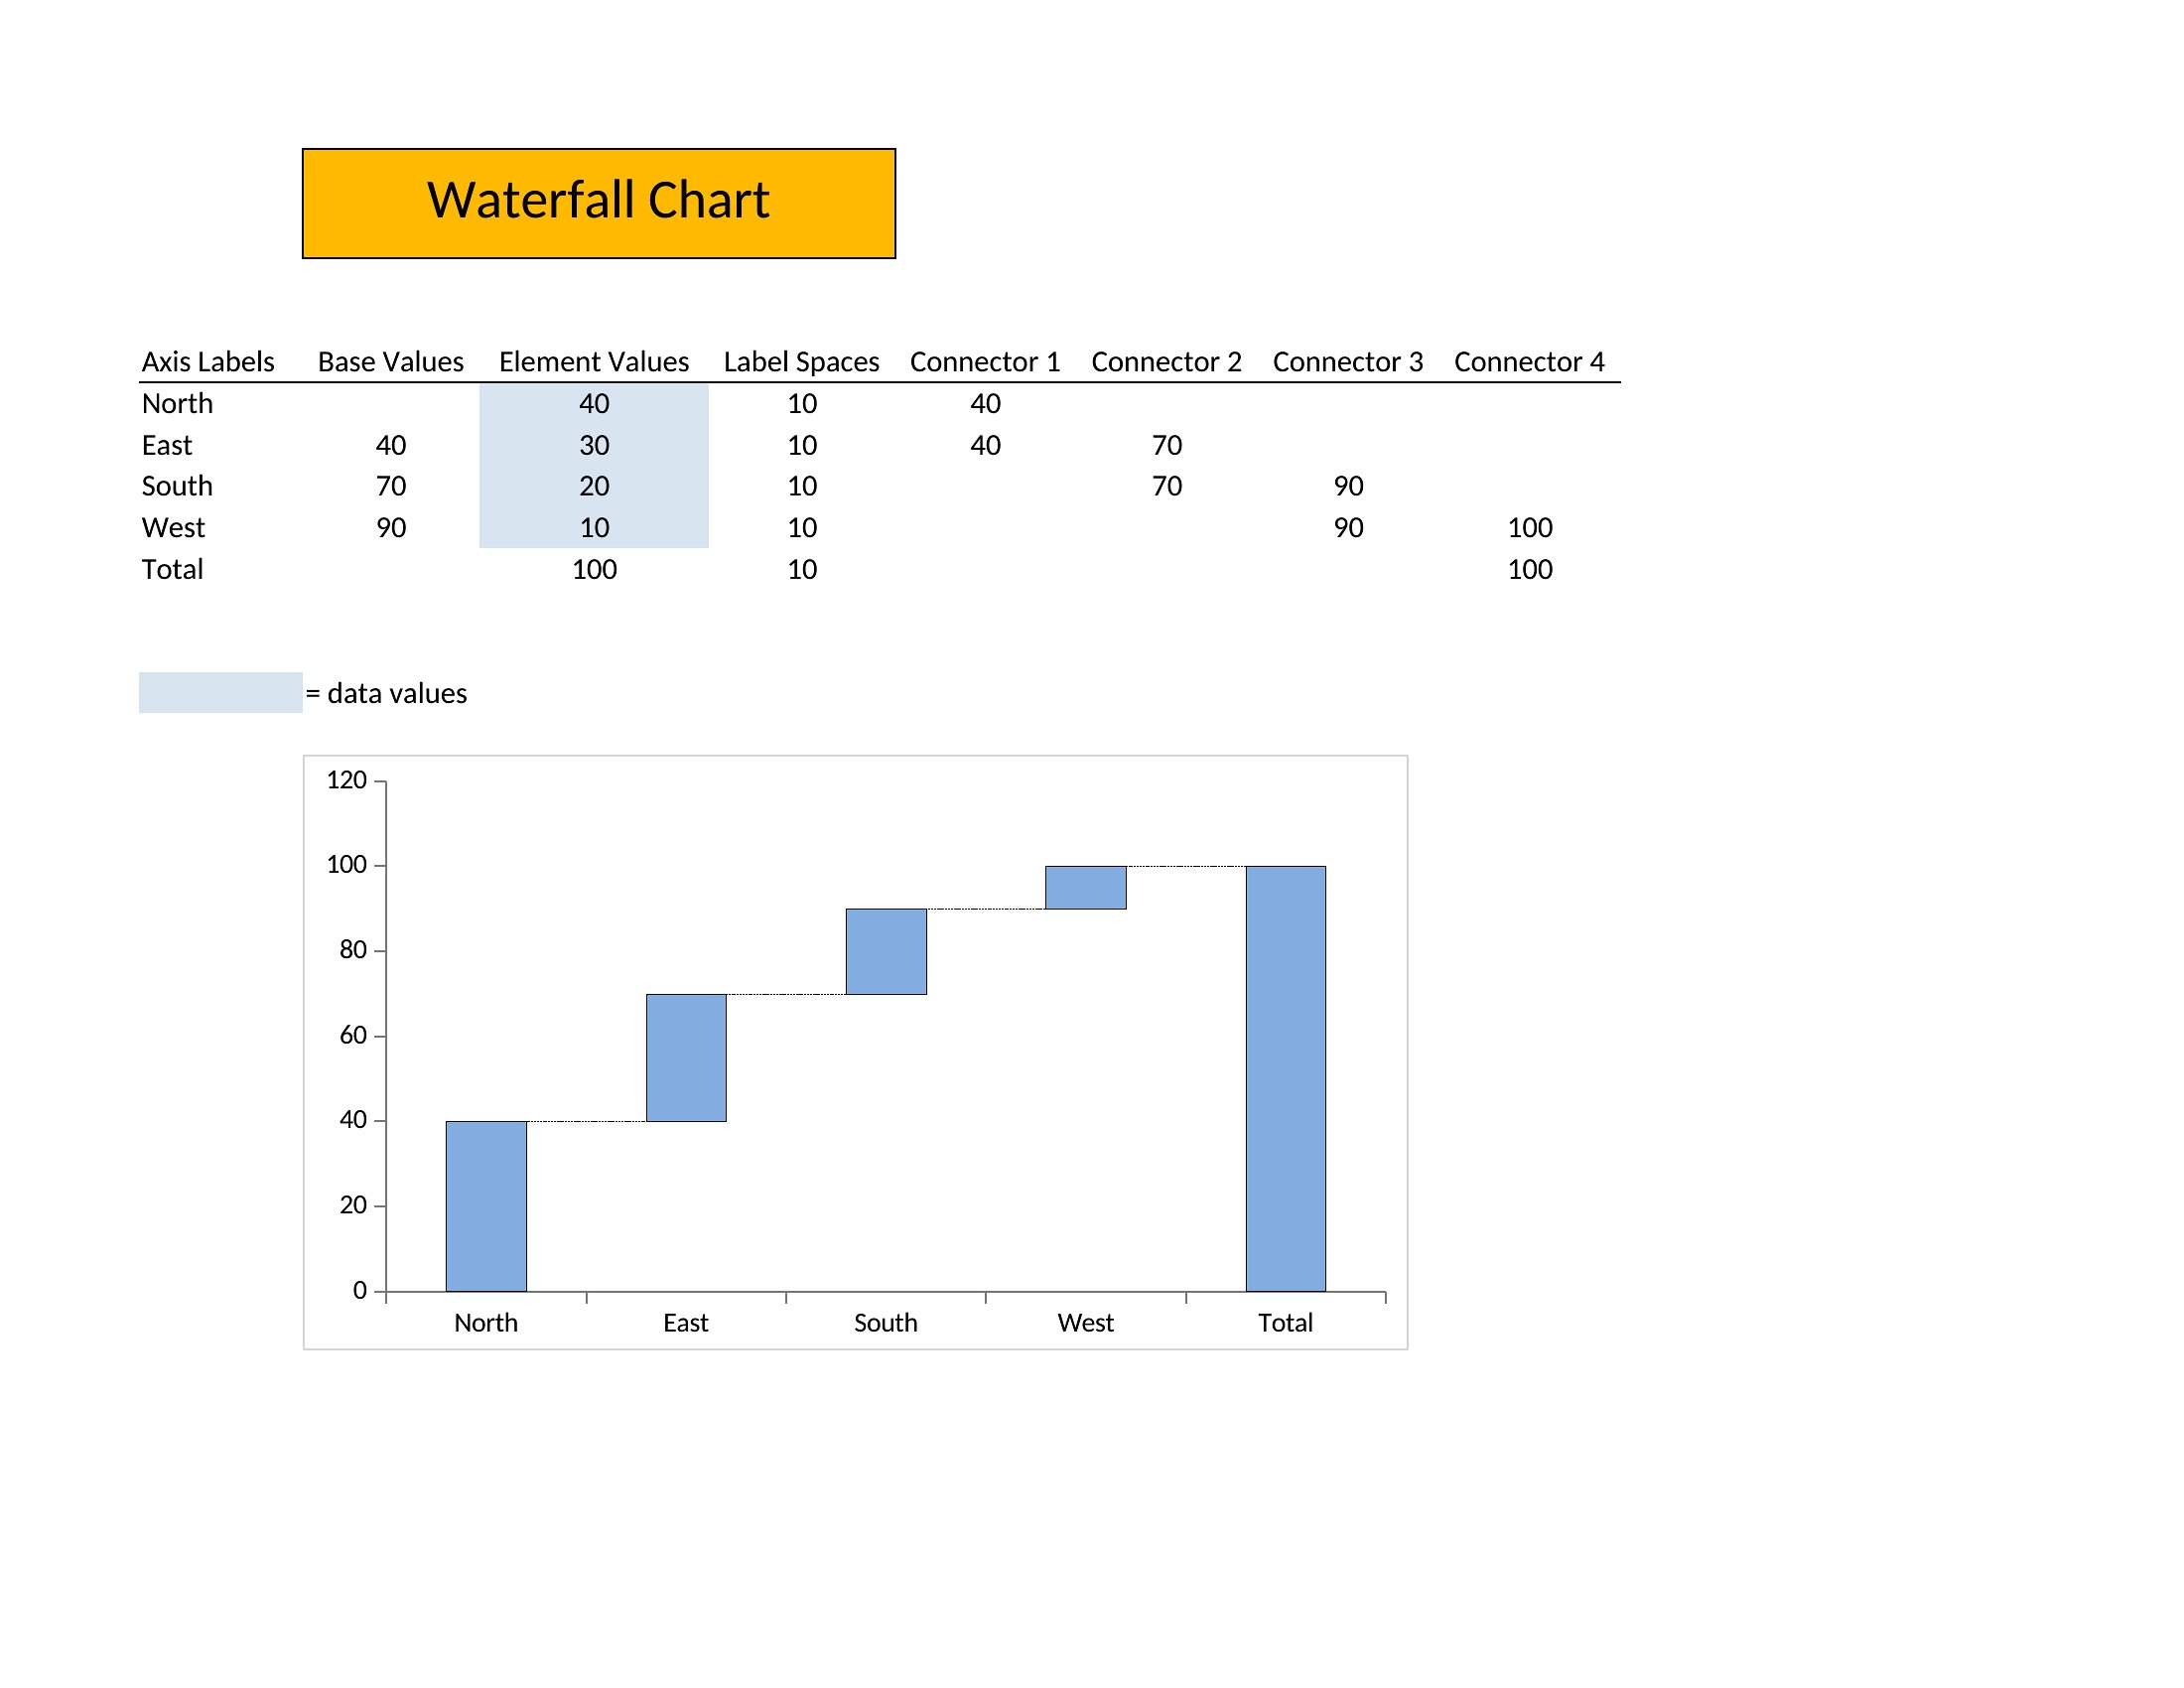
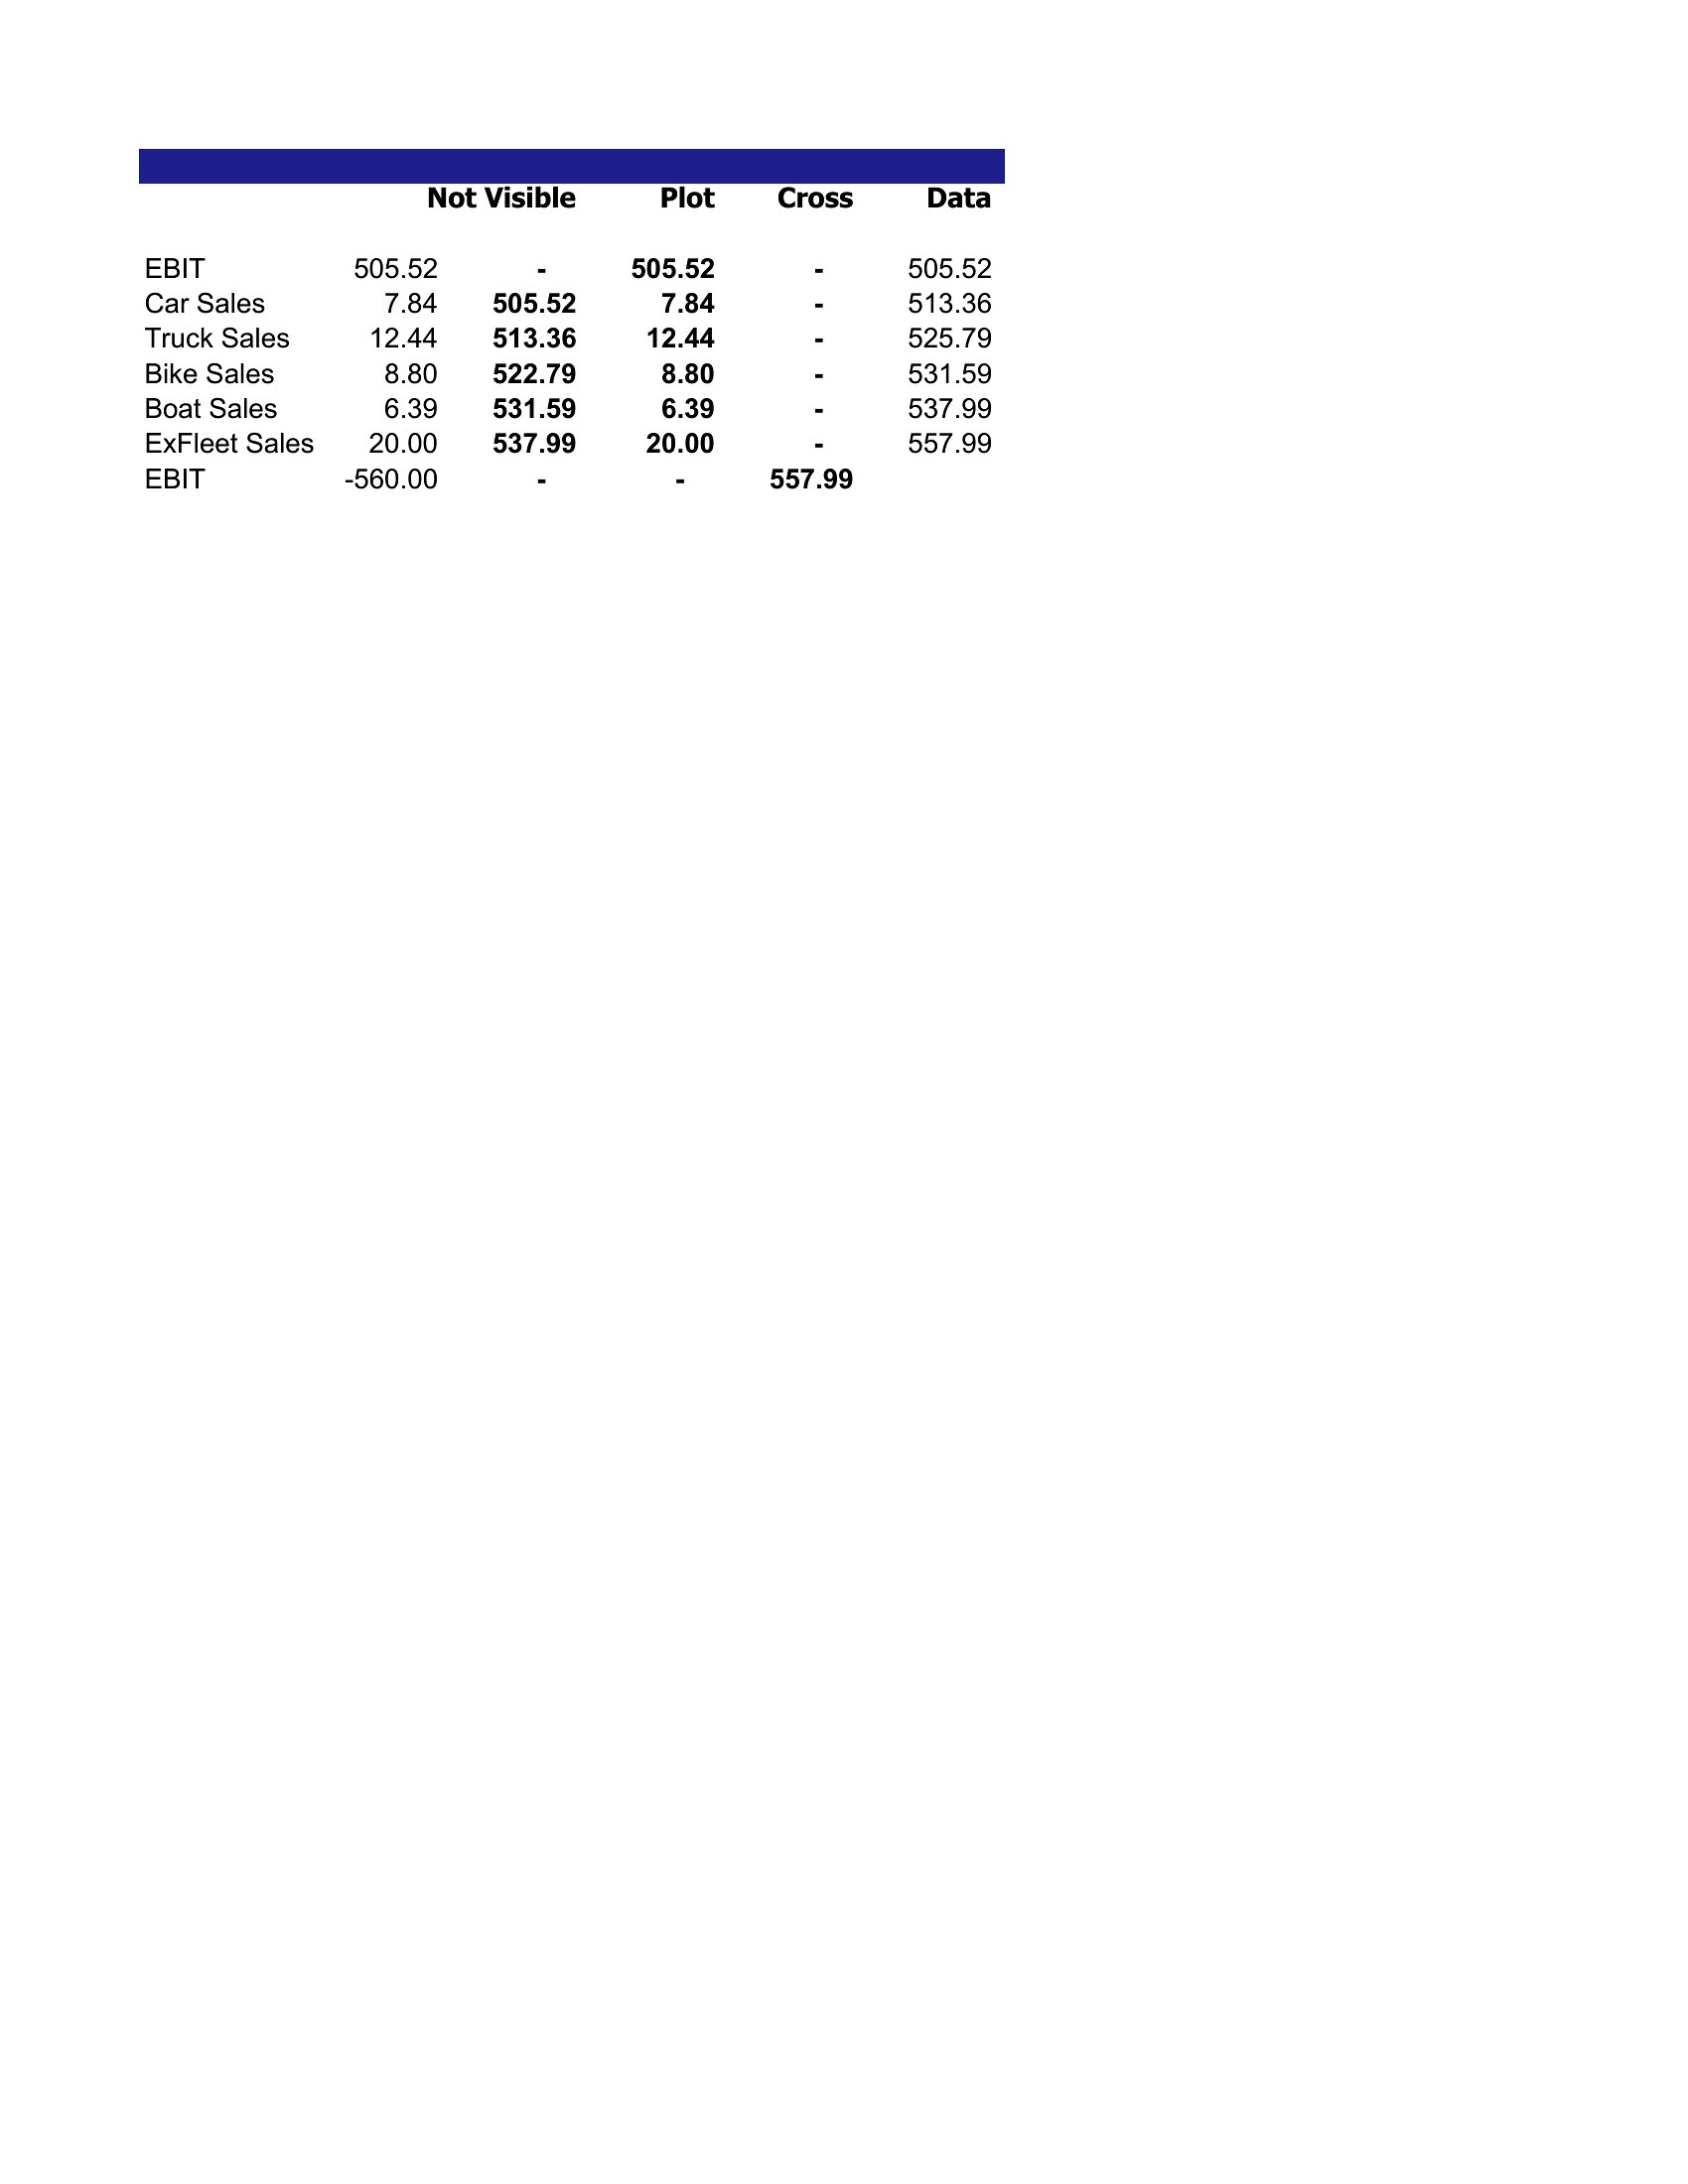
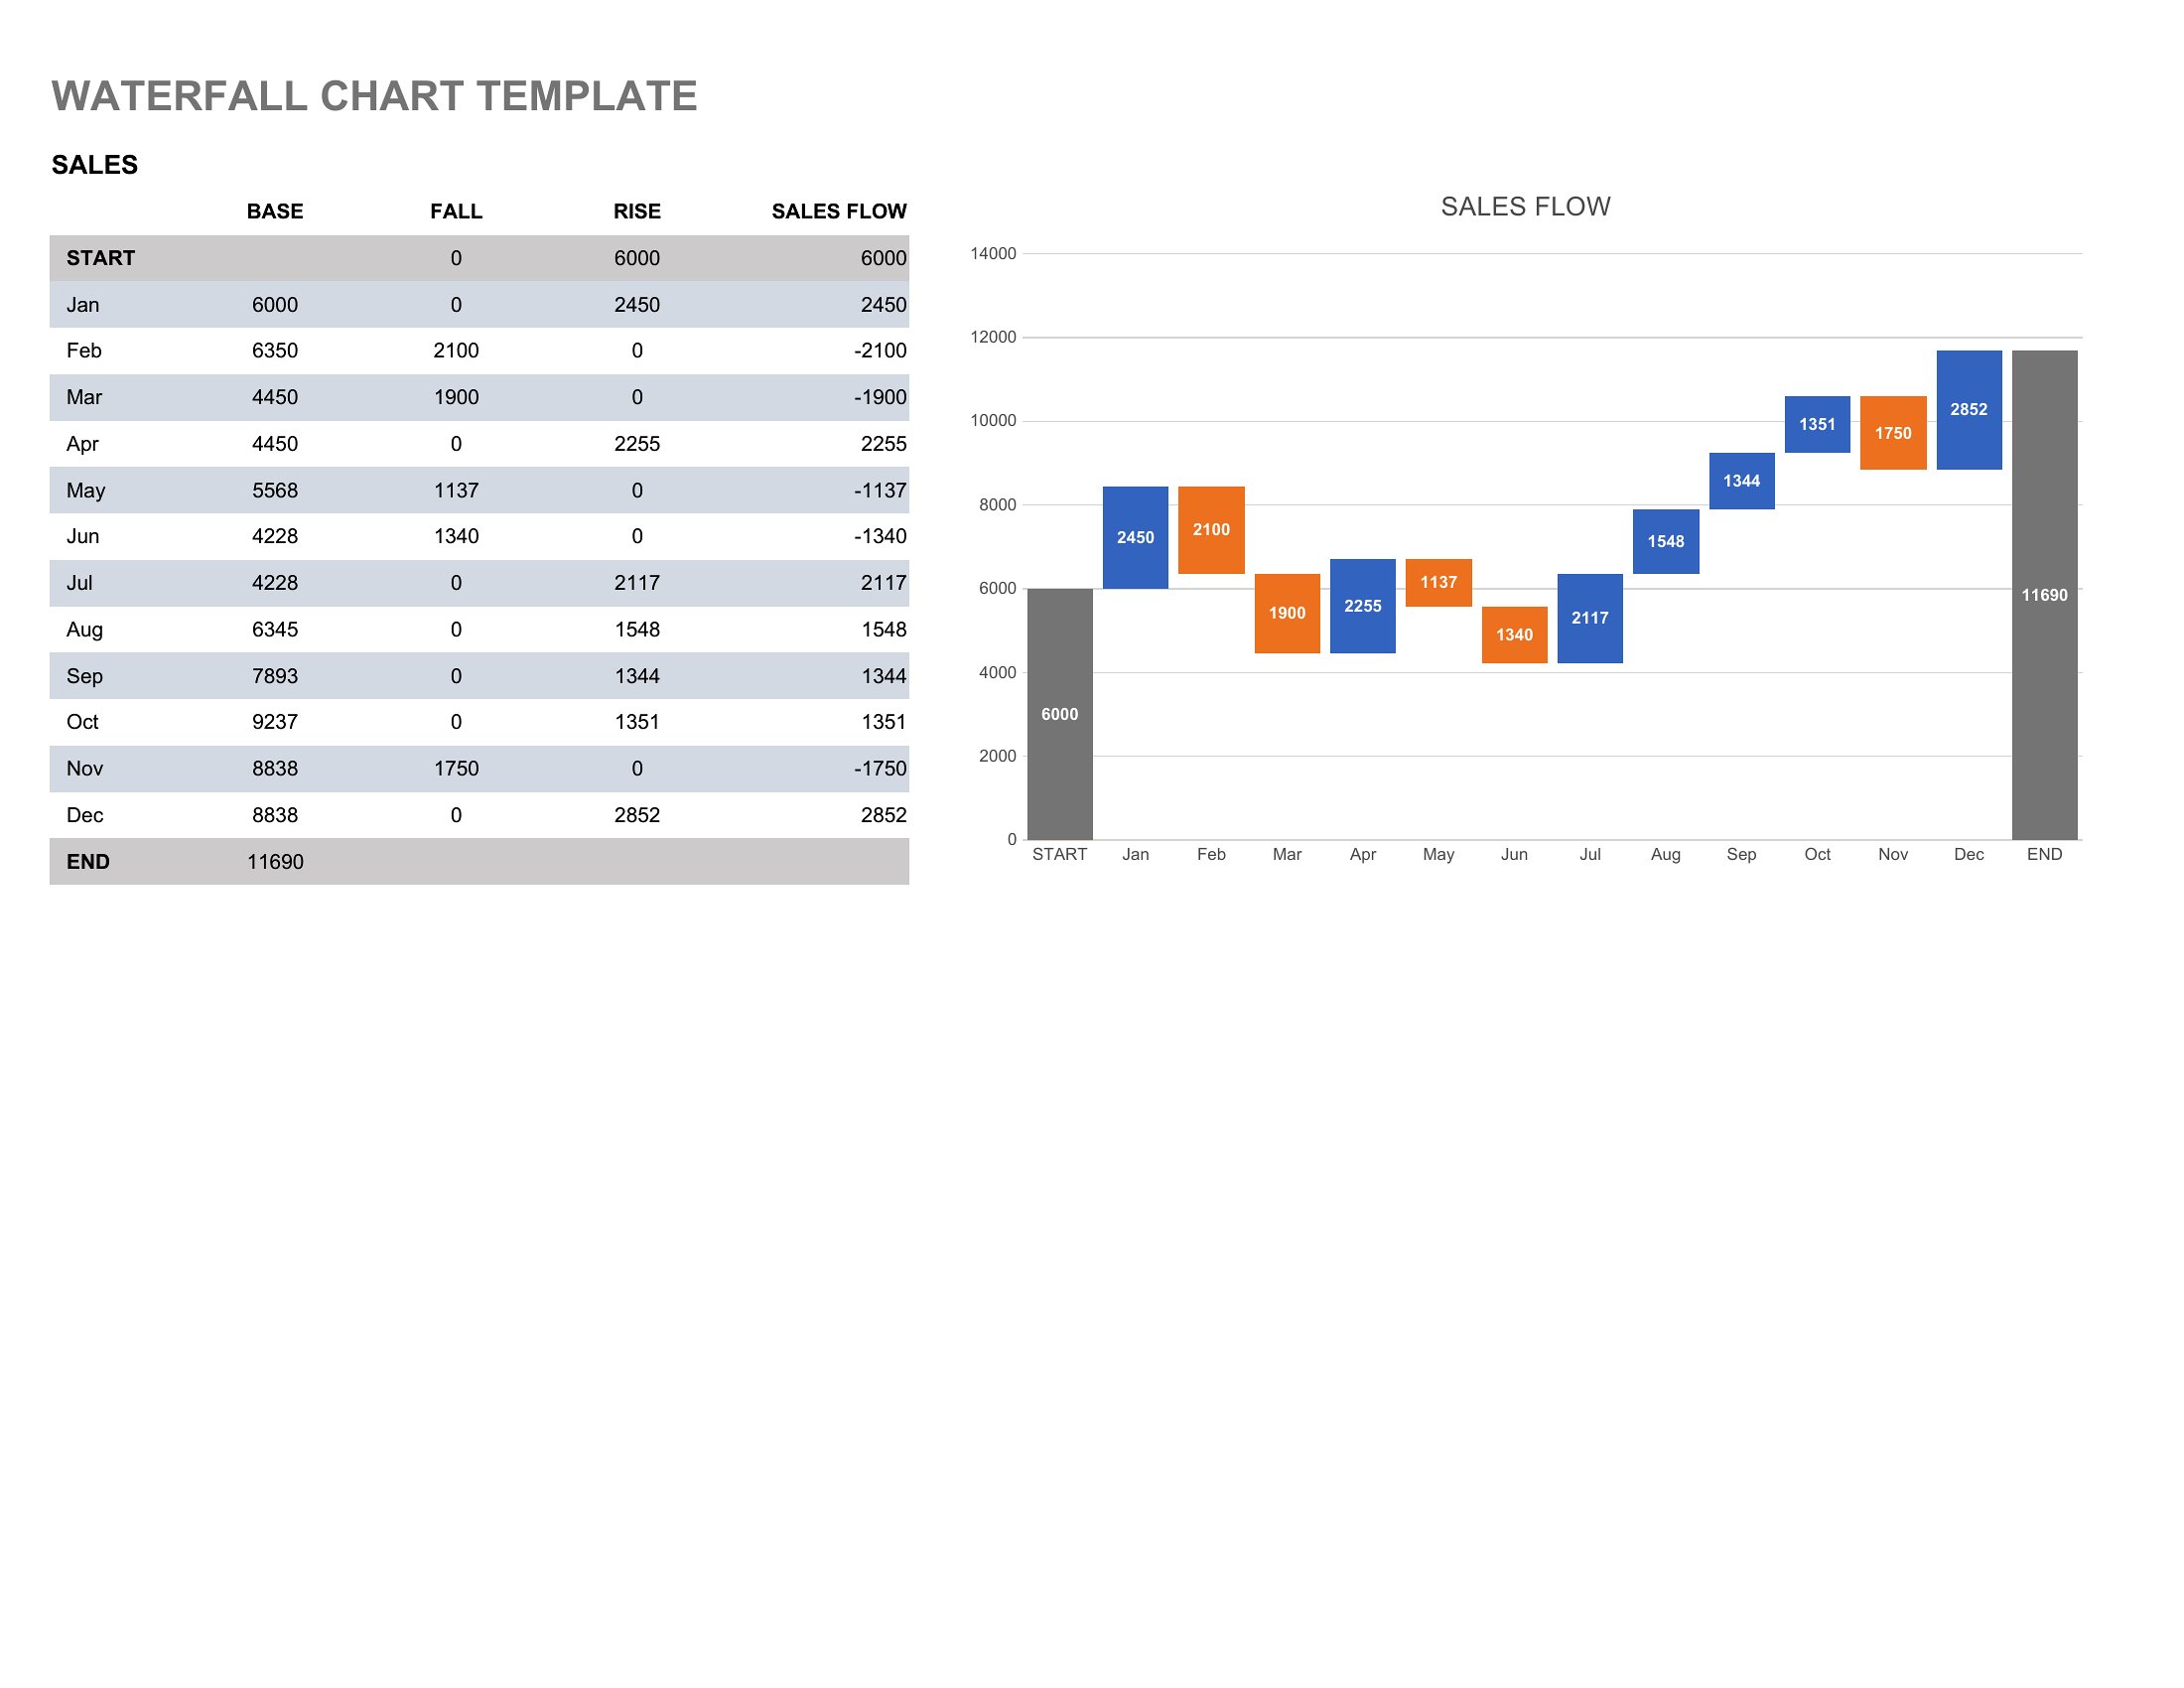
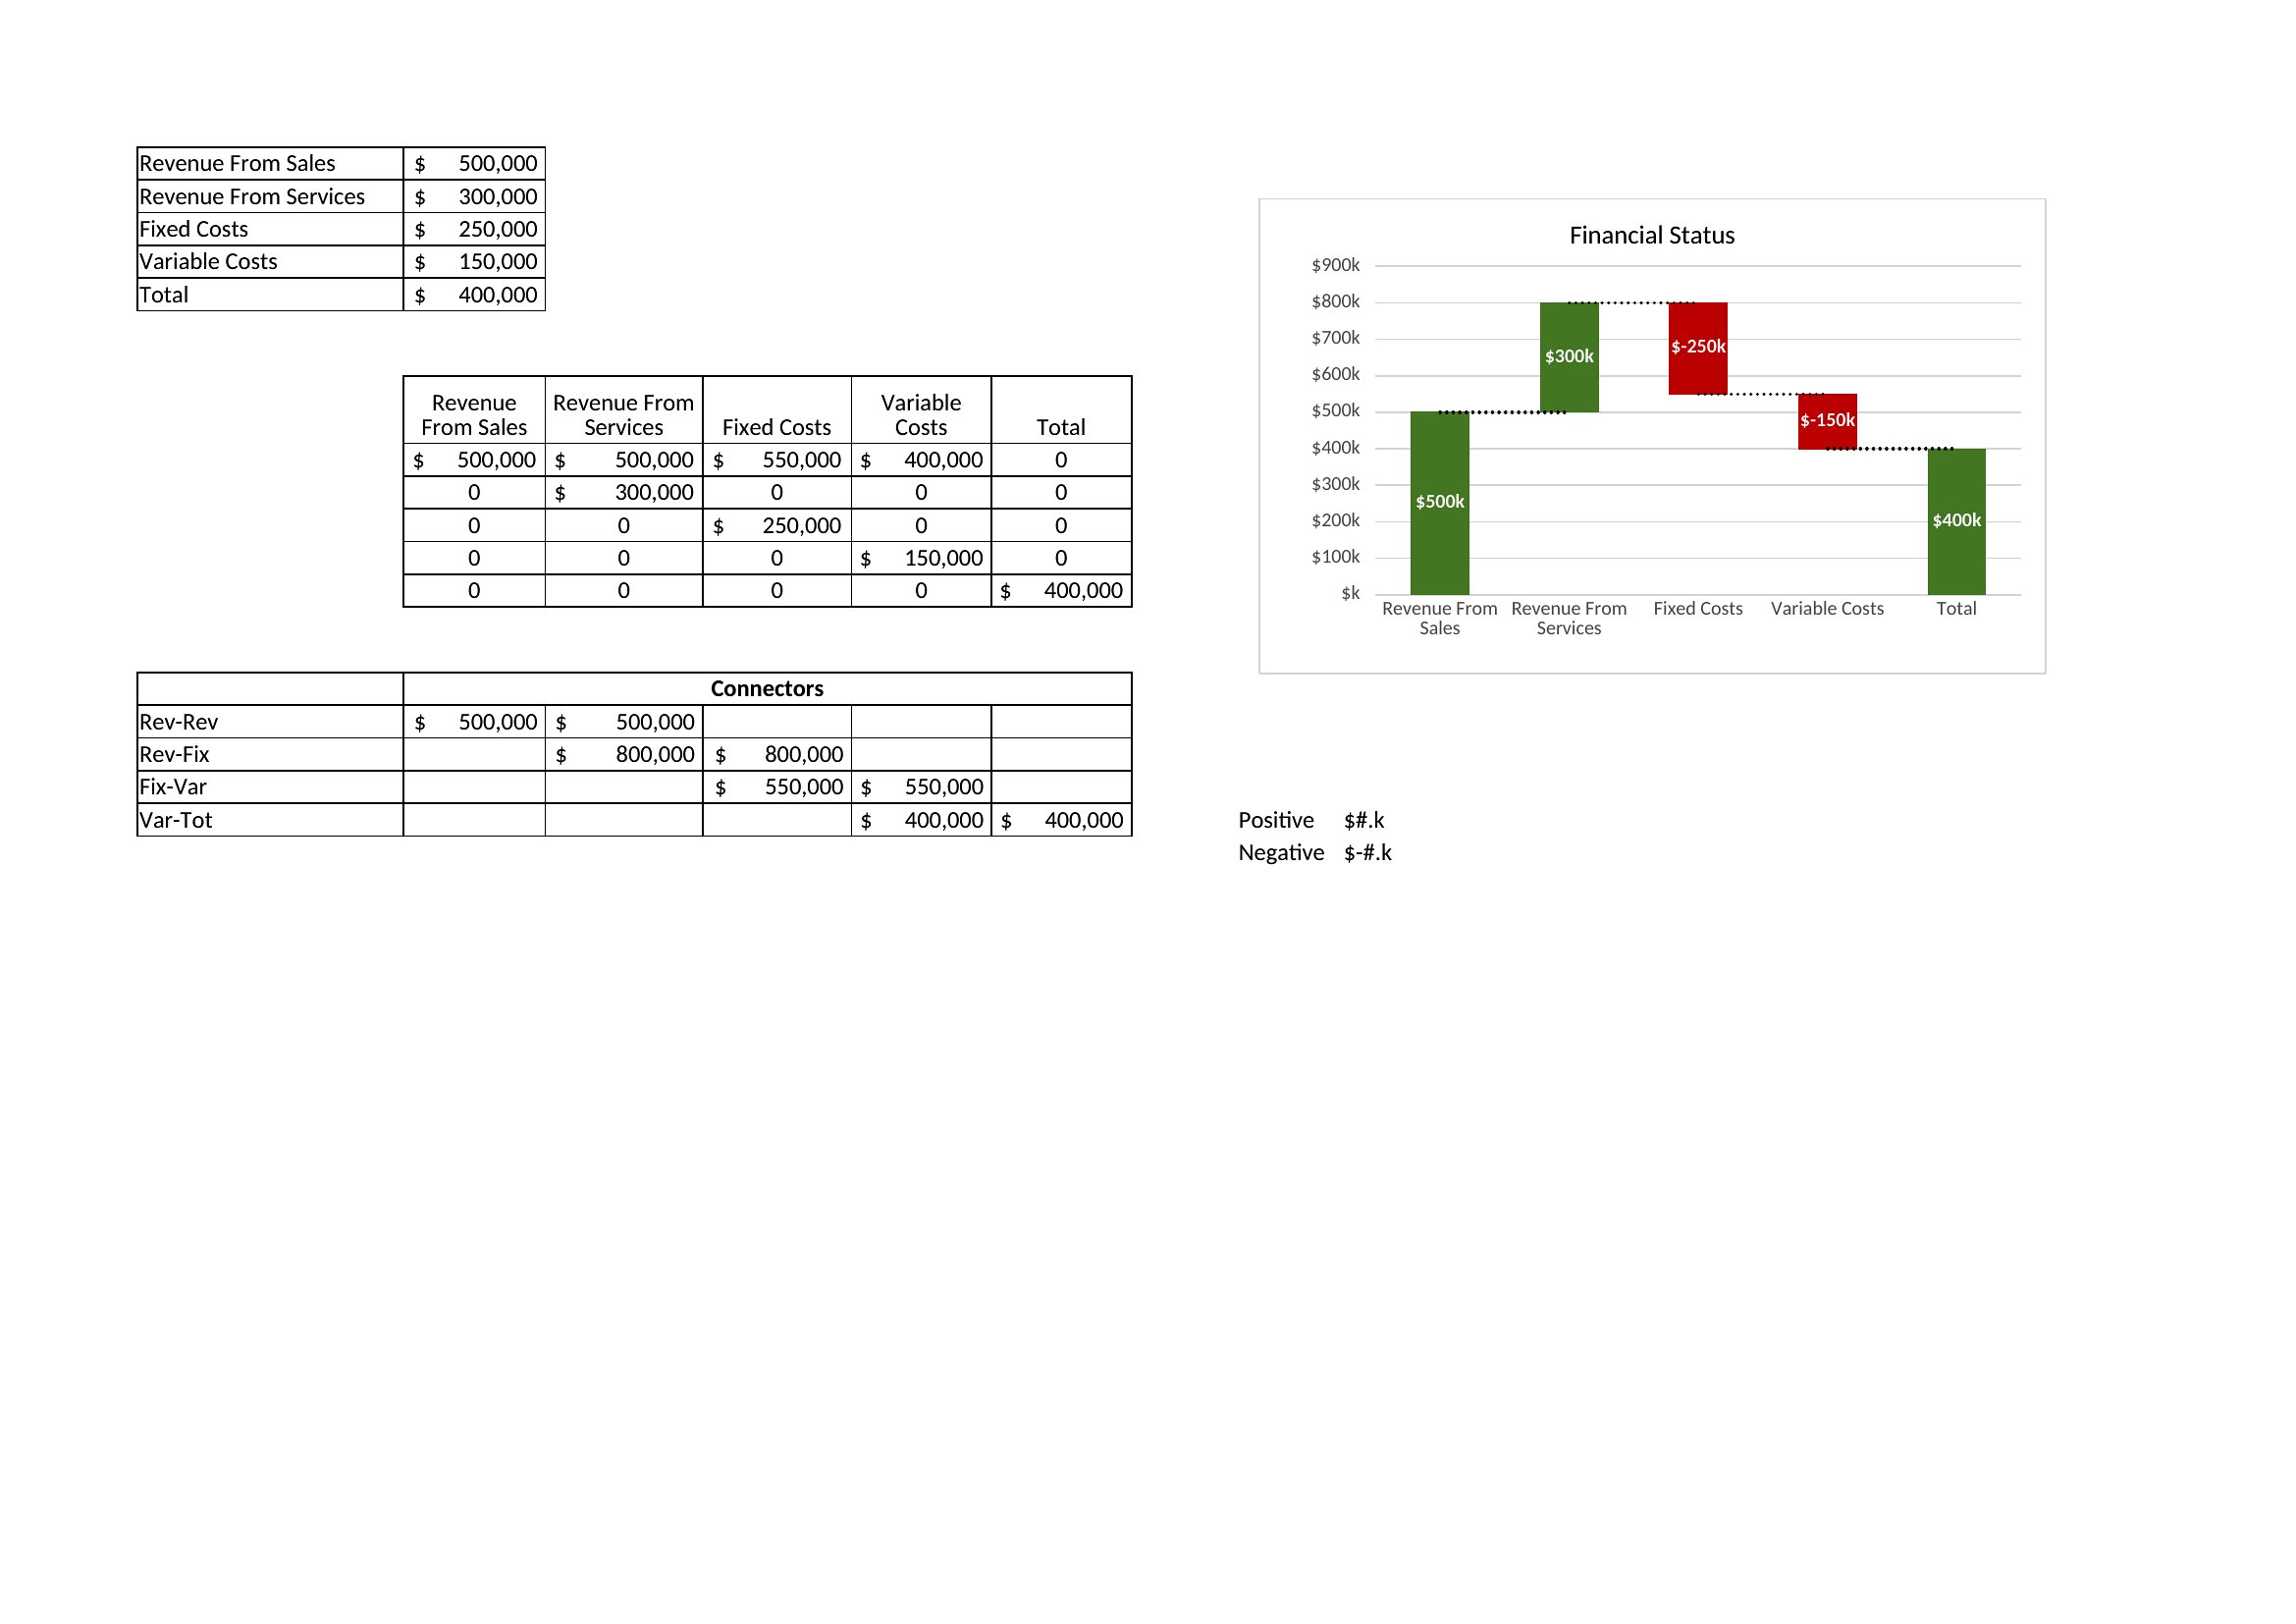
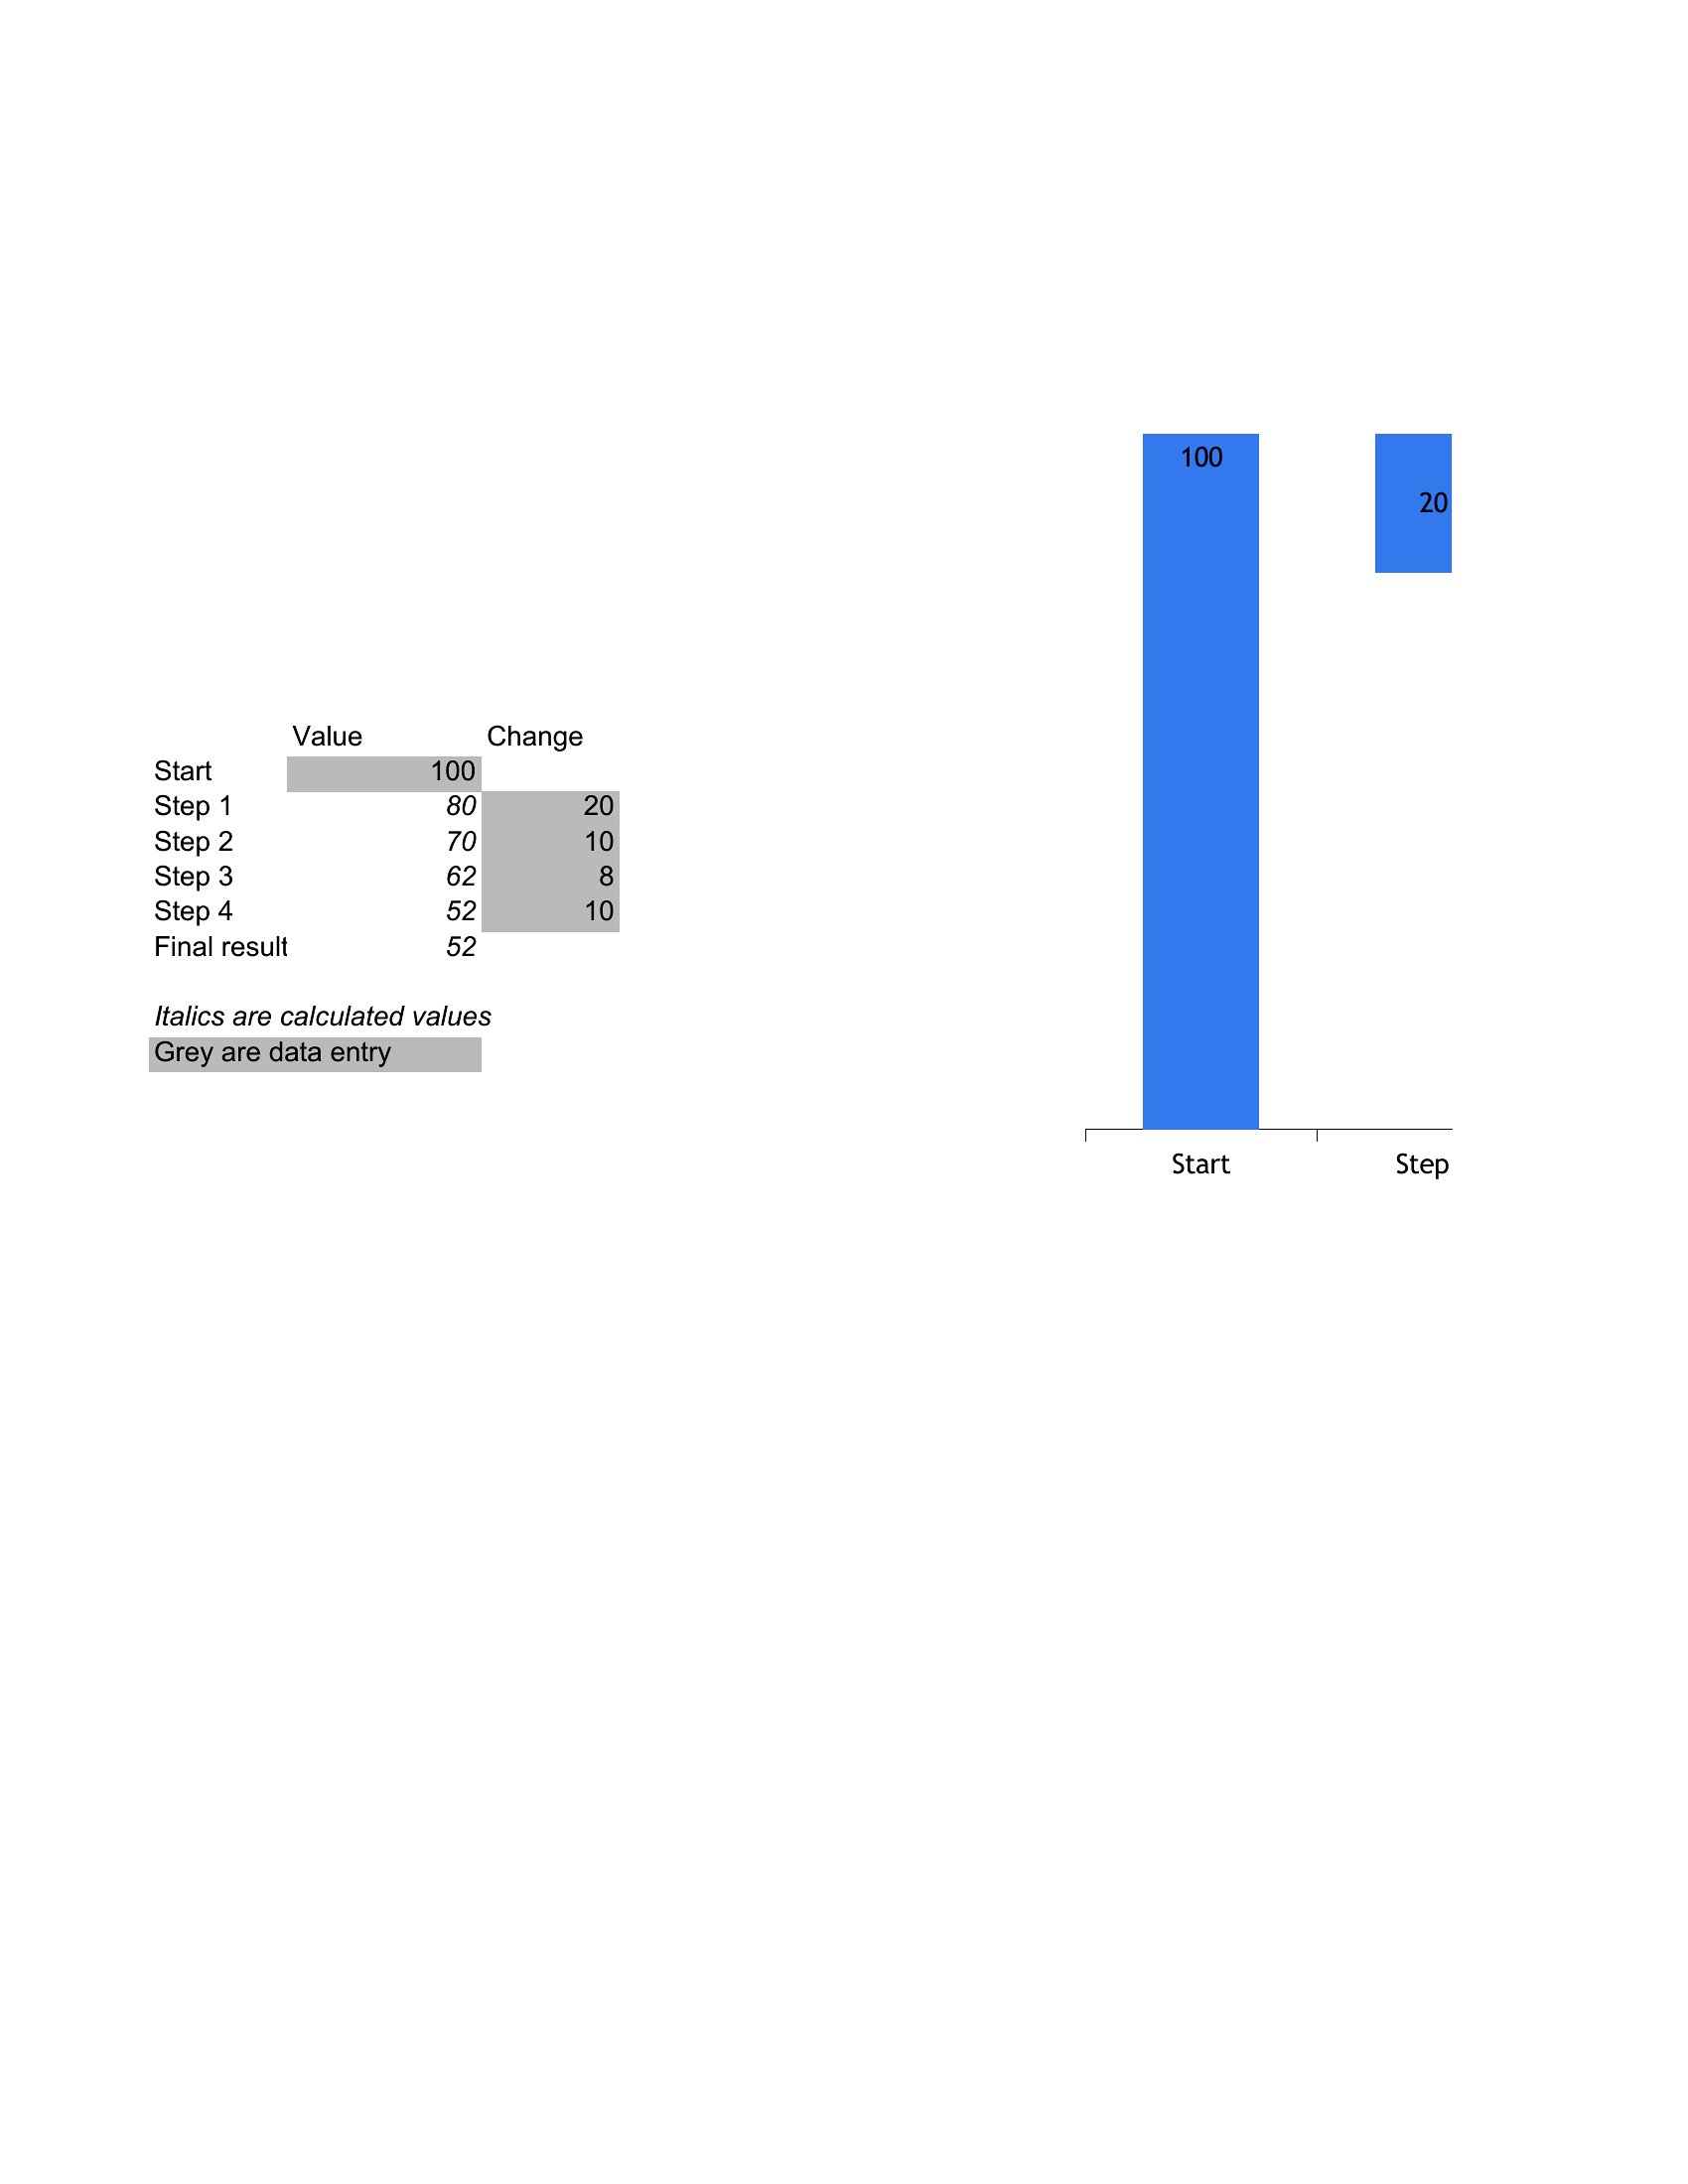
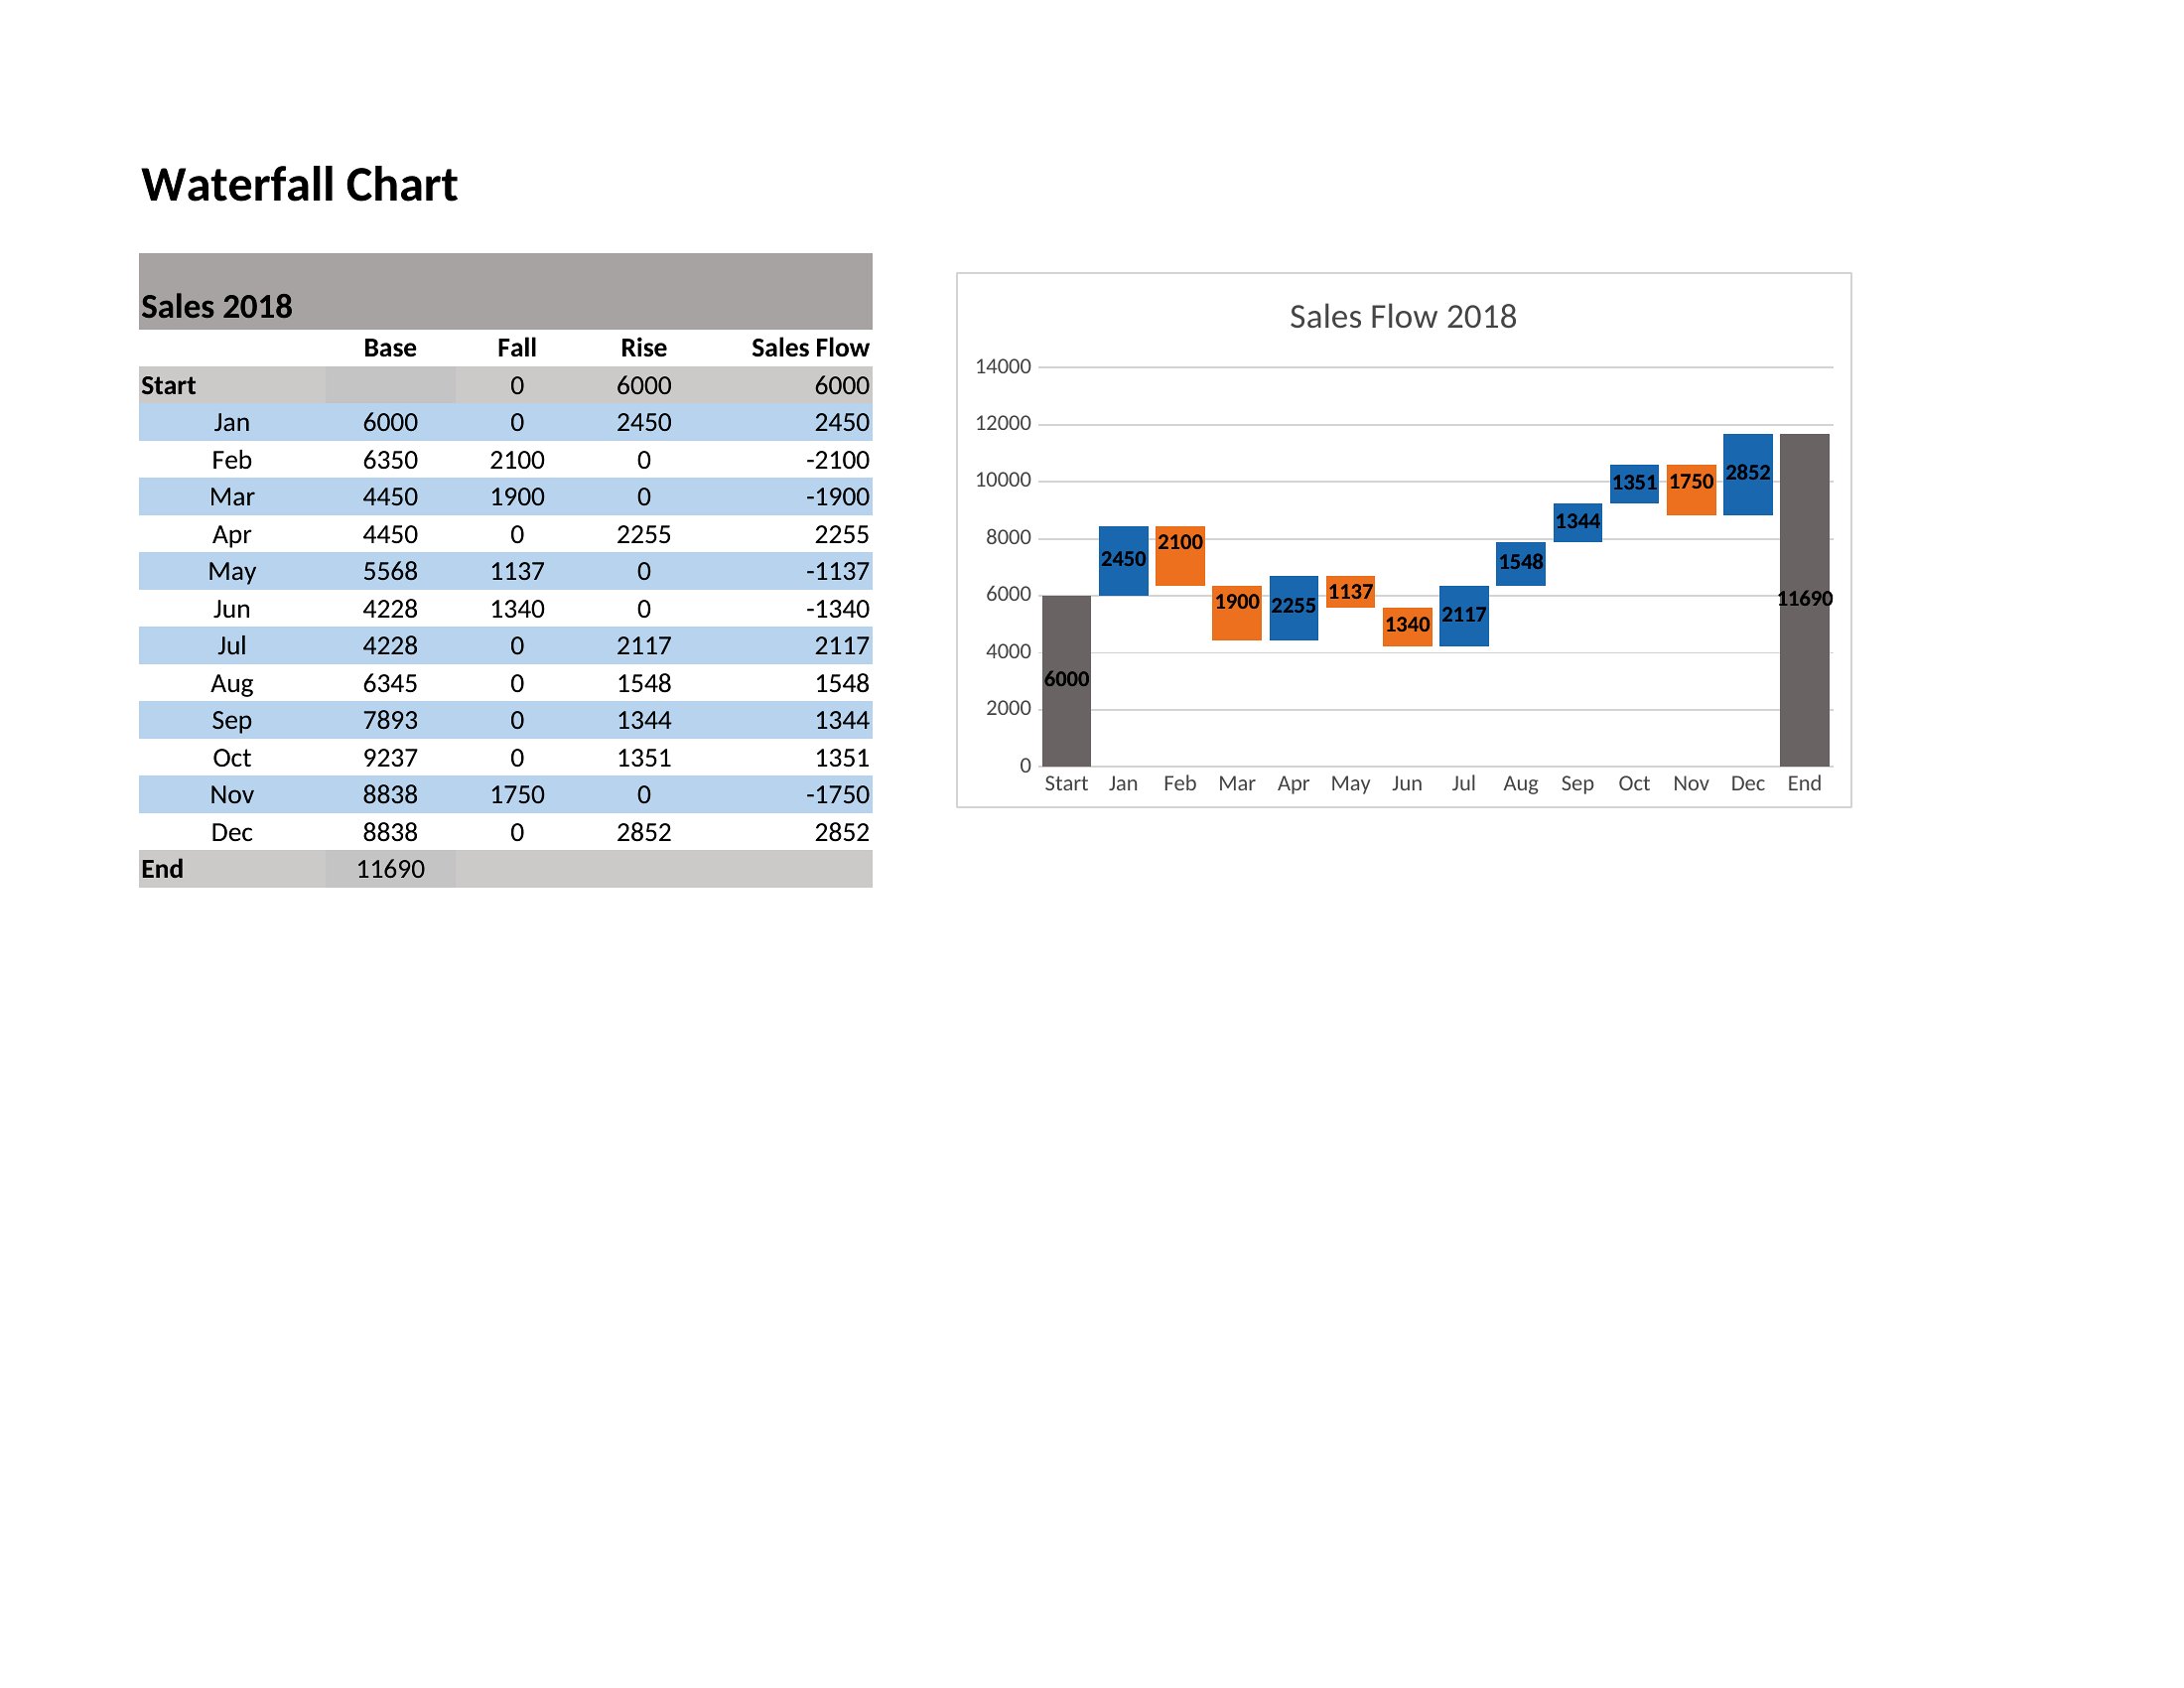
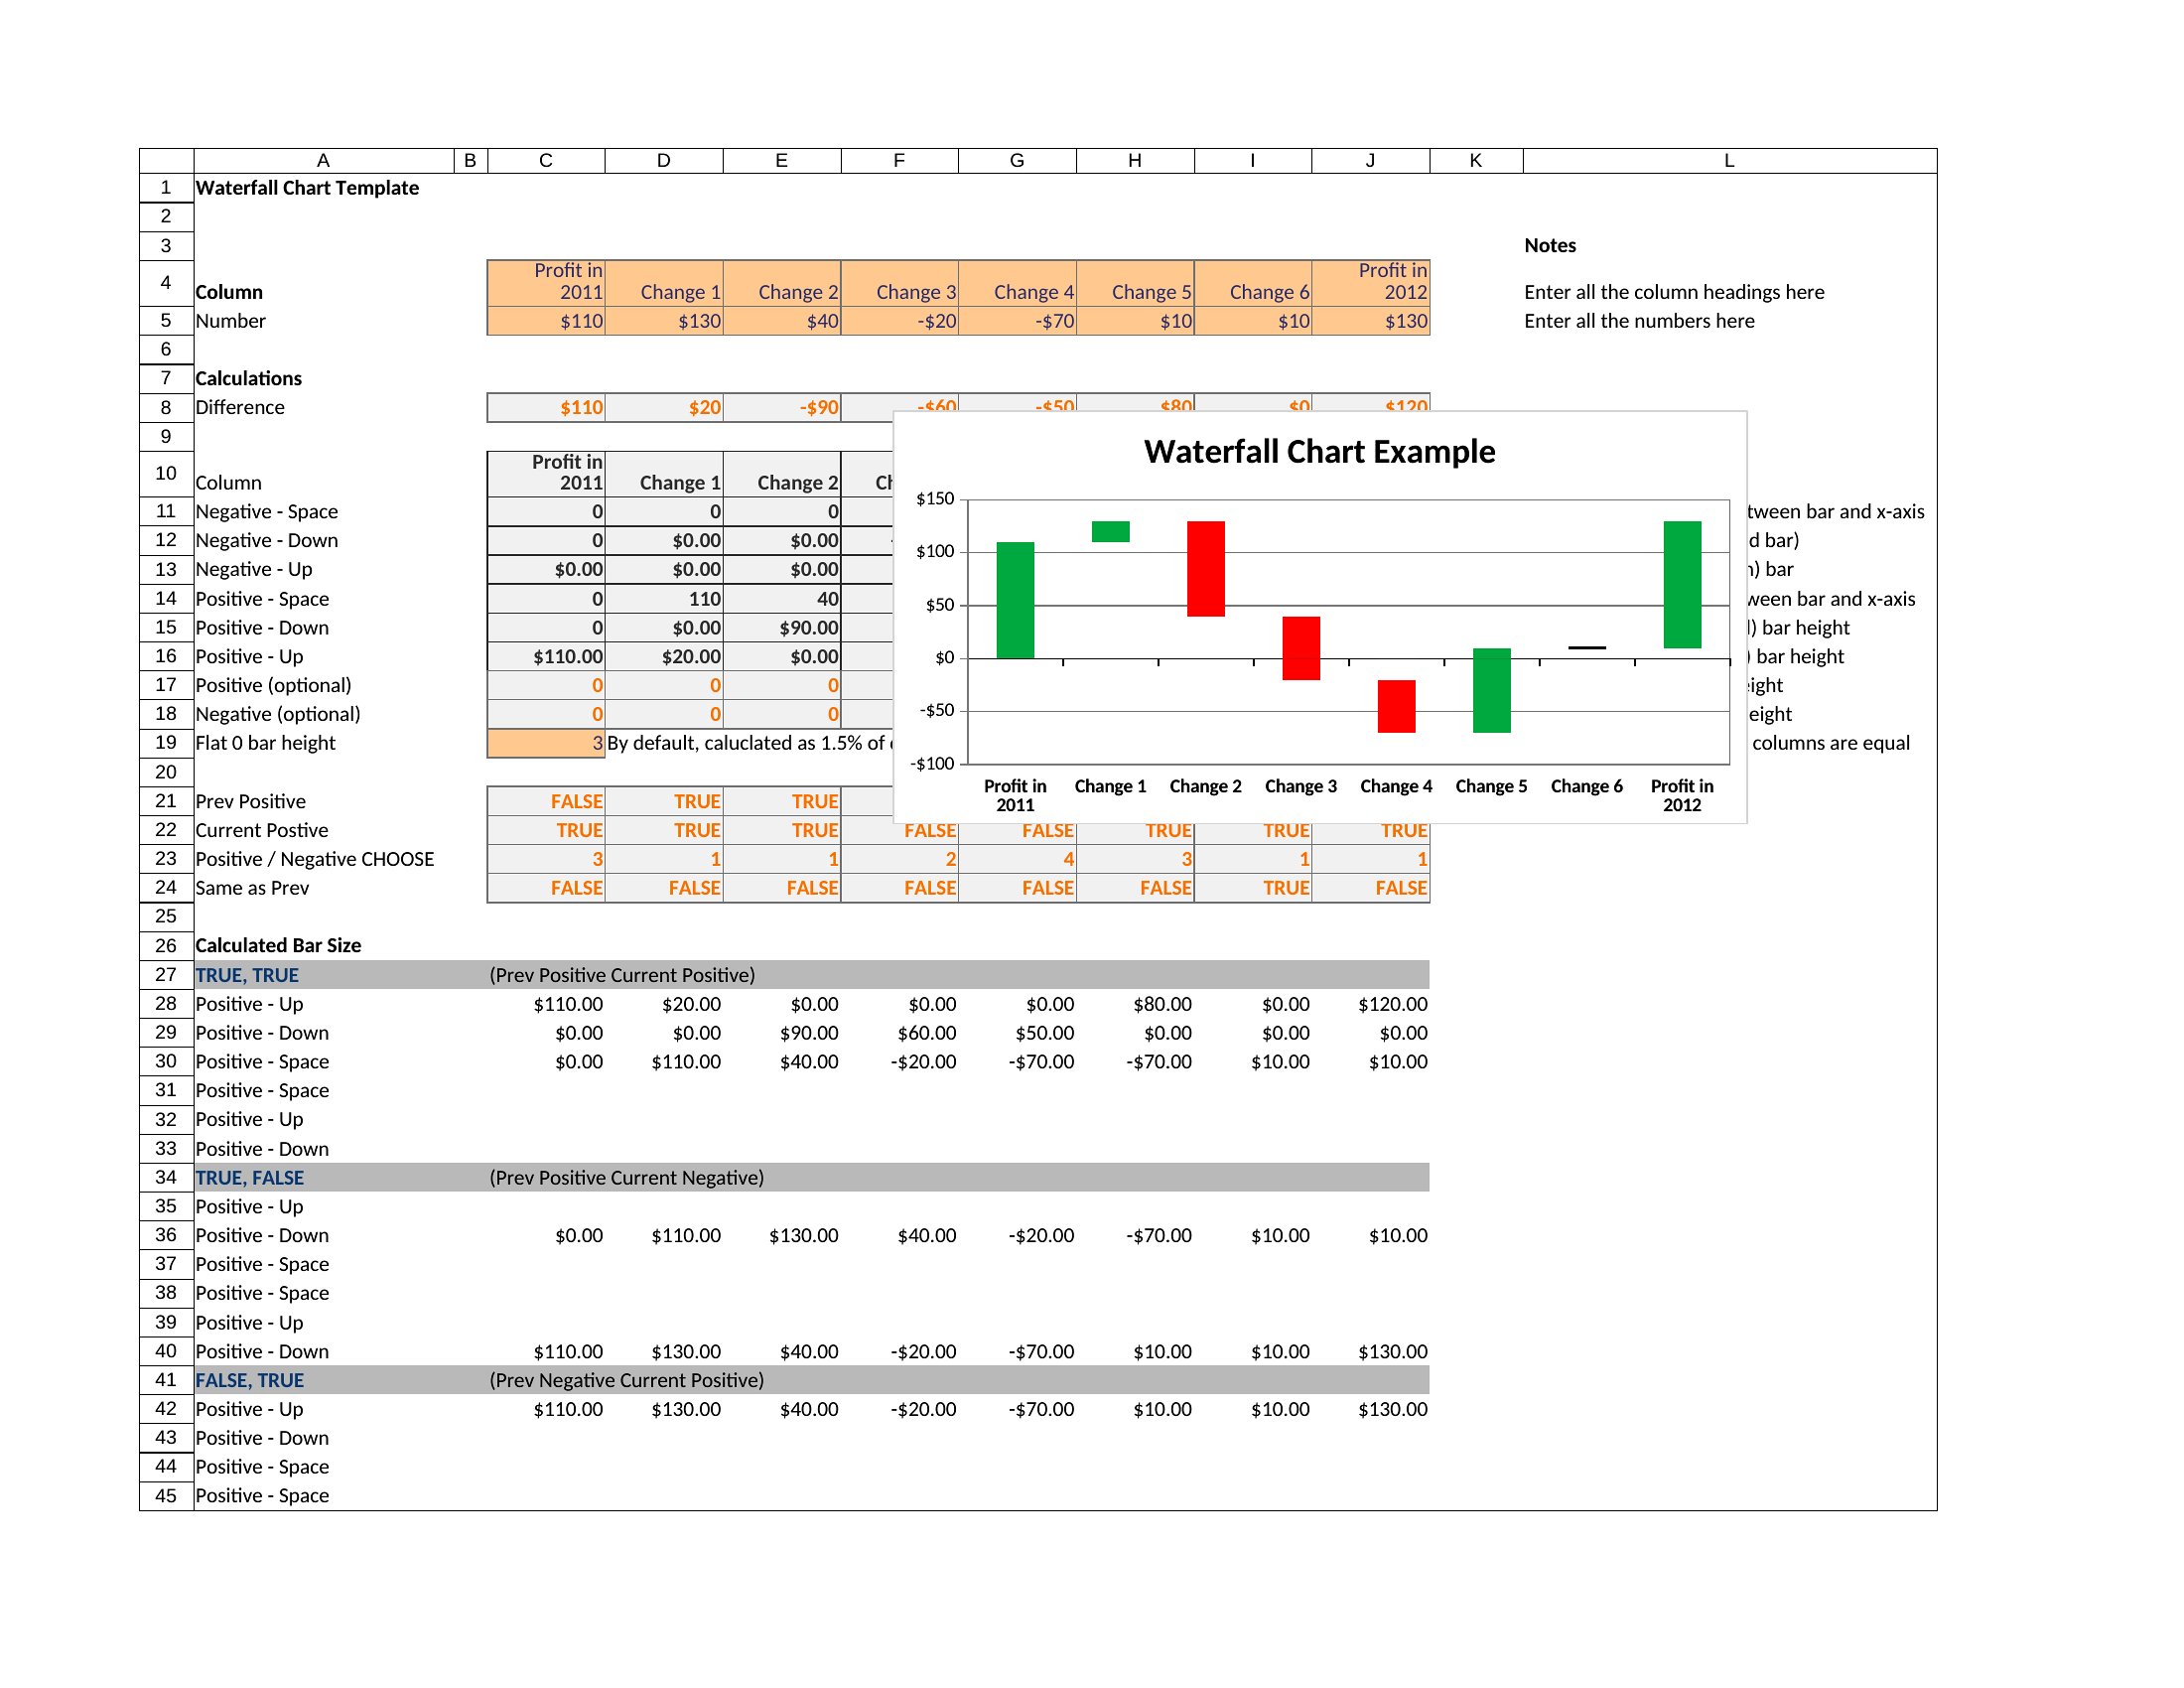
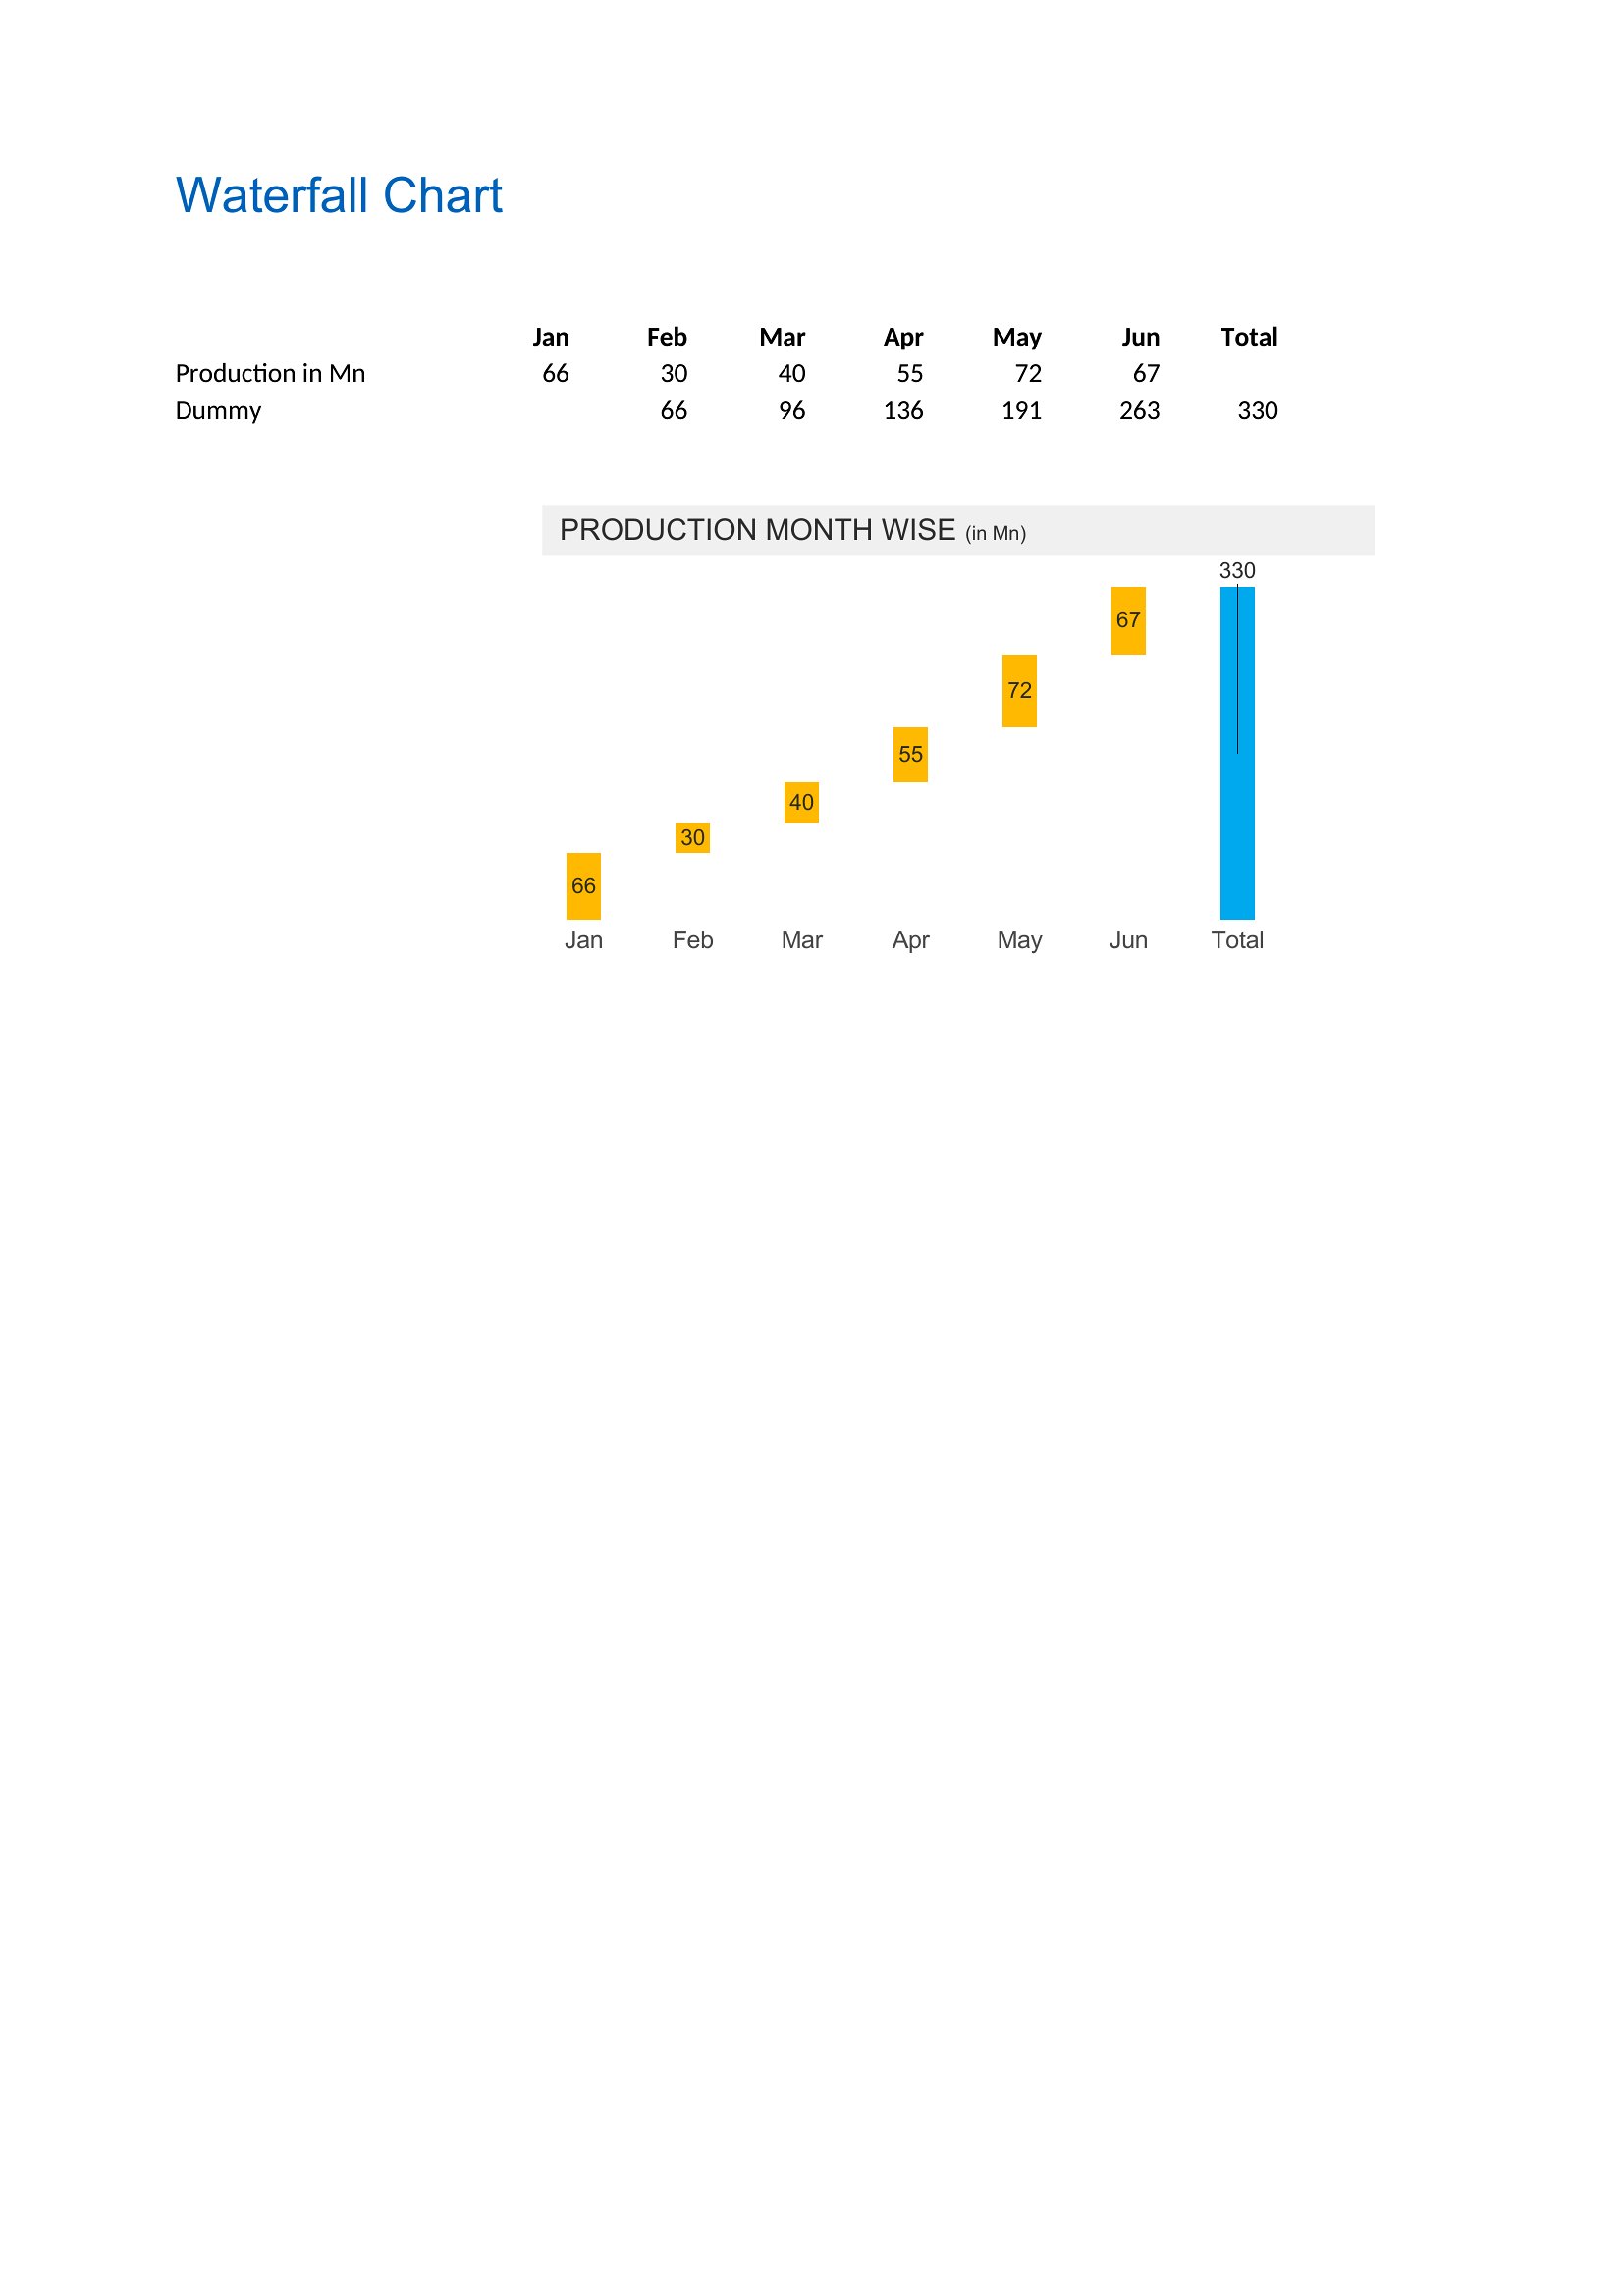
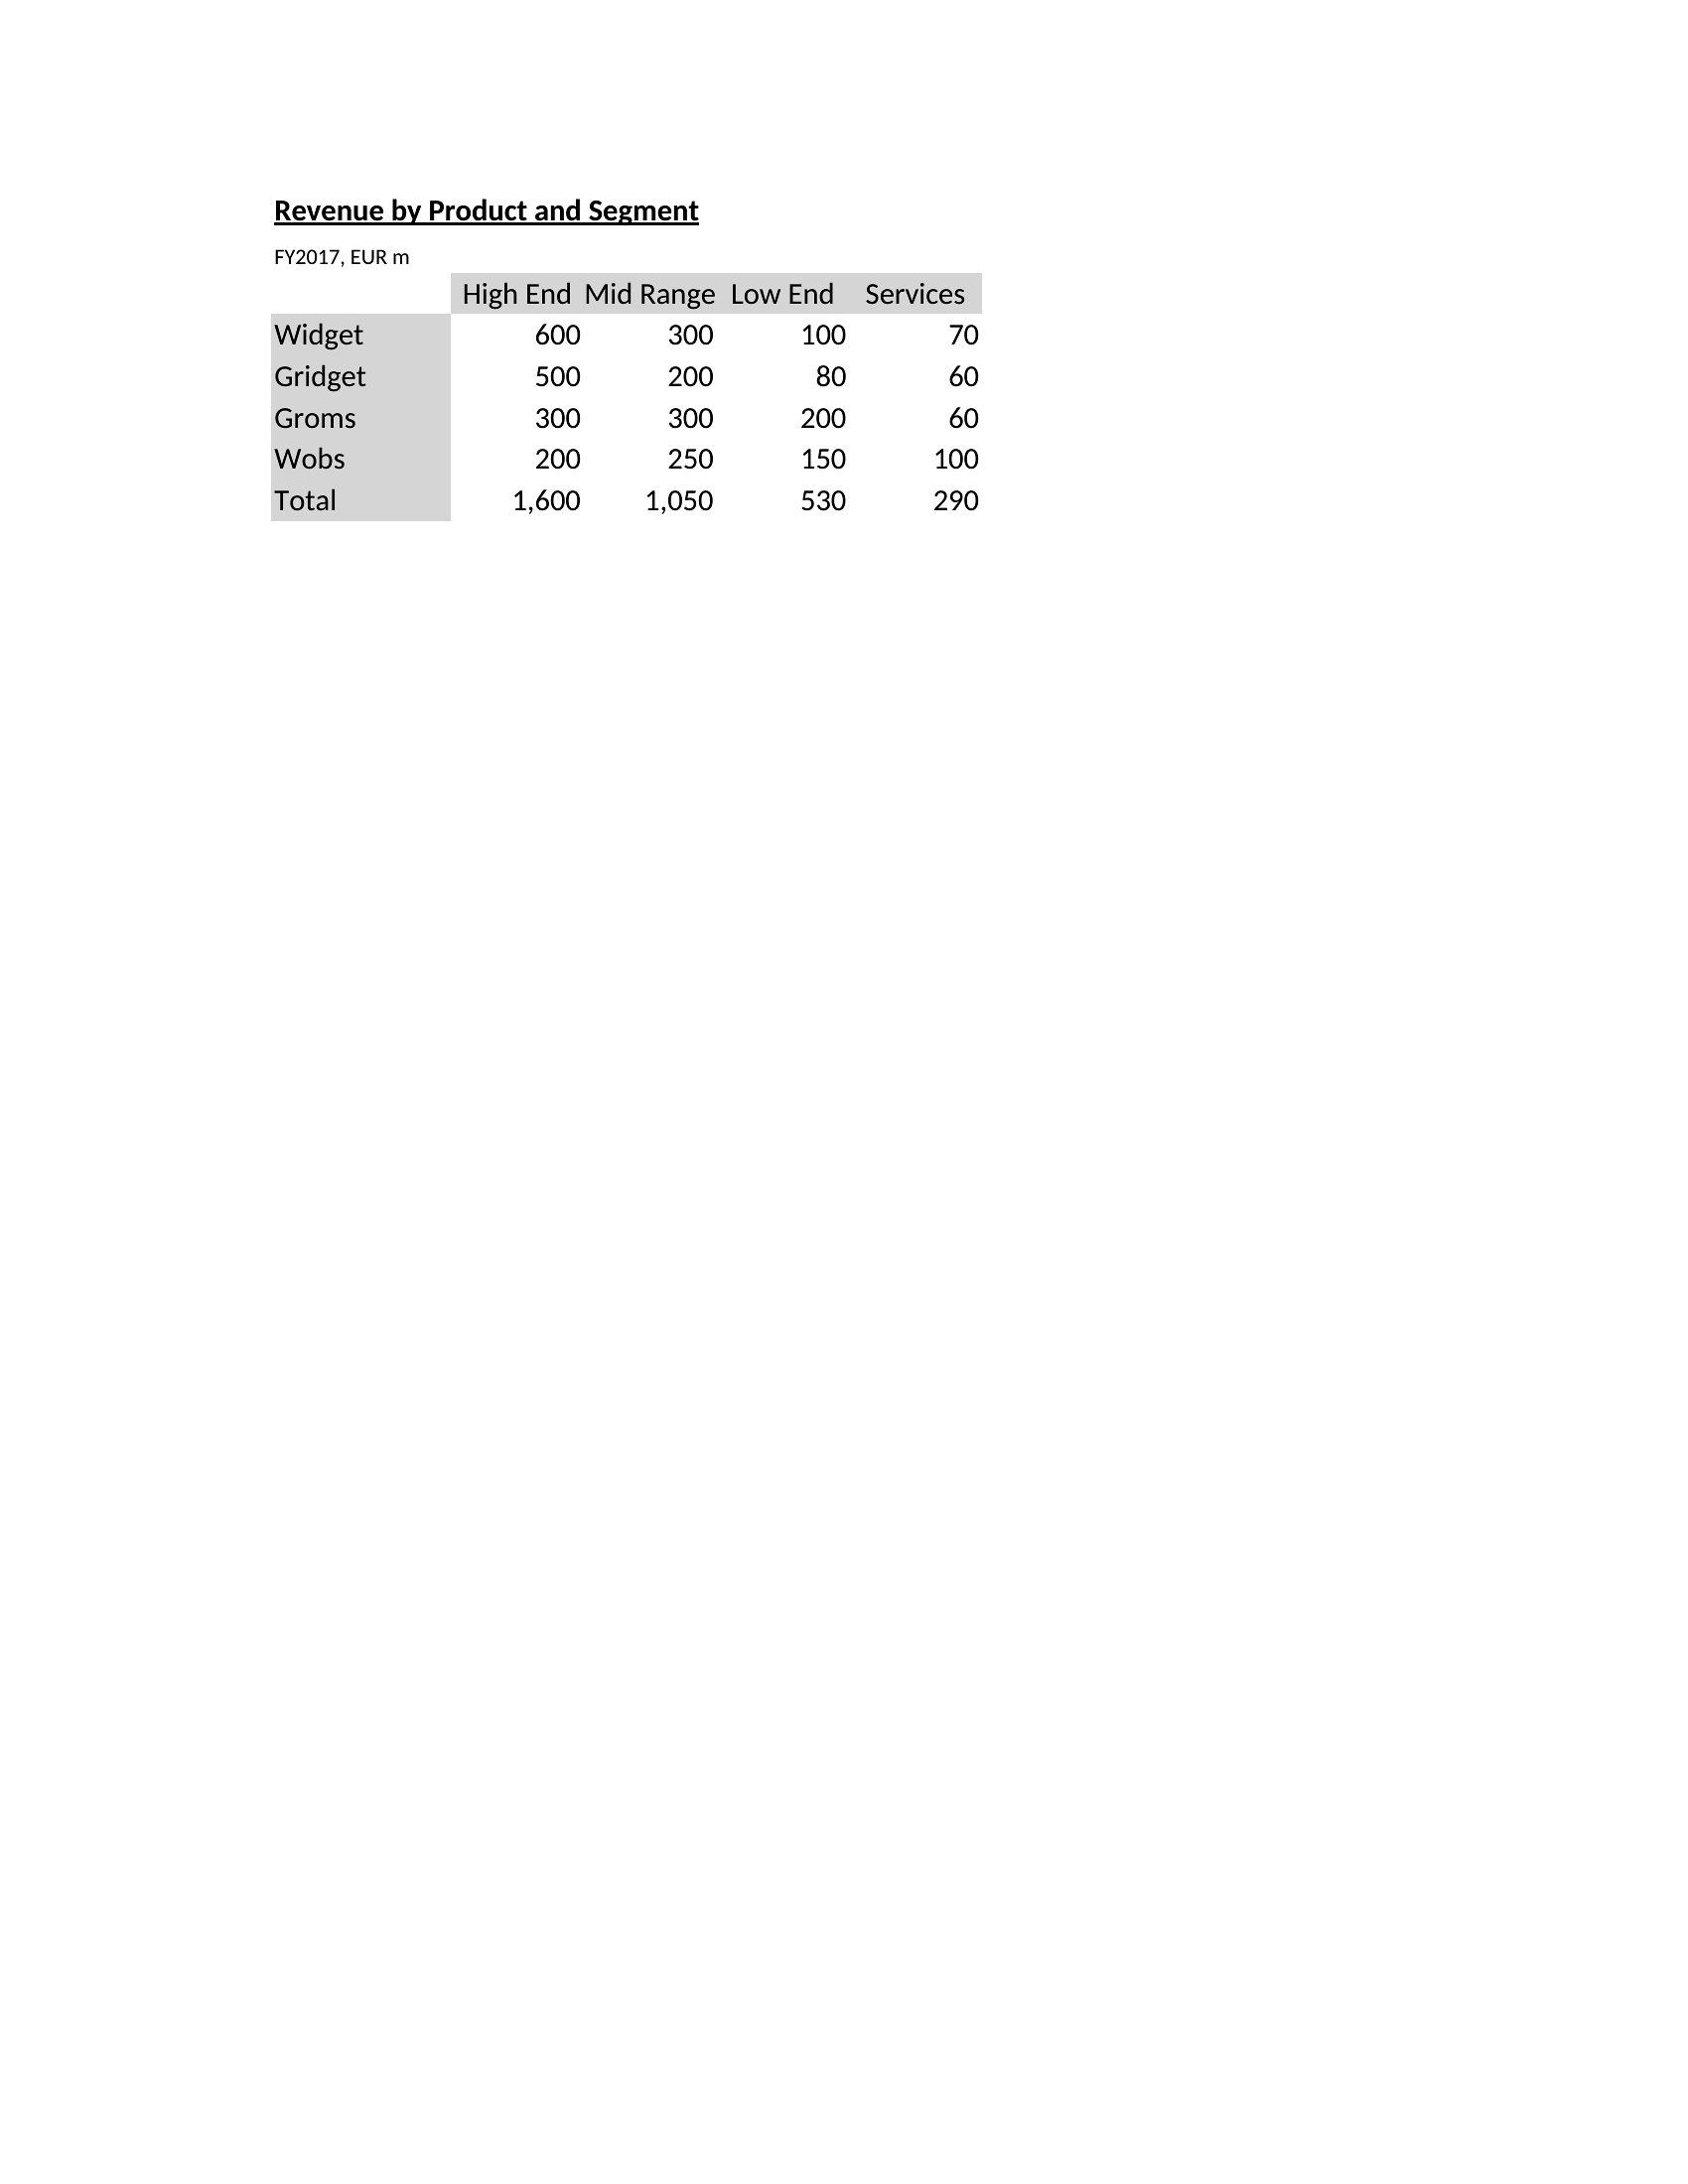
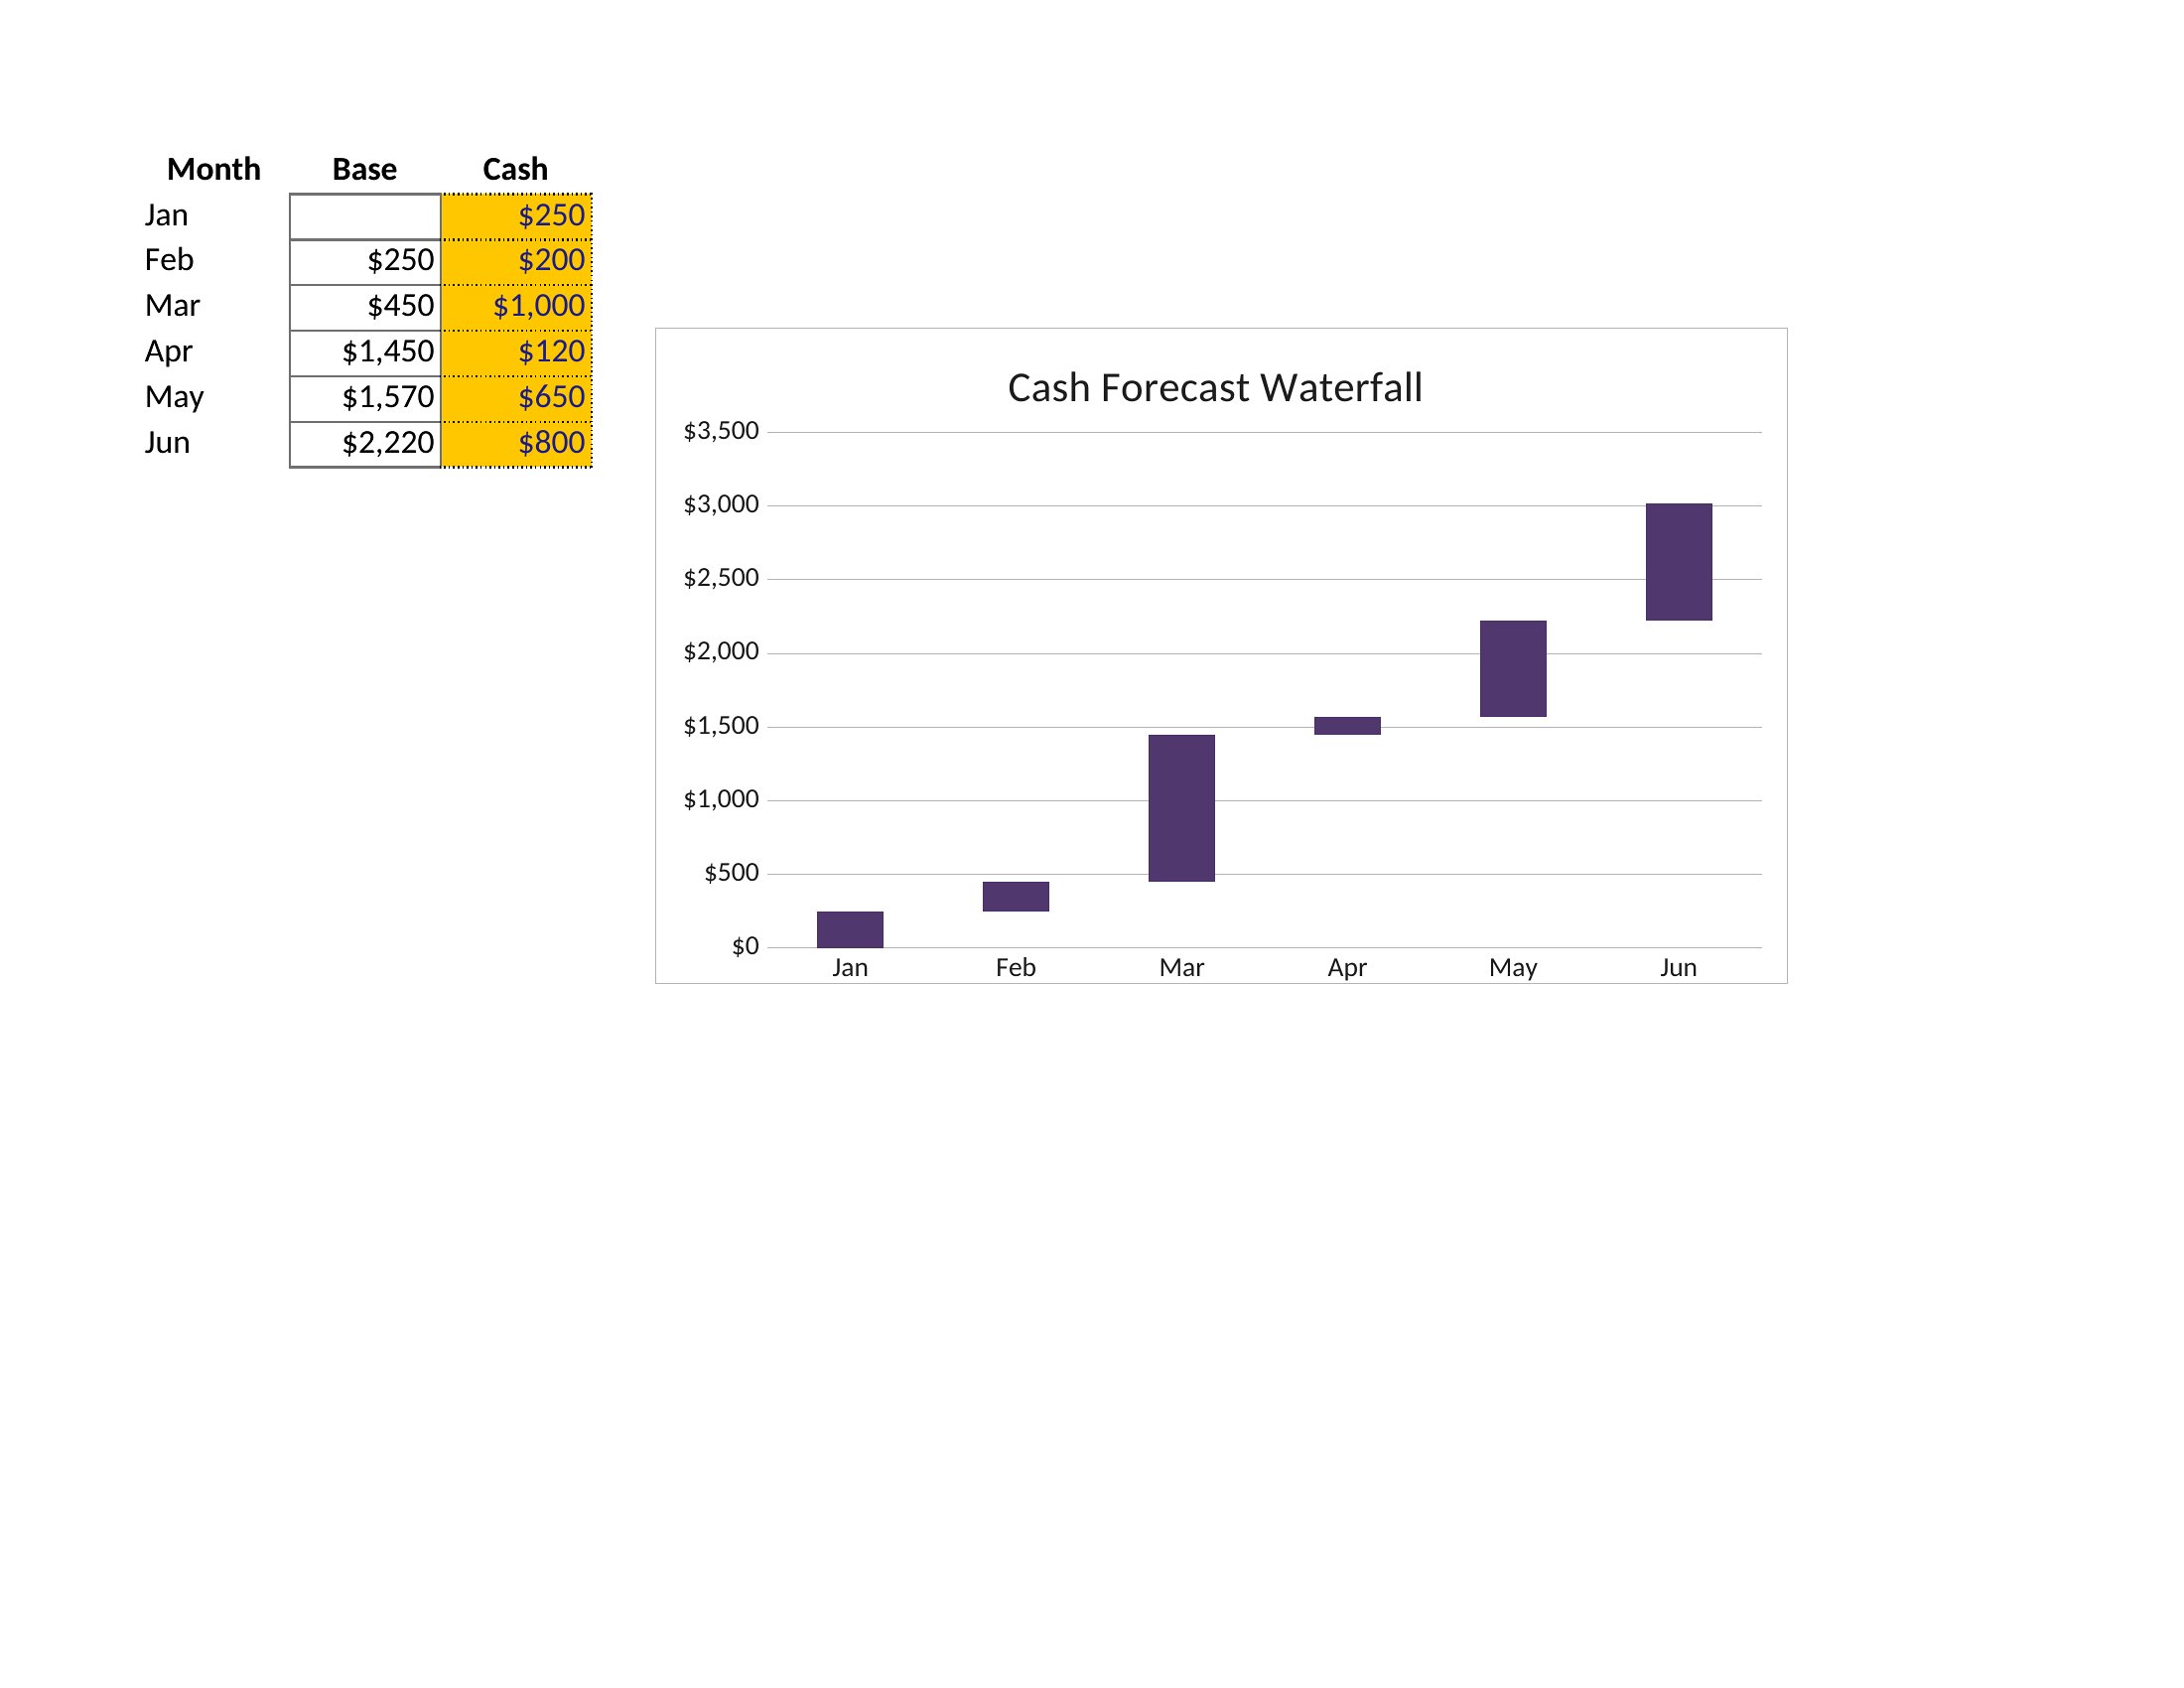
FAQ
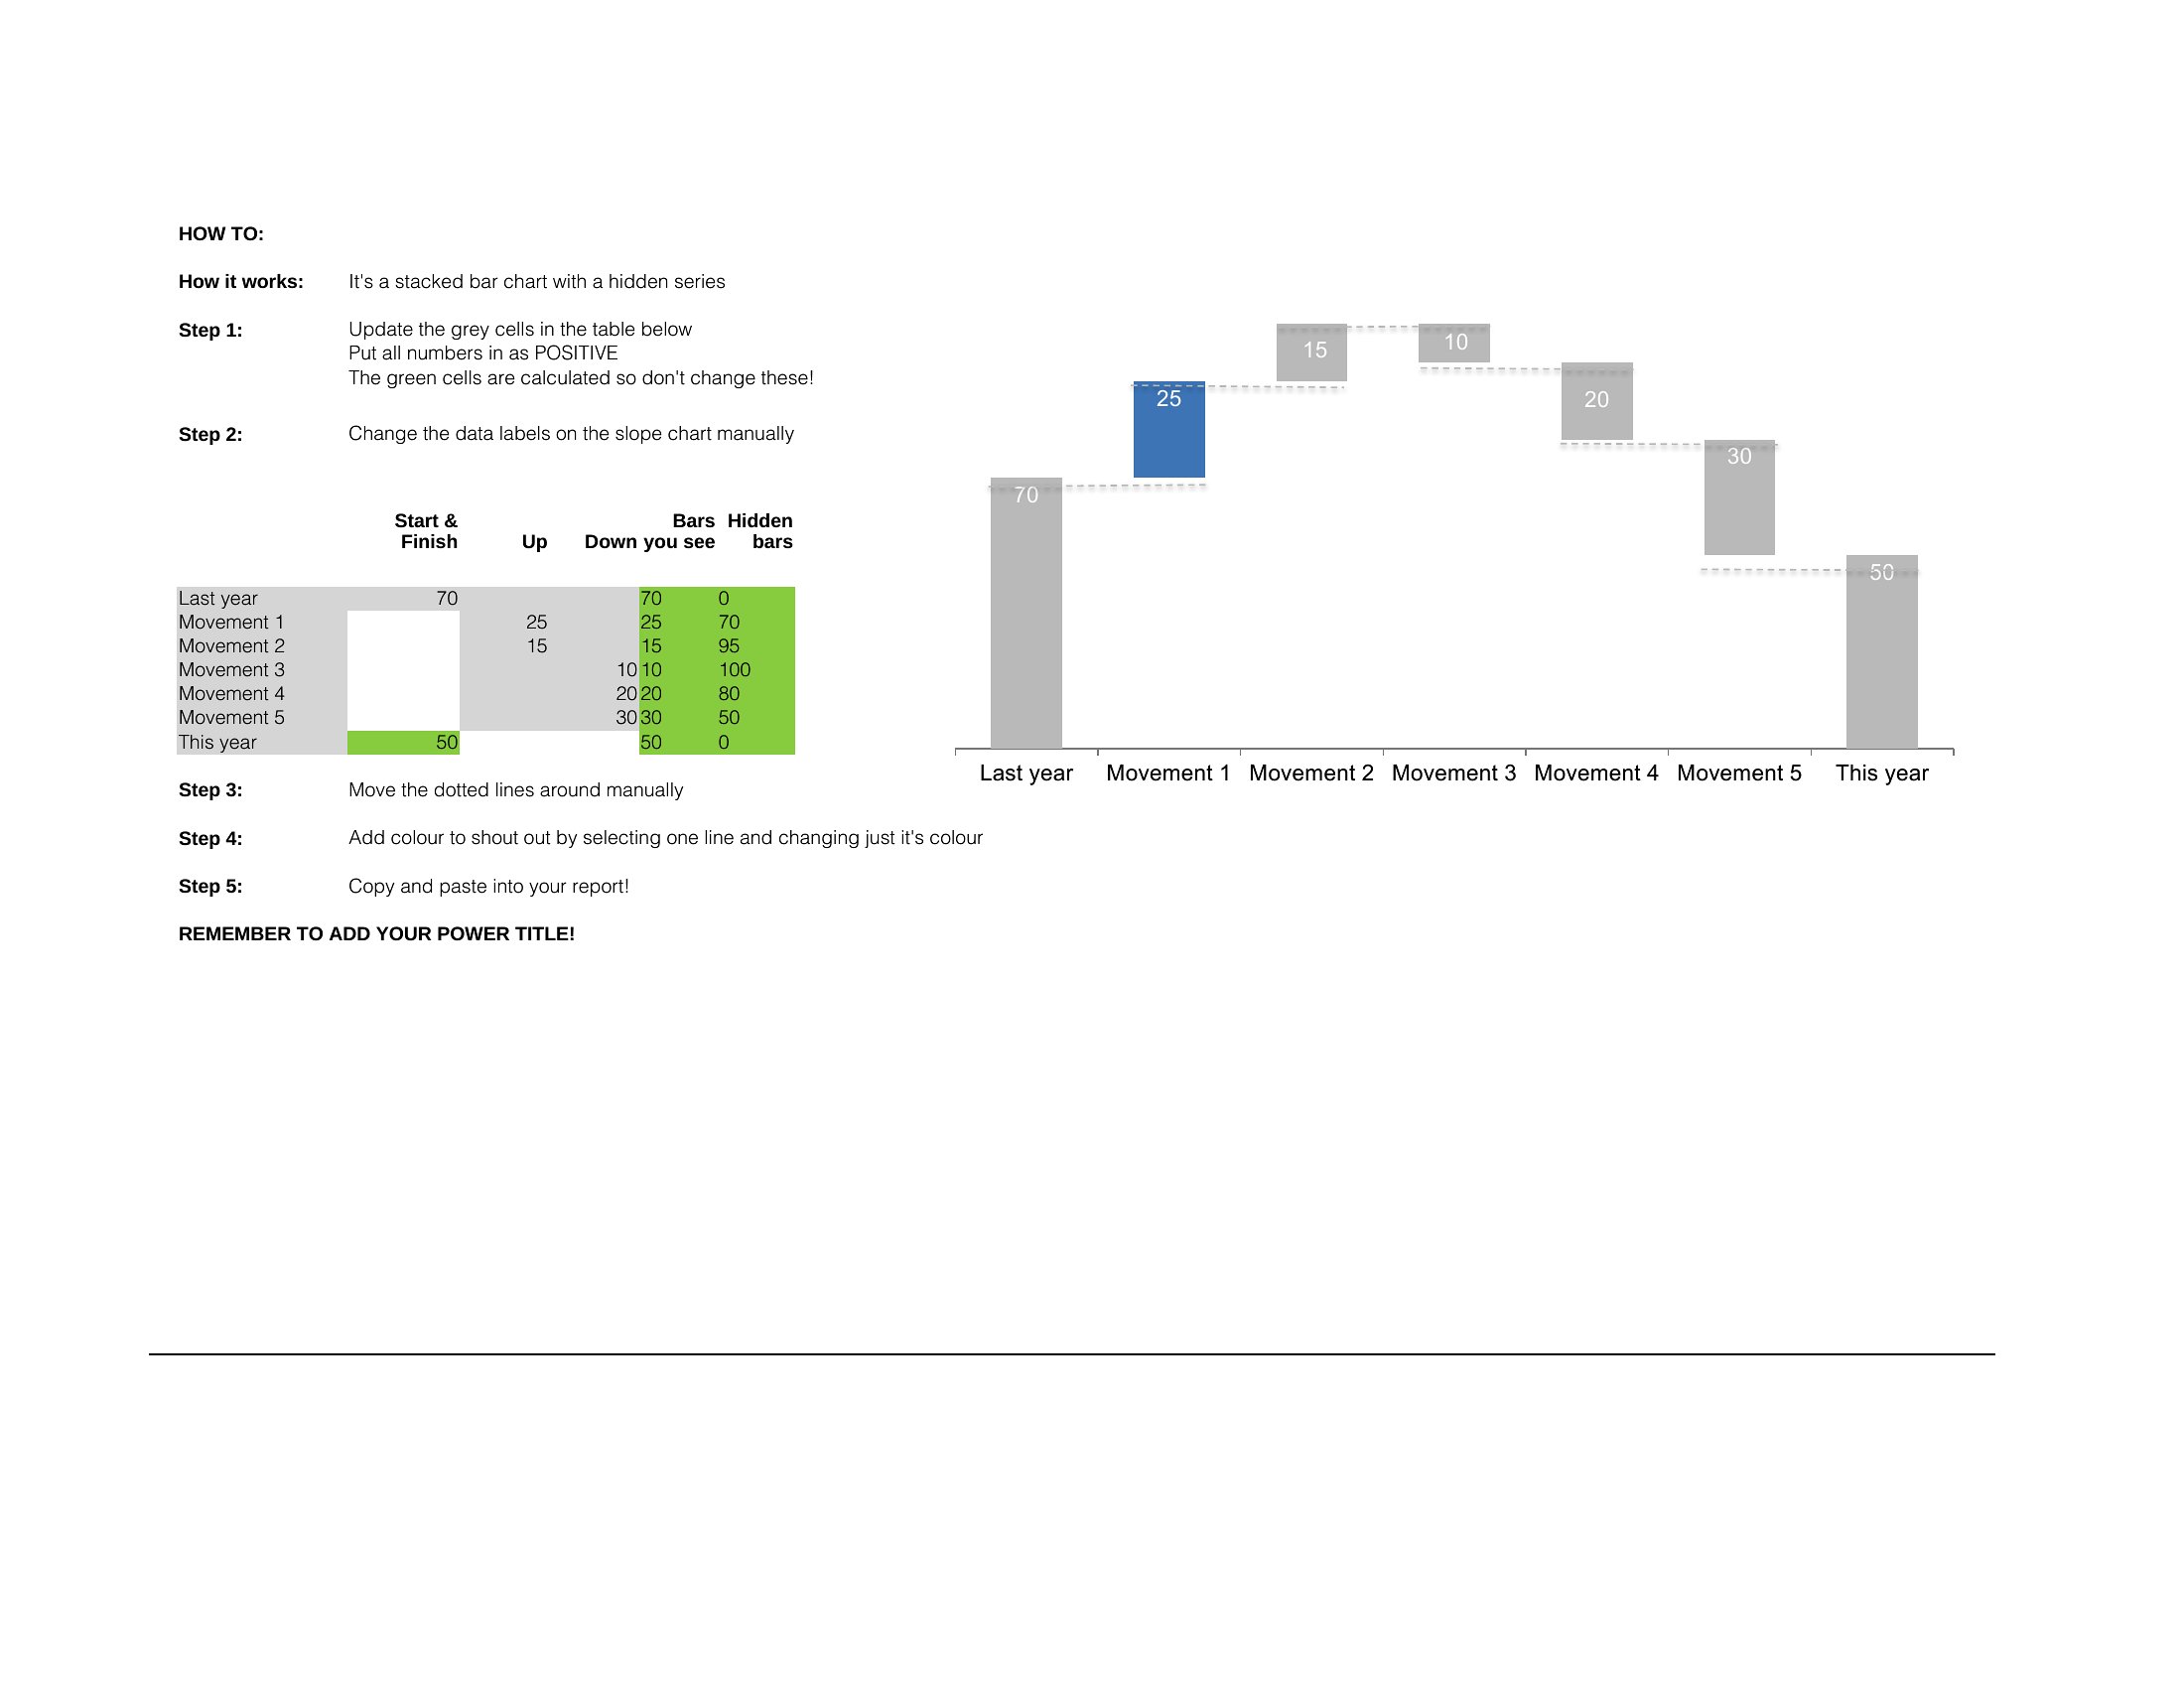
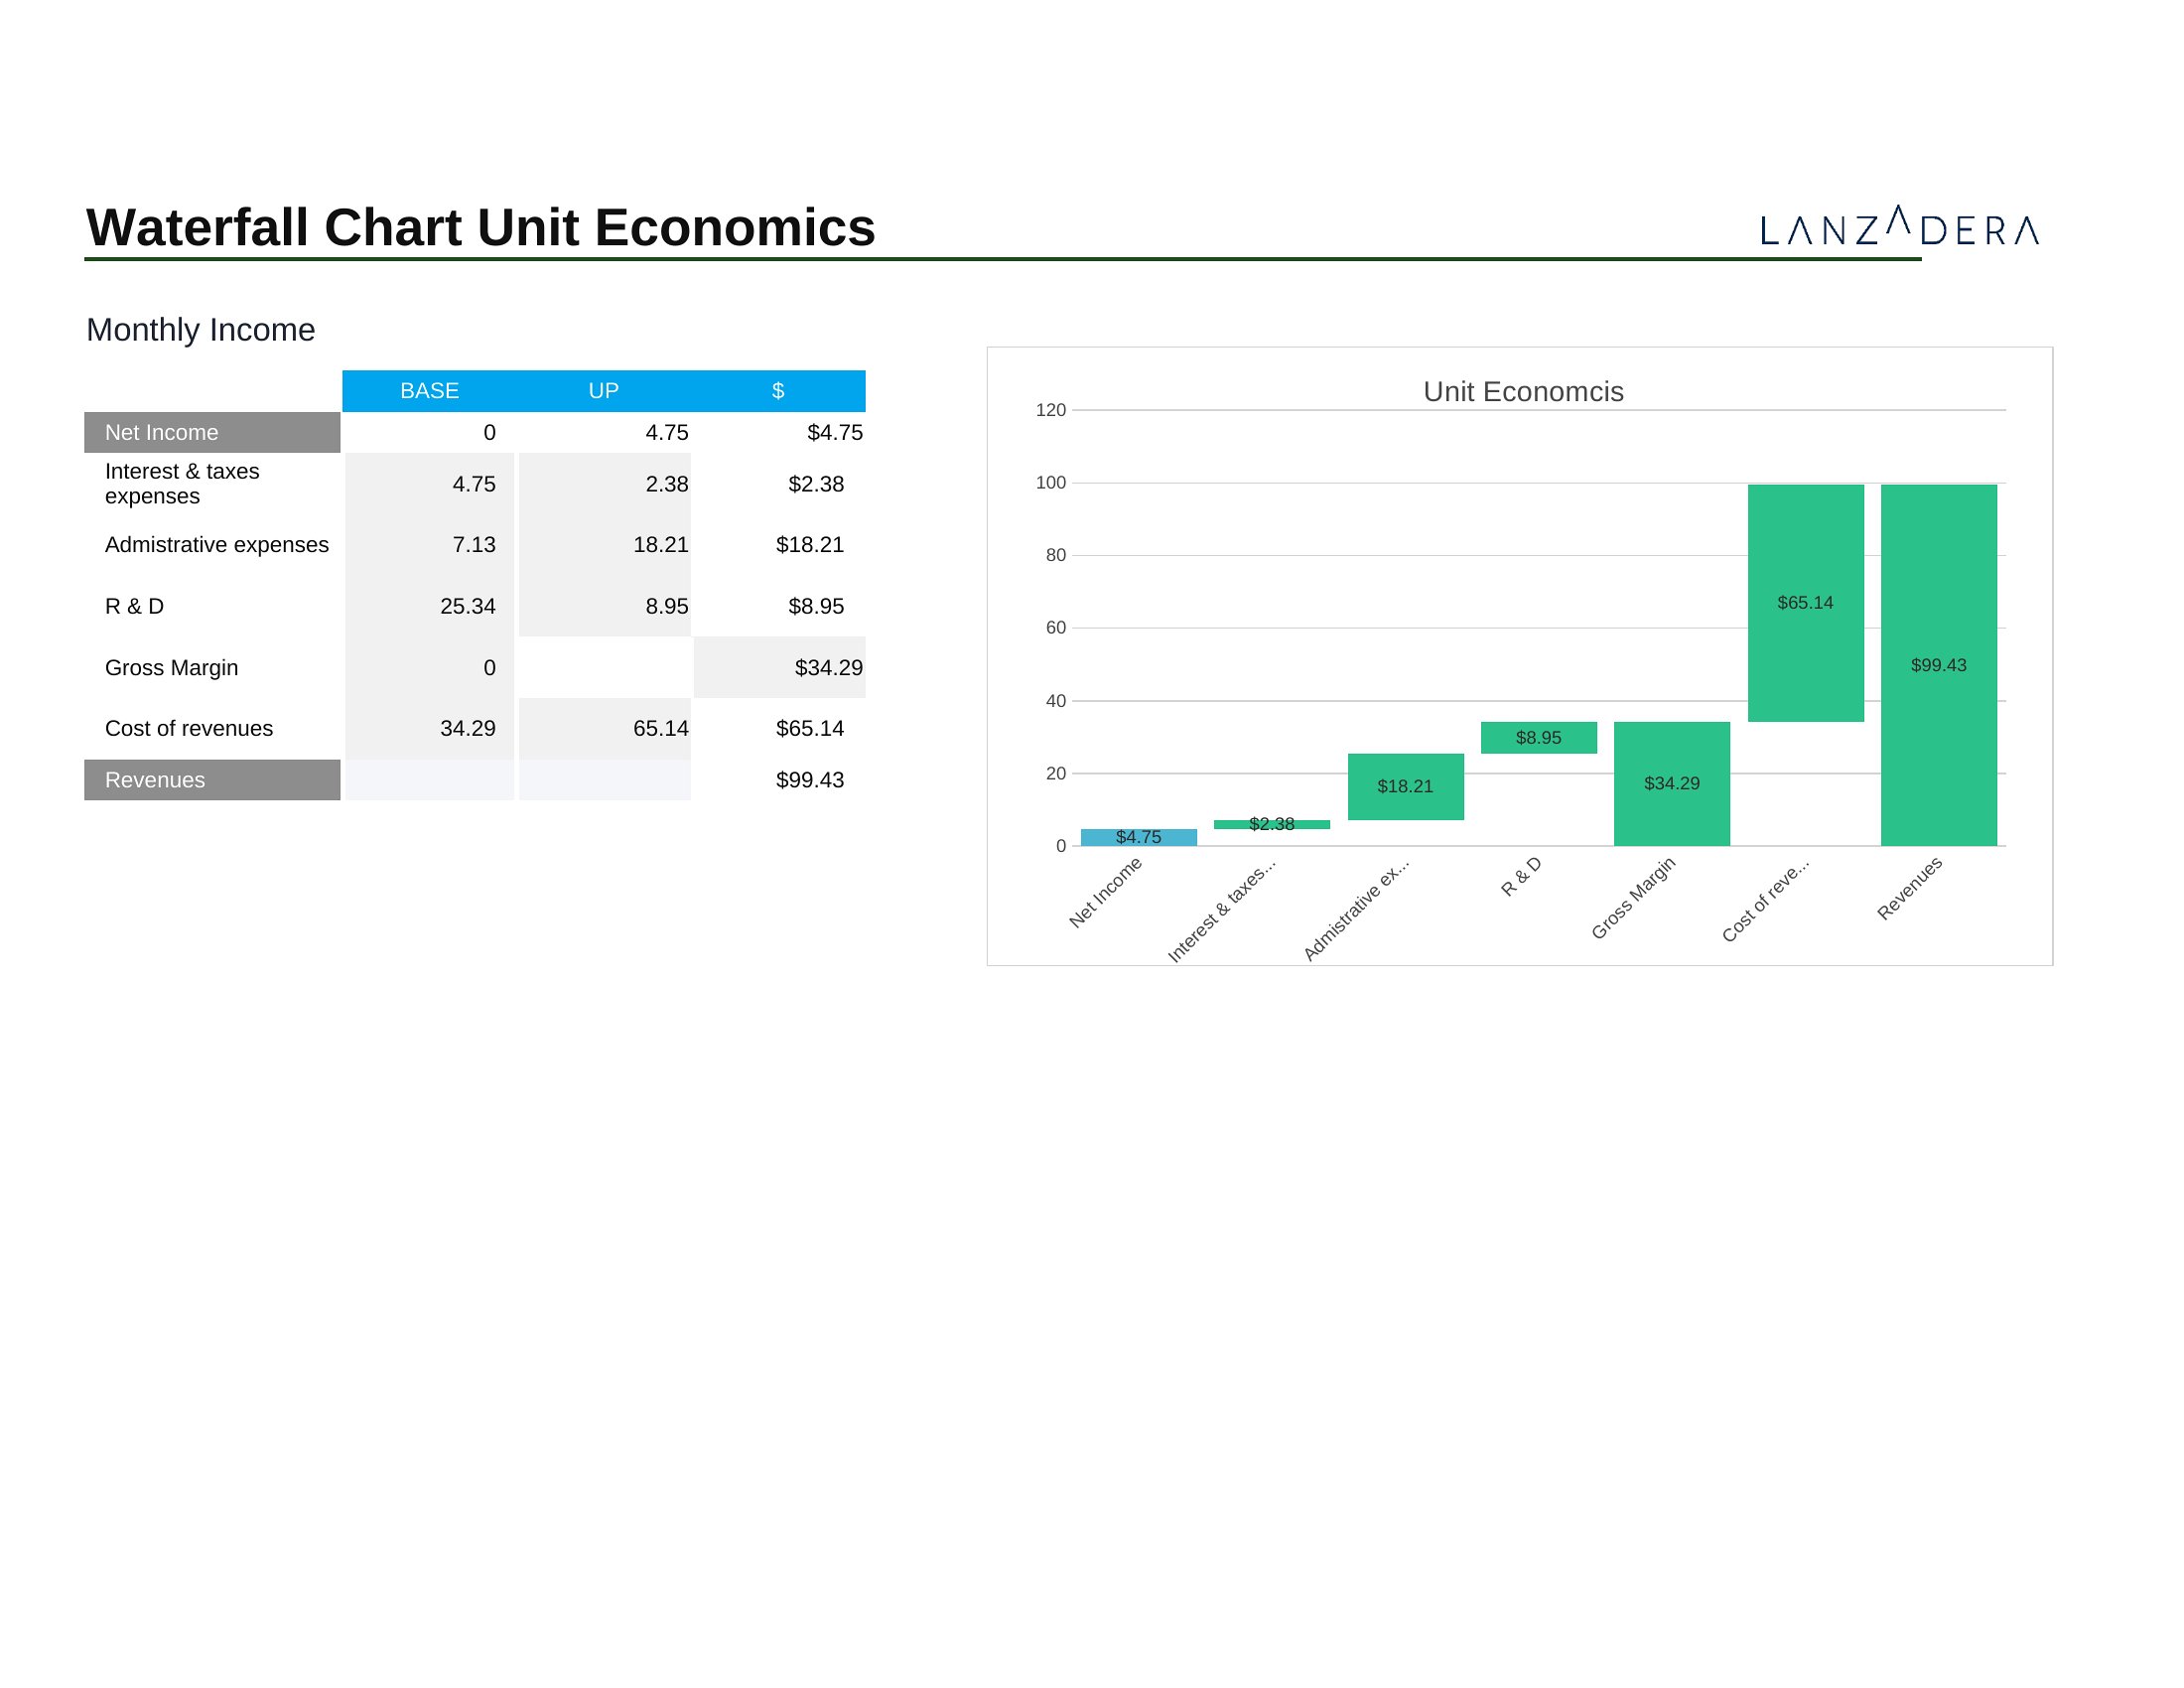
Can I adjust the chart to show negative values as downward arrows instead of upward?
Yes, most of these templates allow you to customize the direction of arrows or bars. In Excel, you can modify the conditional formatting rules or data series properties to flip the orientation for negative values. The Word versions may require pasting the chart as an object and editing it directly in Excel before inserting it back.
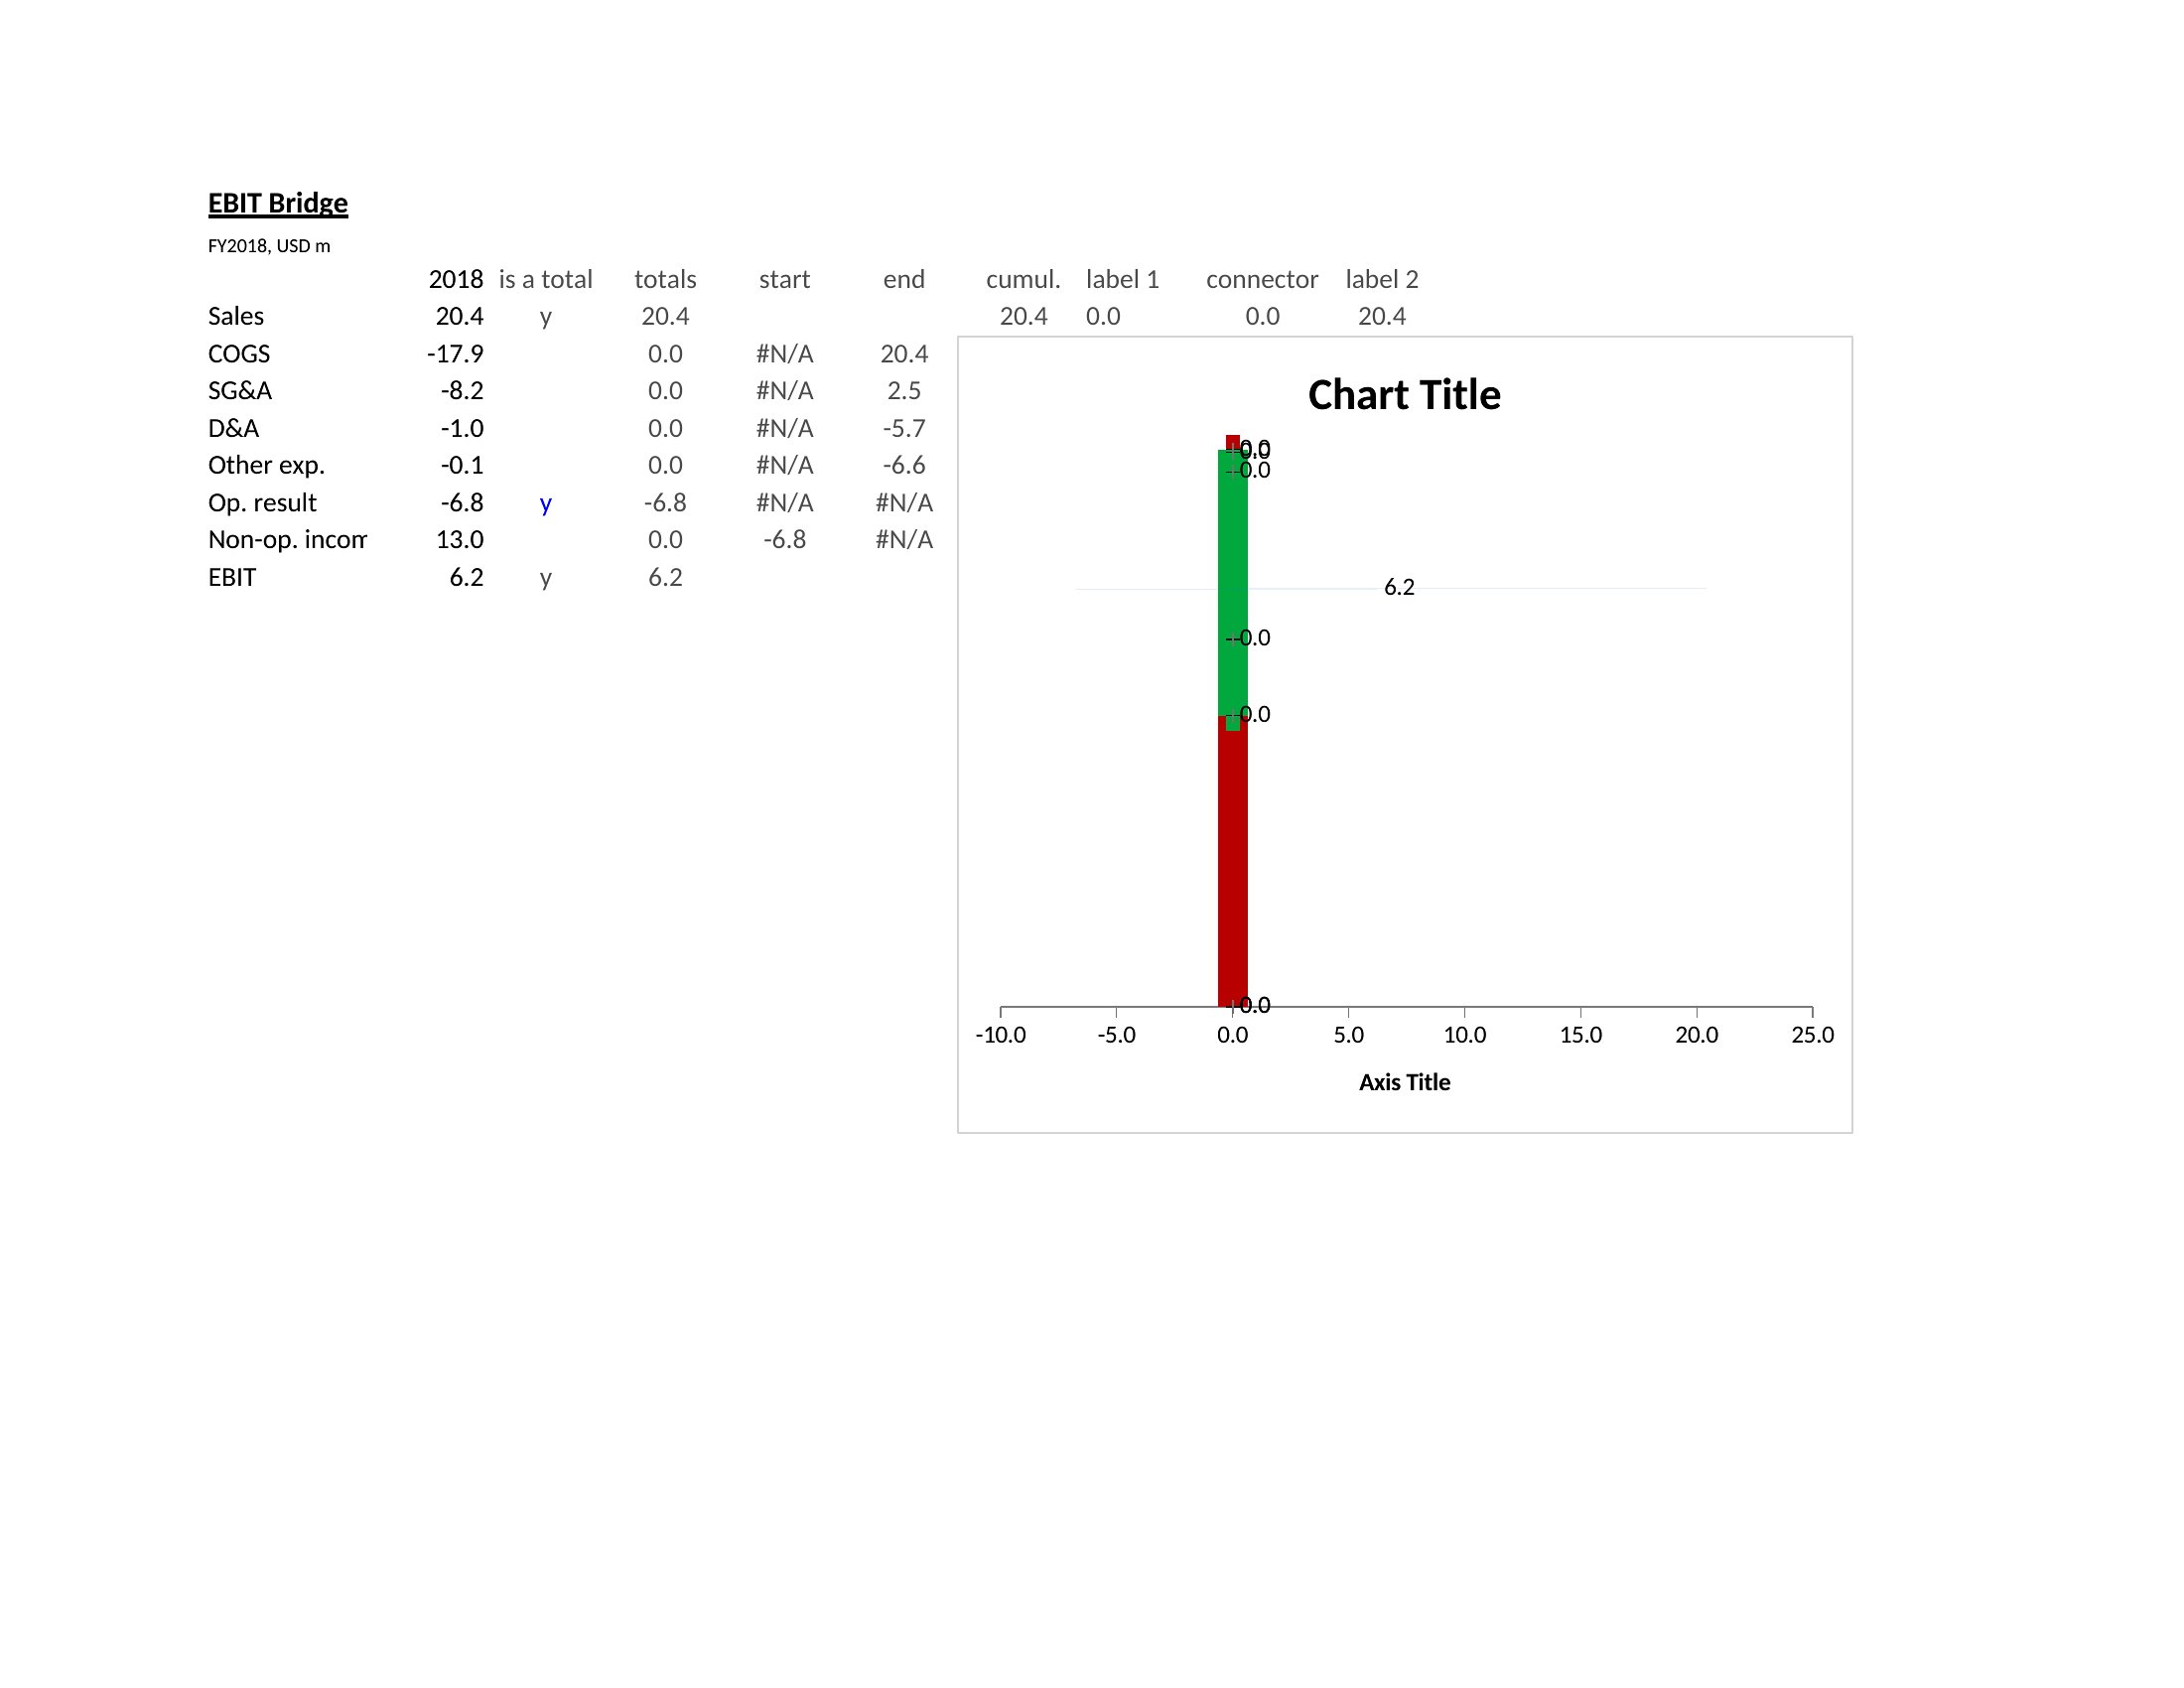
What if my final total doesn’t match the expected outcome?
Double-check the starting value and each incremental change for typos or misplaced decimals. The Excel templates are designed to auto-calculate totals, so discrepancies usually stem from input errors. For Word versions, ensure the chart is linked to the correct data range or repaste it from Excel to refresh the calculations.
Do these templates work for comparing multiple scenarios, like ‘best-case’ vs. ‘worst-case’ budgets?
The templates focus on single-series waterfall charts, which are best for one scenario at a time. To compare scenarios, you’ll need to create separate charts or use Excel’s ‘What-If Analysis’ tools to layer multiple waterfall charts side by side. For side-by-side comparisons in Word, consider inserting multiple static chart images with clear labels.
Comments
Join the conversation
Sign in to share your thoughts and leave a comment on this resource.