
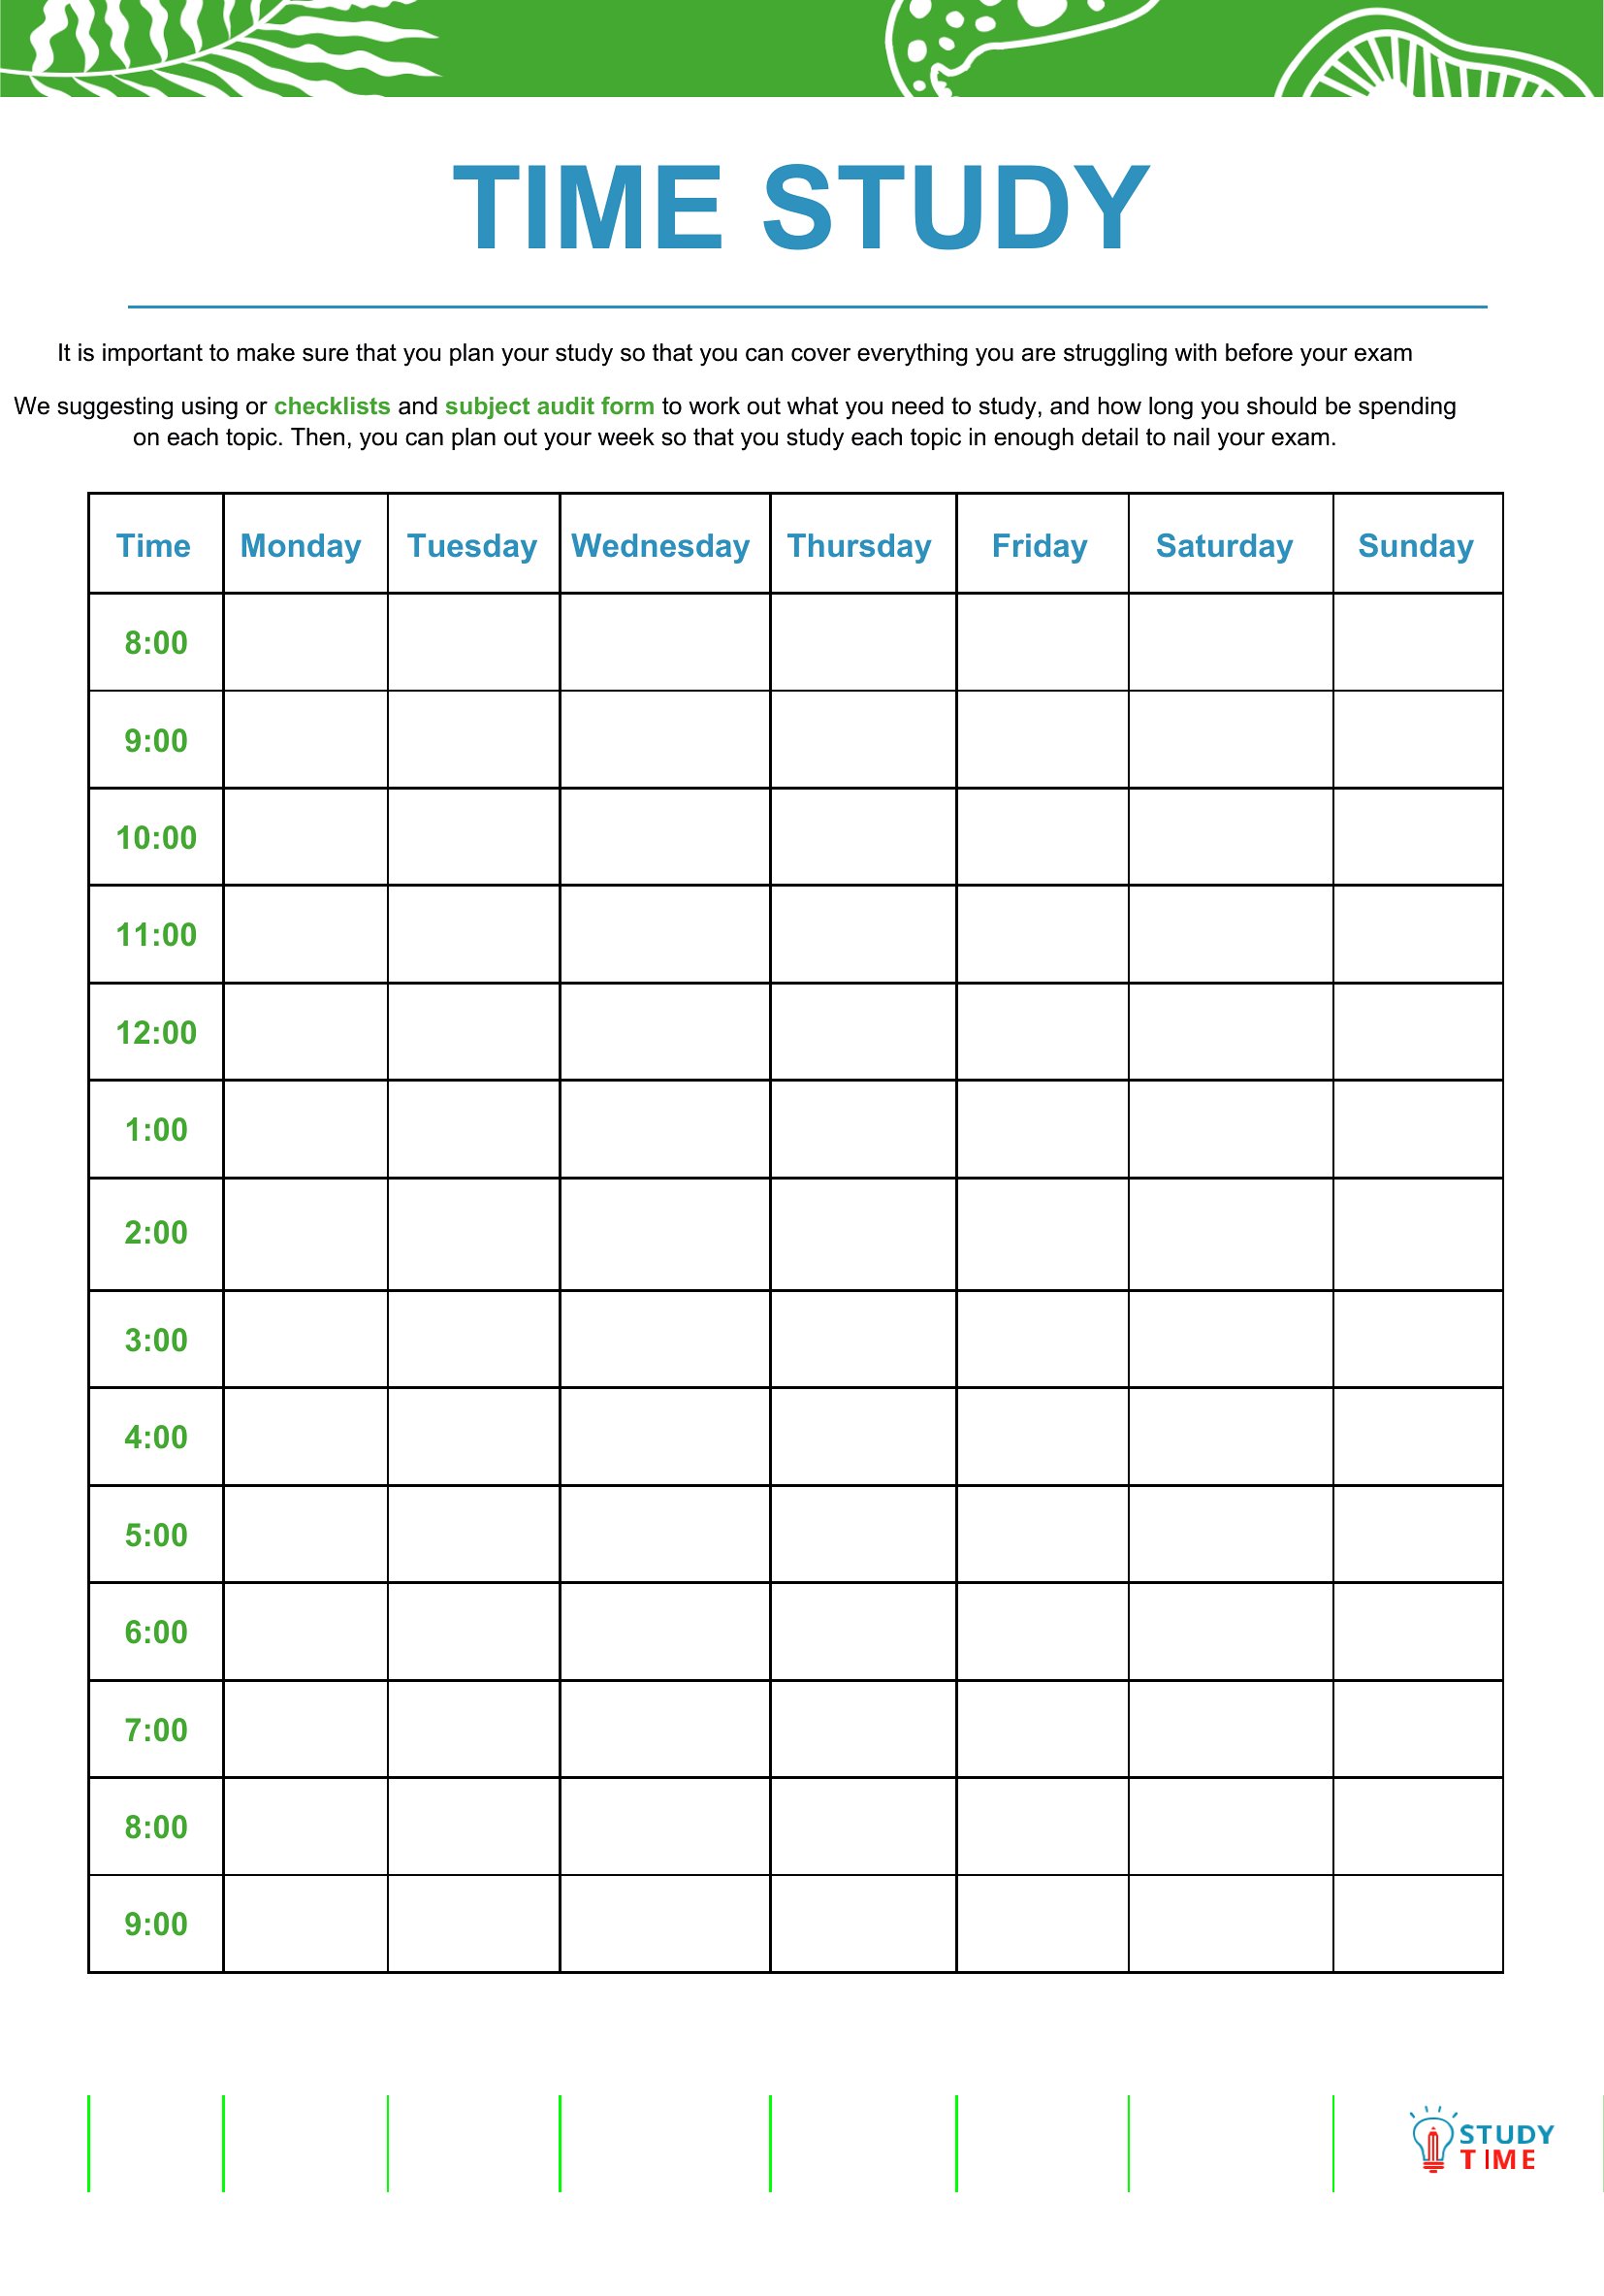
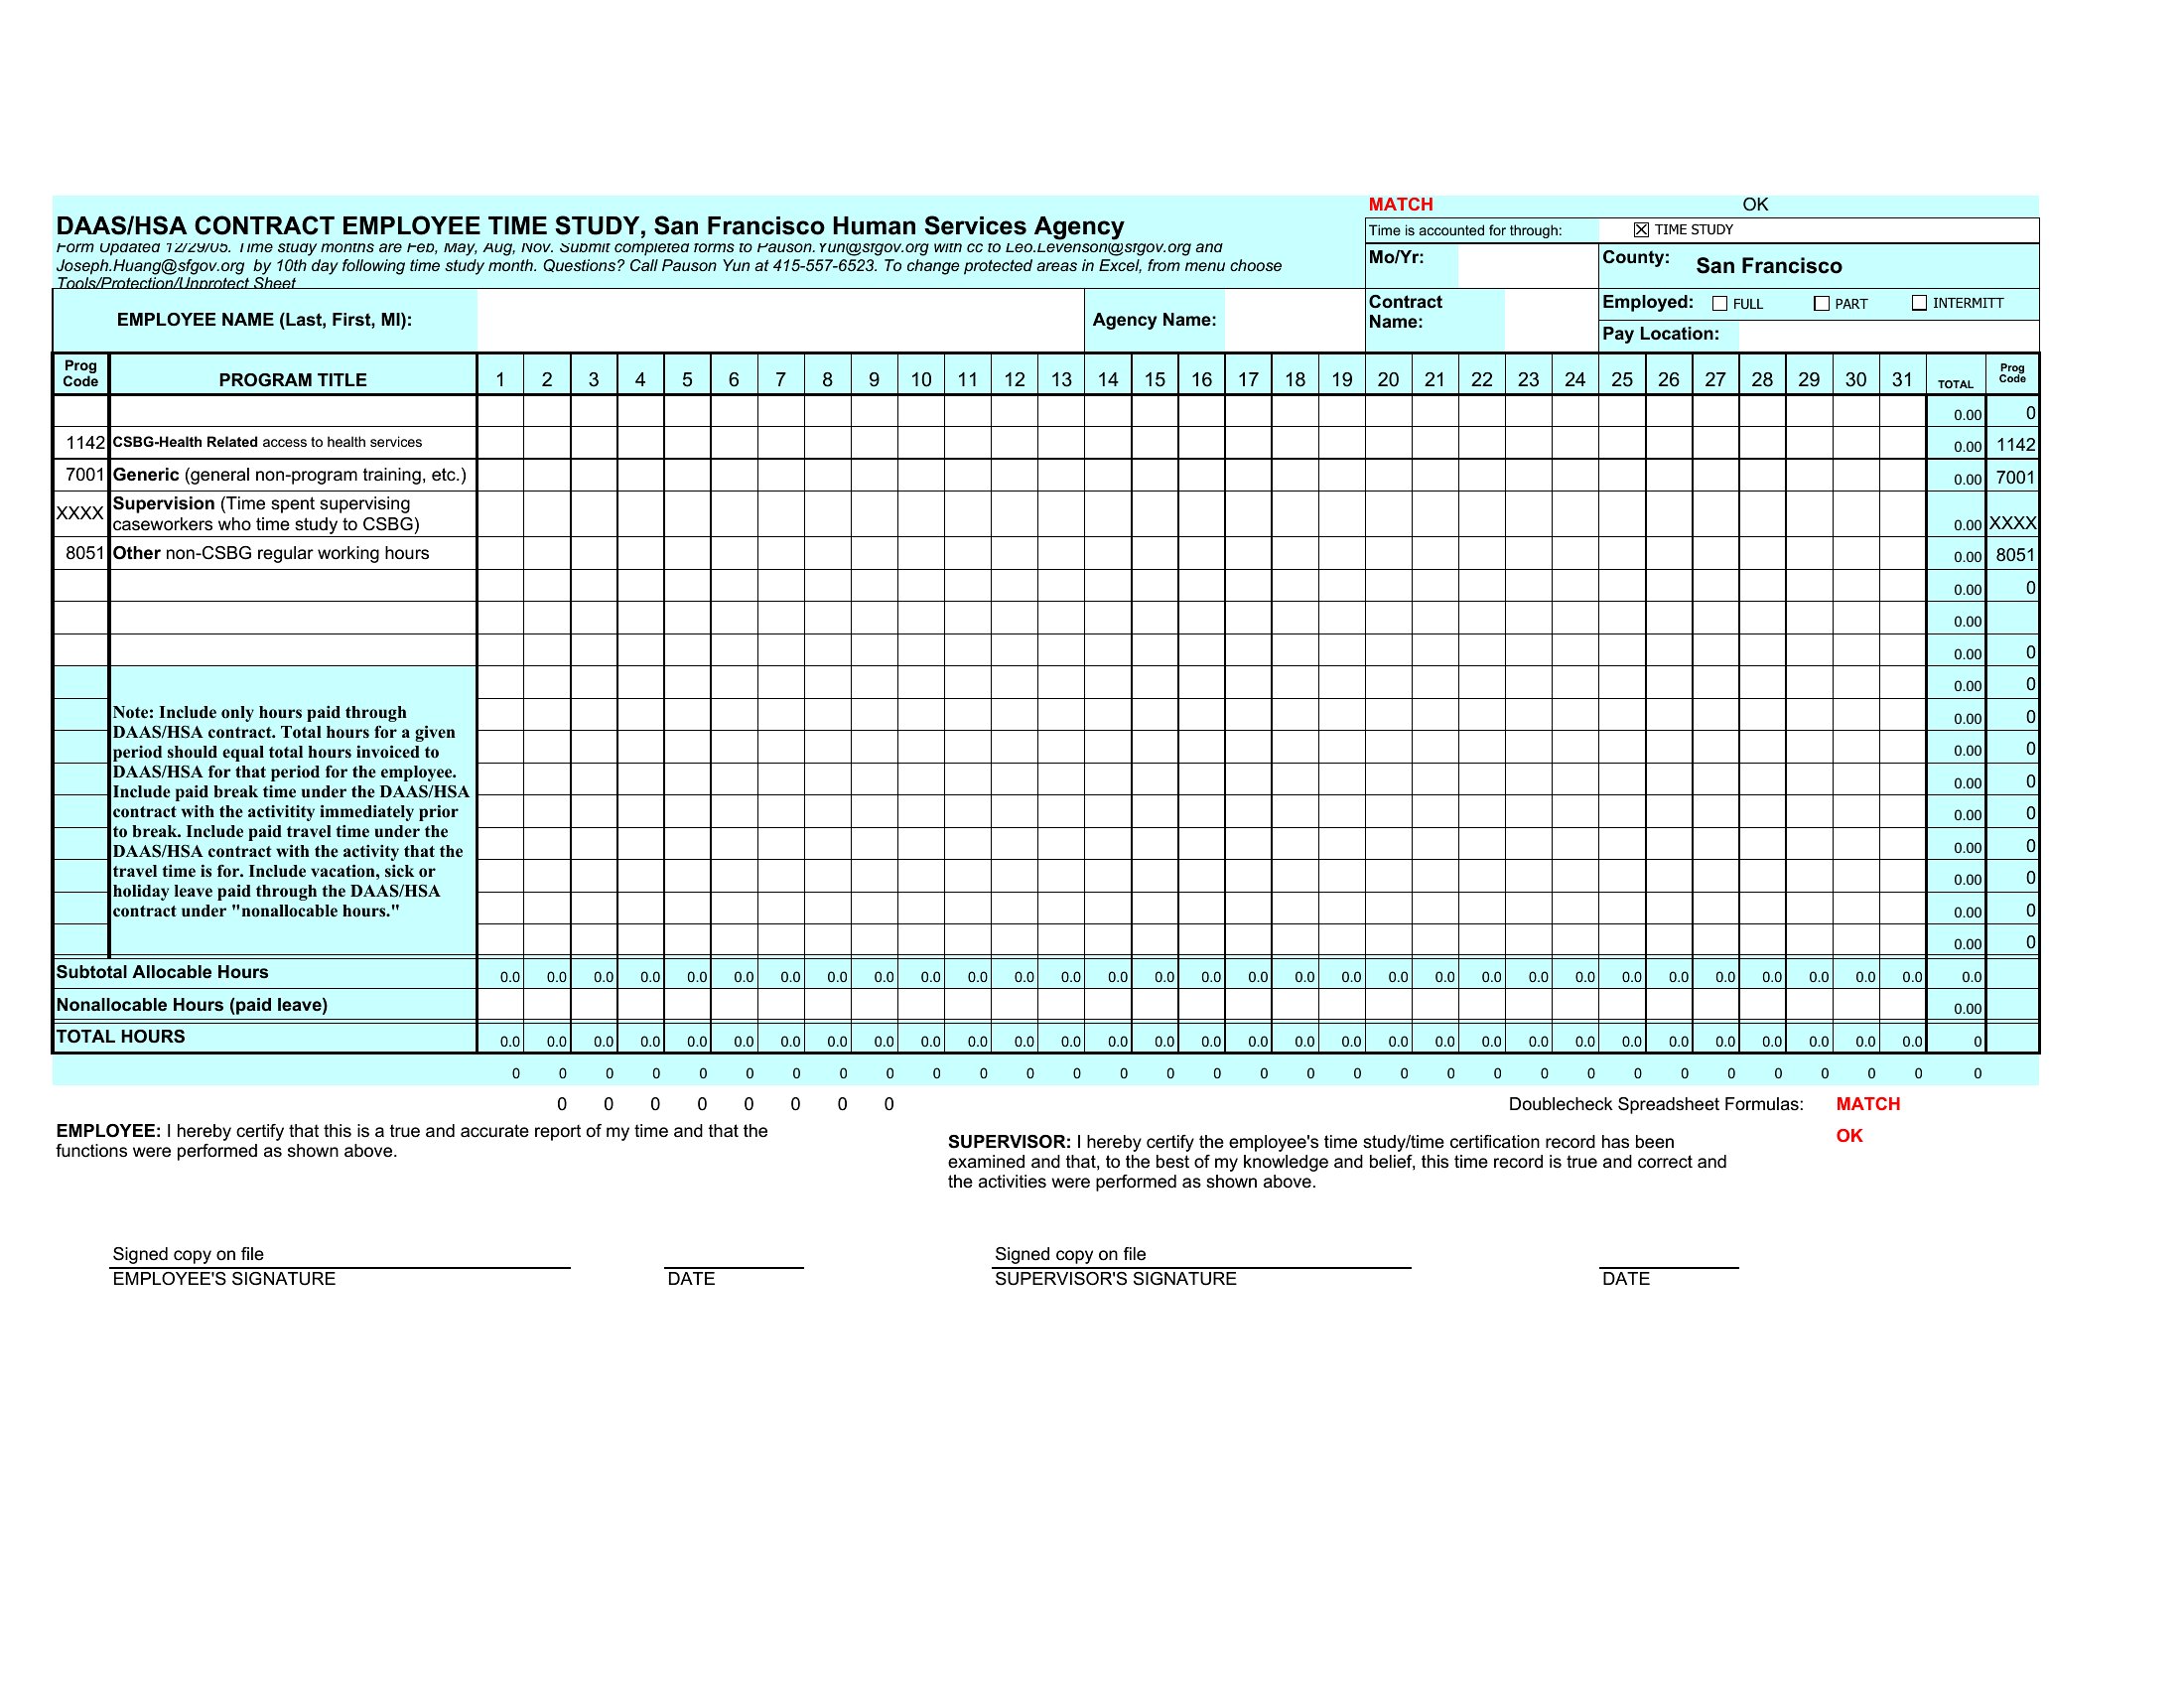
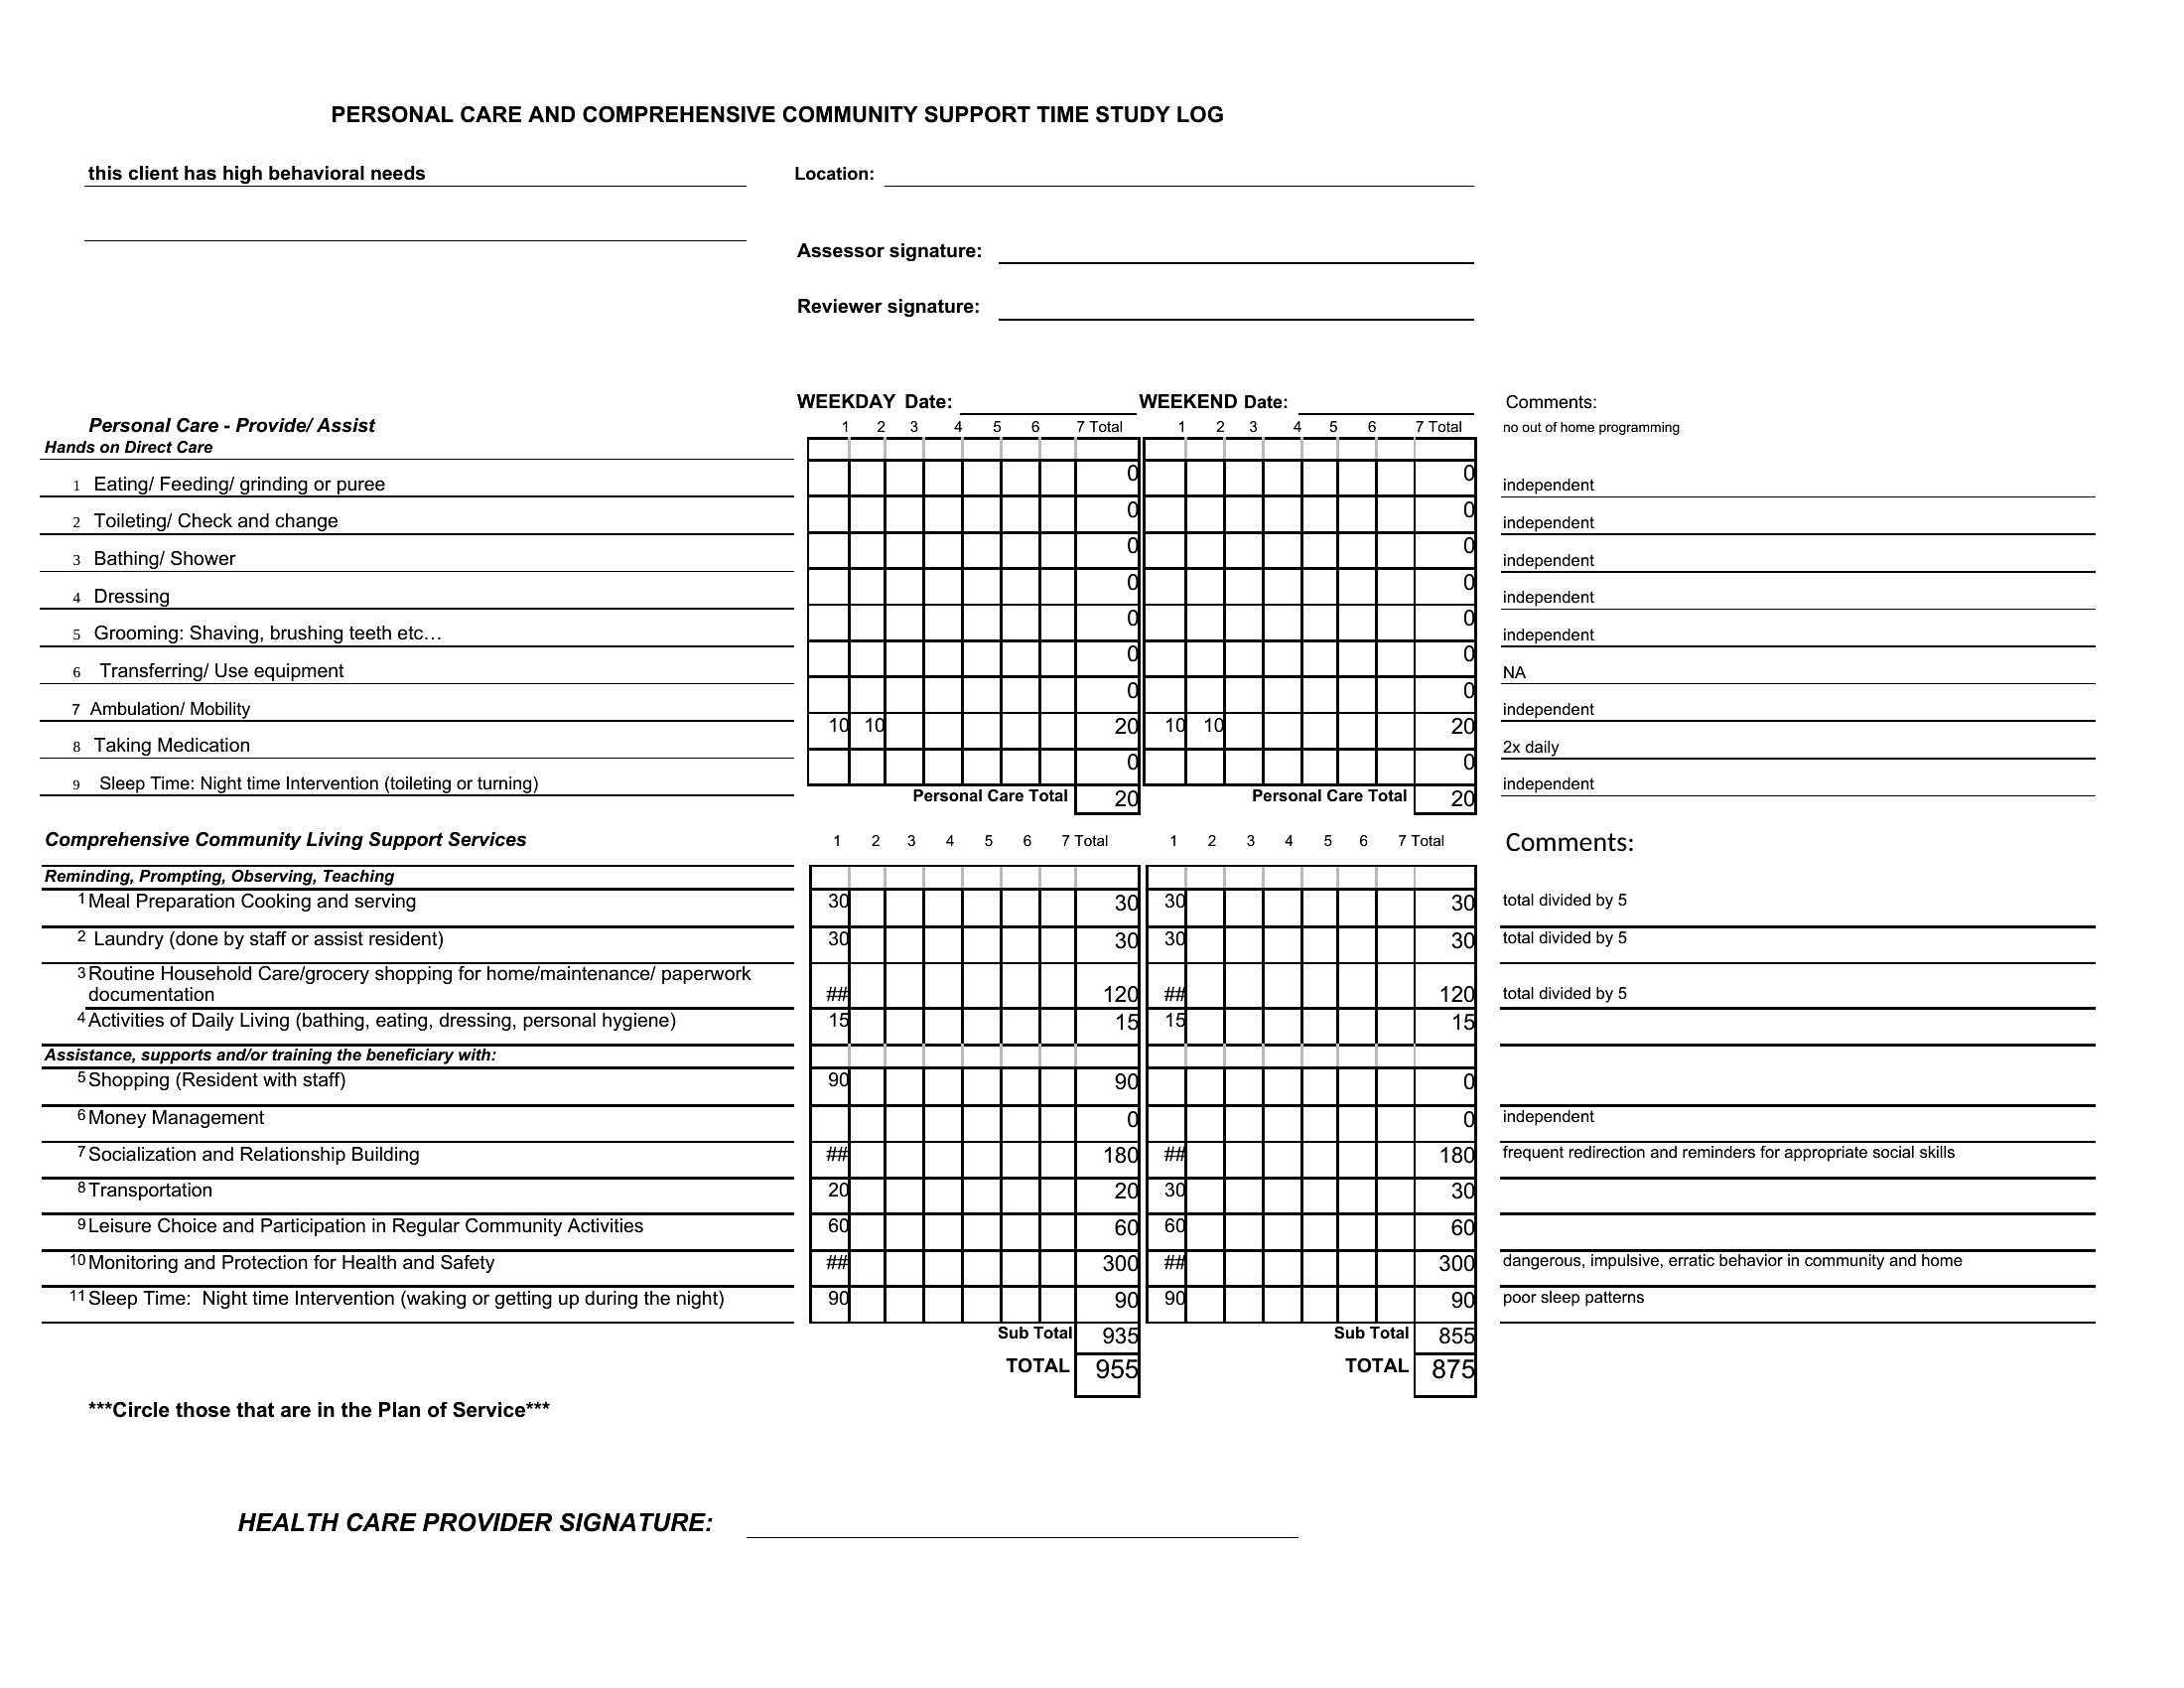
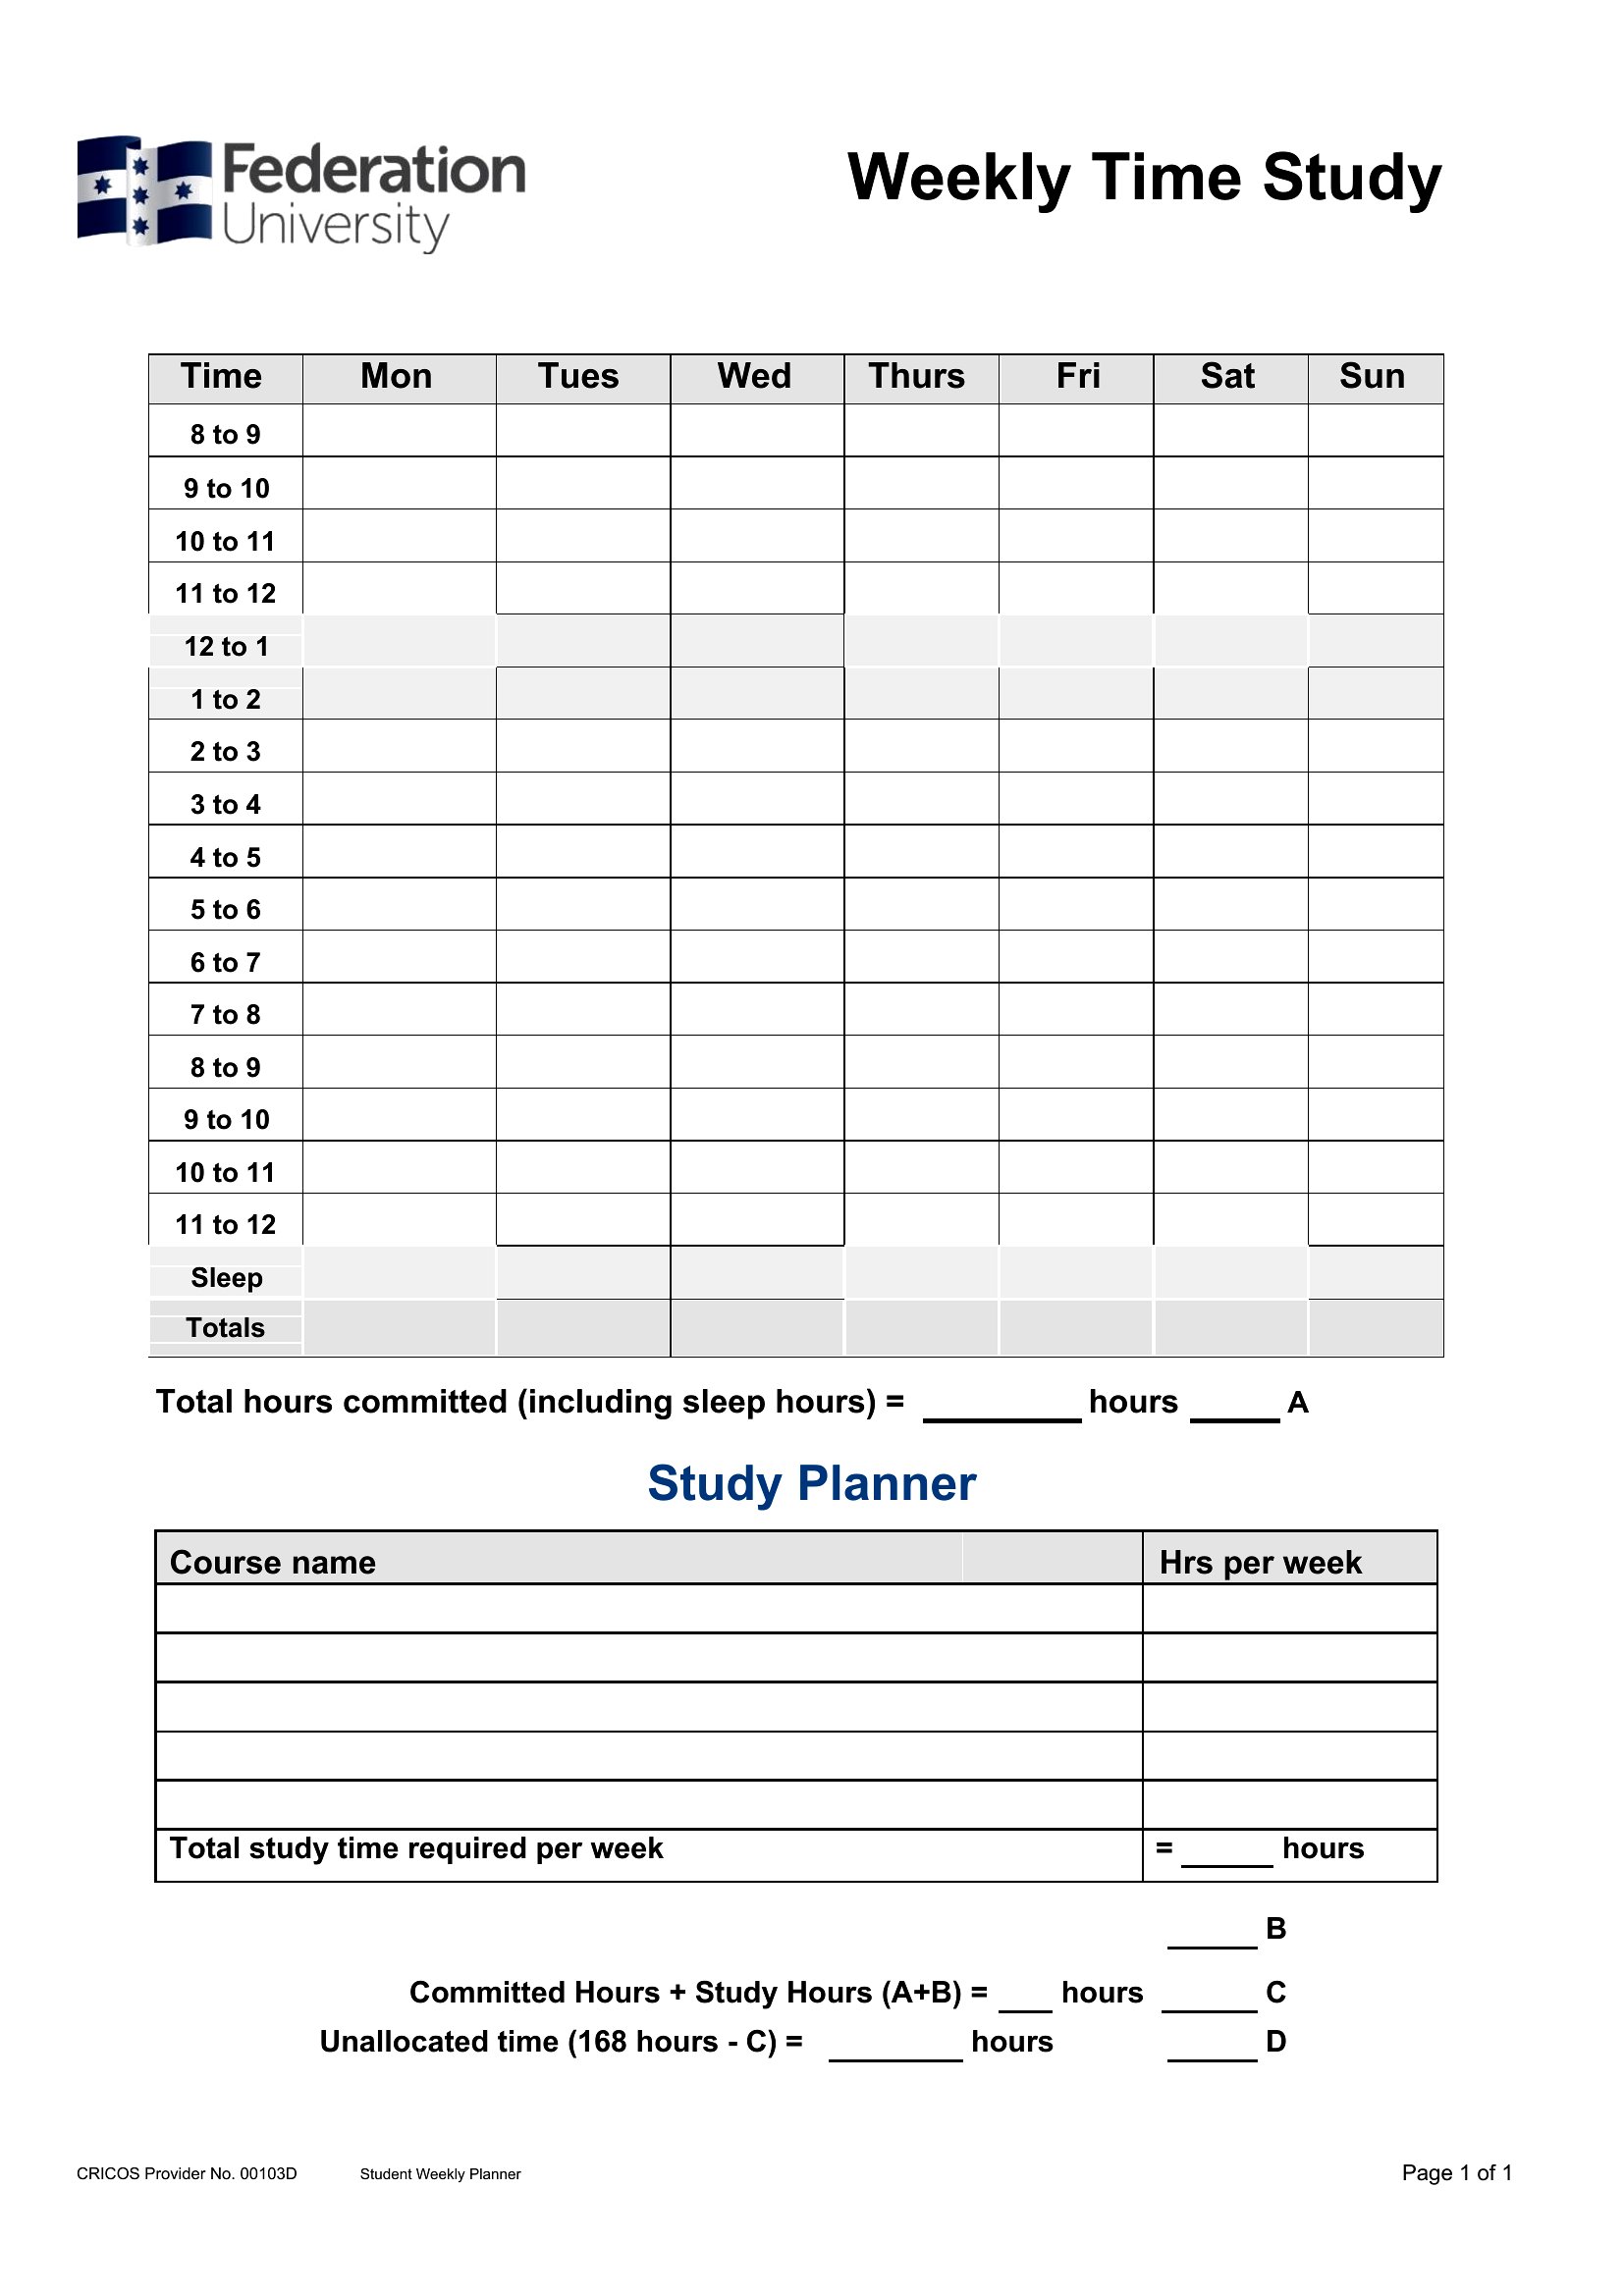

FAQ
Can I use these templates to compare time studies across different shifts or teams?
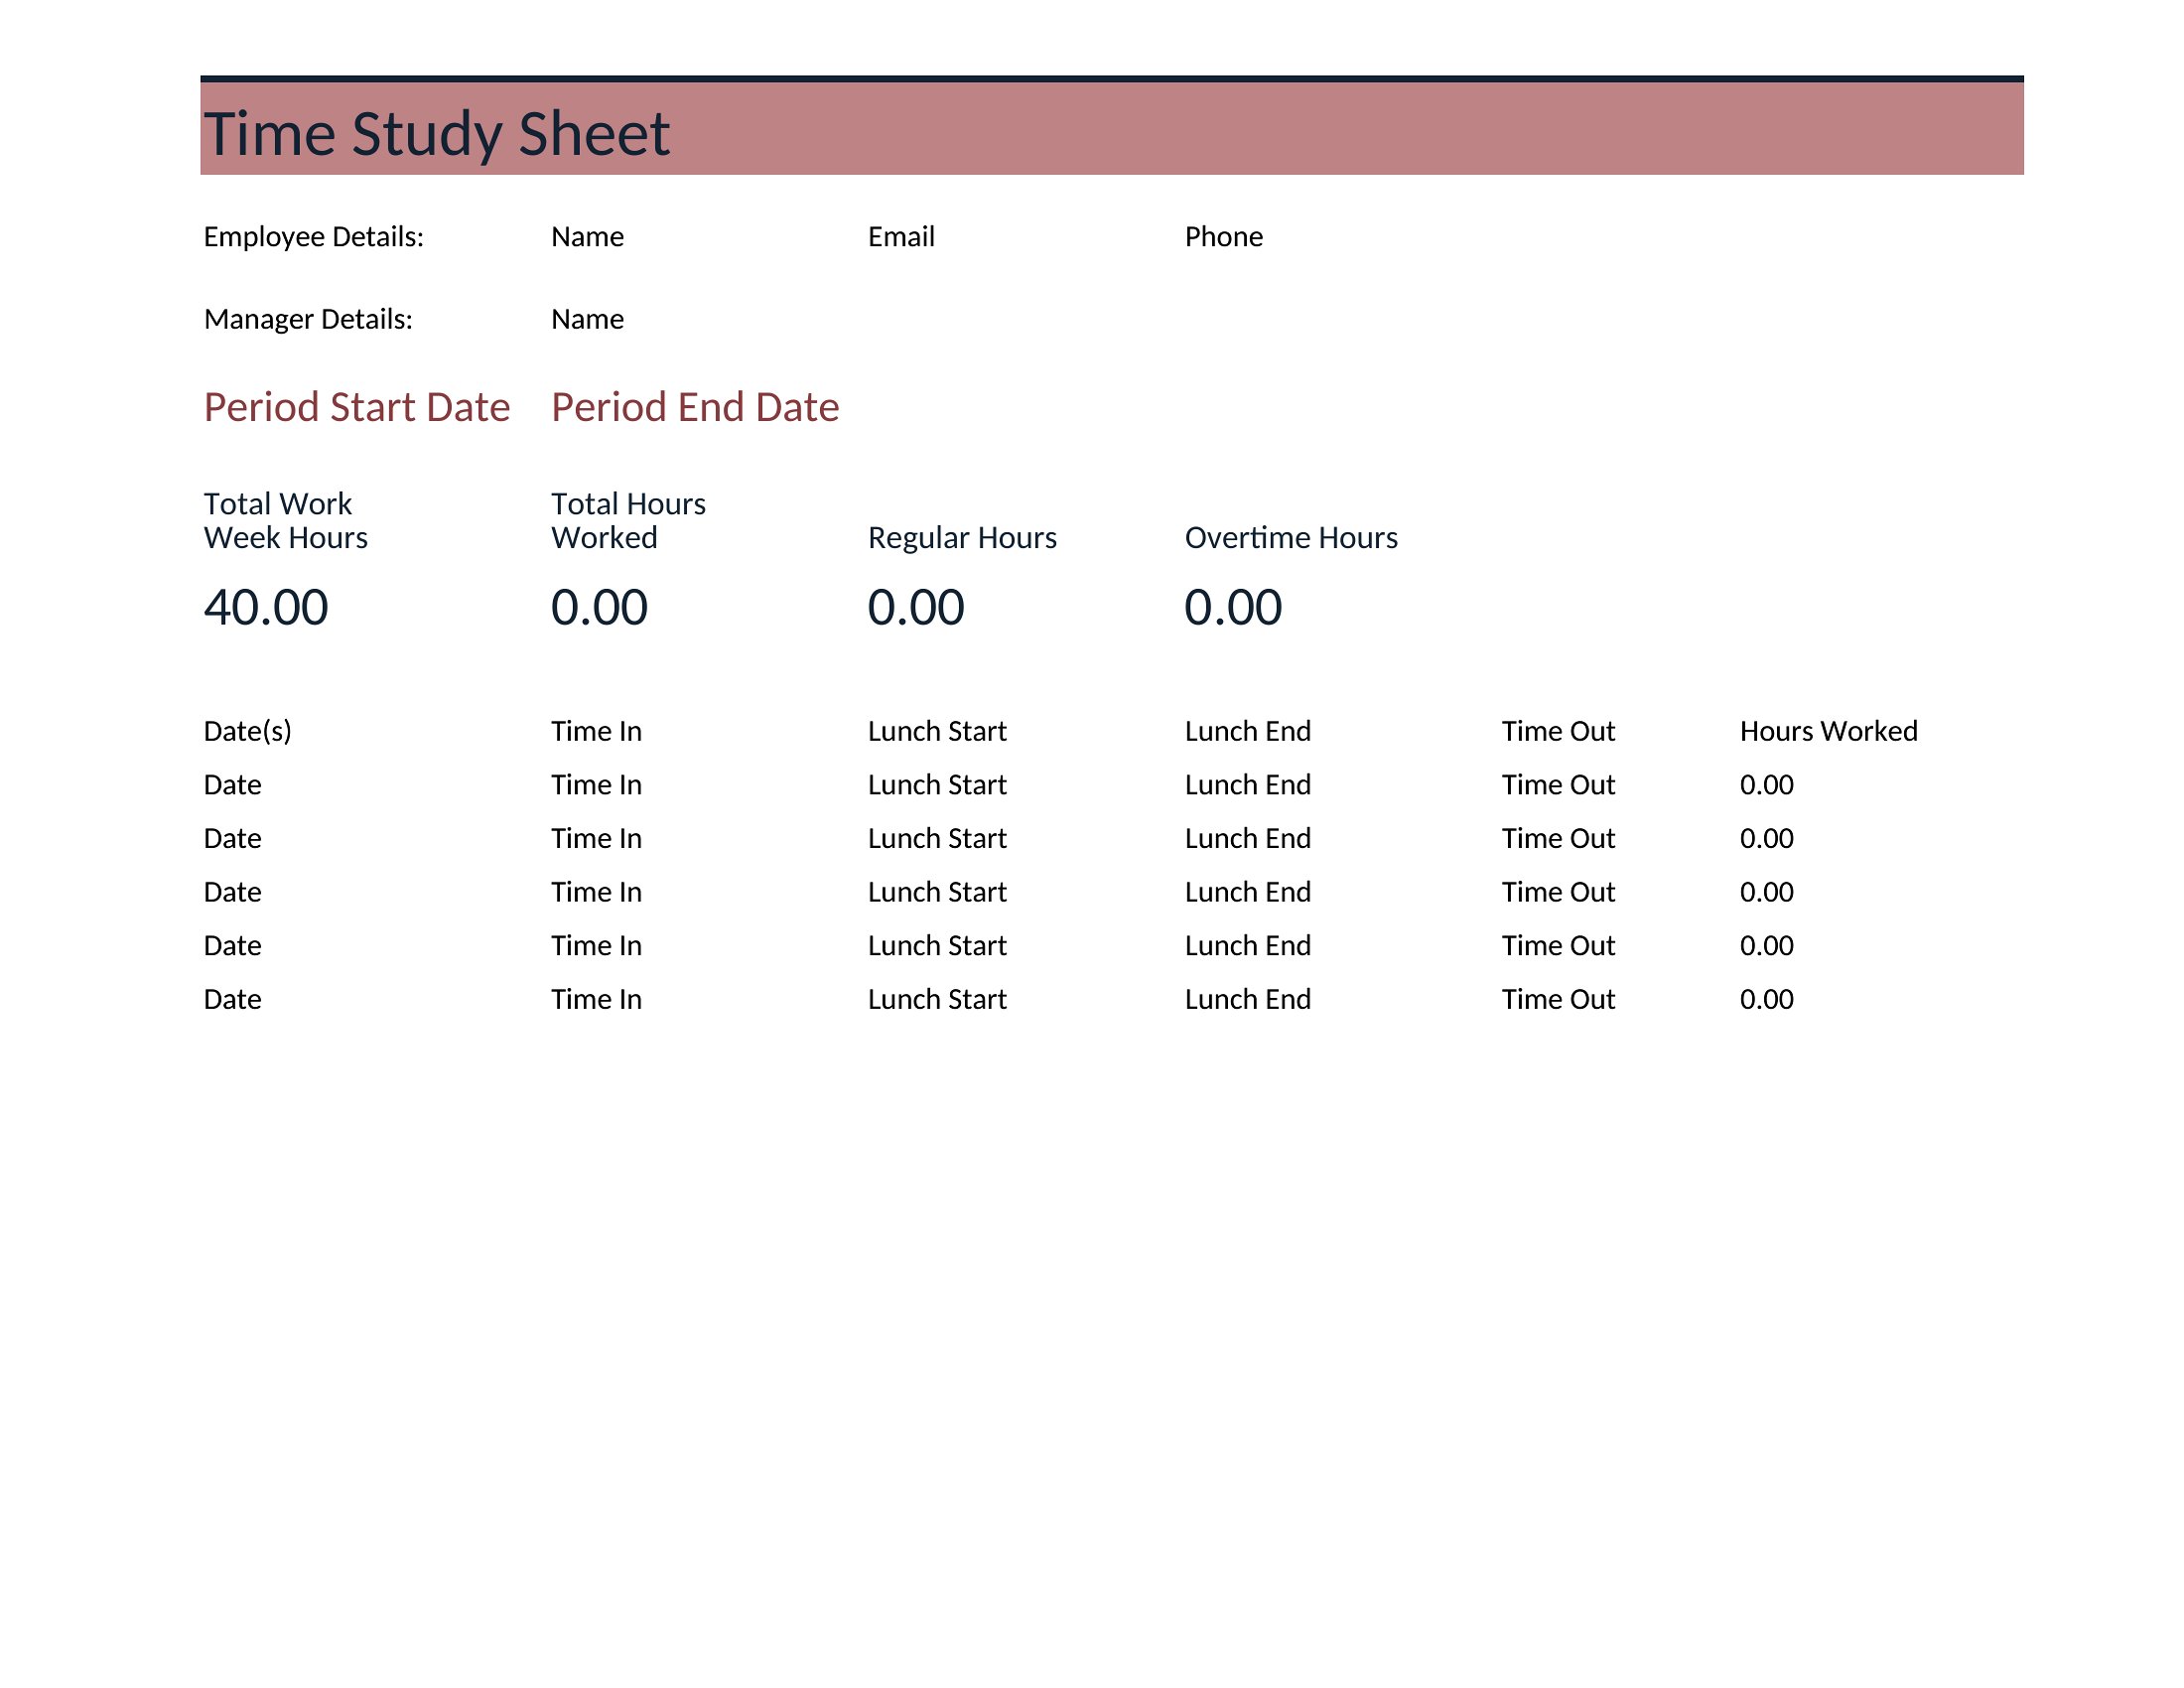
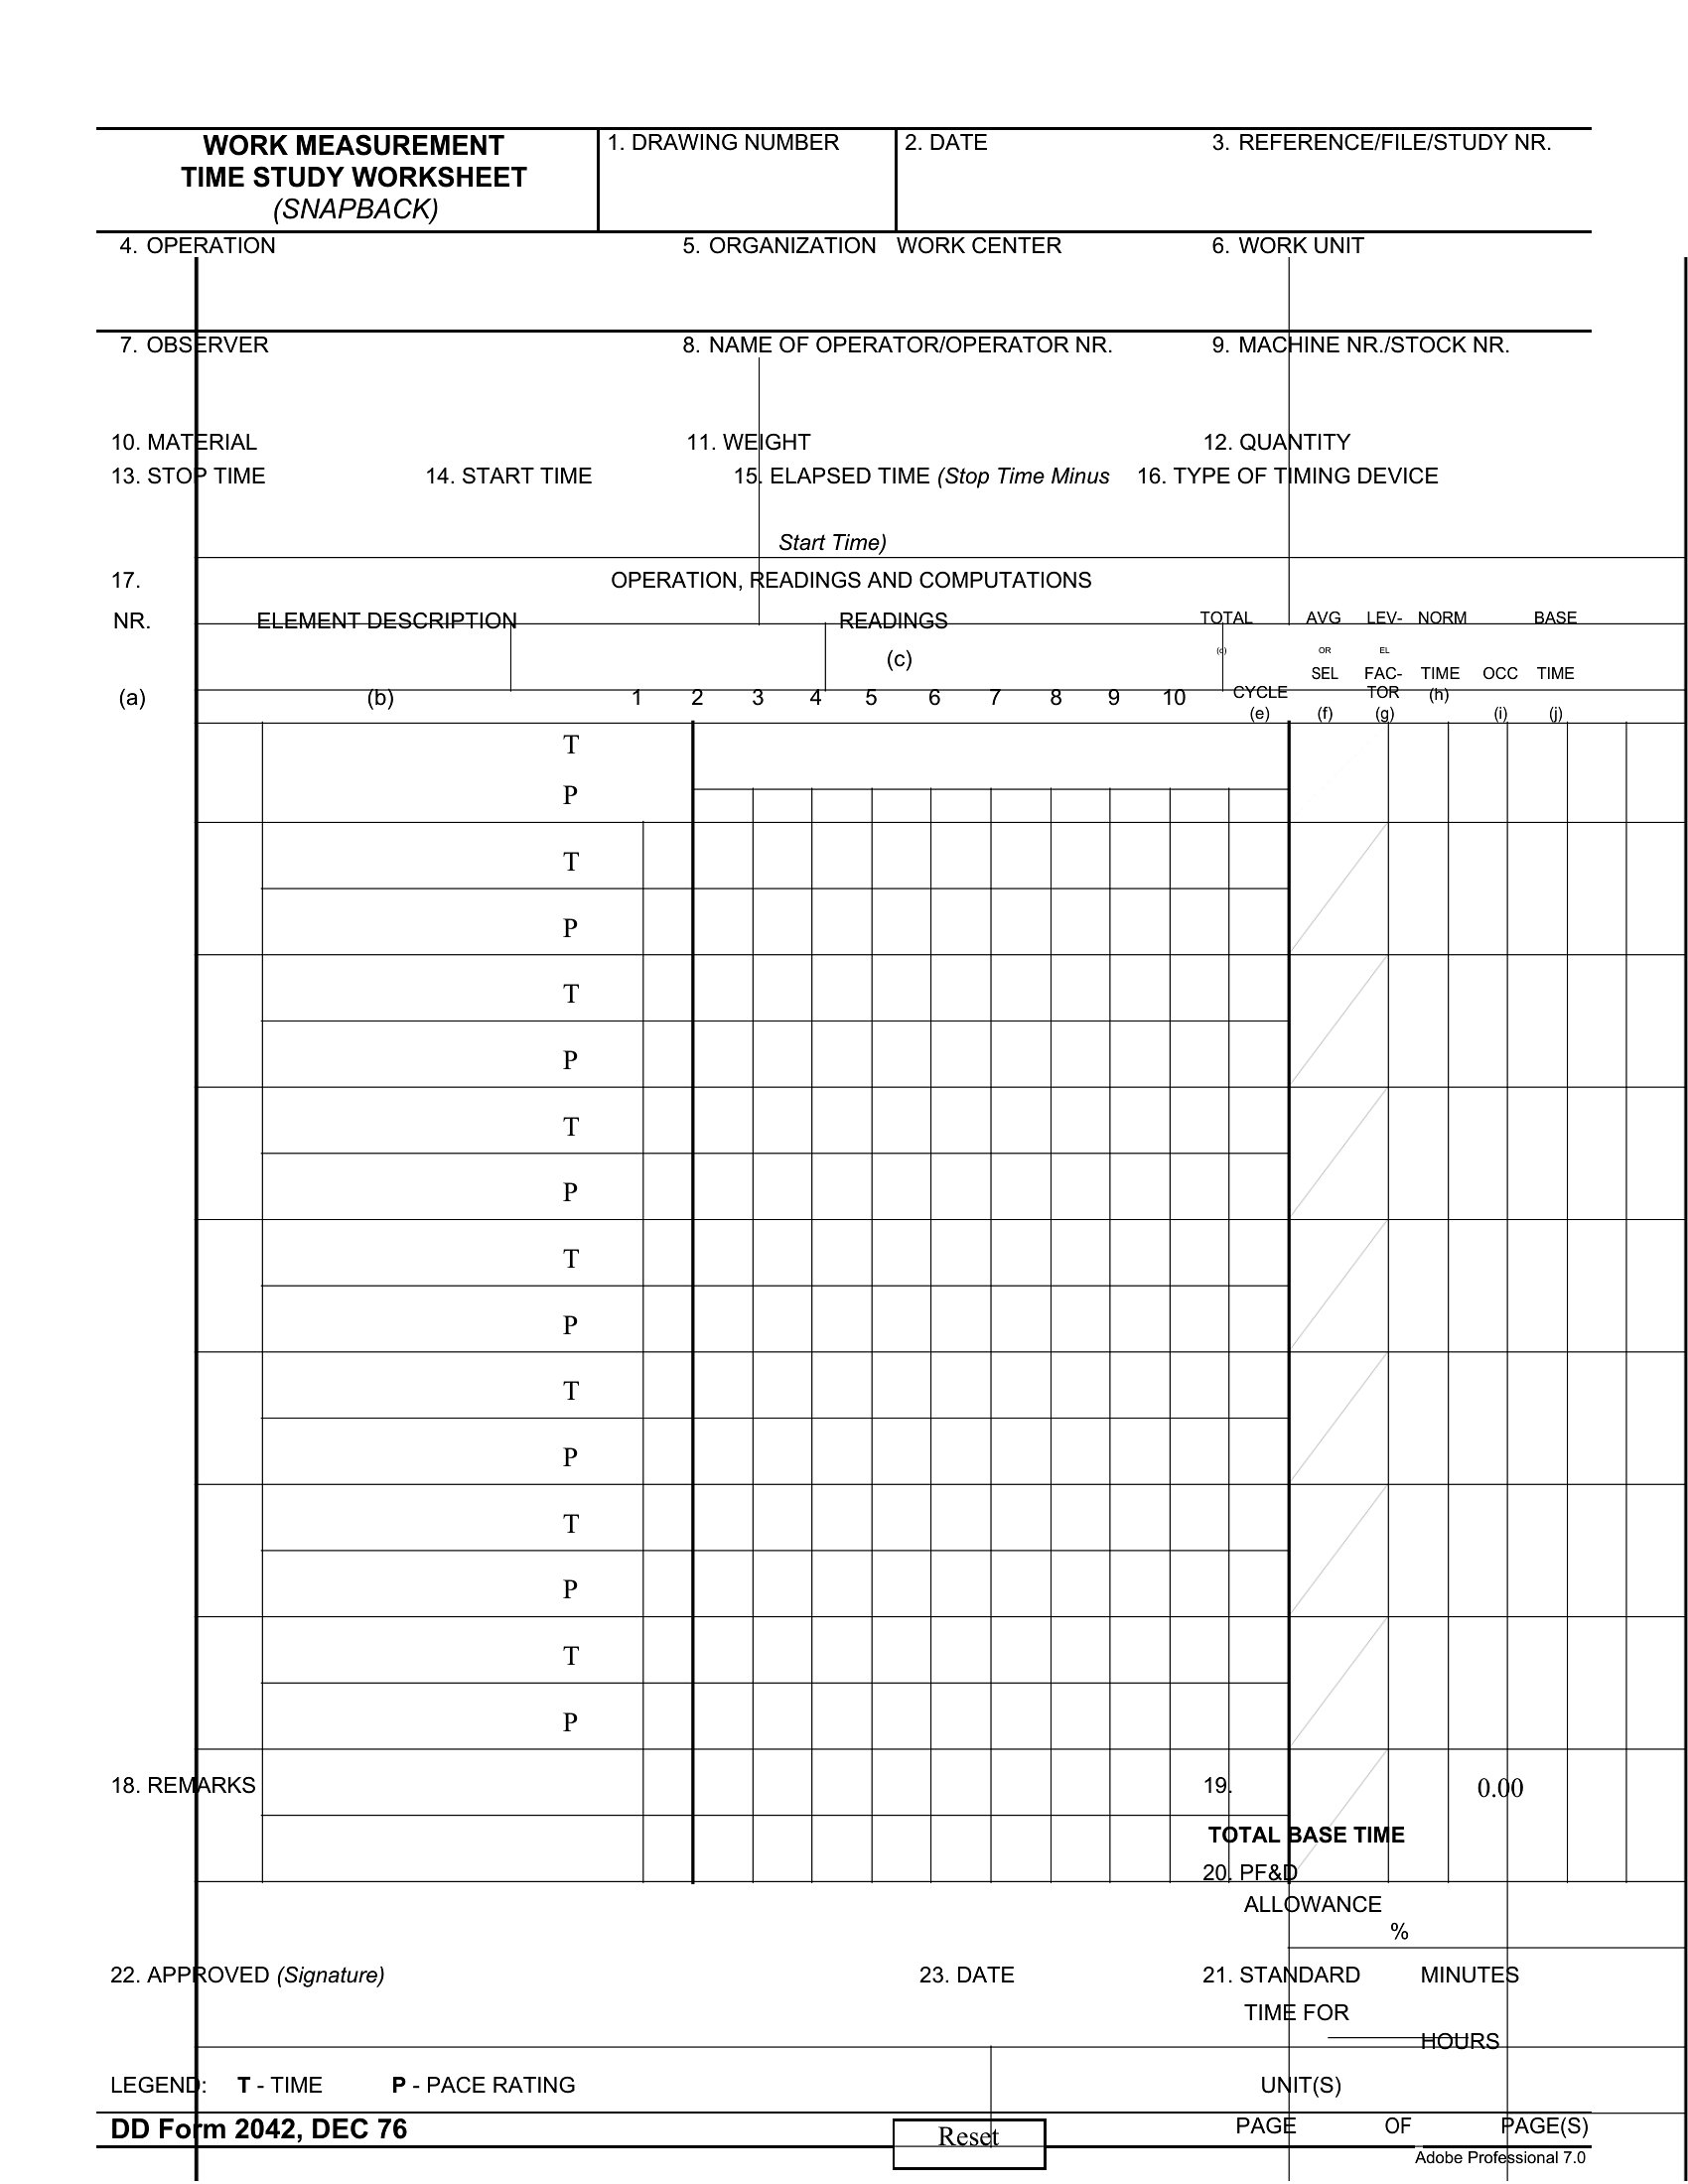
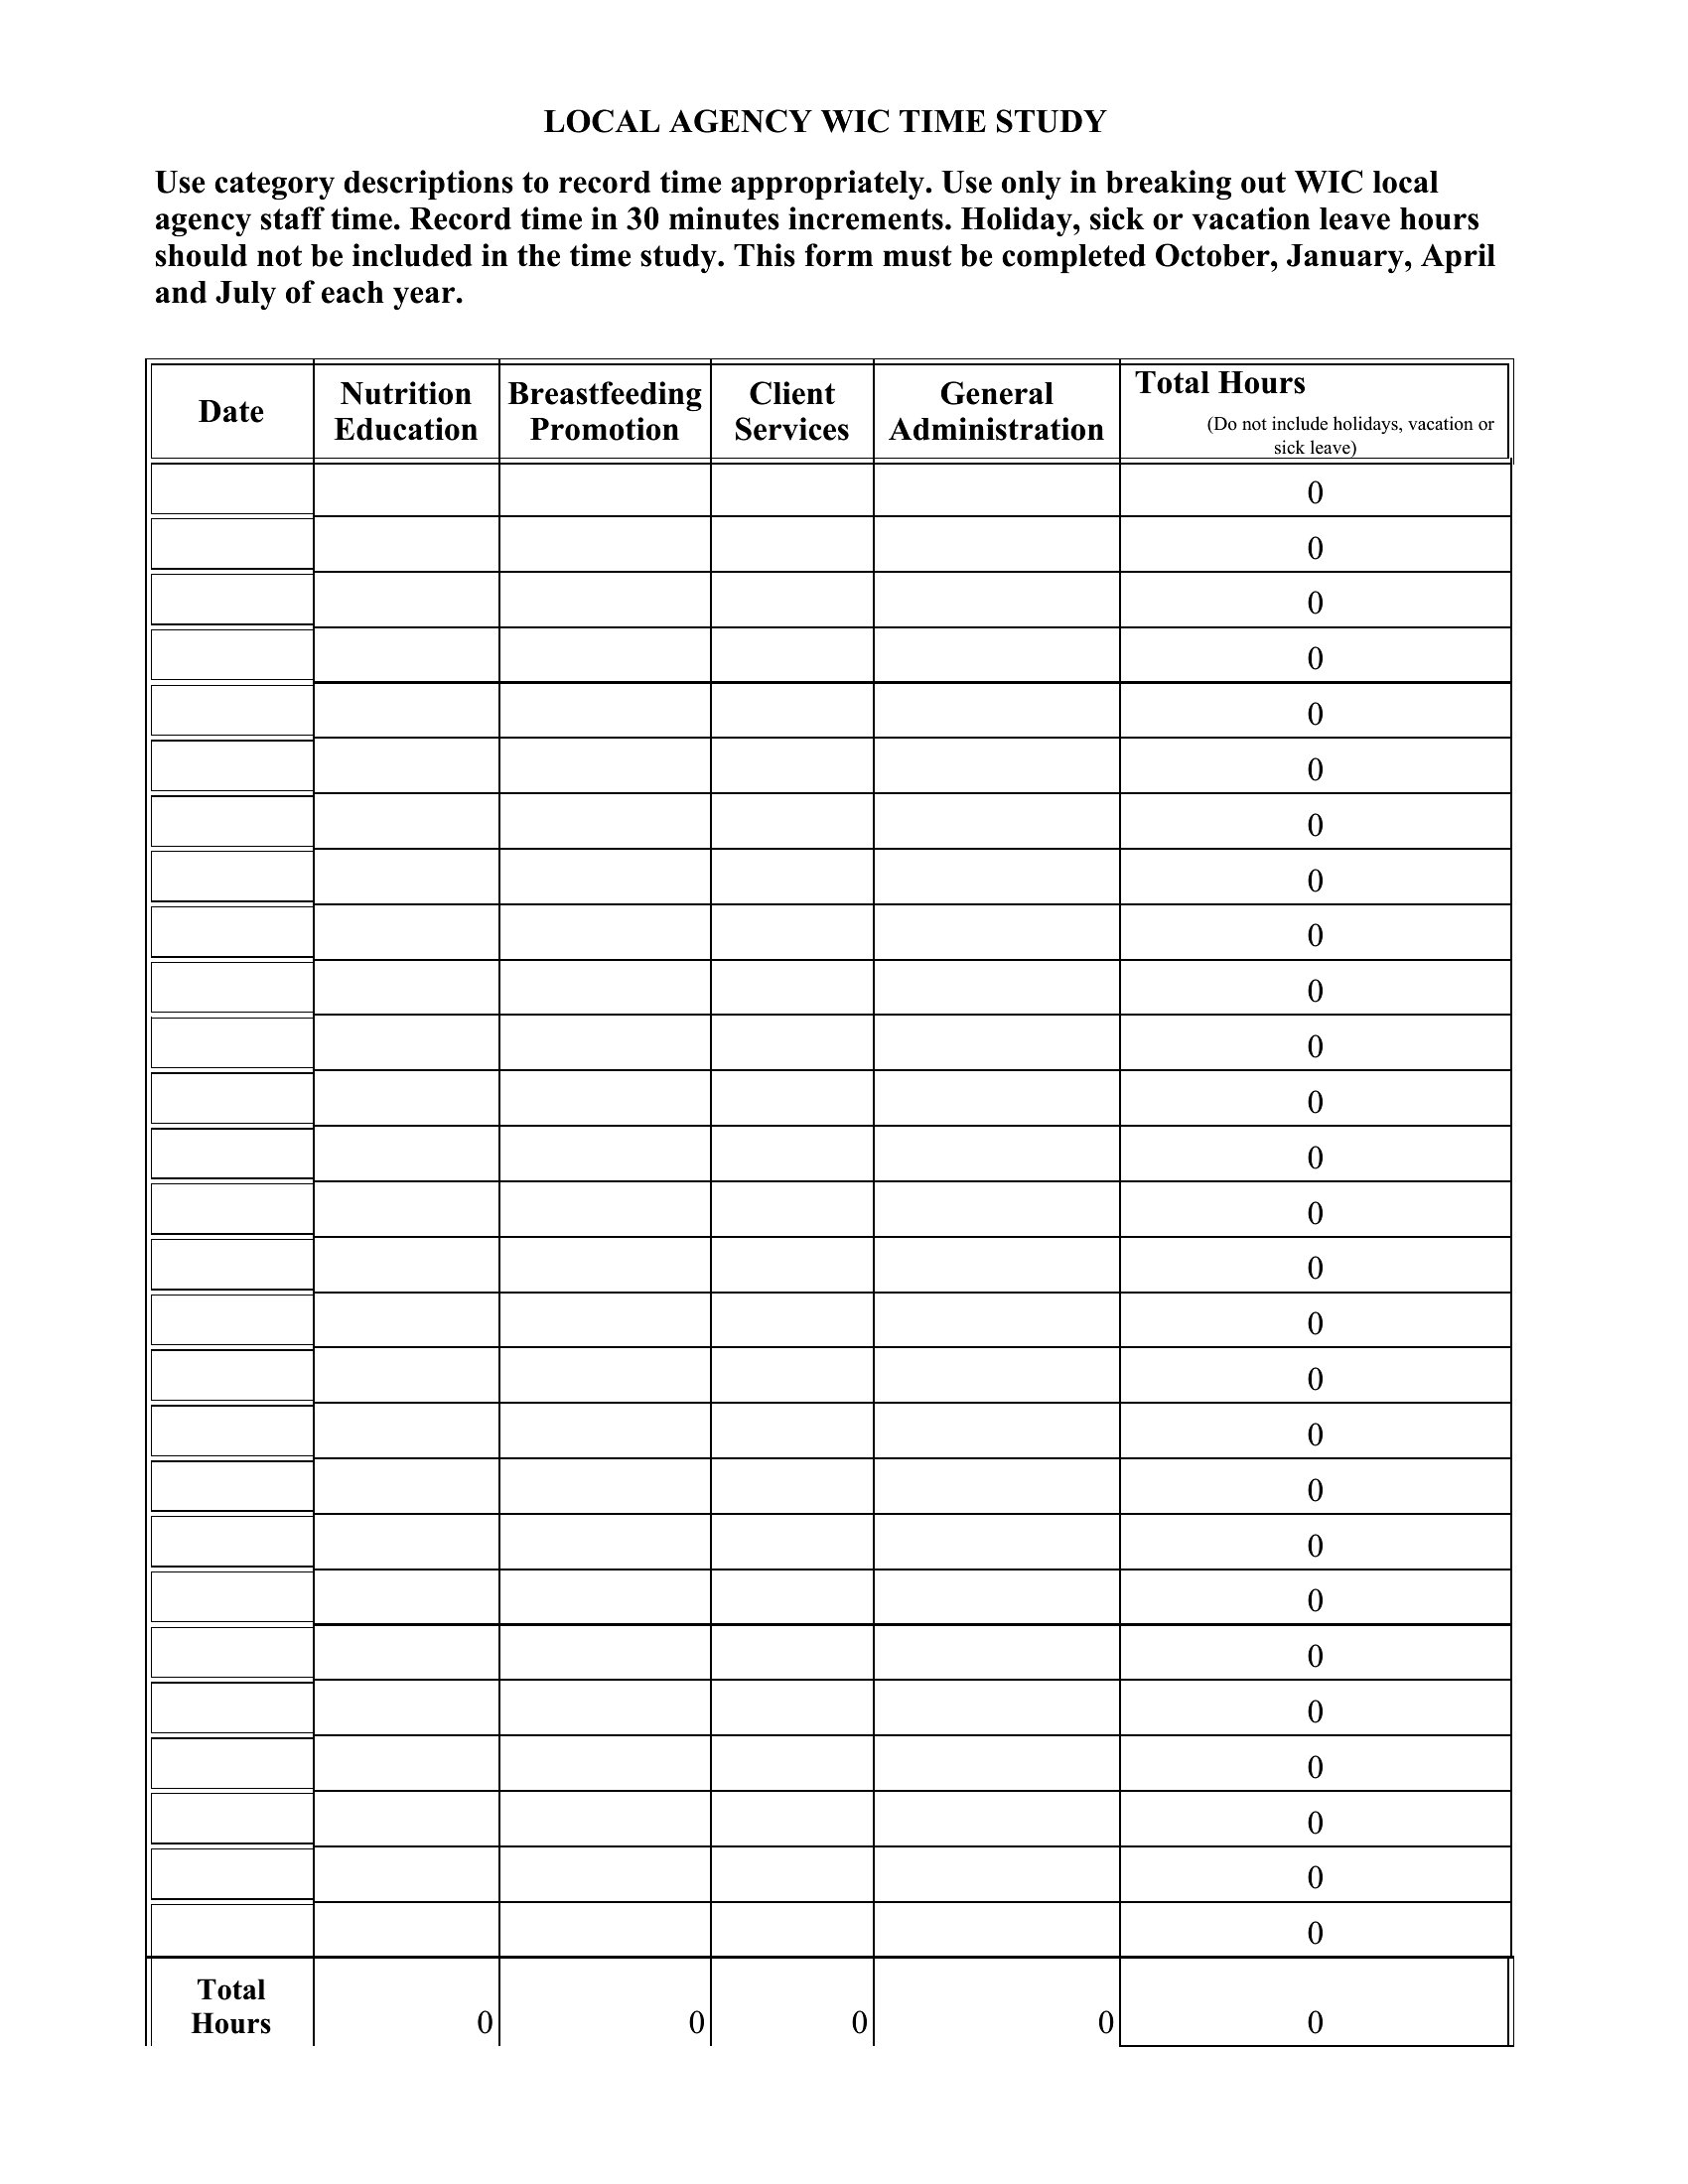
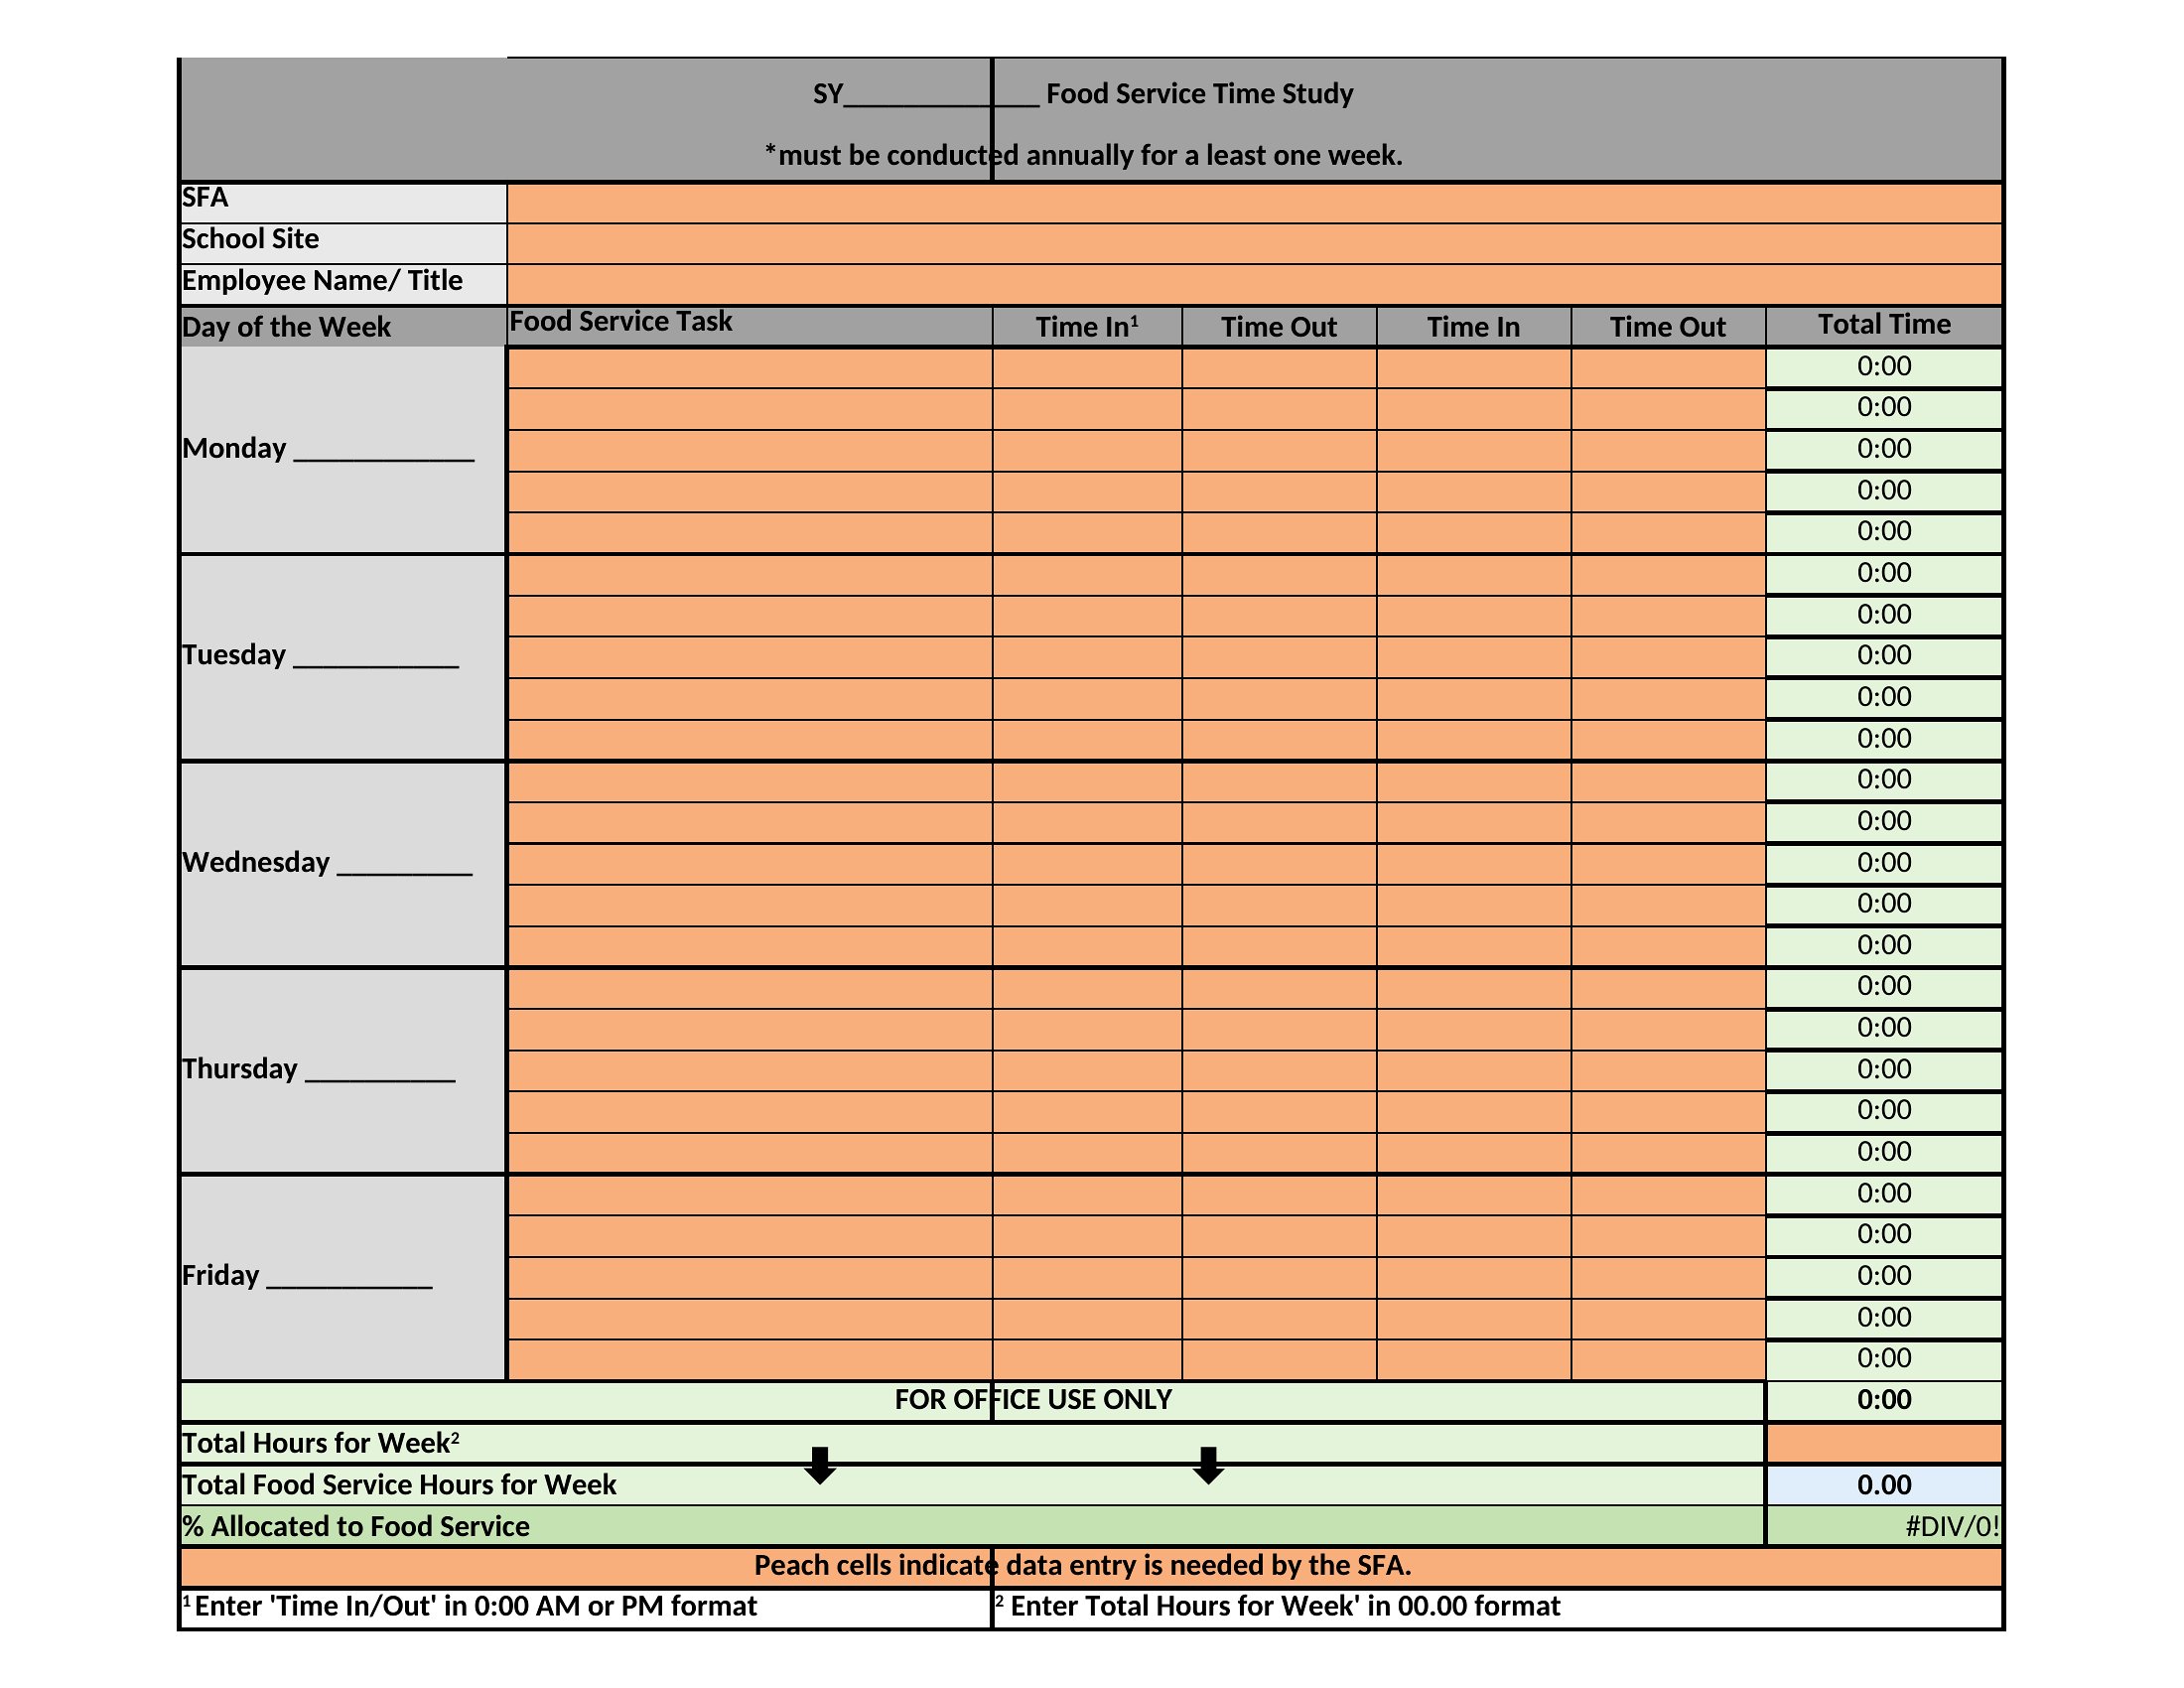
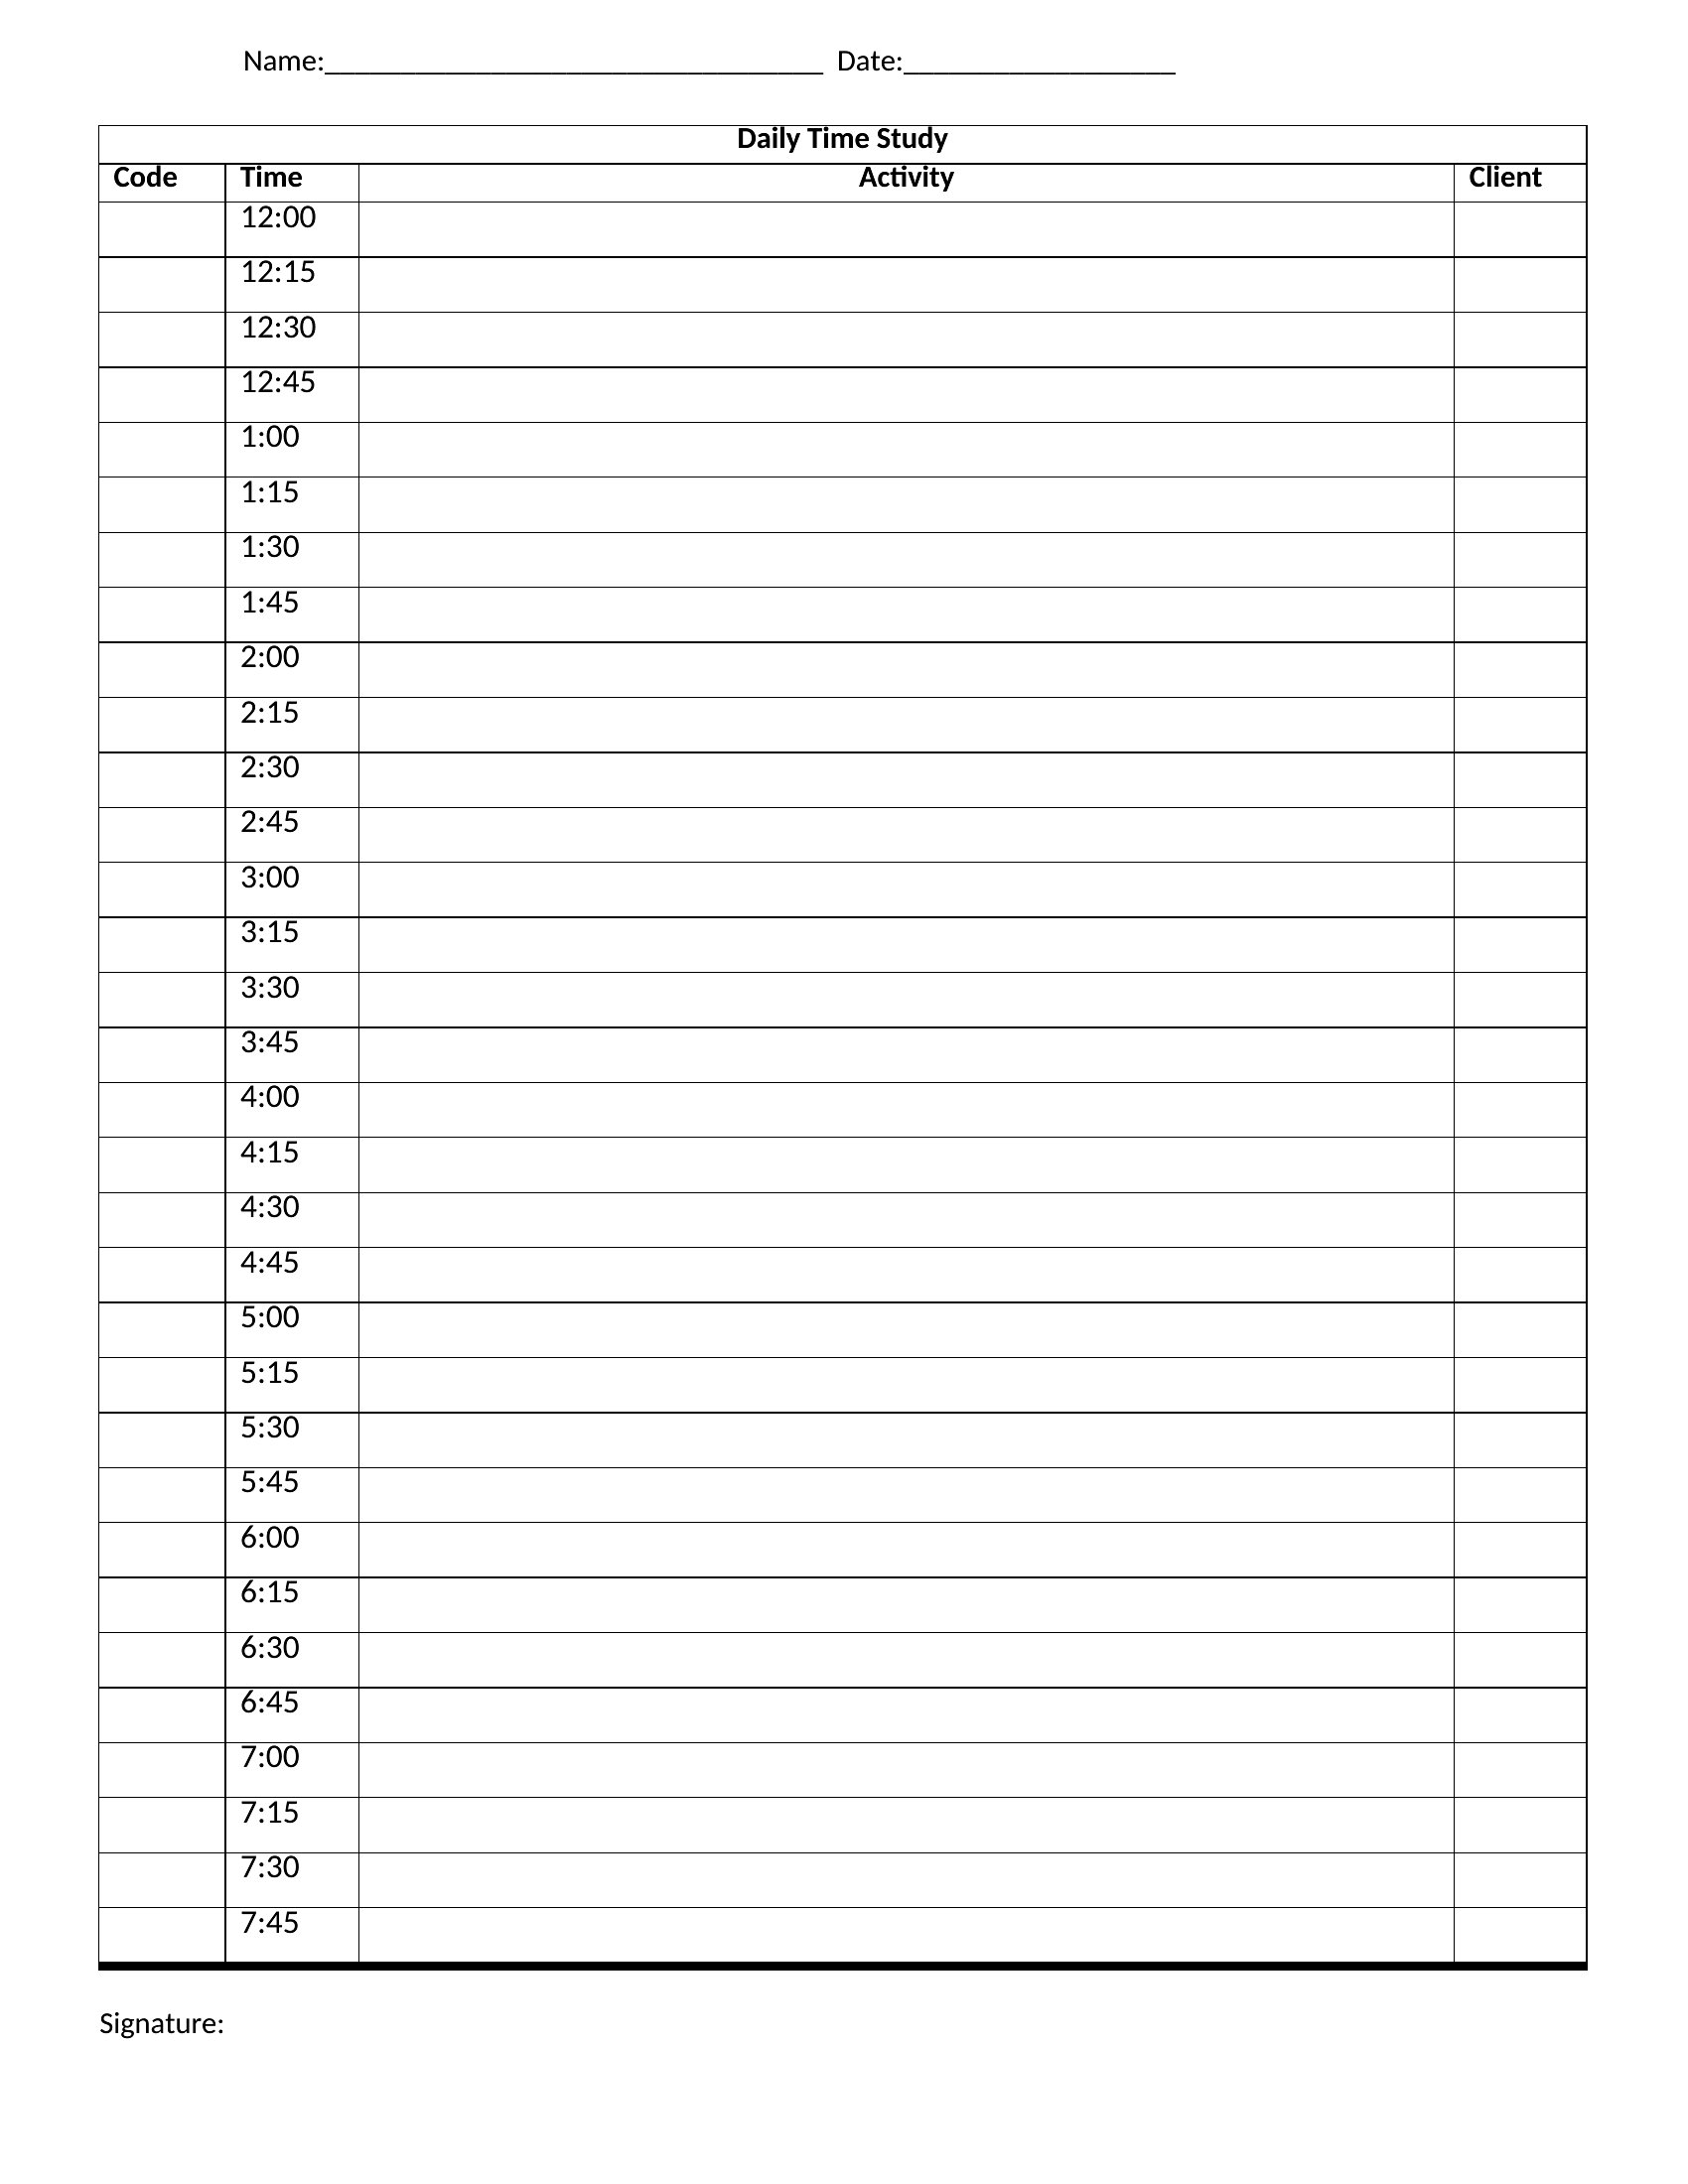
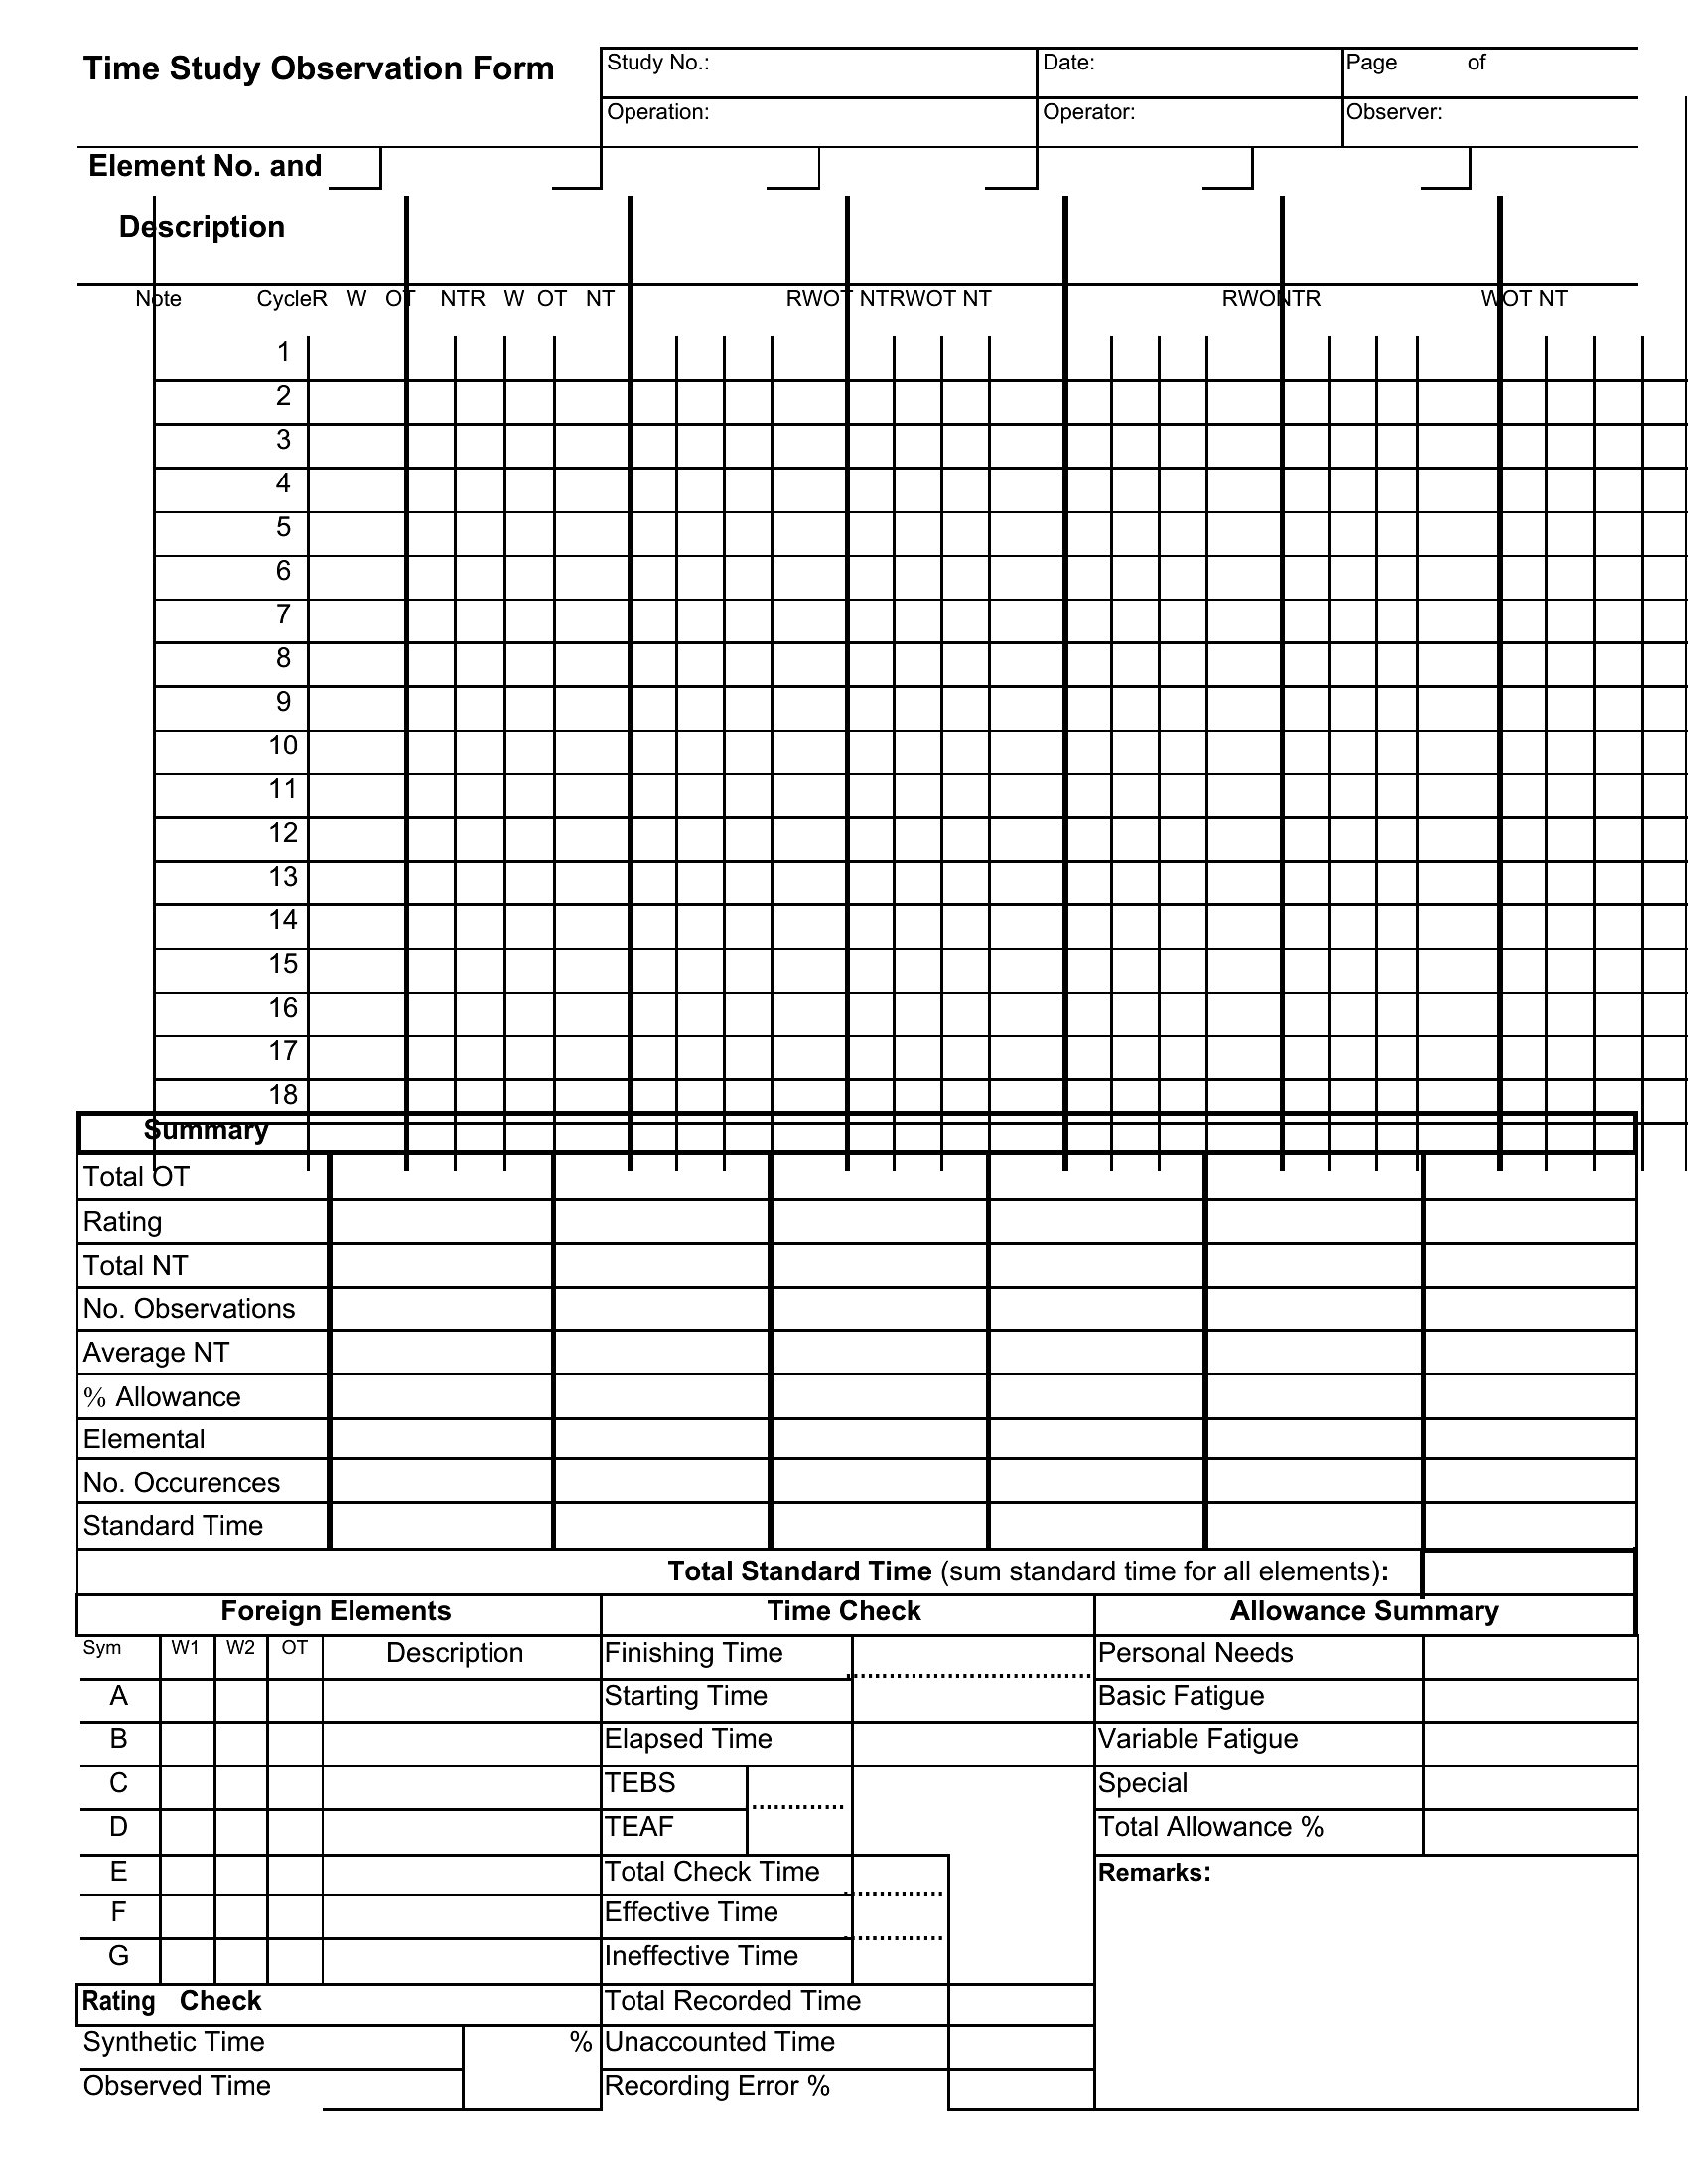
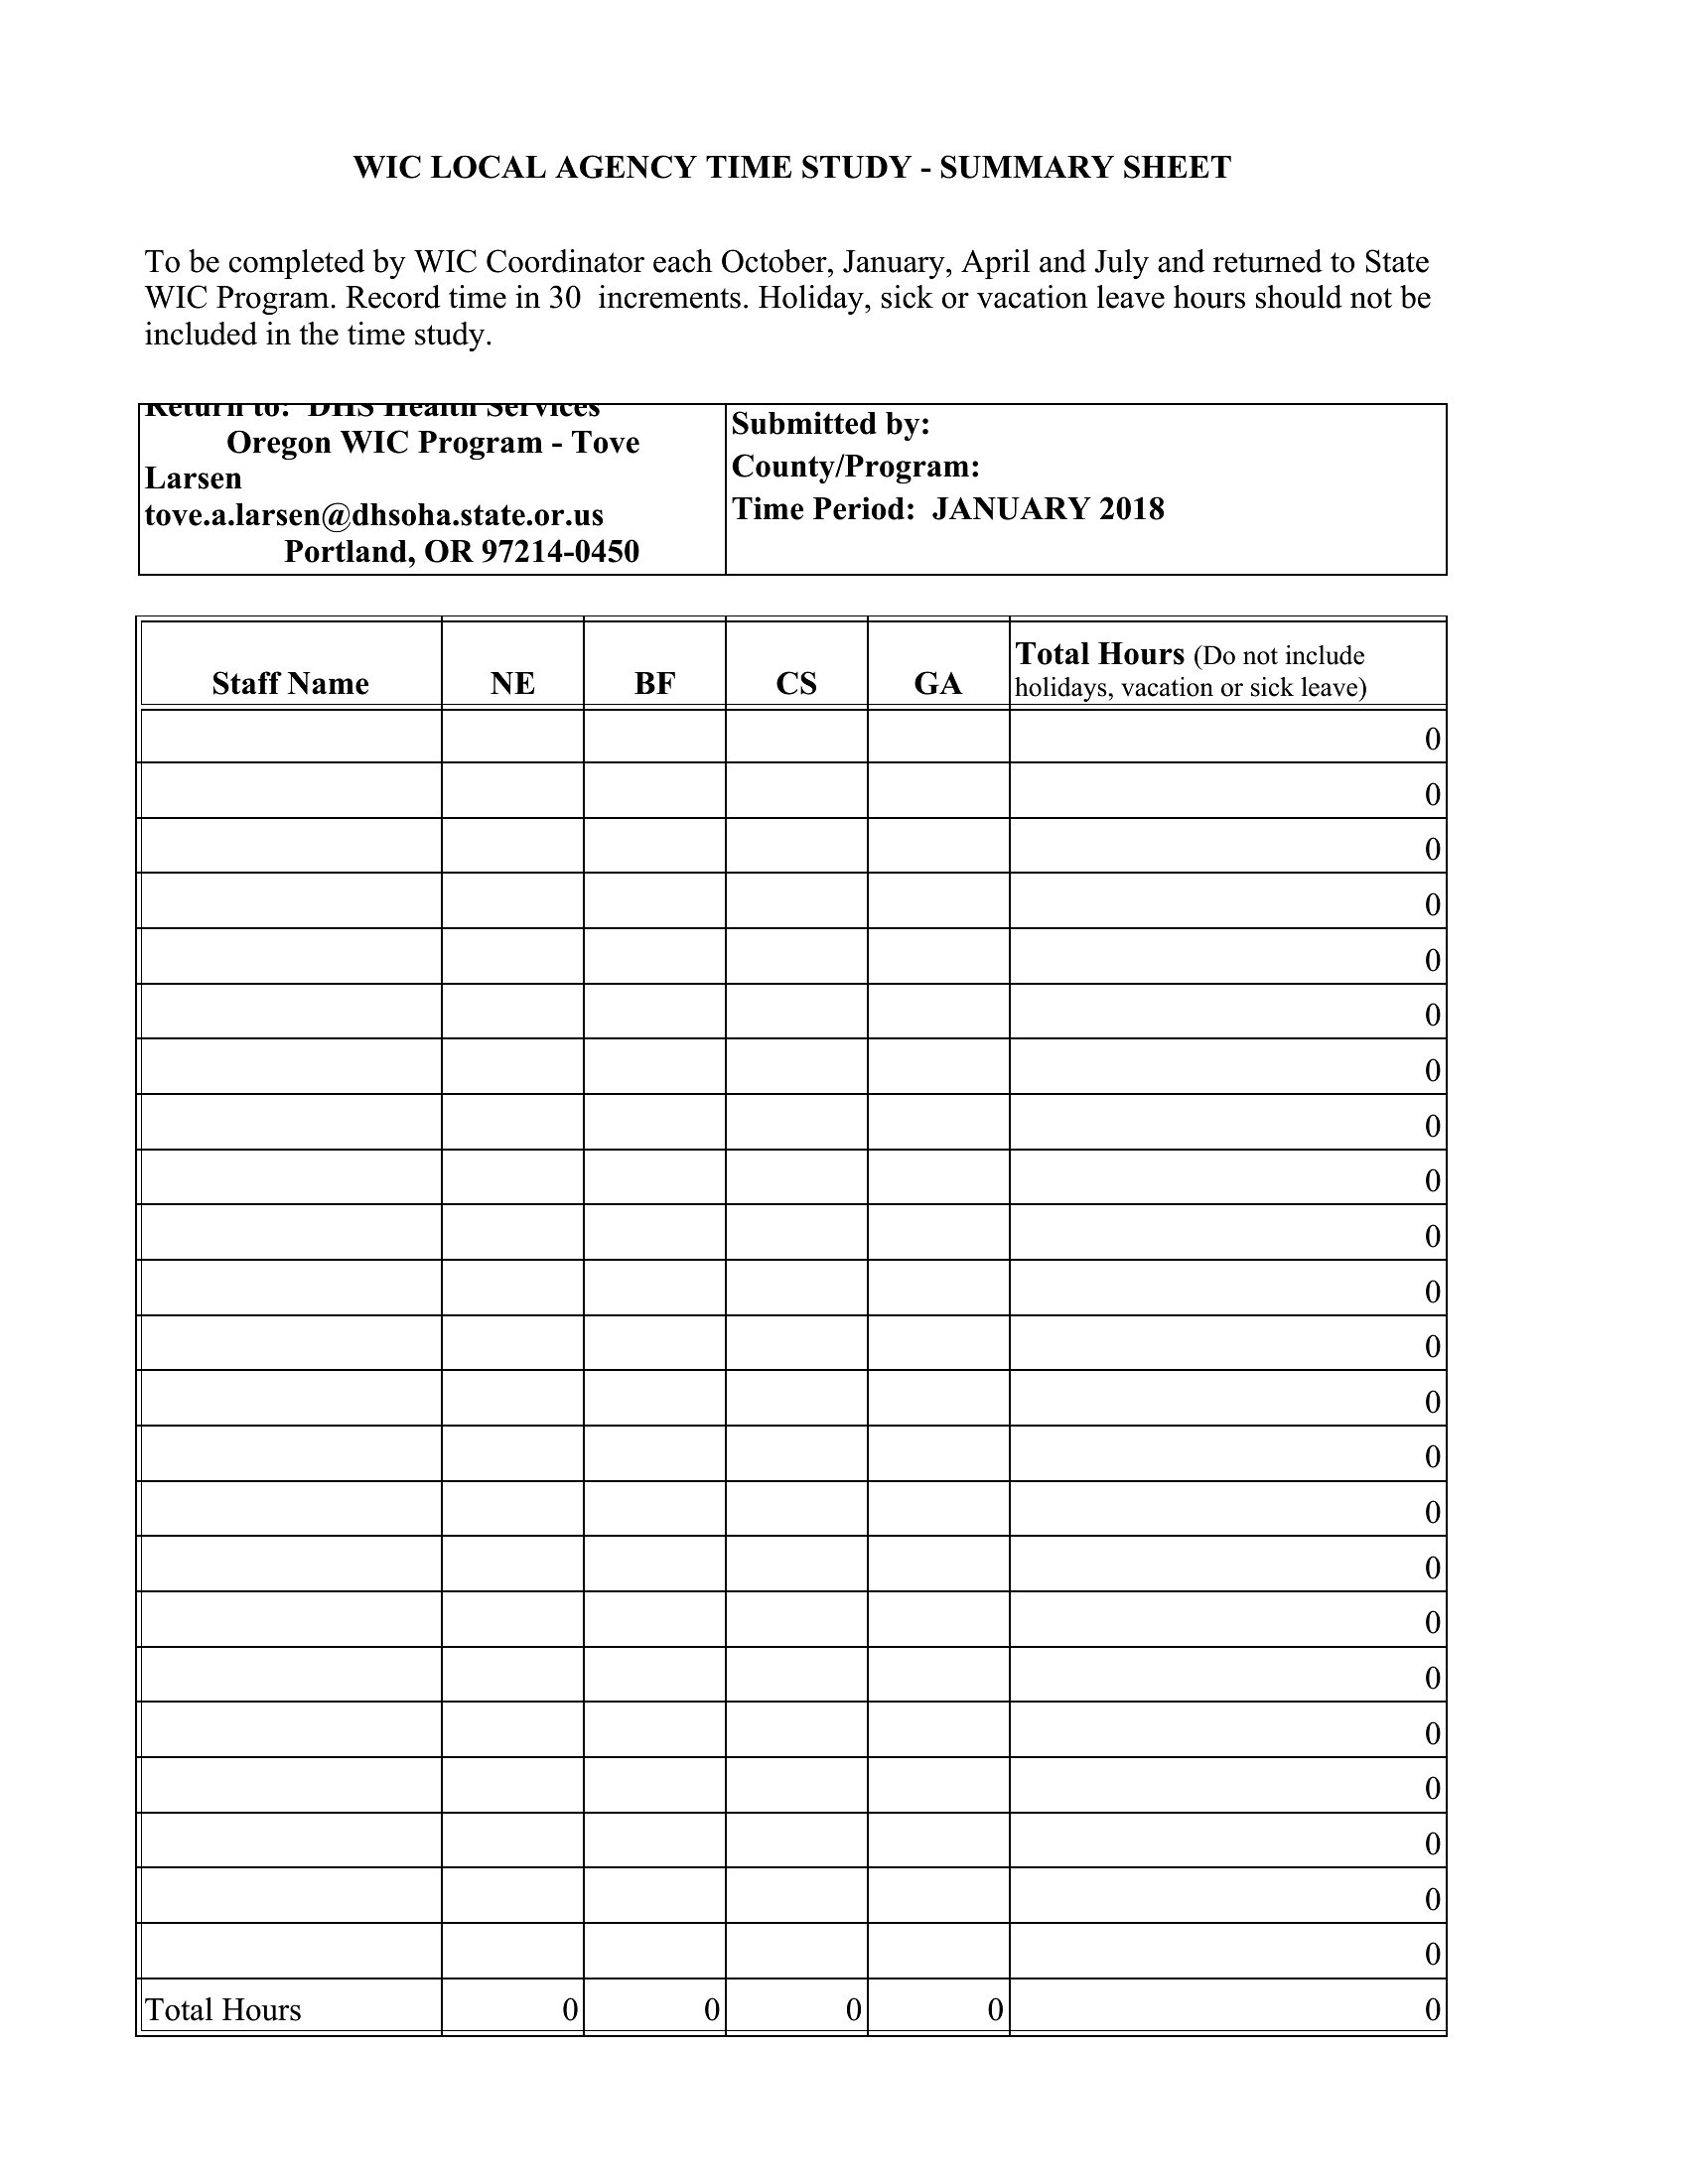
Yes, these templates include fields for shift codes, operator IDs, and date stamps, making it easy to organize data by group. You can then filter or sort results in Excel to spot trends between shifts or teams. For deeper comparisons, combine multiple studies into one spreadsheet to calculate overall averages or identify outliers.
What should I do if a task has variable steps depending on the operator’s experience level?
Use the observation notes section in the template to document when steps are skipped or combined. Some templates also include a ‘remarks’ column to flag deviations. For precise analysis, consider recording both the standard and actual steps taken during each cycle. This helps distinguish between process inefficiencies and operator-specific habits.
How do I determine a reliable sample size for my time study?
There’s no one-size-fits-all answer, but these templates assume you’re following lean principles, where 5–10 cycles per task (with stable conditions) often provides meaningful data. For critical processes, aim for 15+ observations to account for natural variability. If possible, consult a statistician or use the Excel templates’ basic sample size calculators as a starting point.
Comments
Join the conversation
Sign in to share your thoughts and leave a comment on this resource.