Skip to content
50% off this one-time $1.99 pack with HALFOFF — or unlimited with Pro.HALFOFF
Premium

Free Balanced Scorecard Templates (Excel)

Diagrams
veetikarvonen by veetikarvonen
Updated 0 downloads Quality-checked template

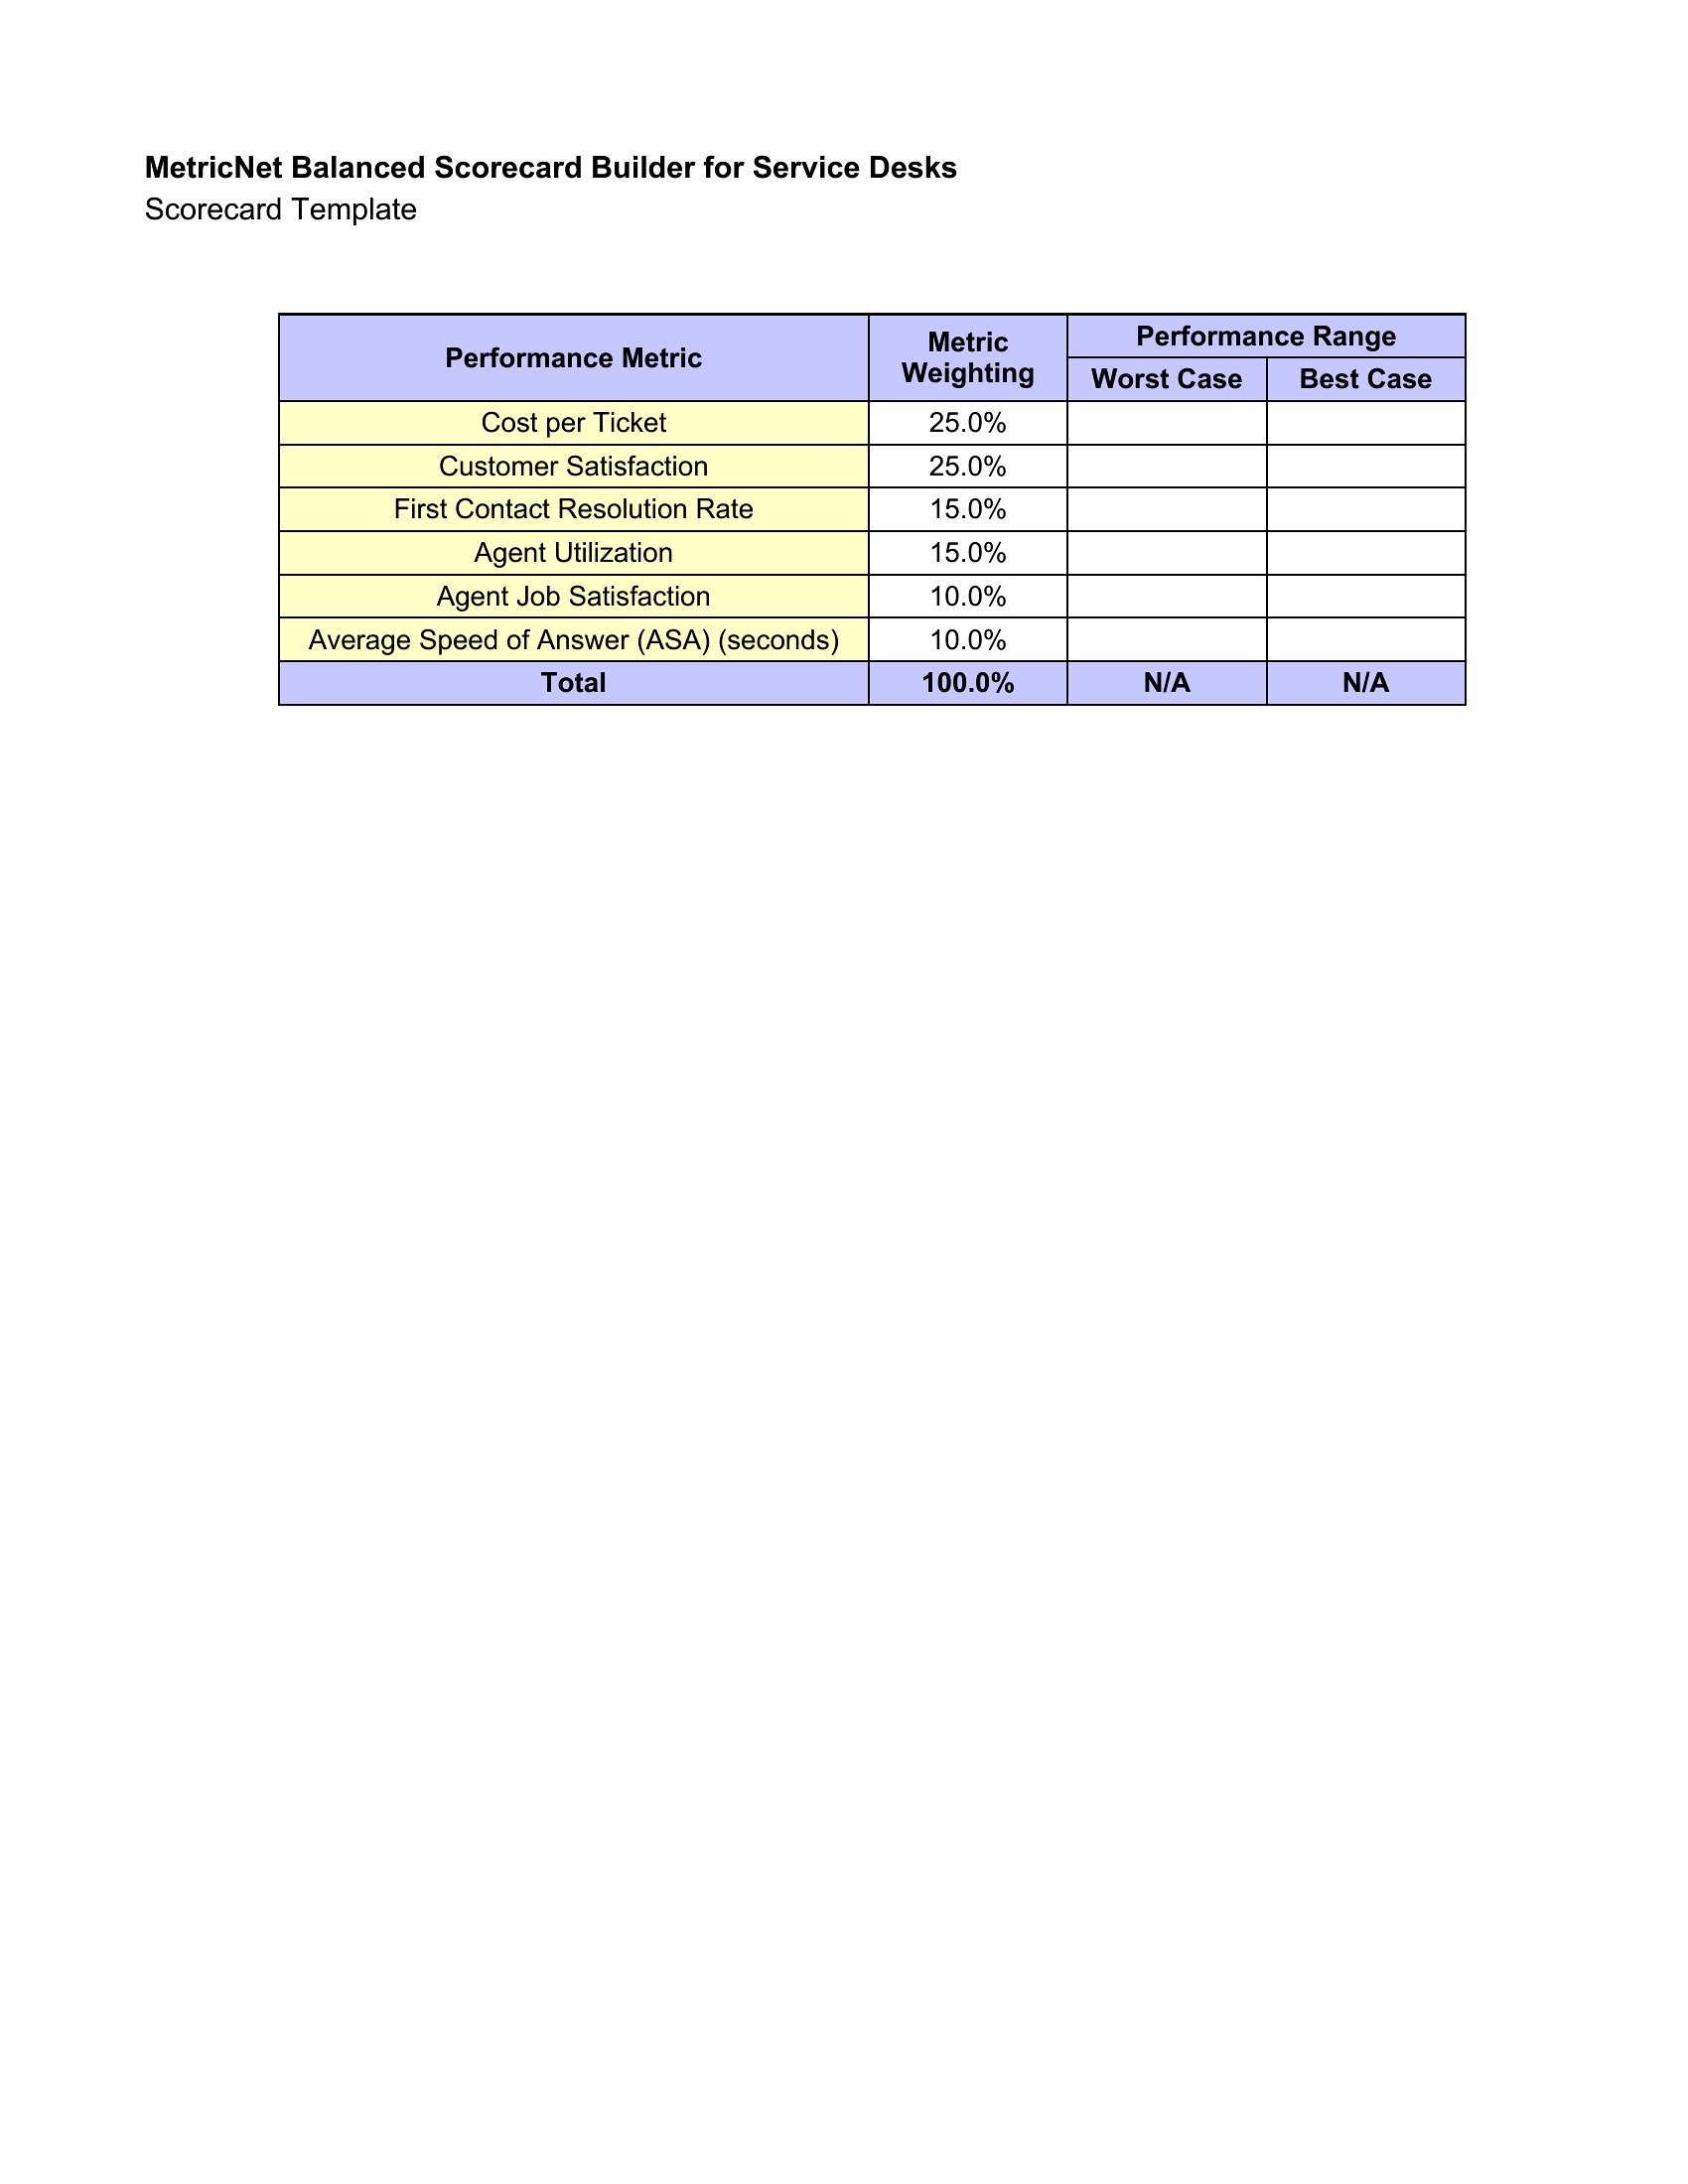
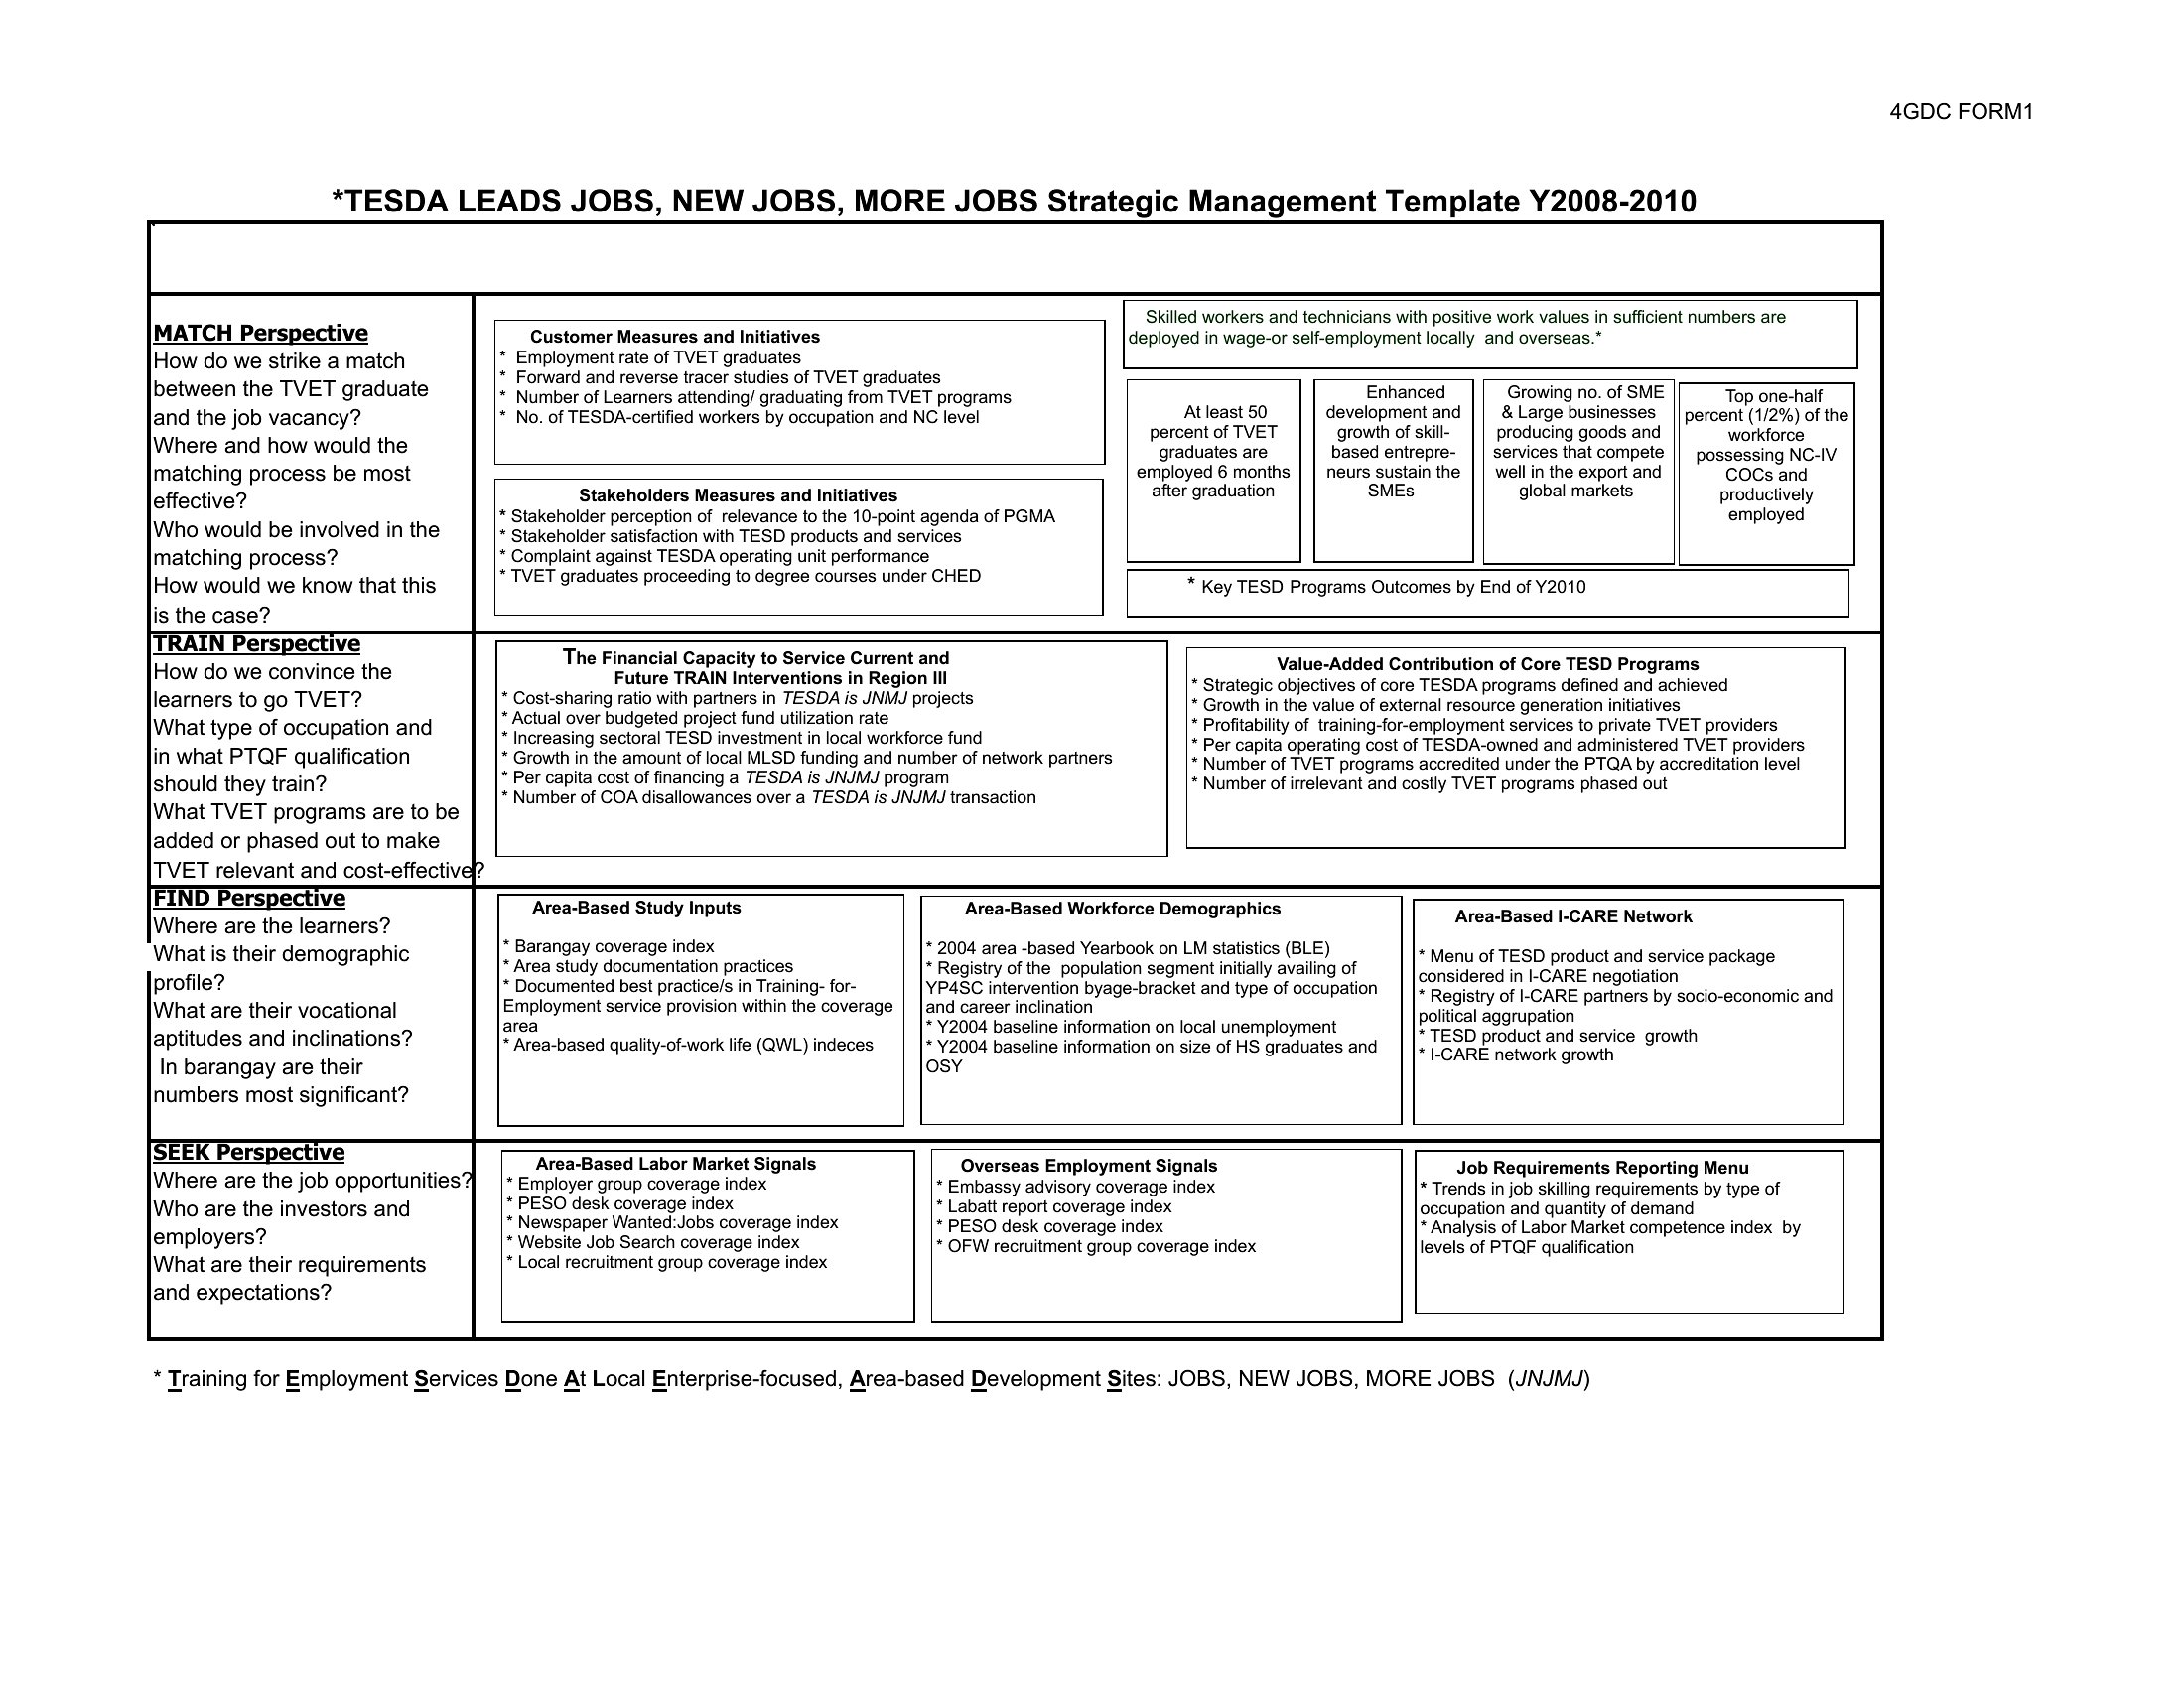
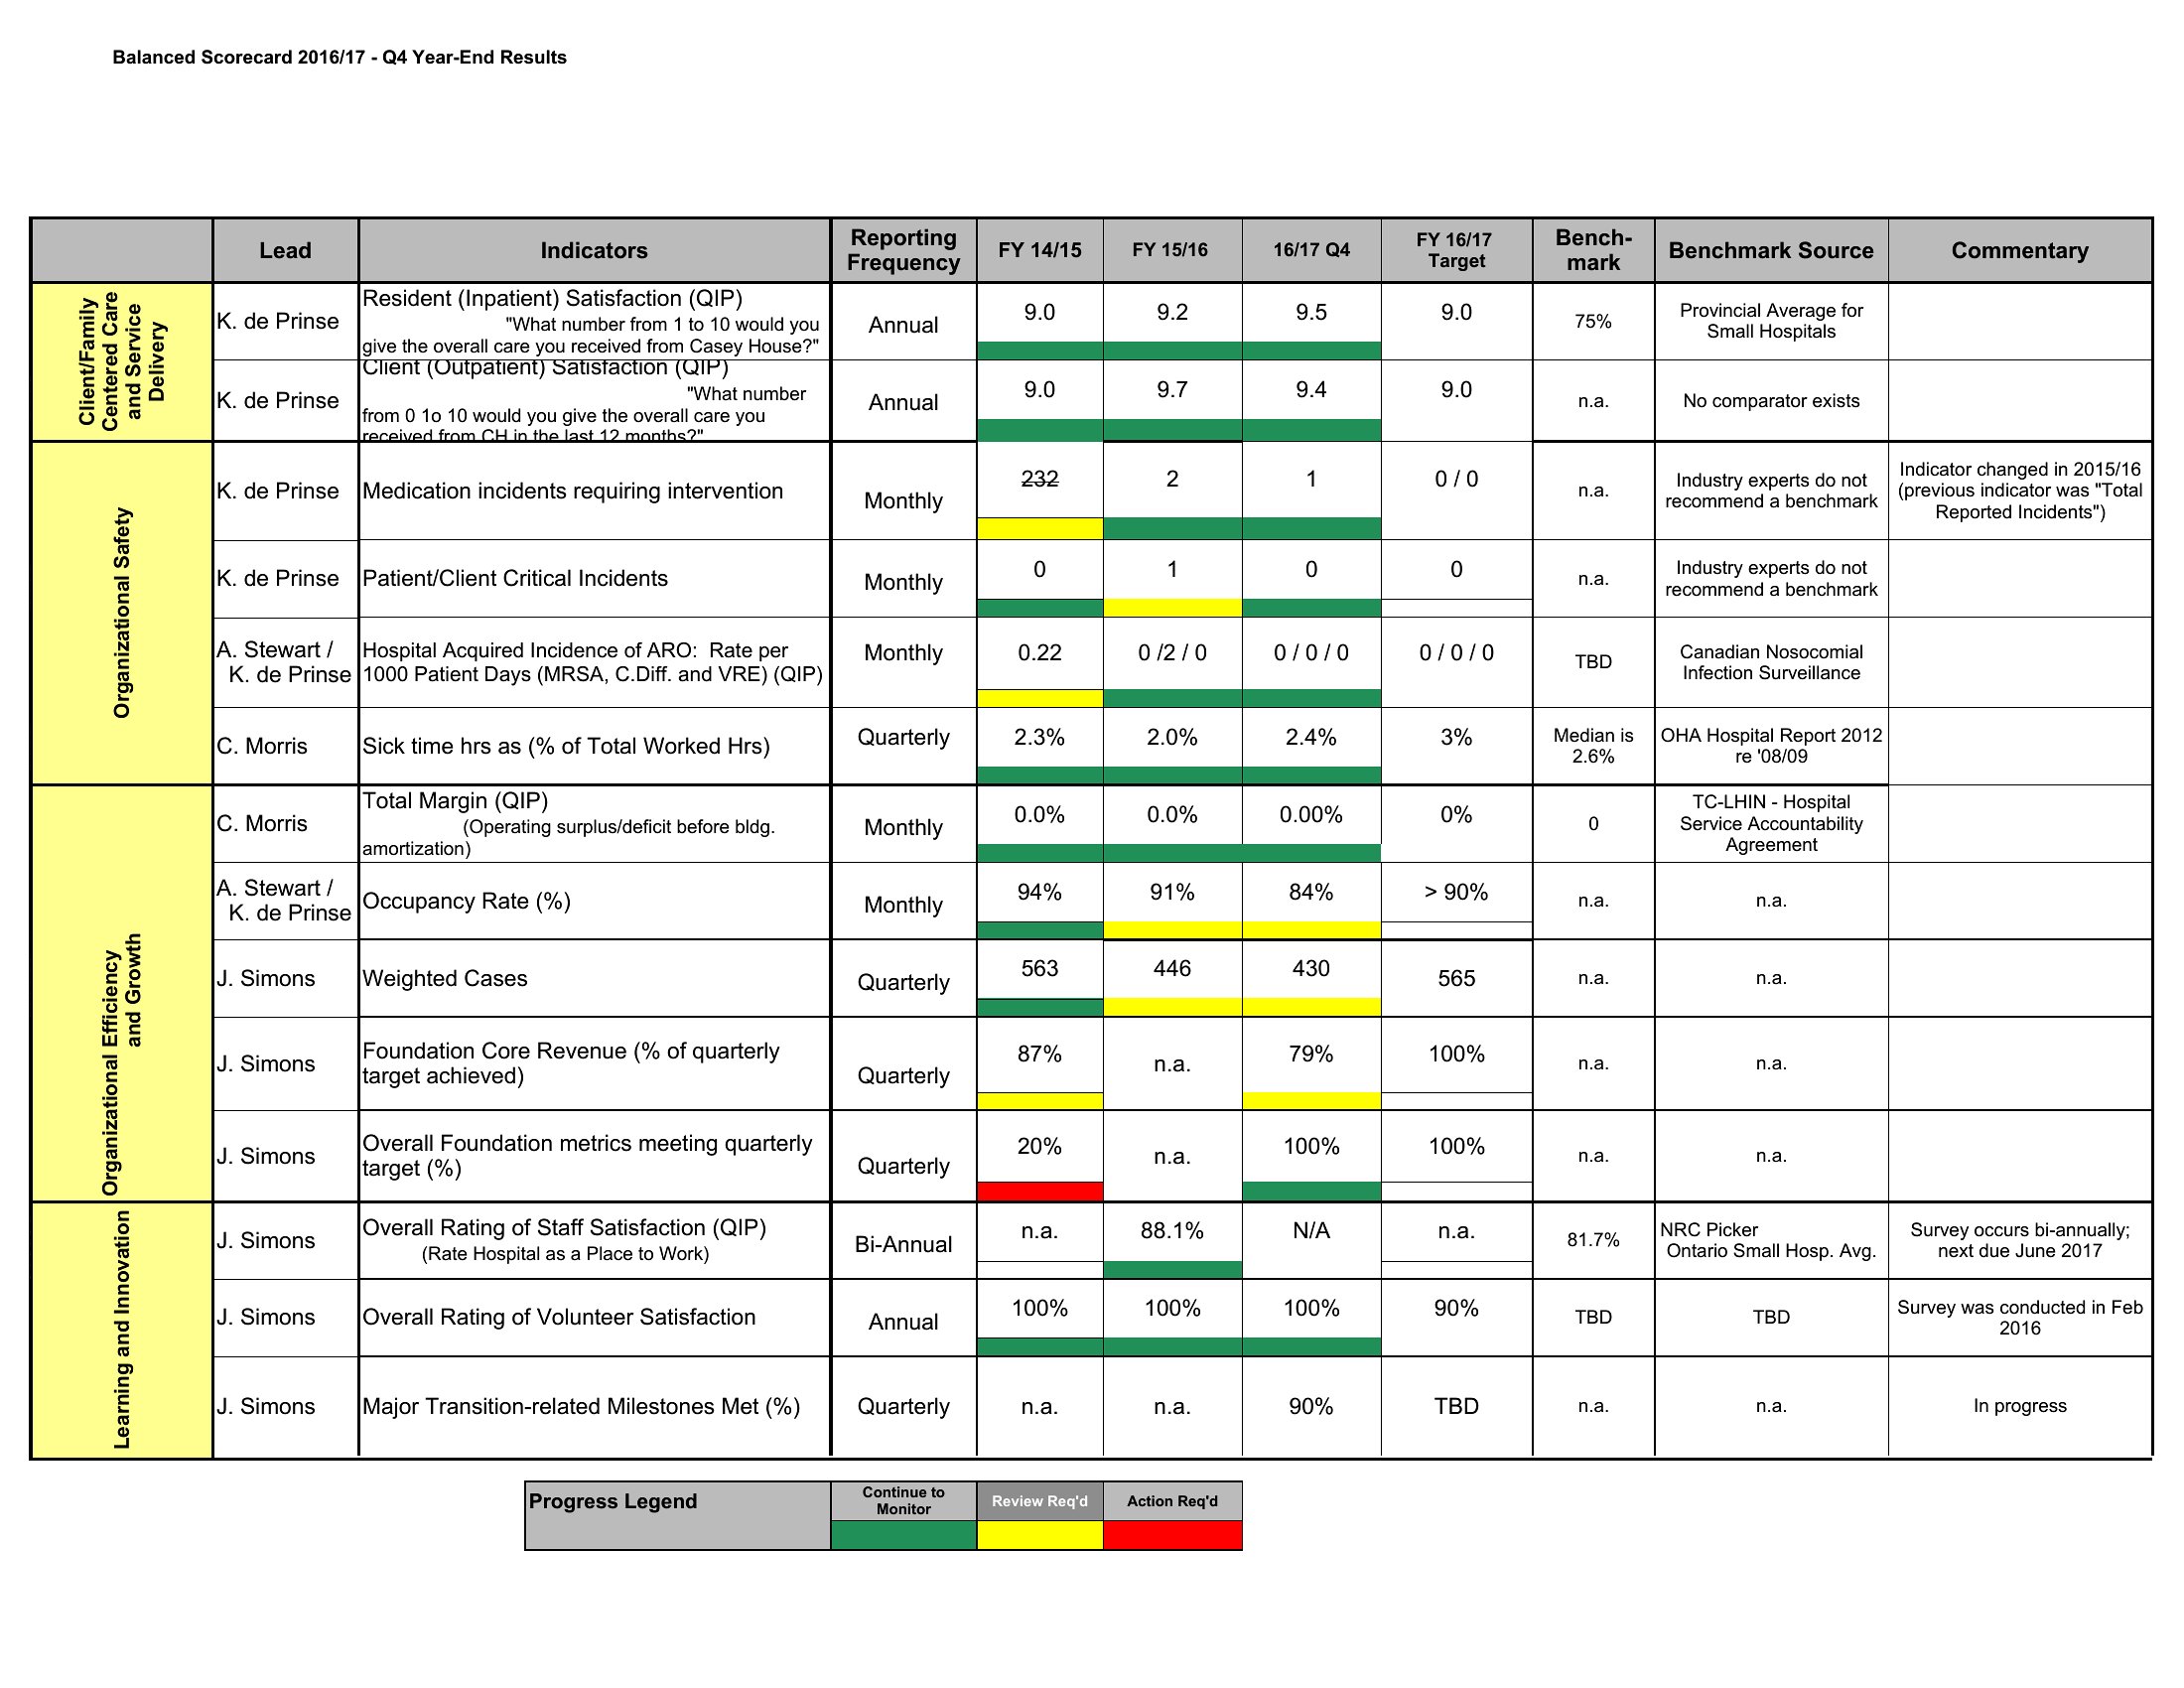
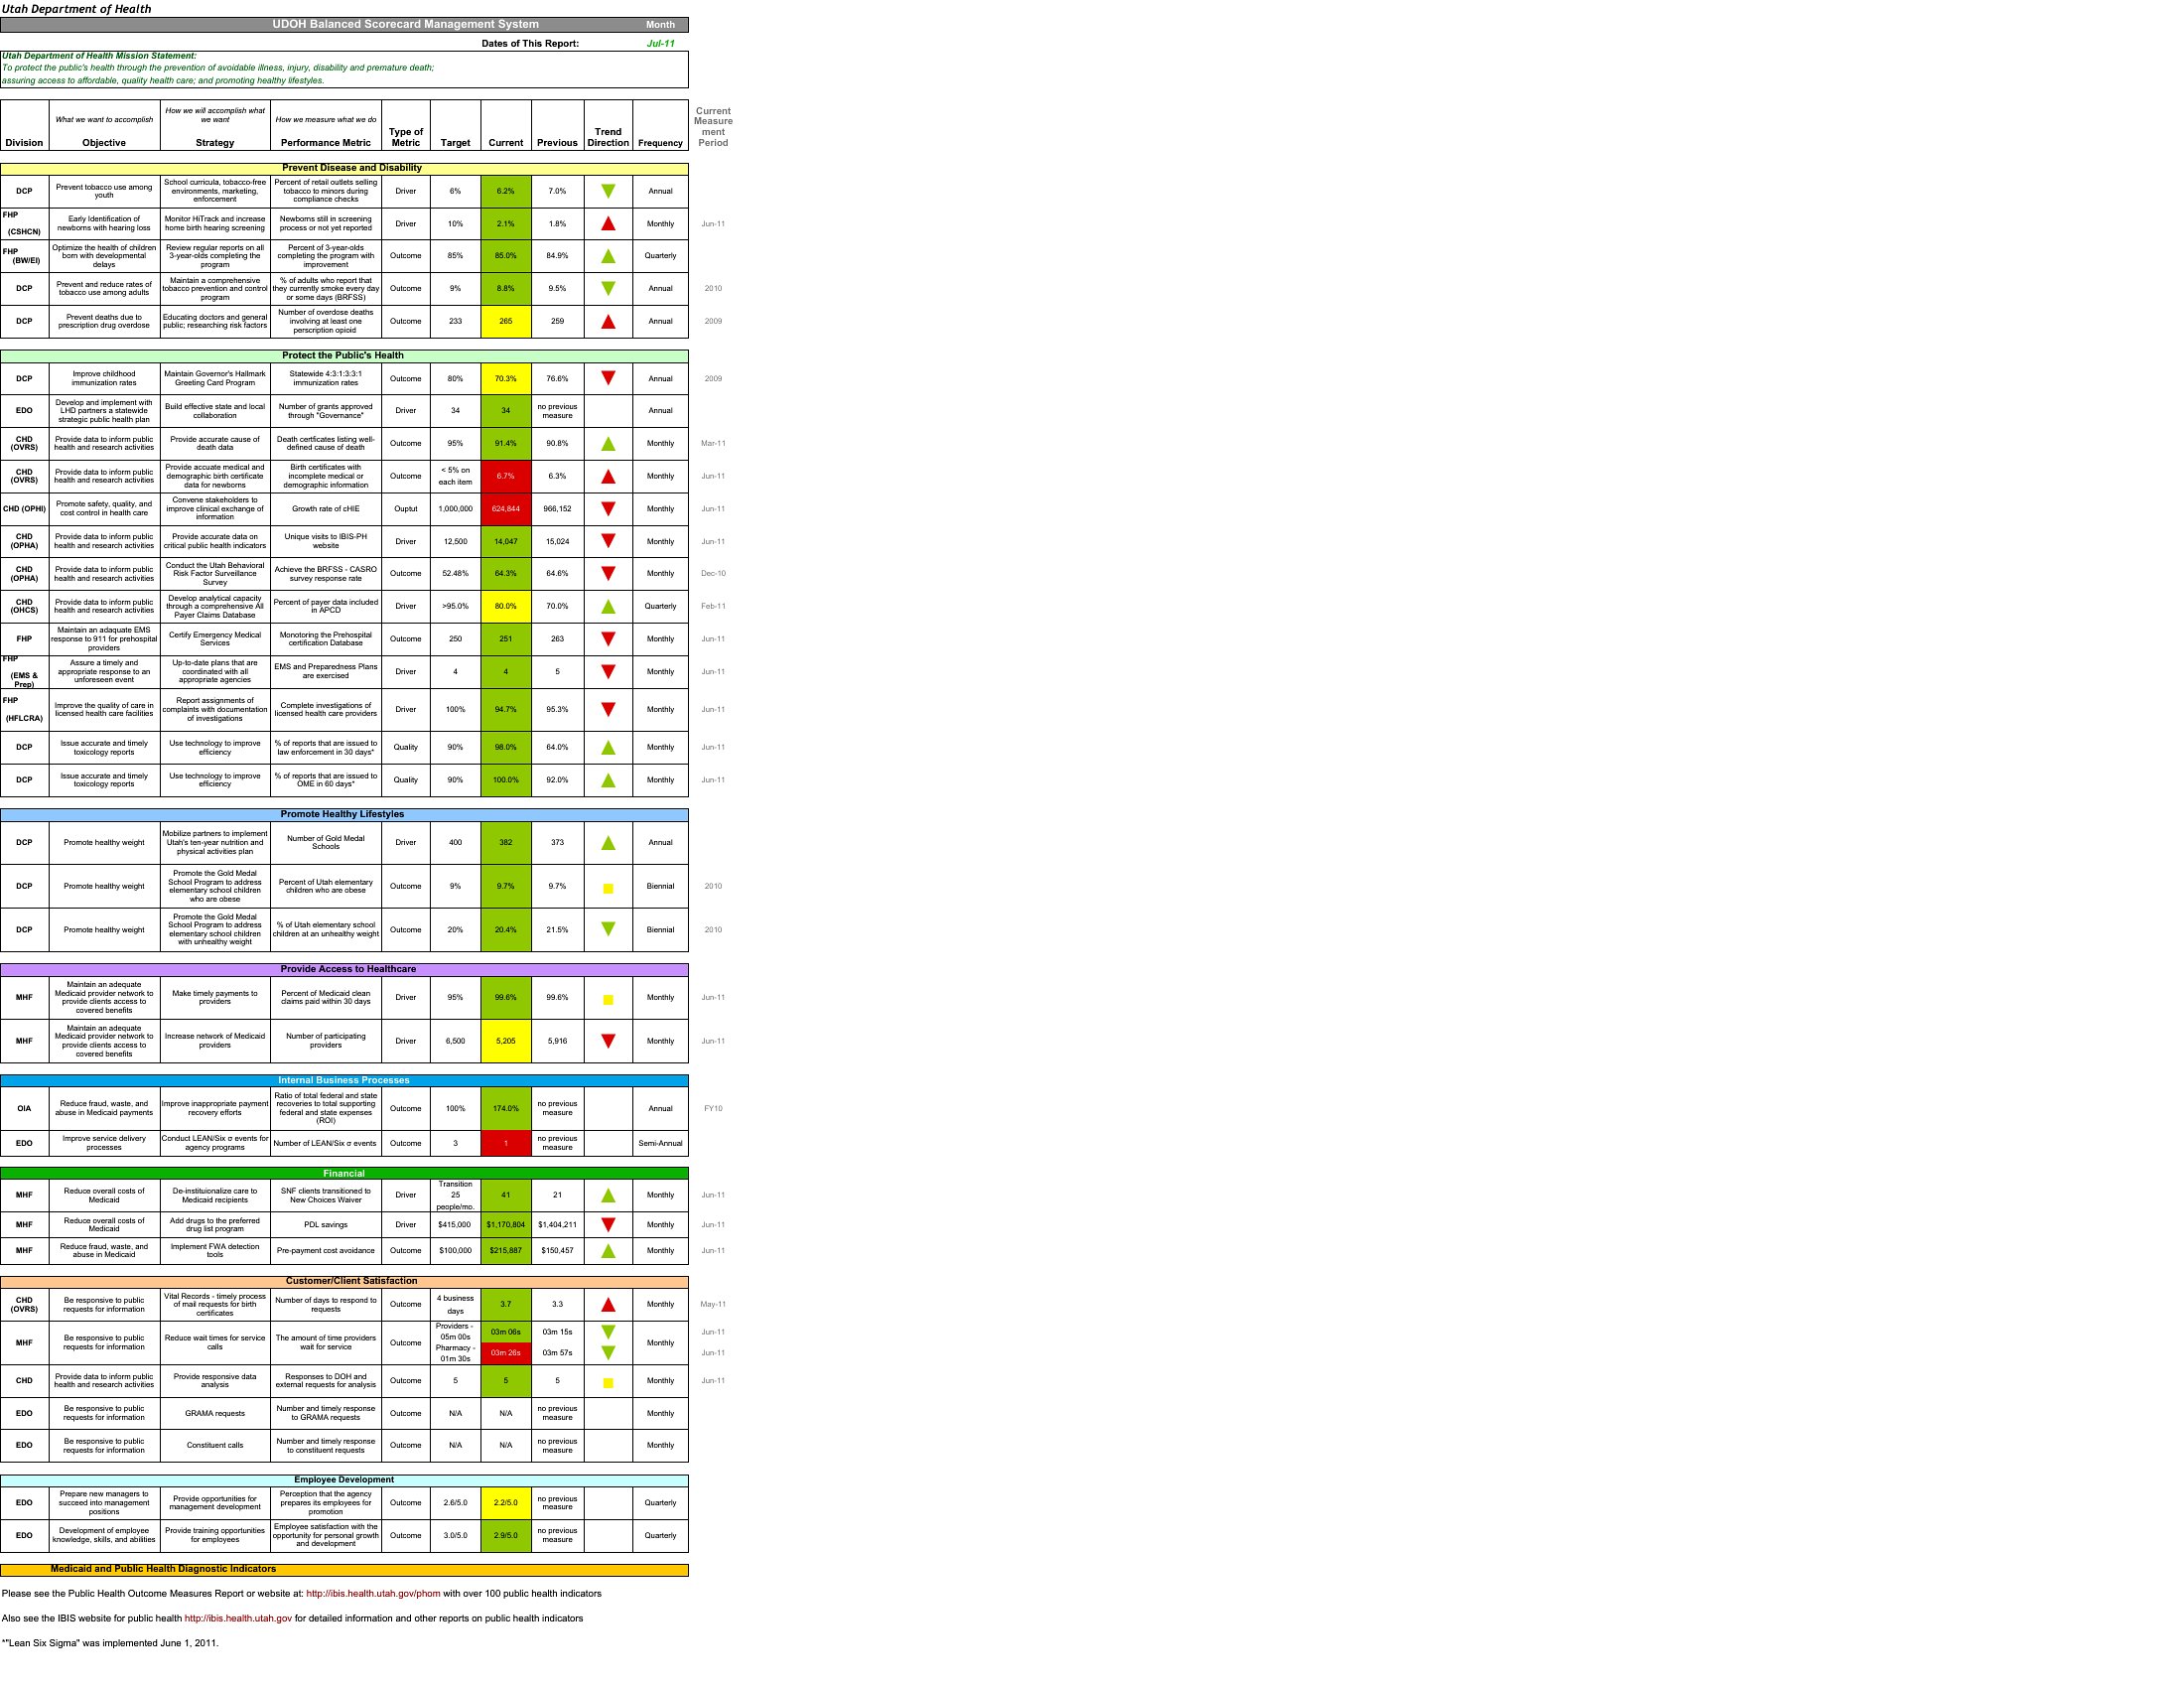
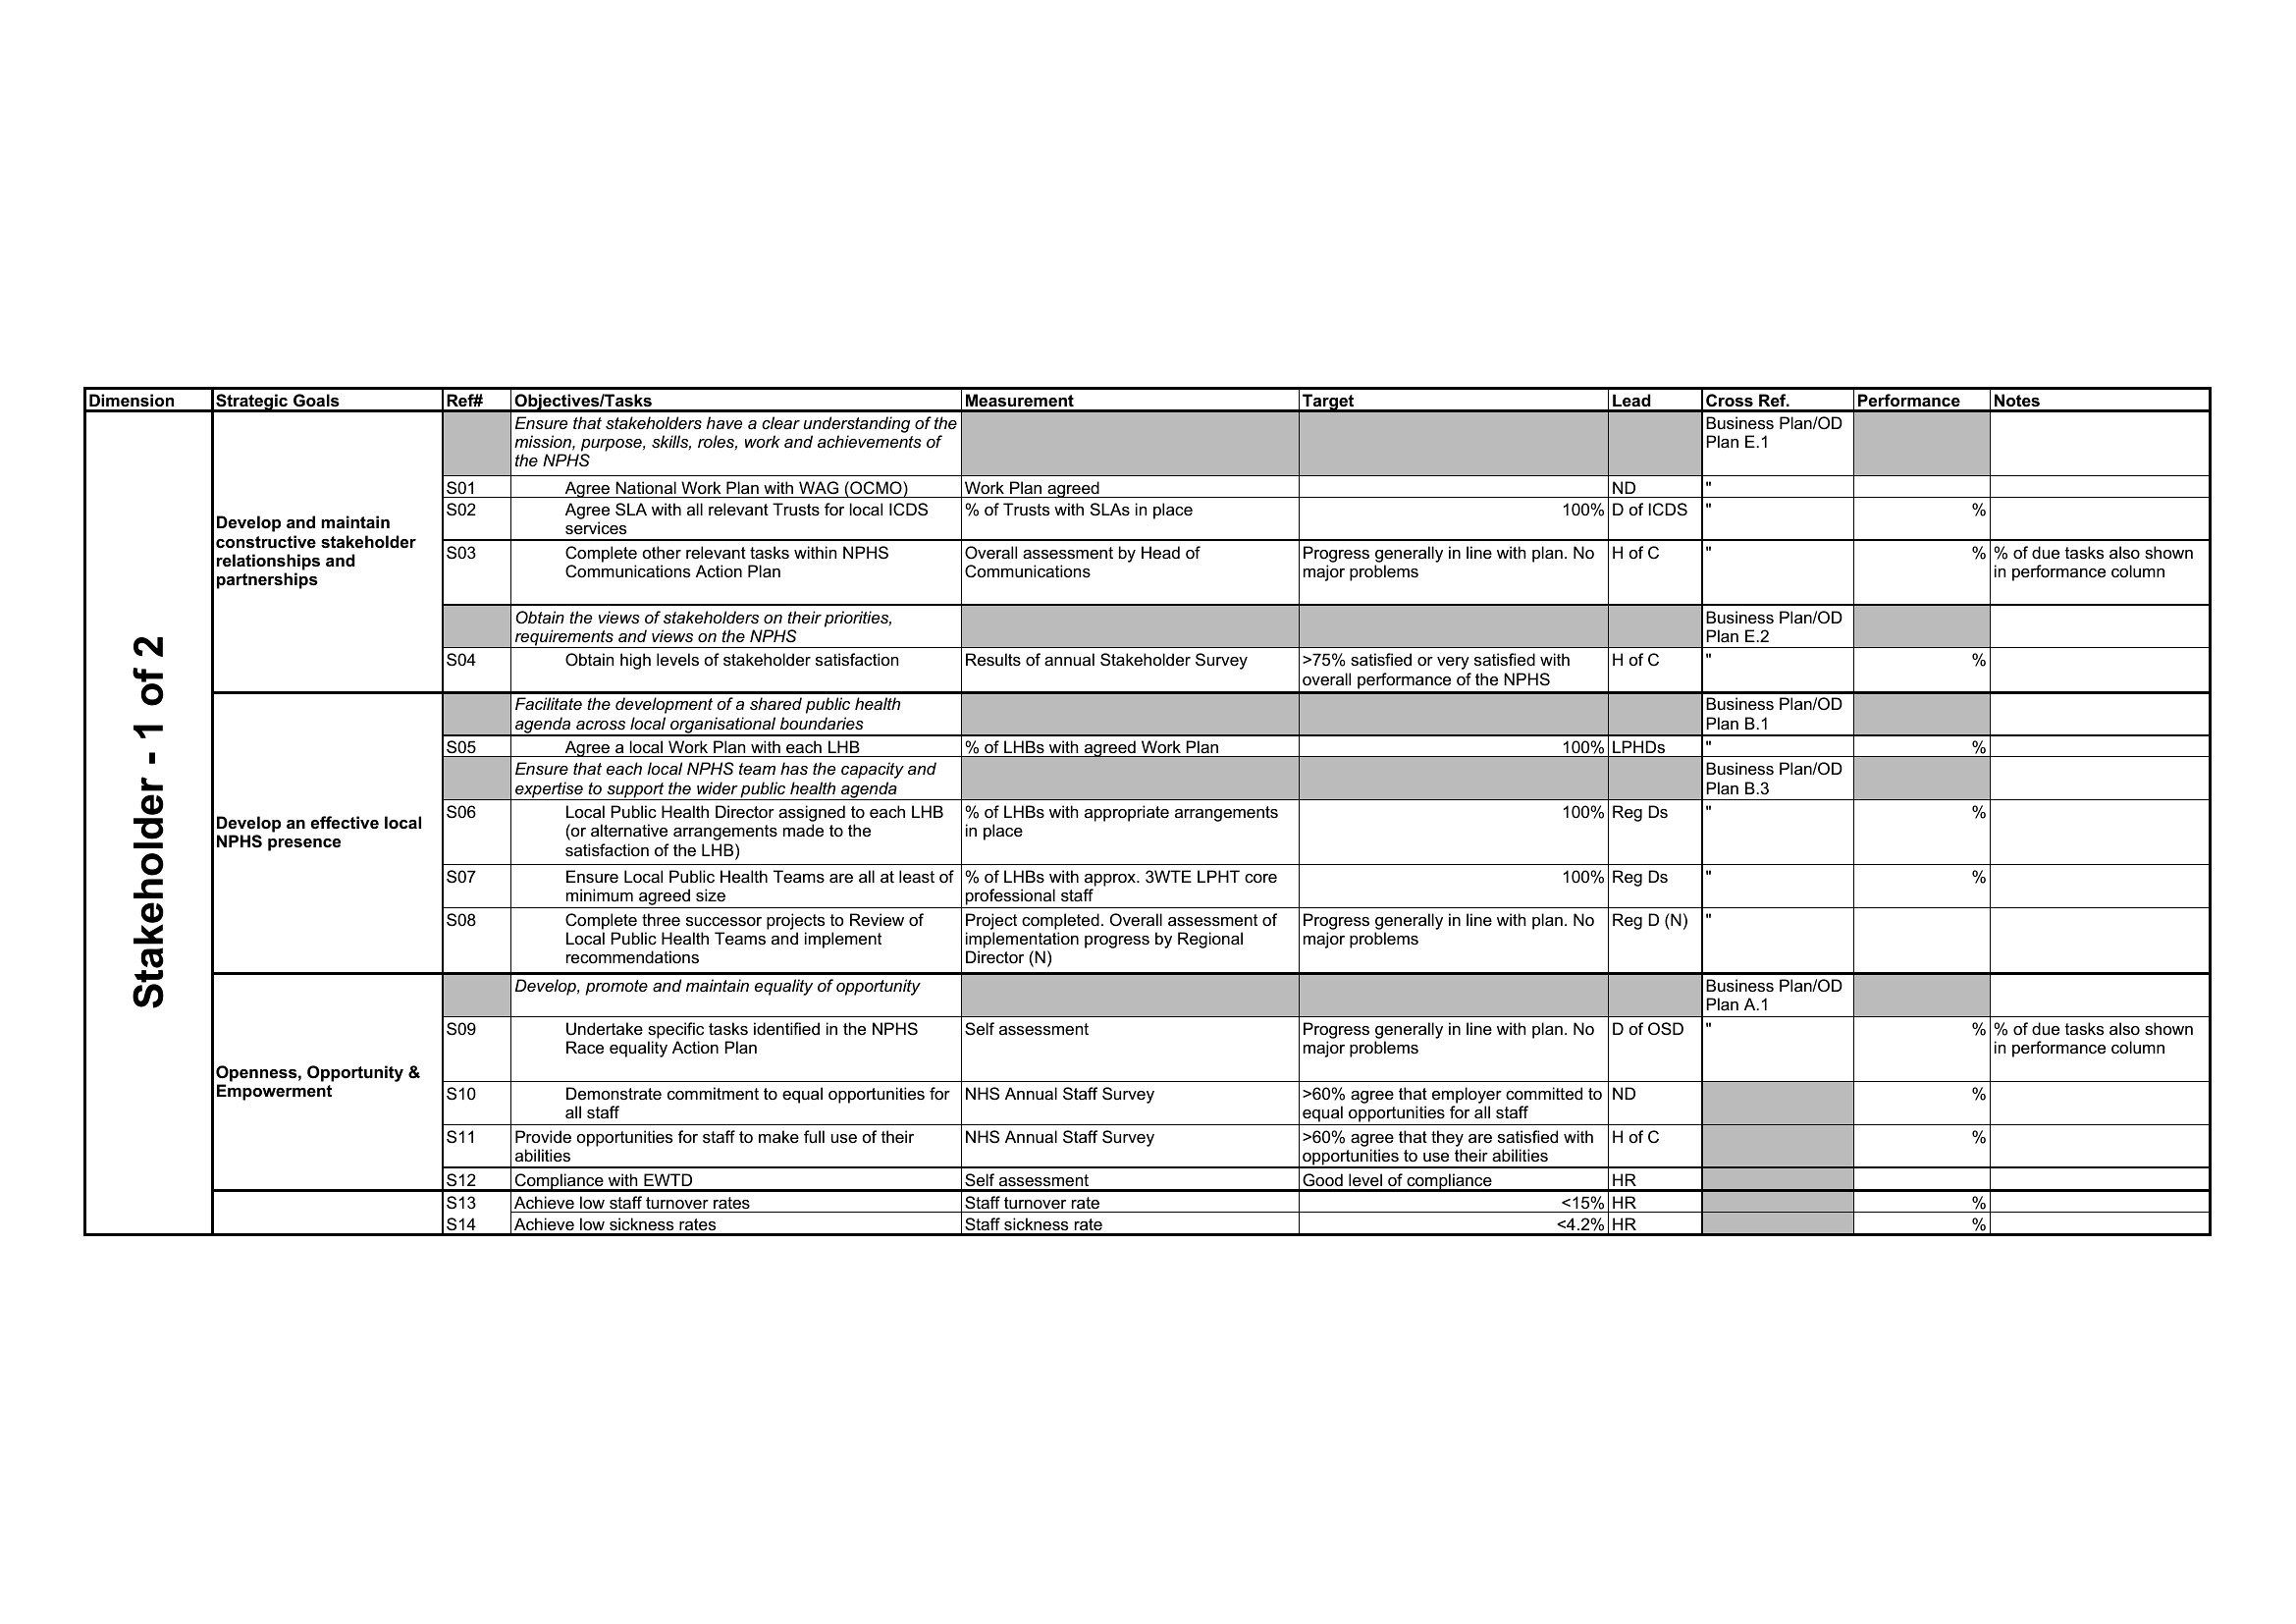
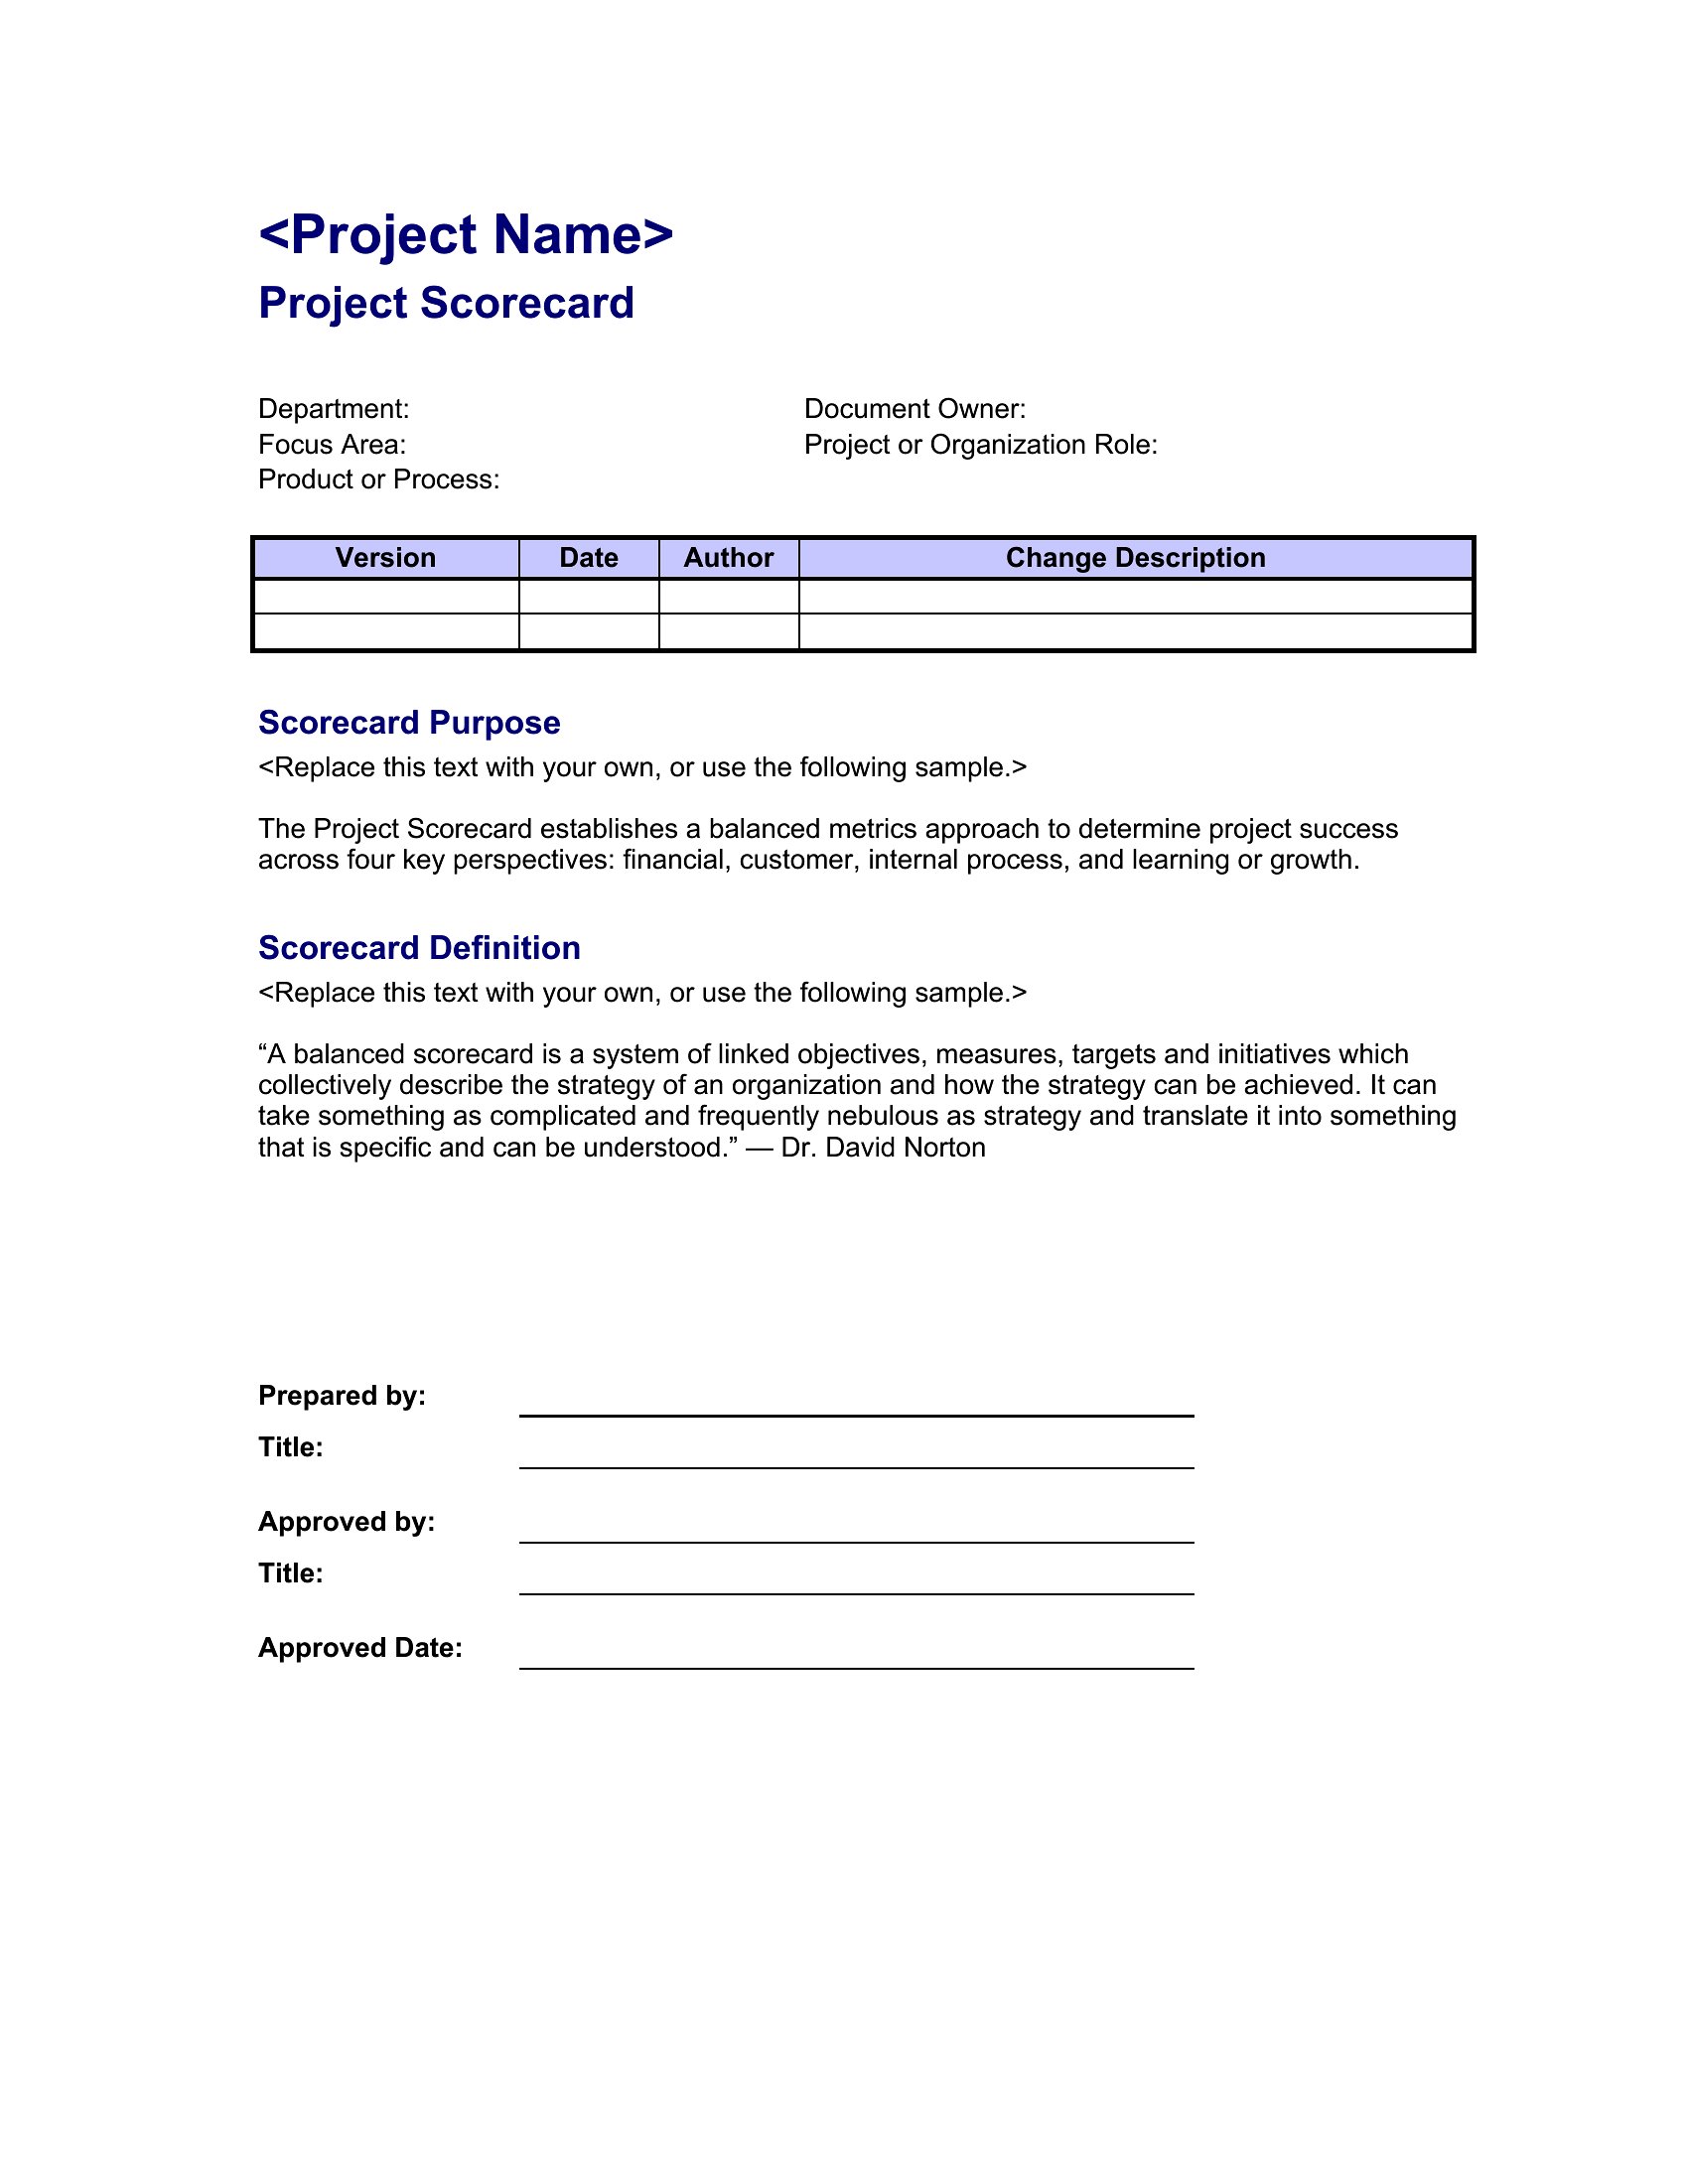
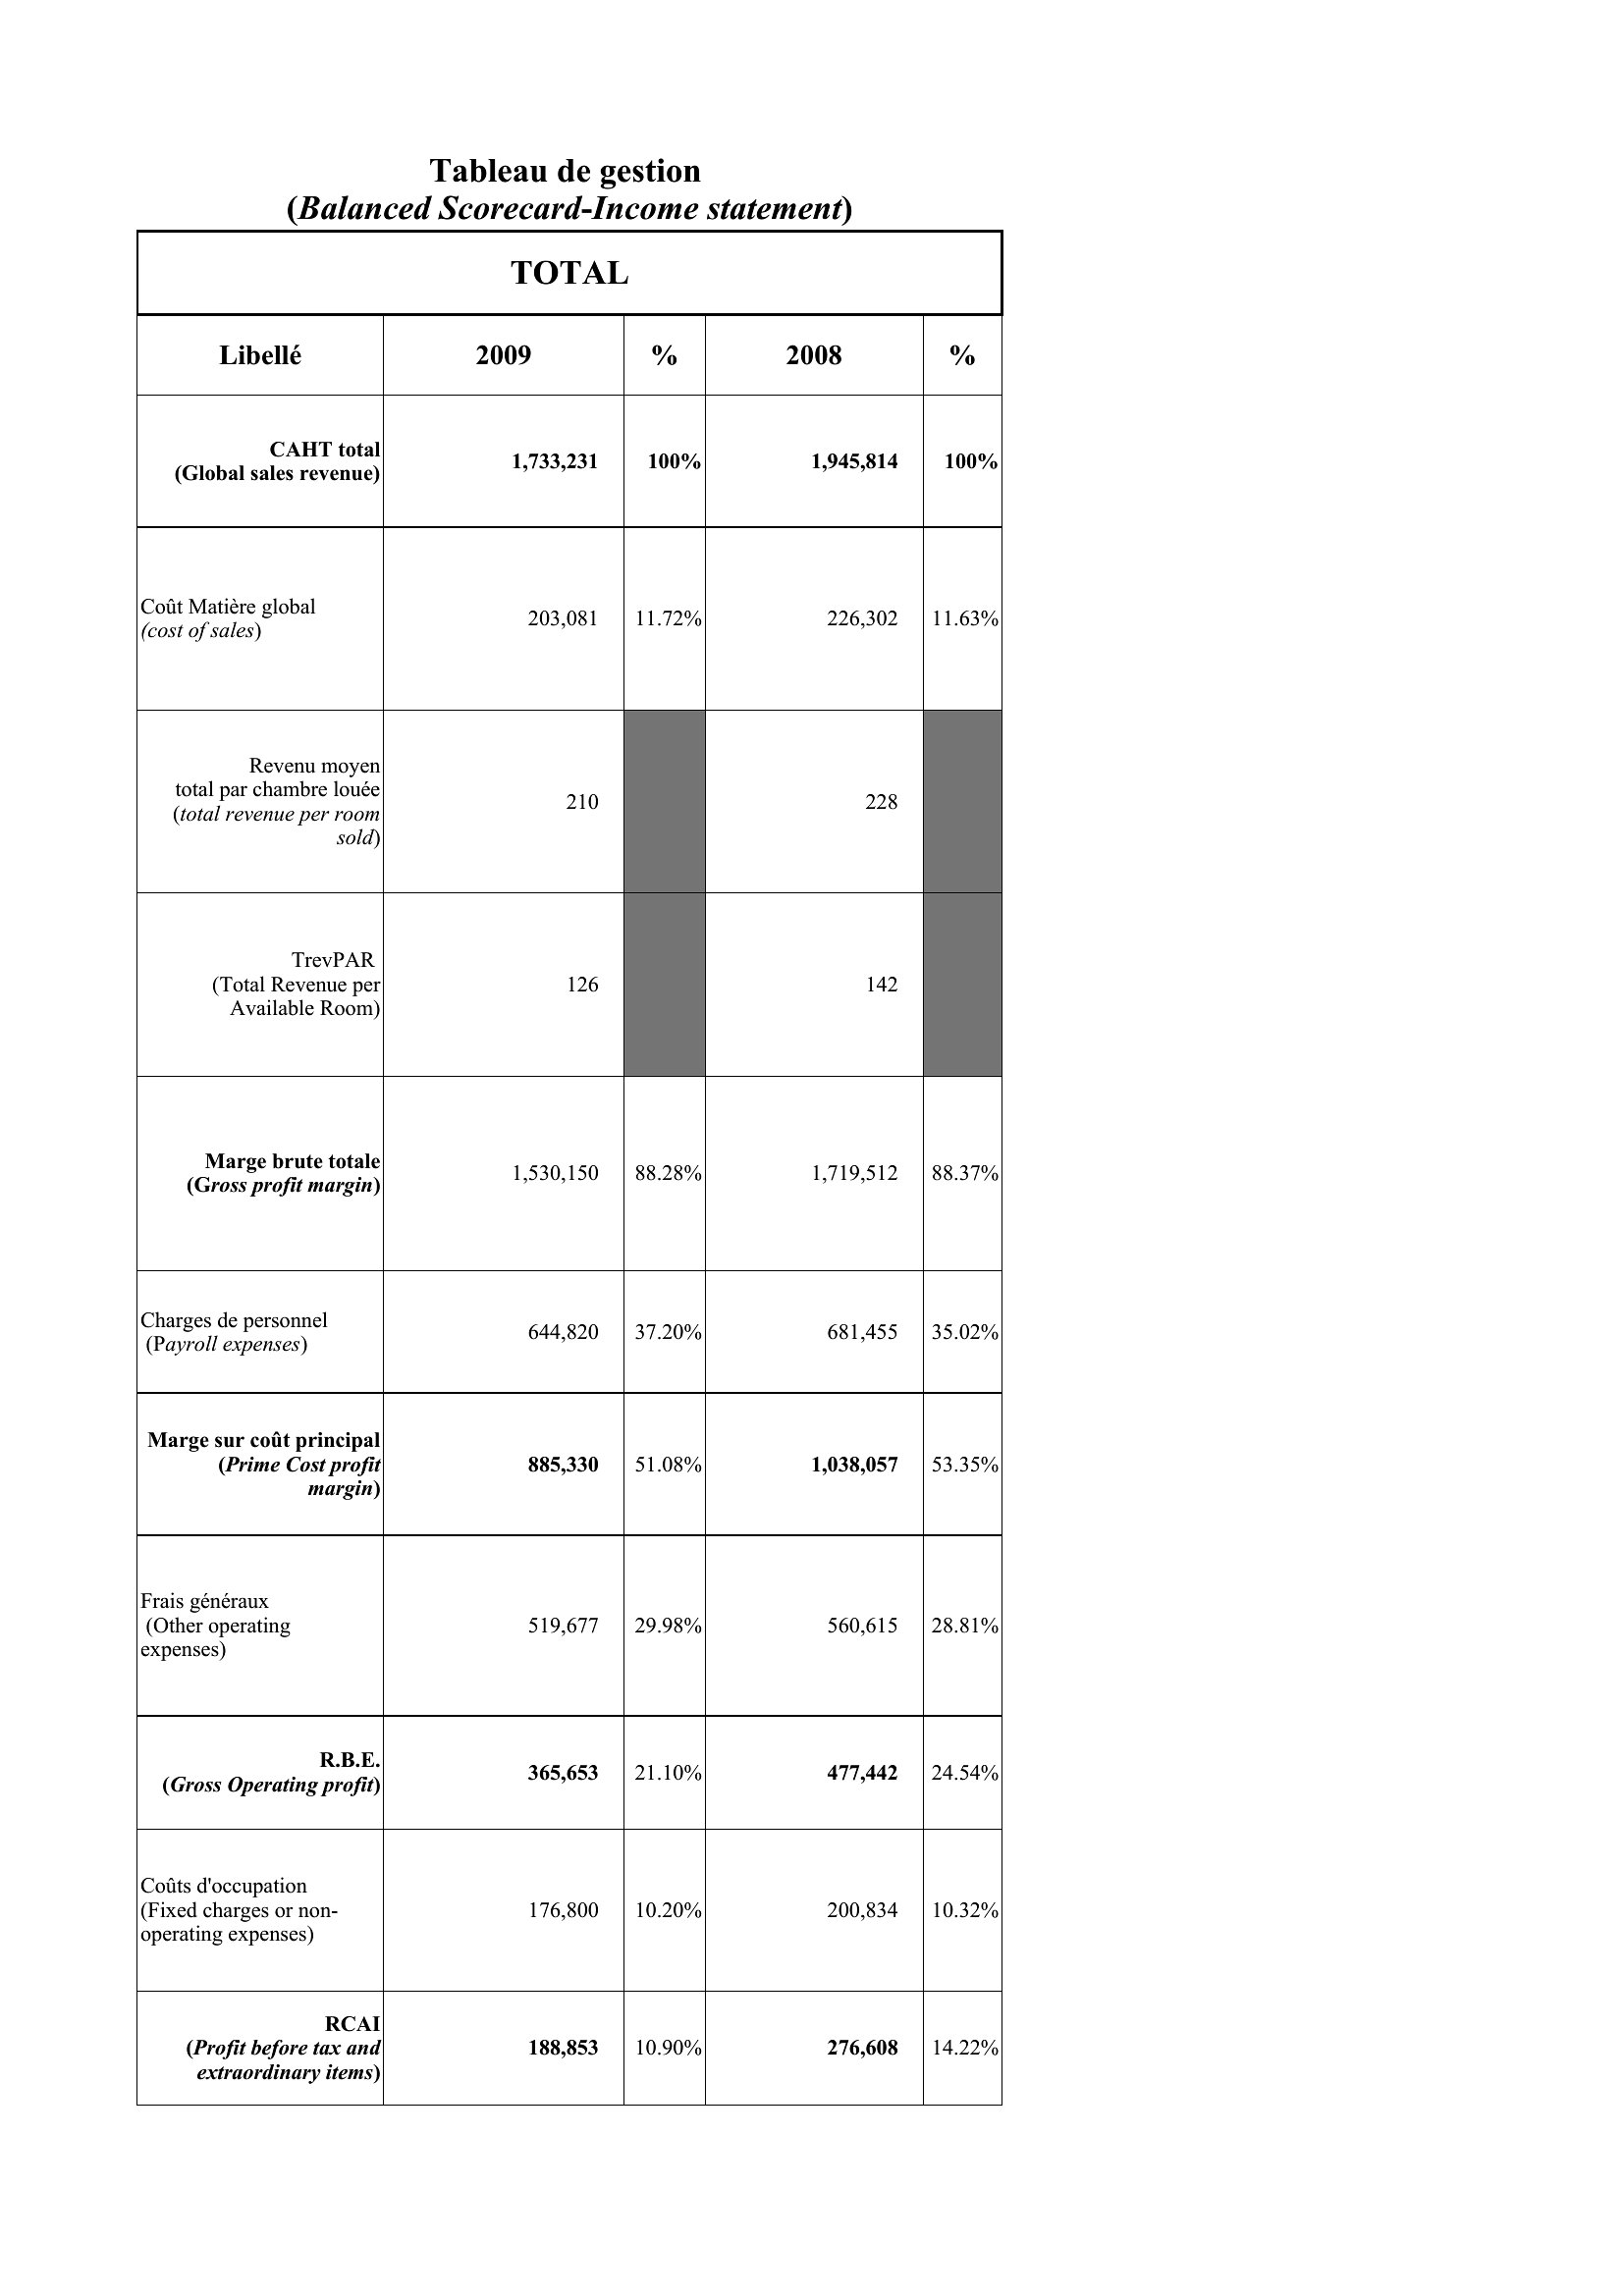
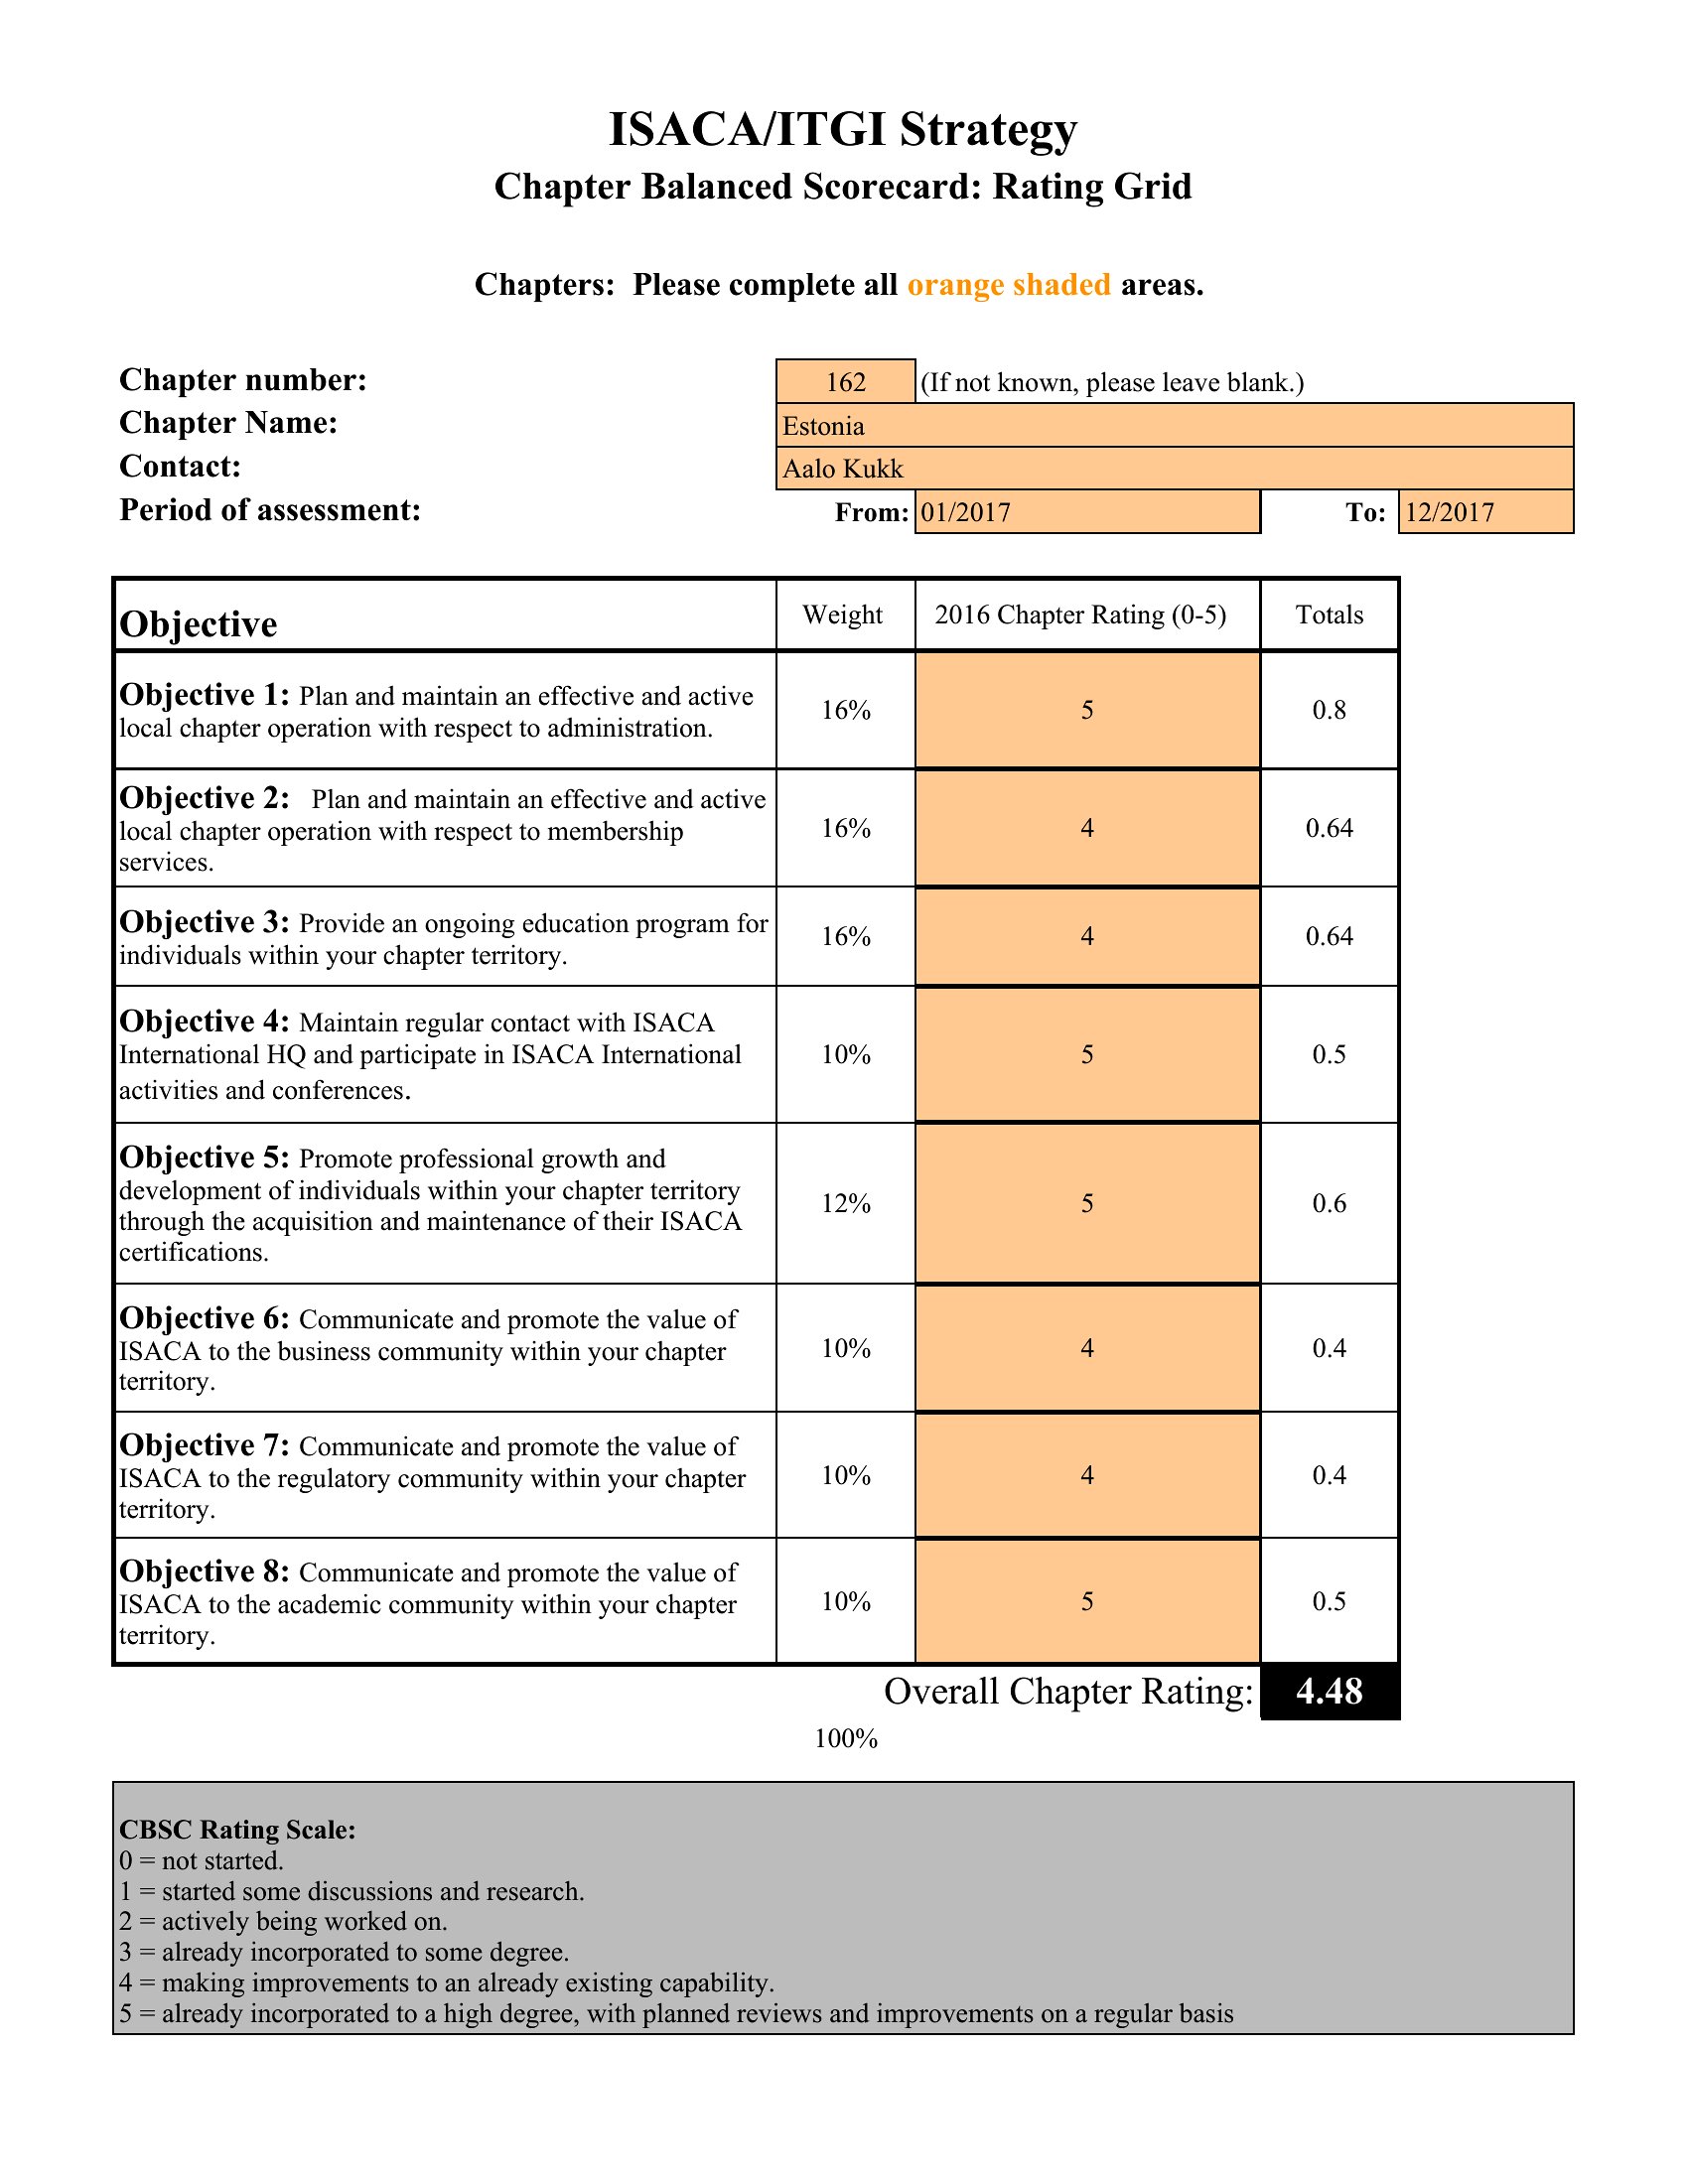
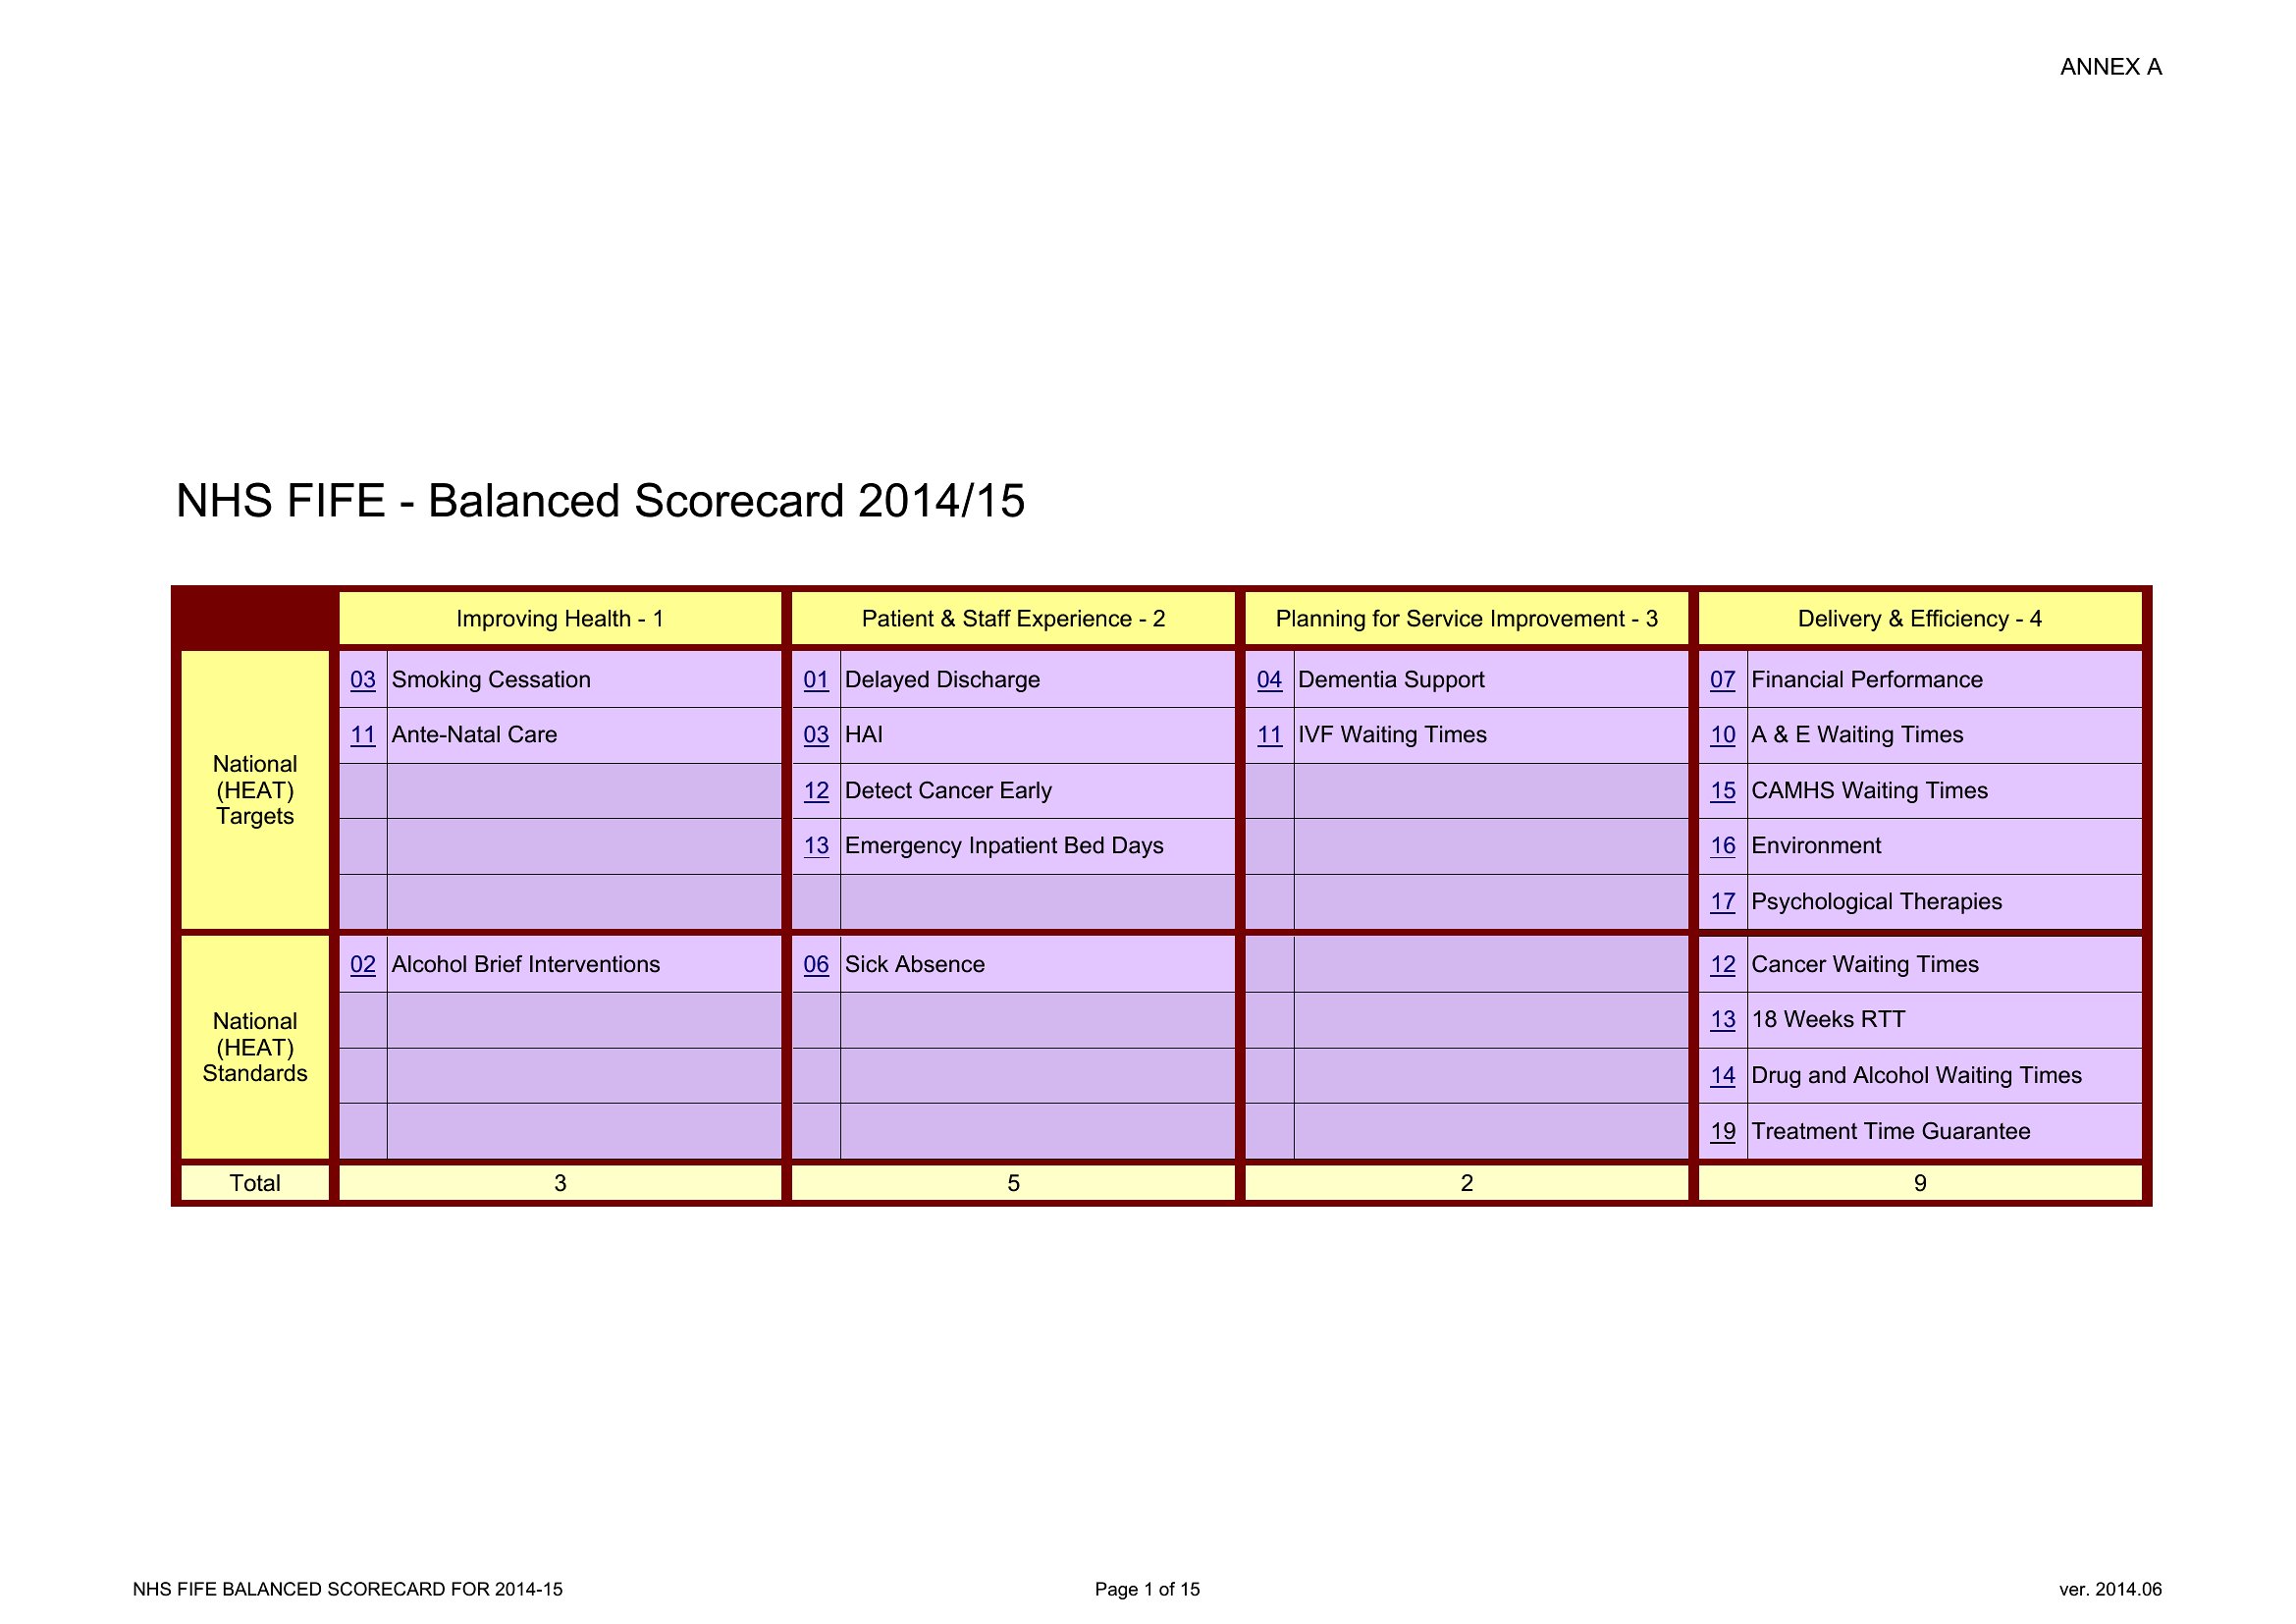
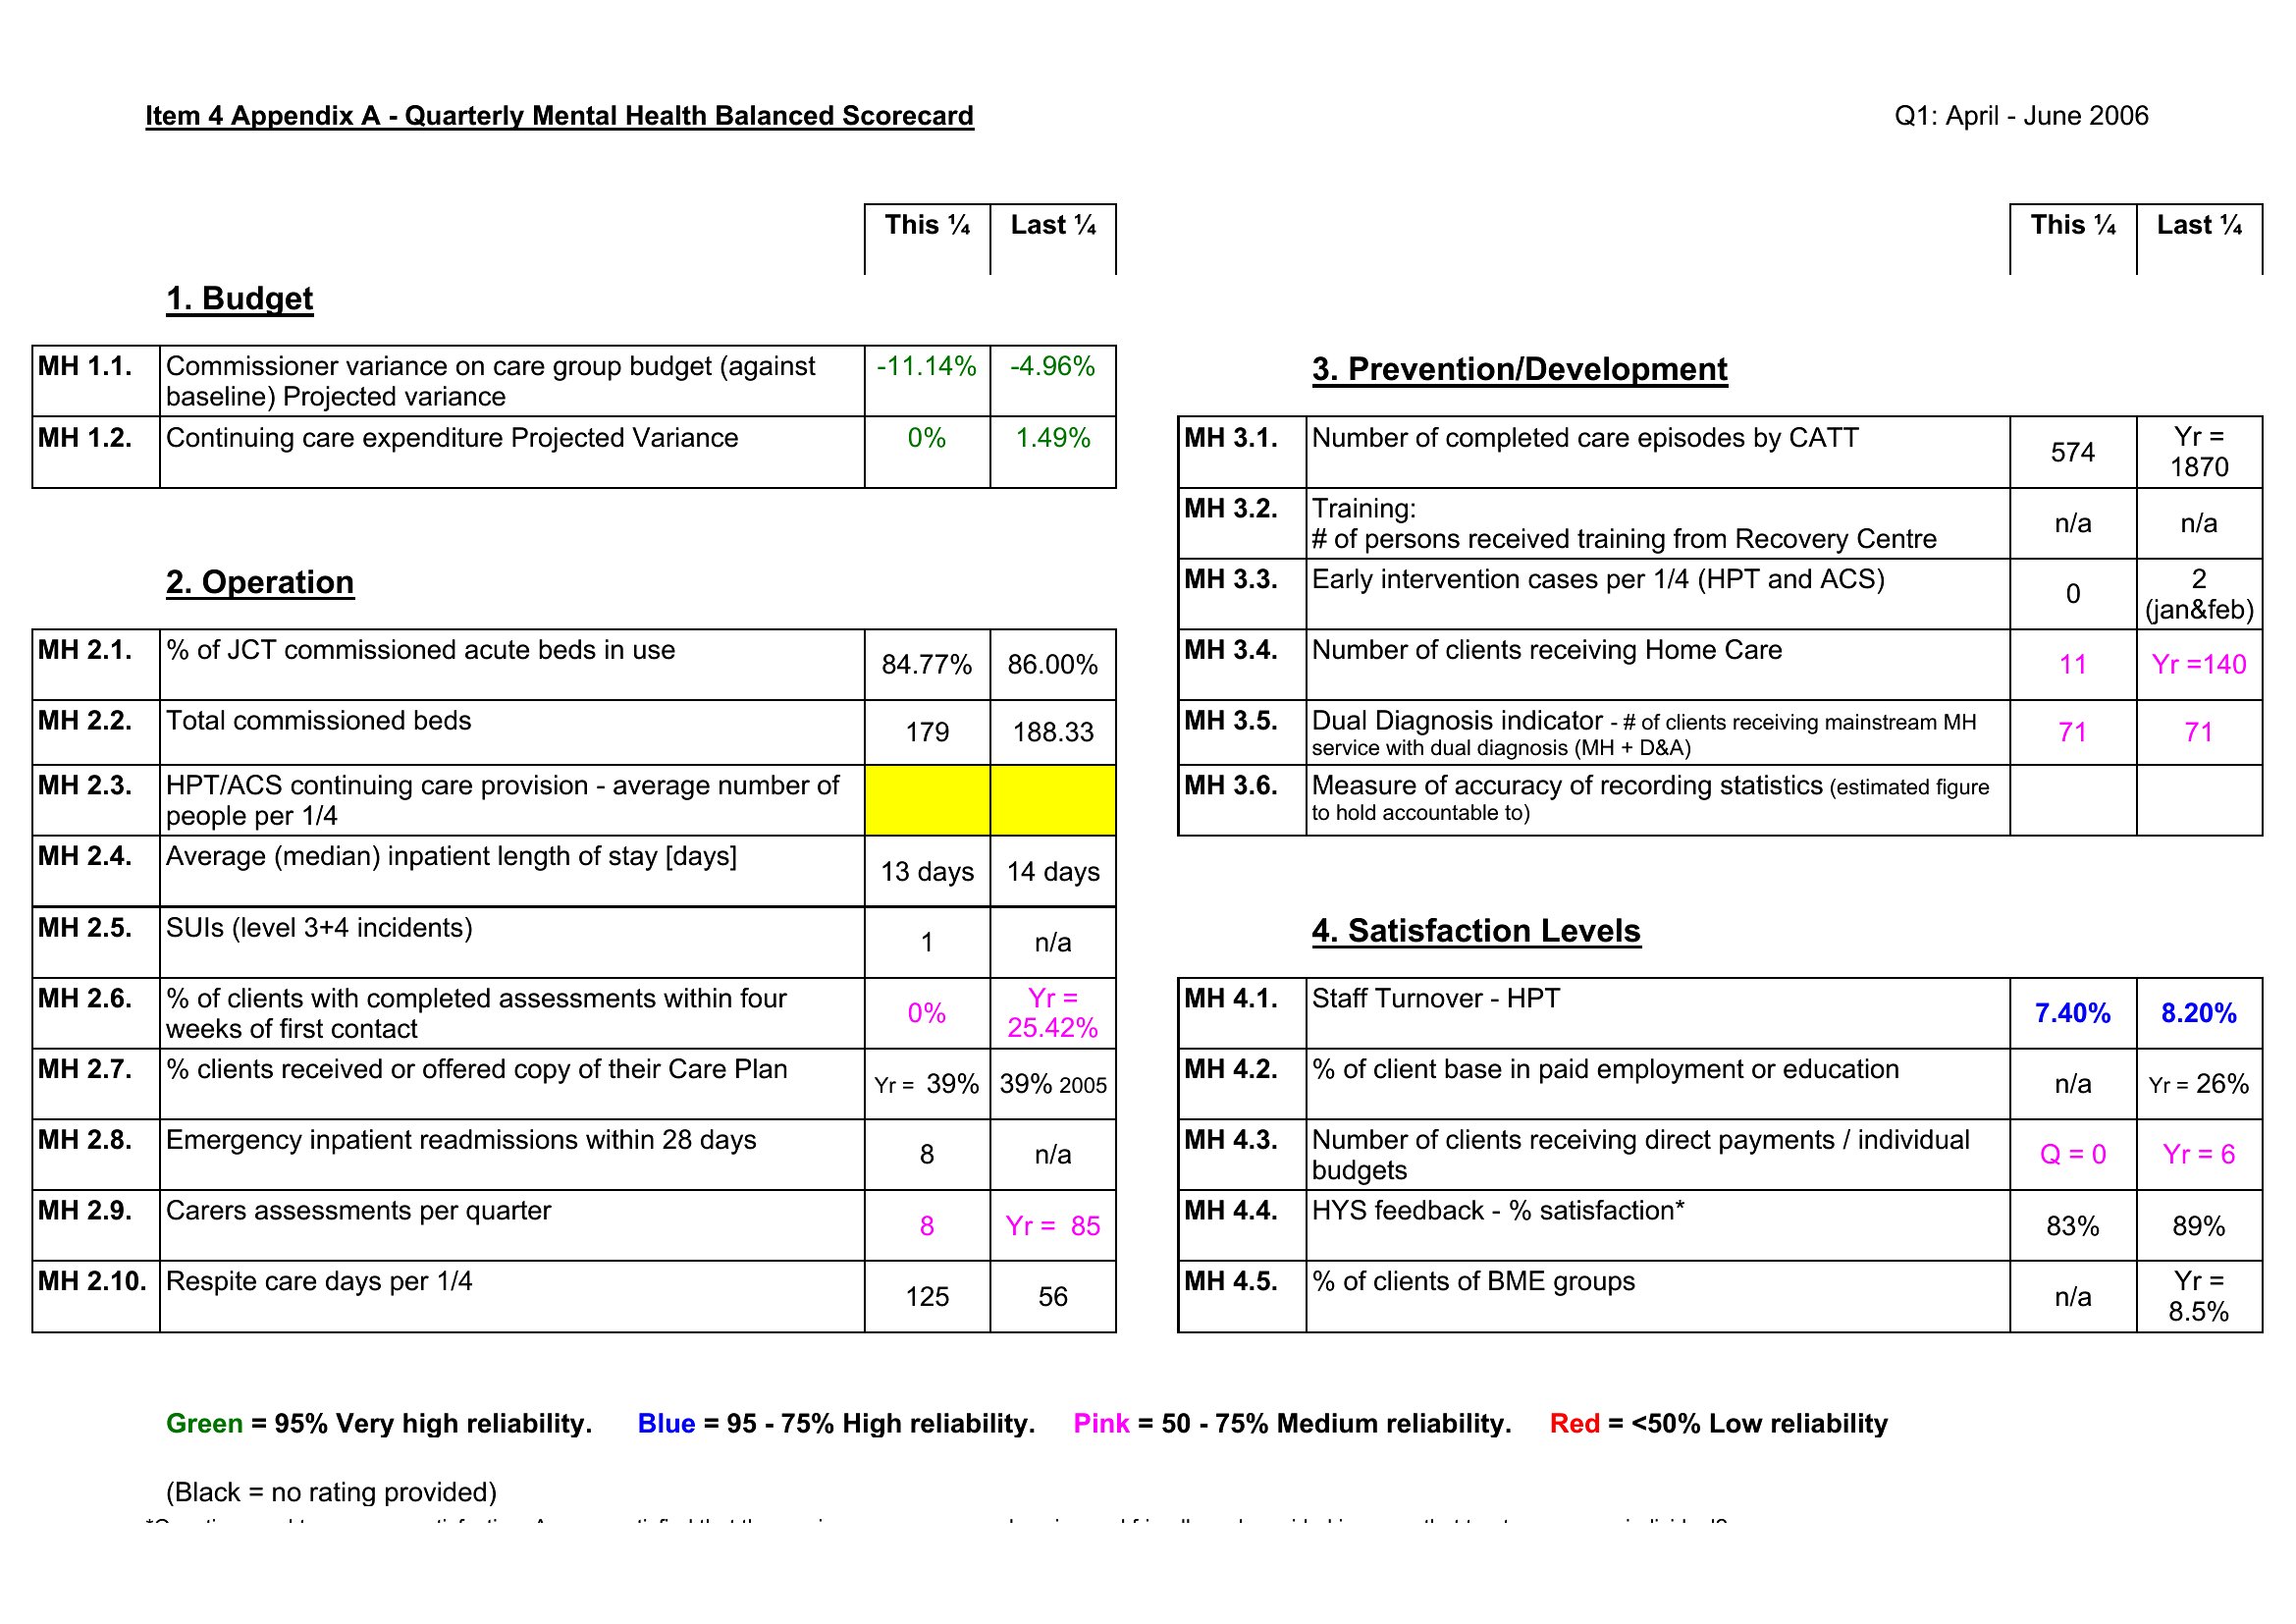
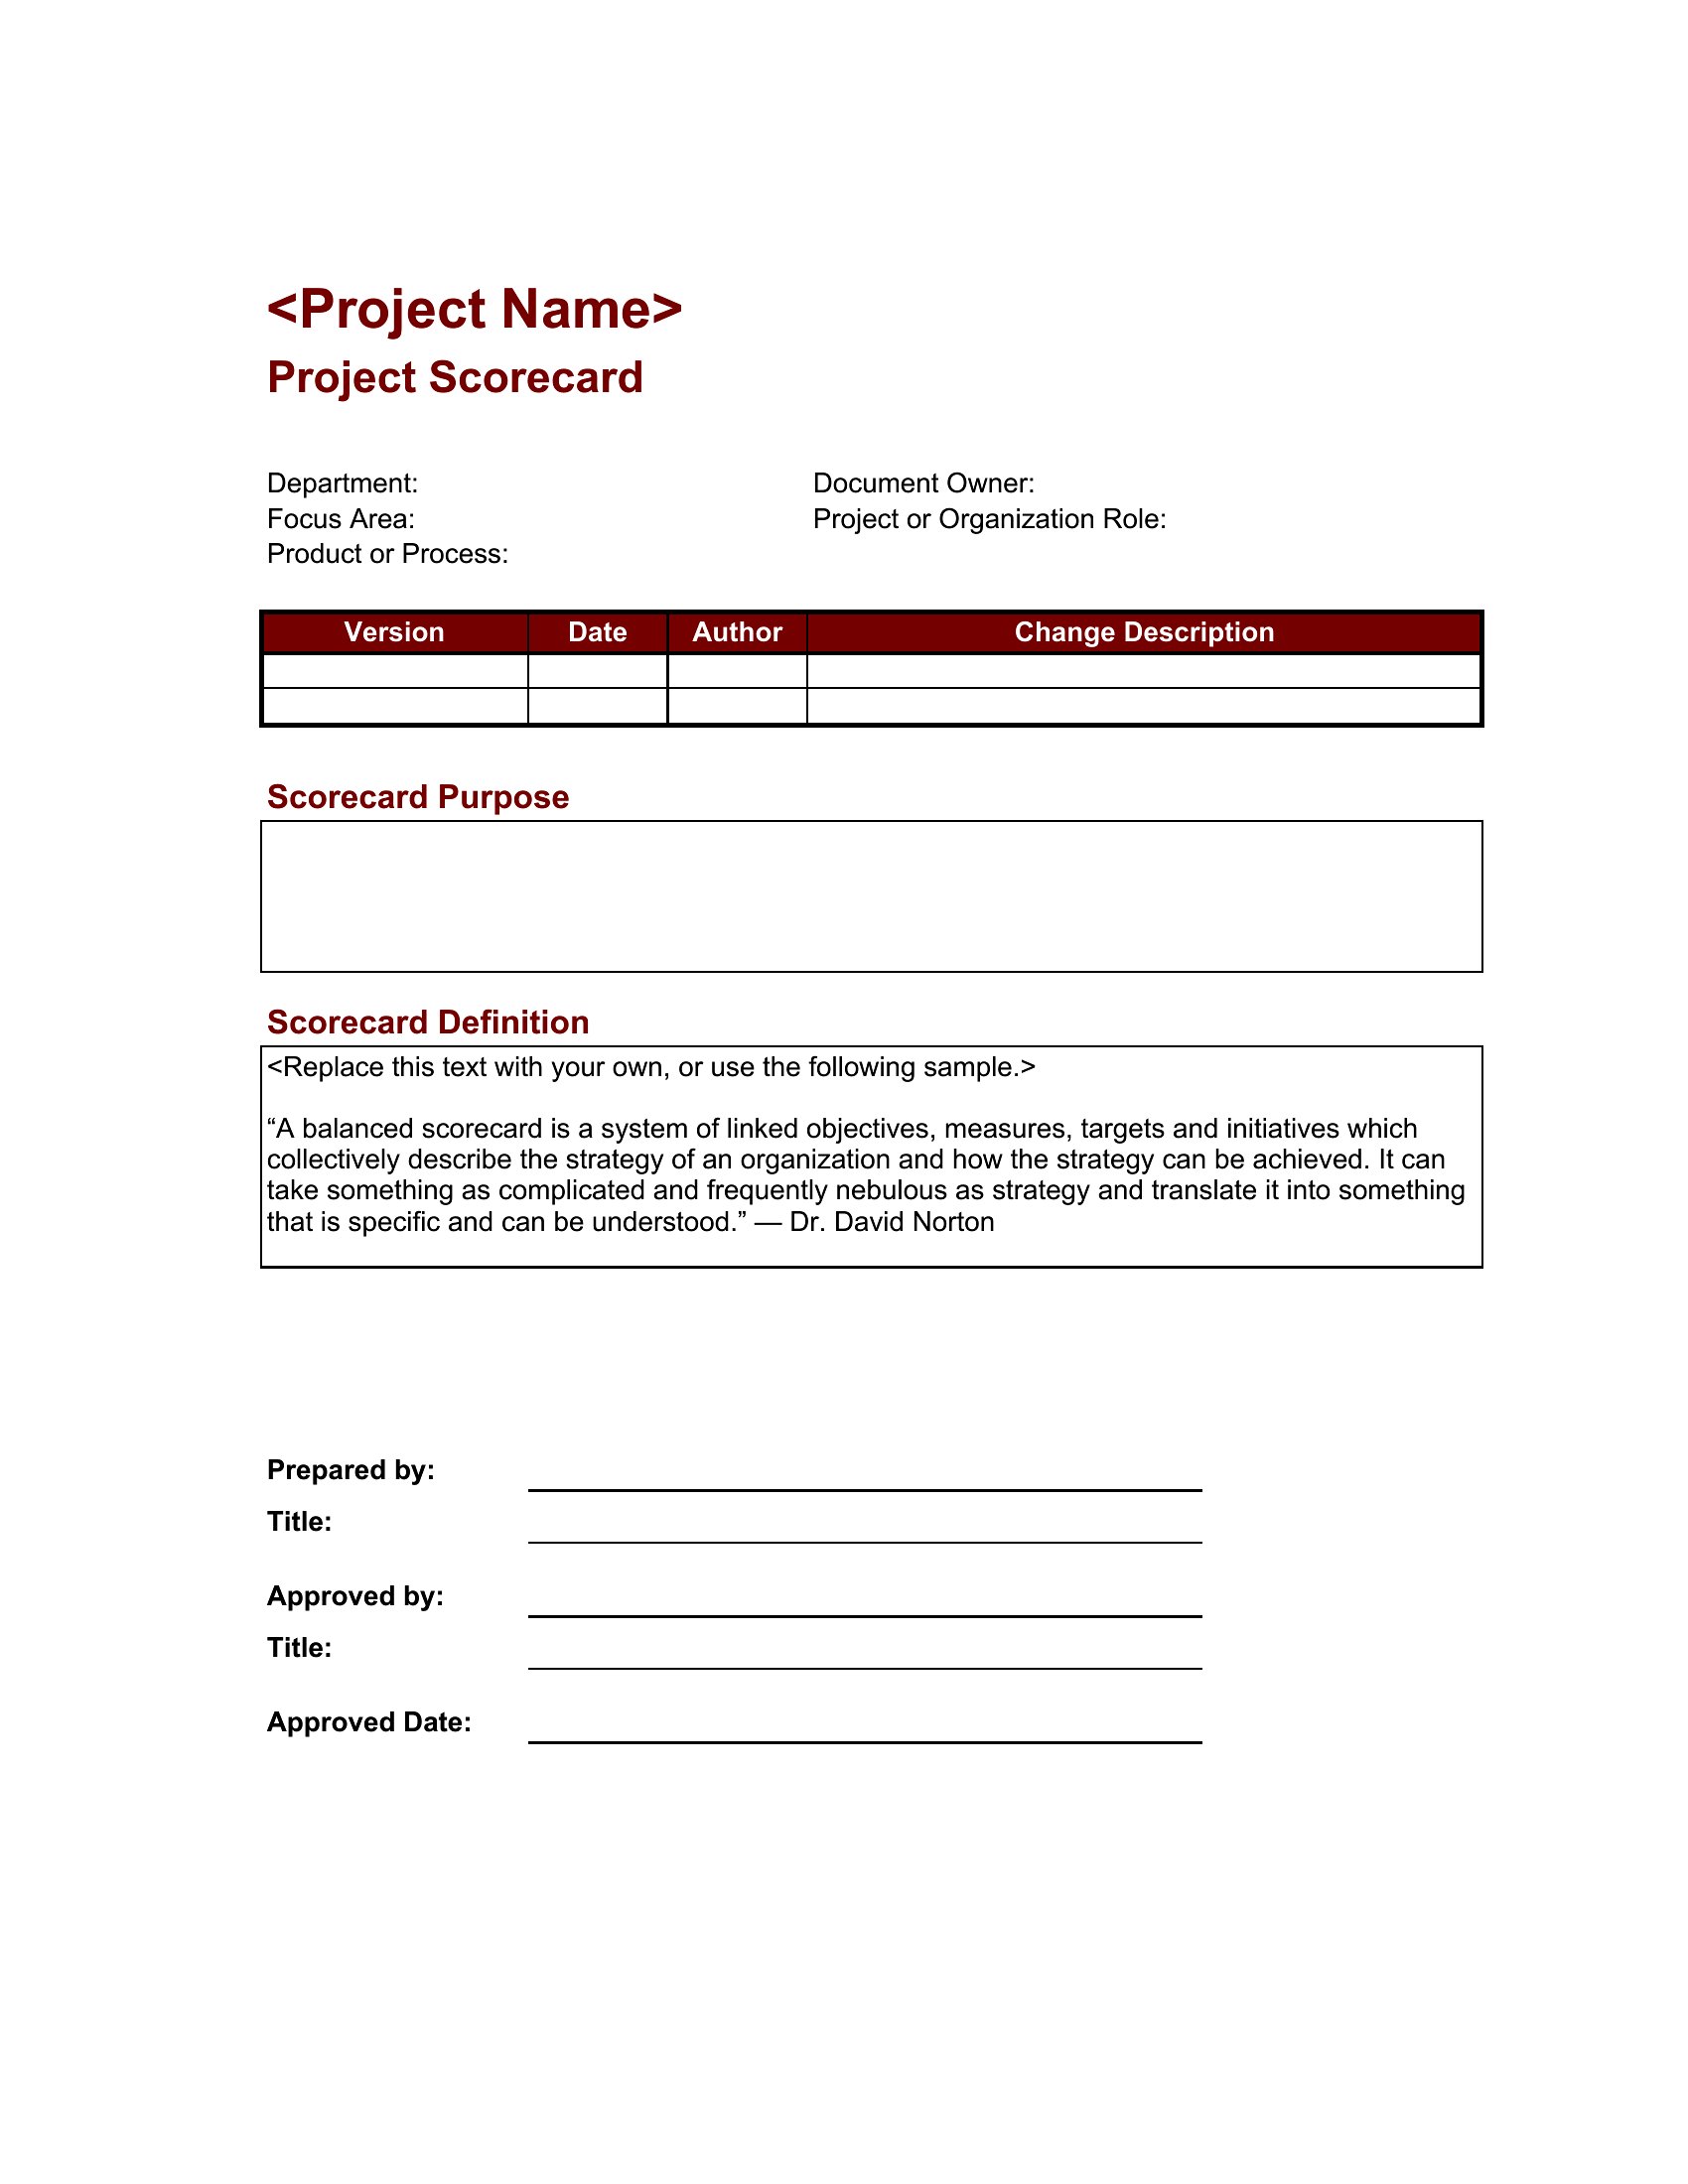
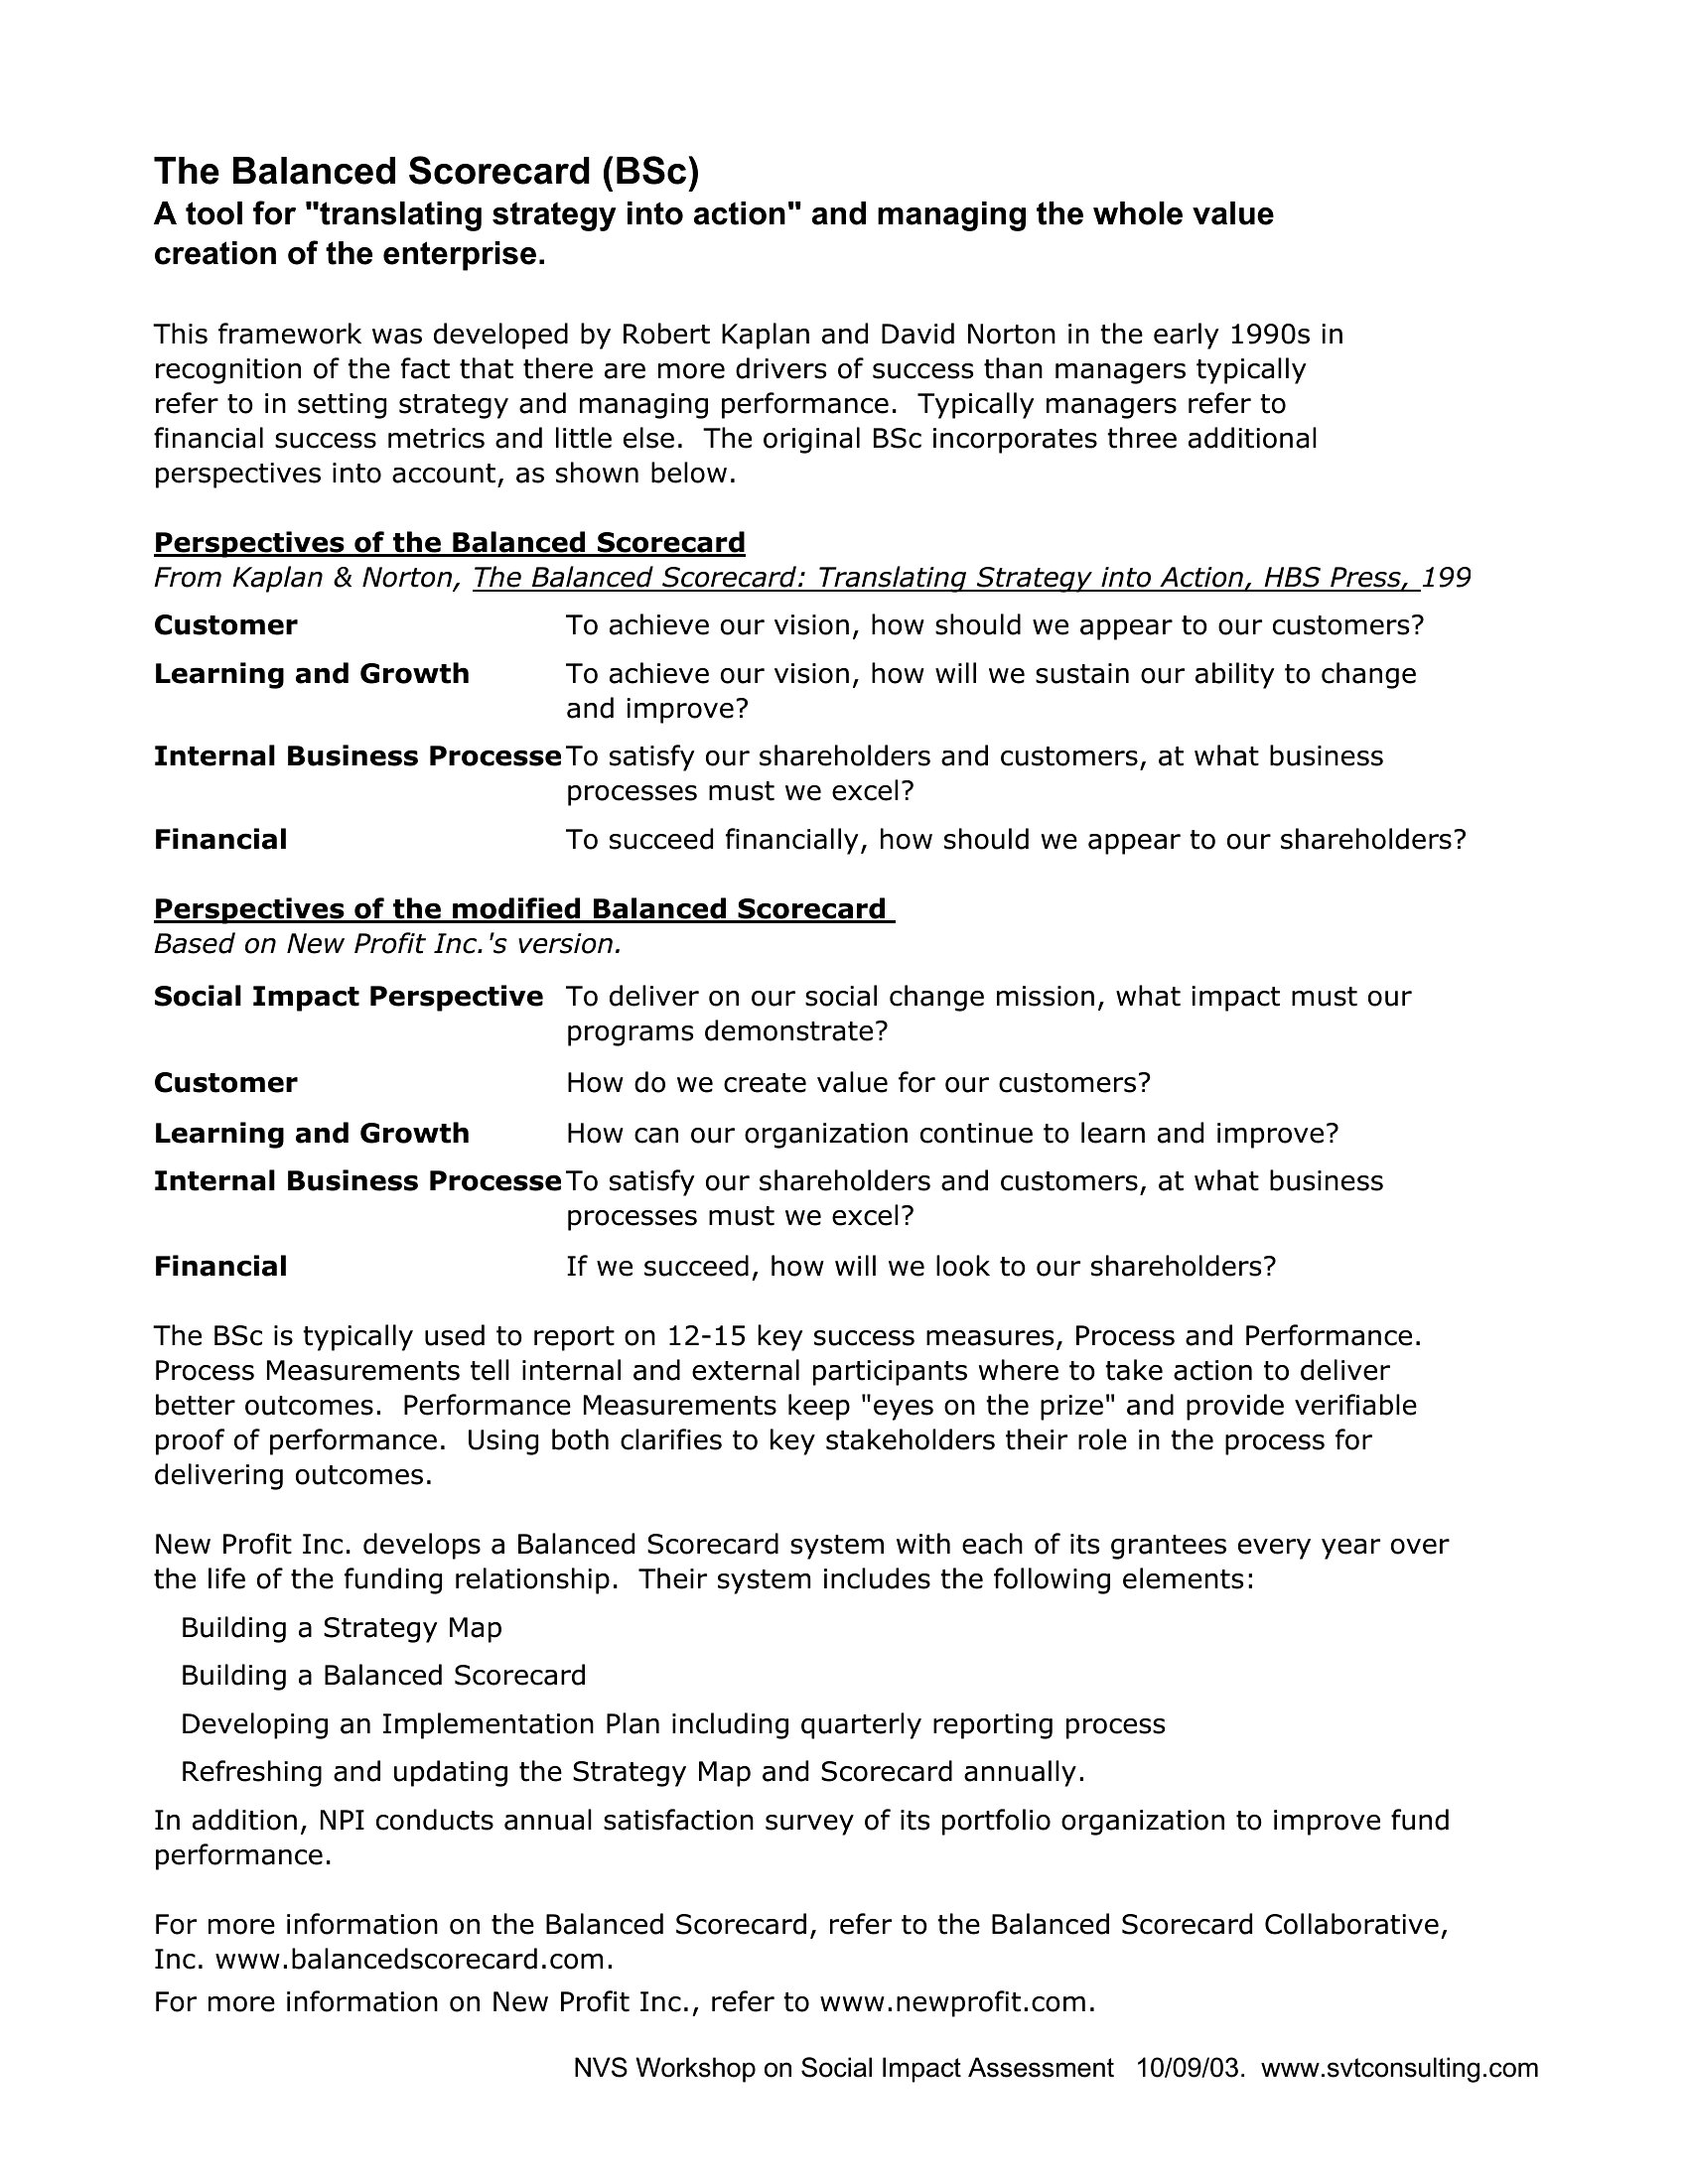
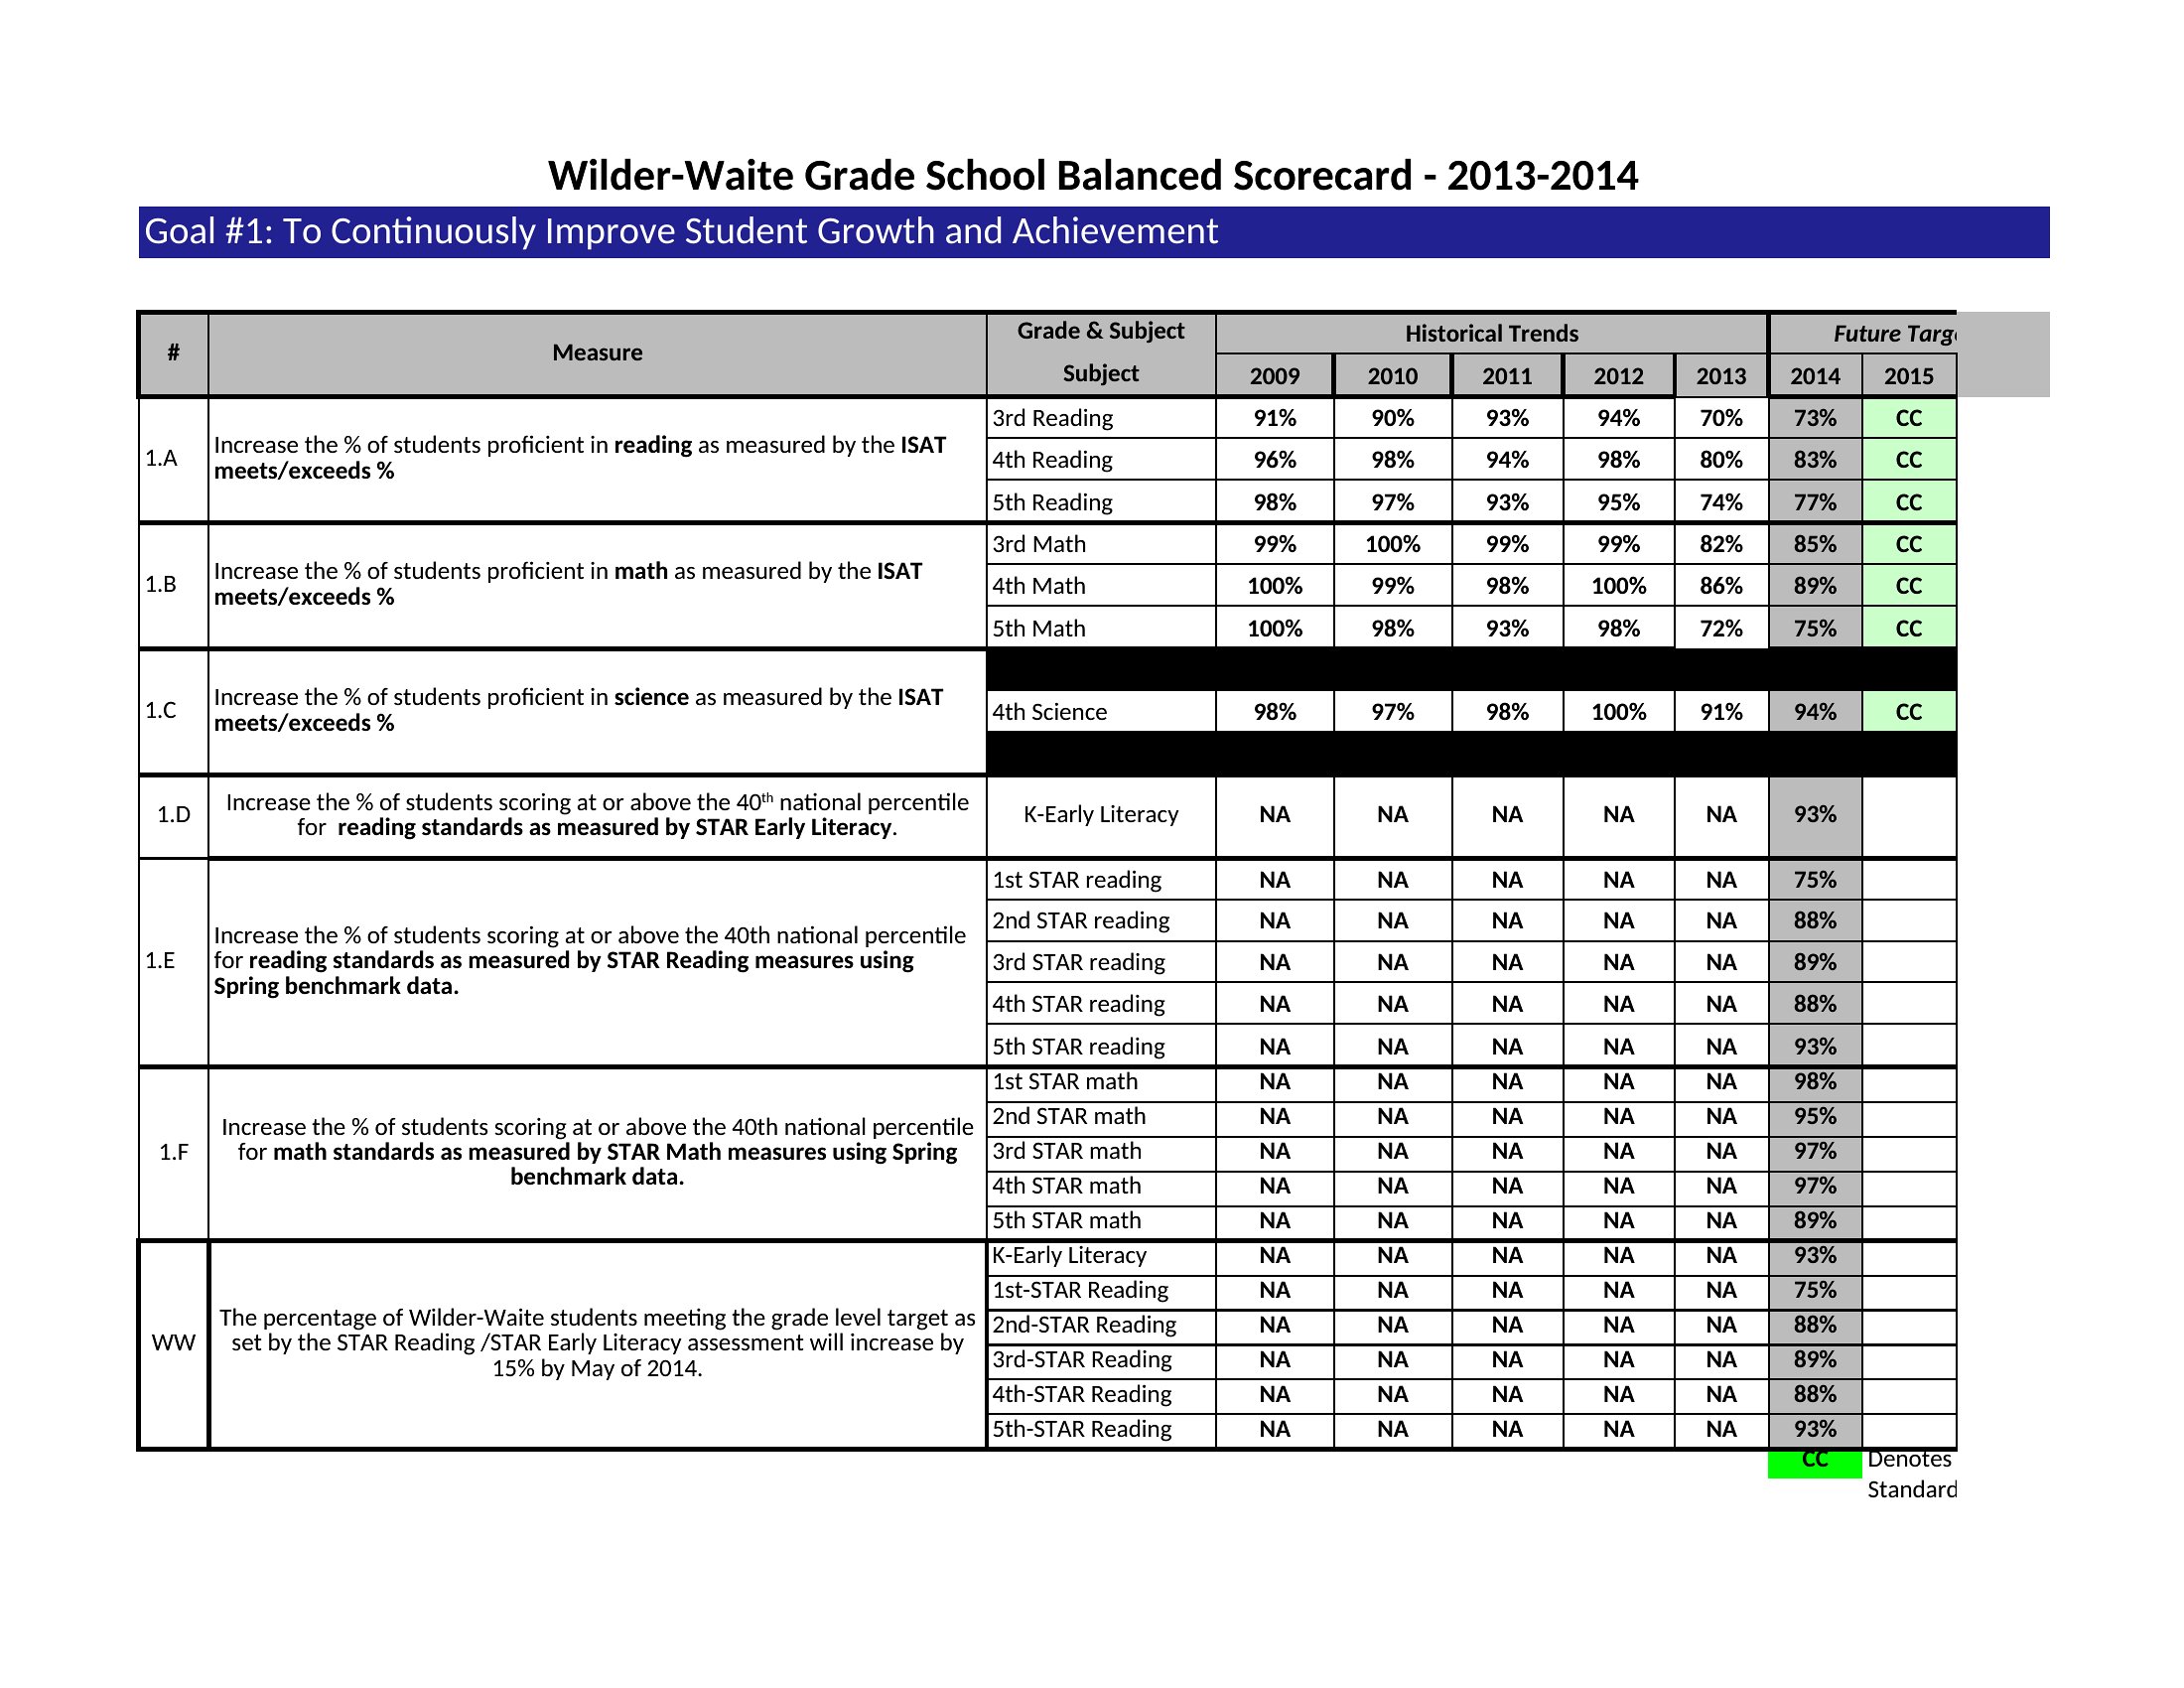
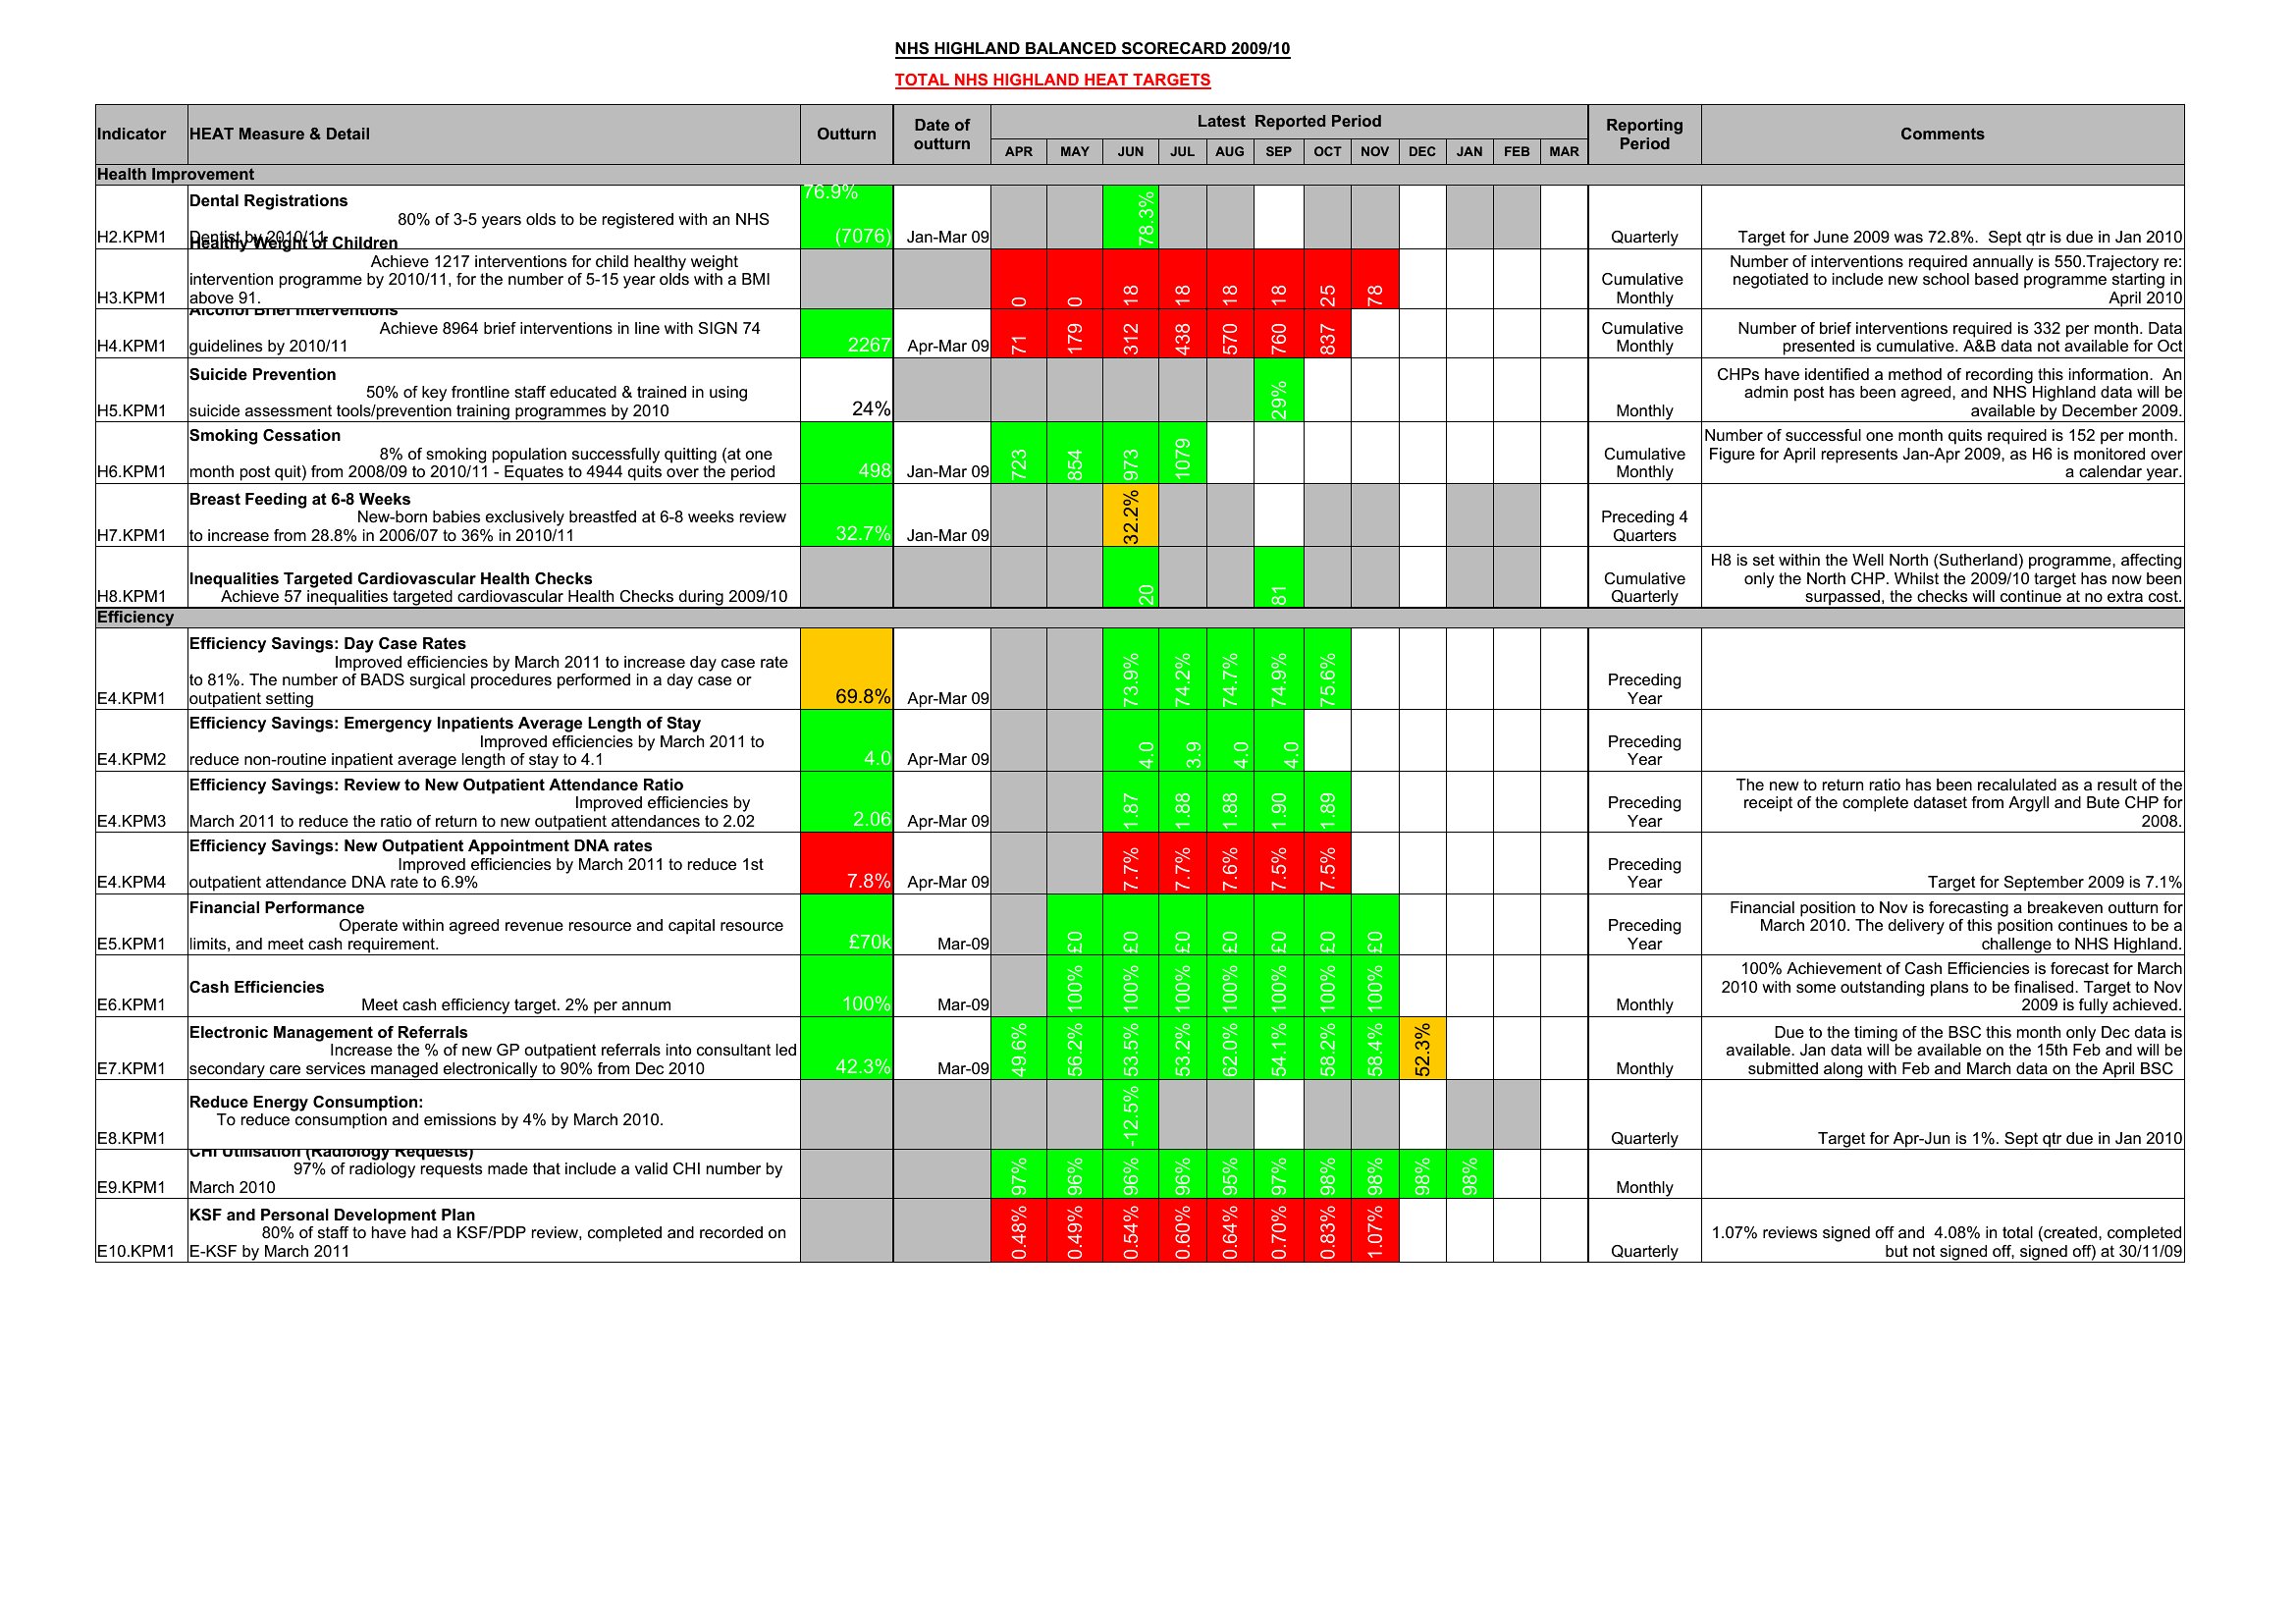
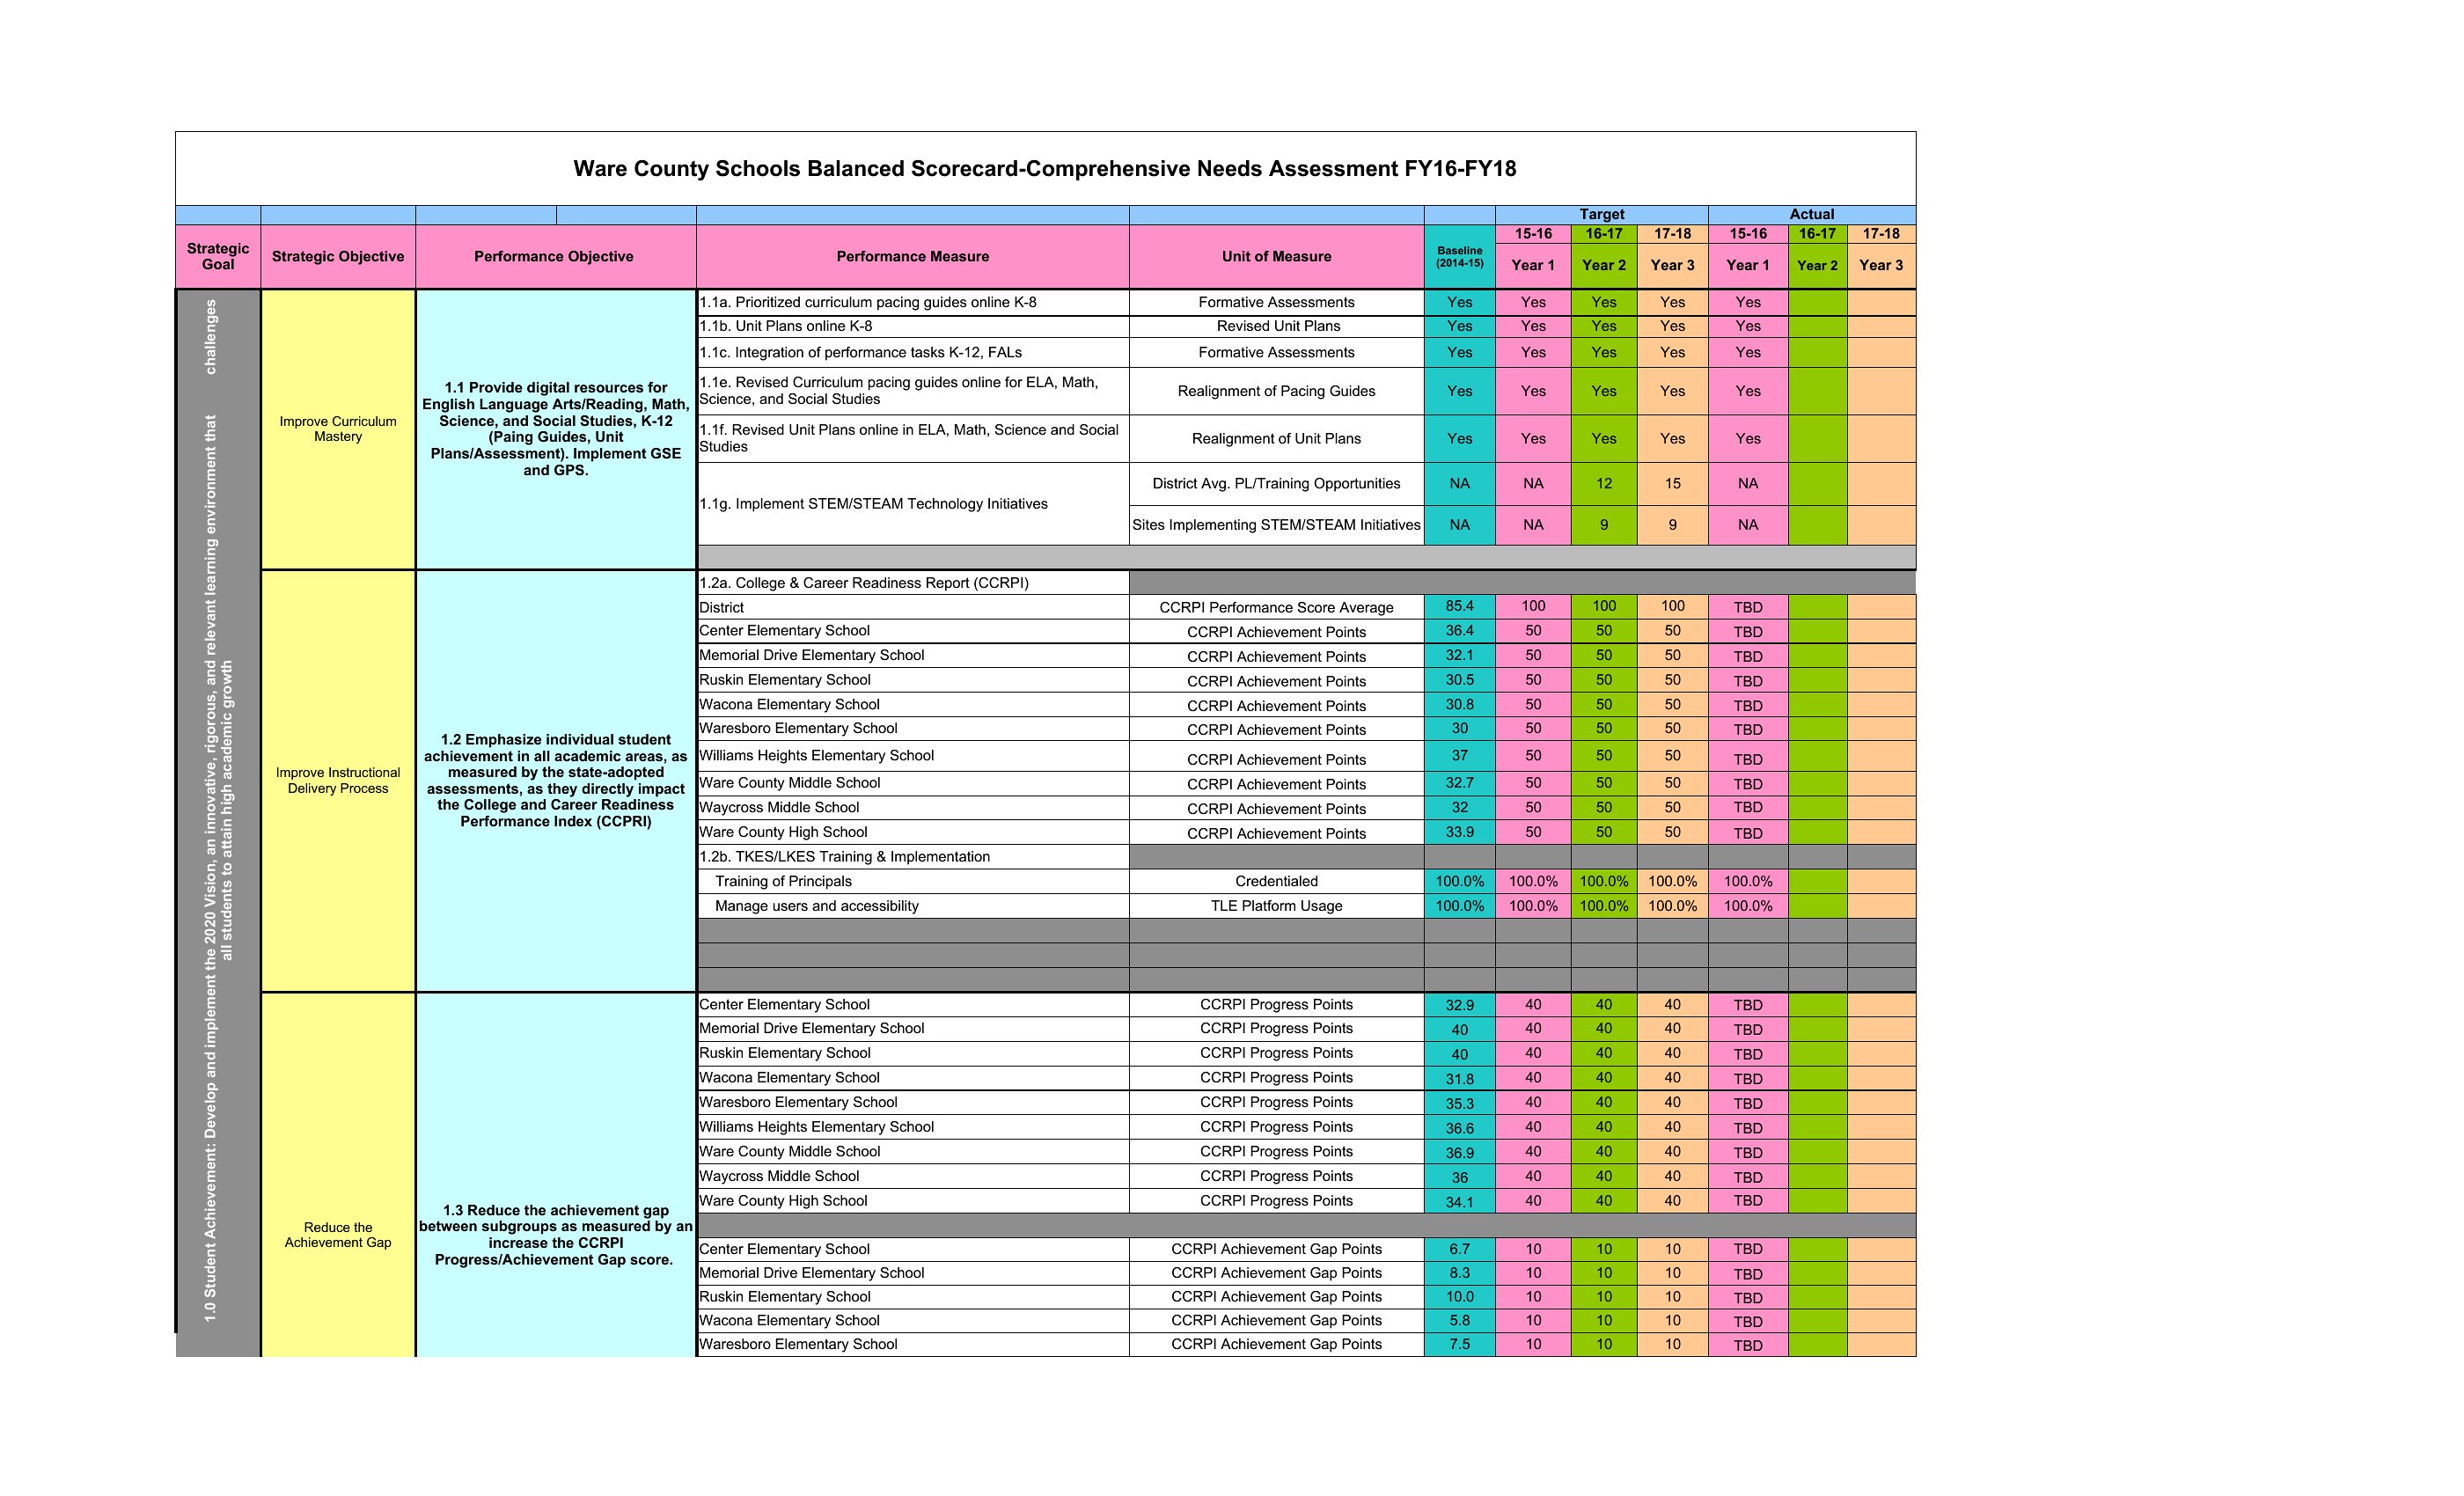
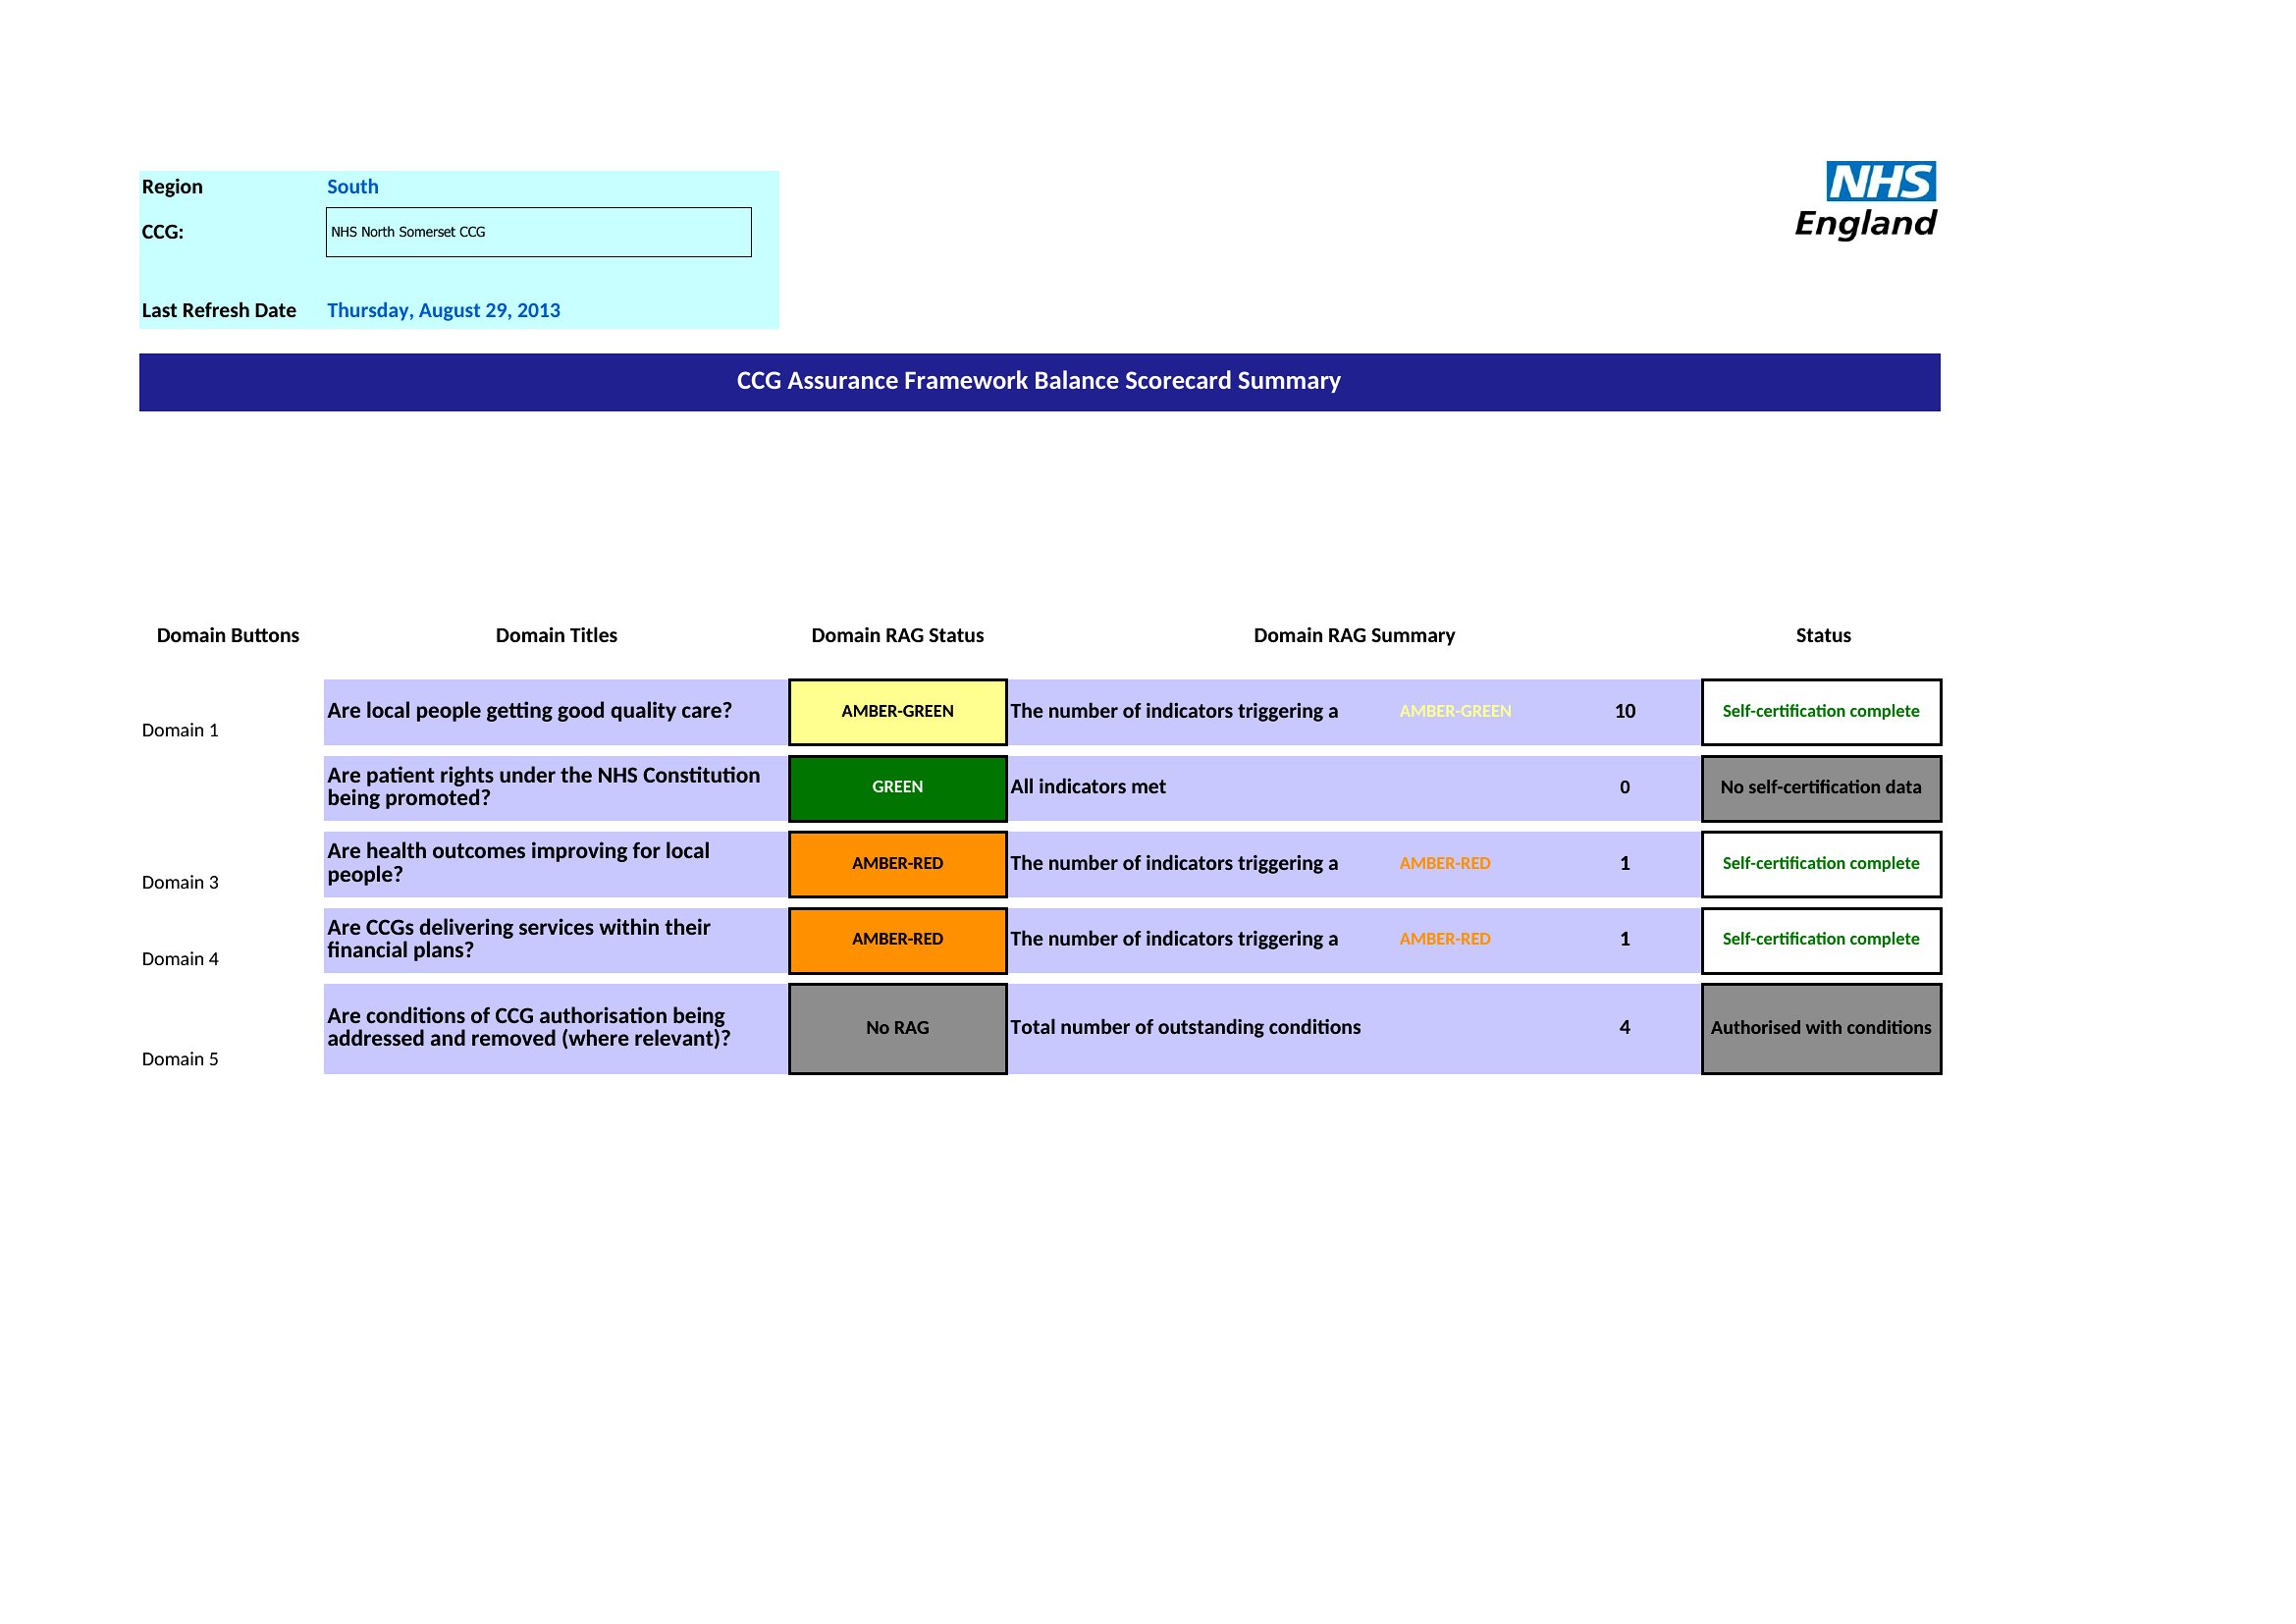
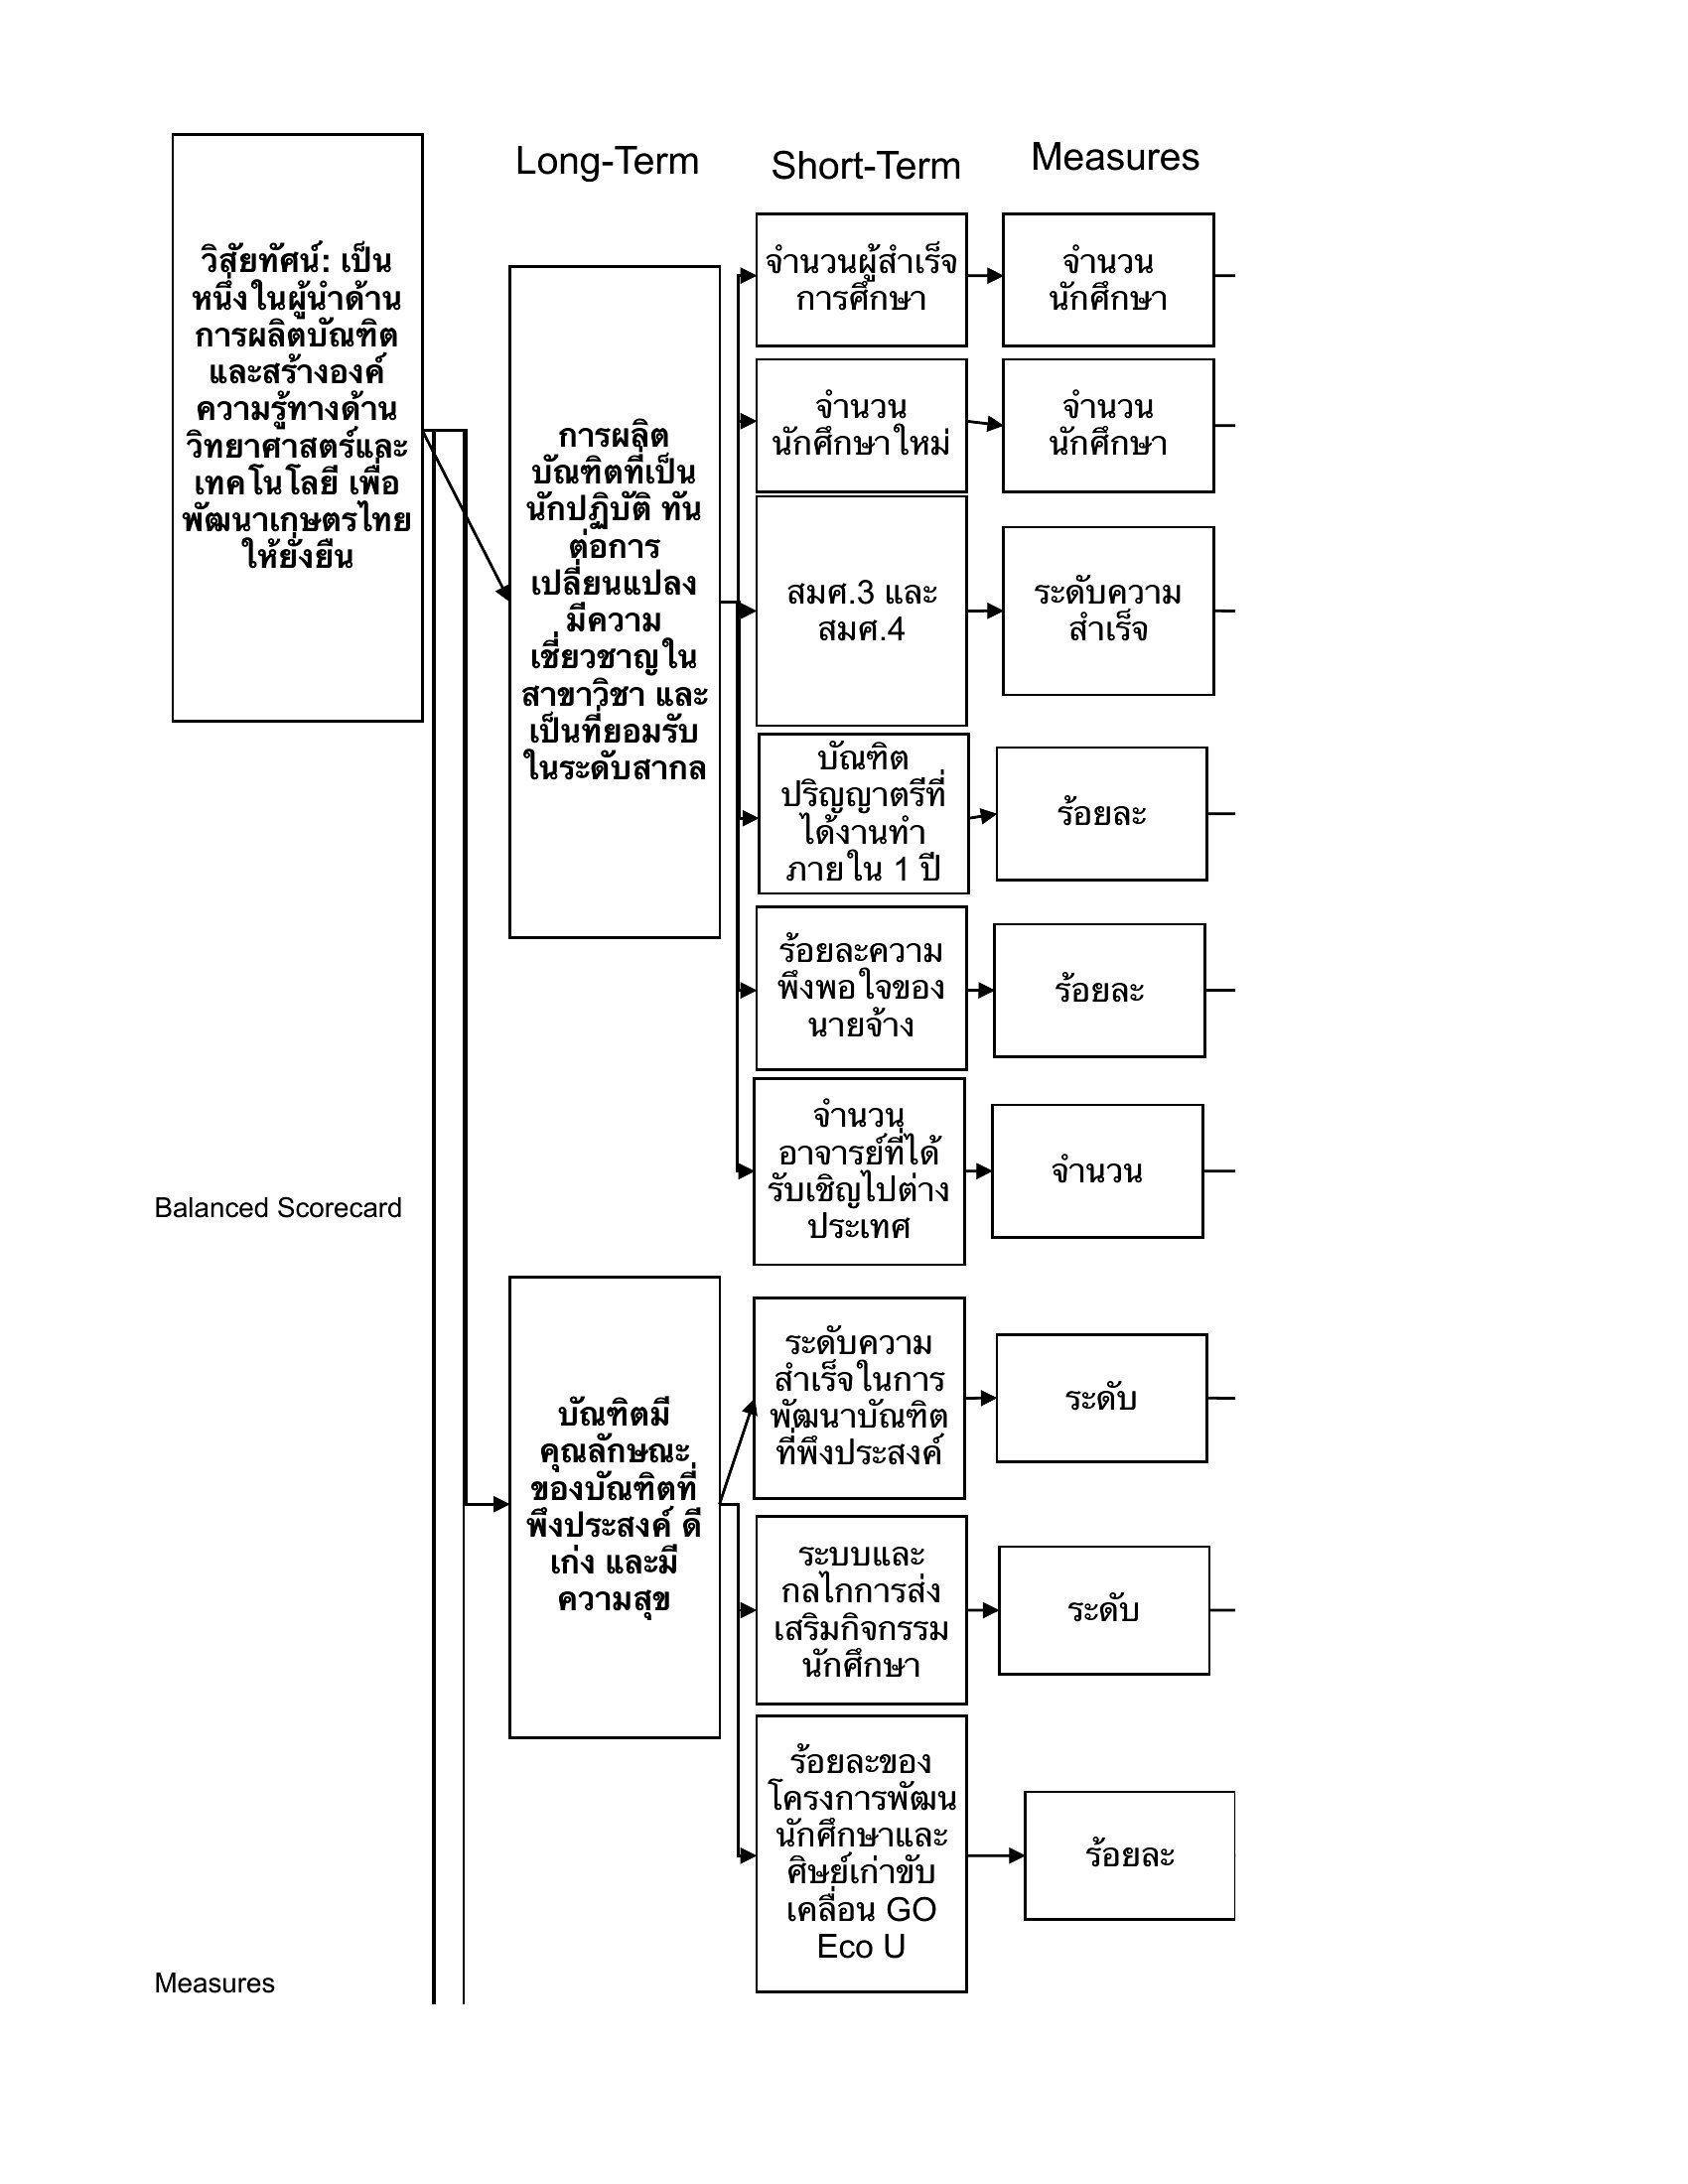
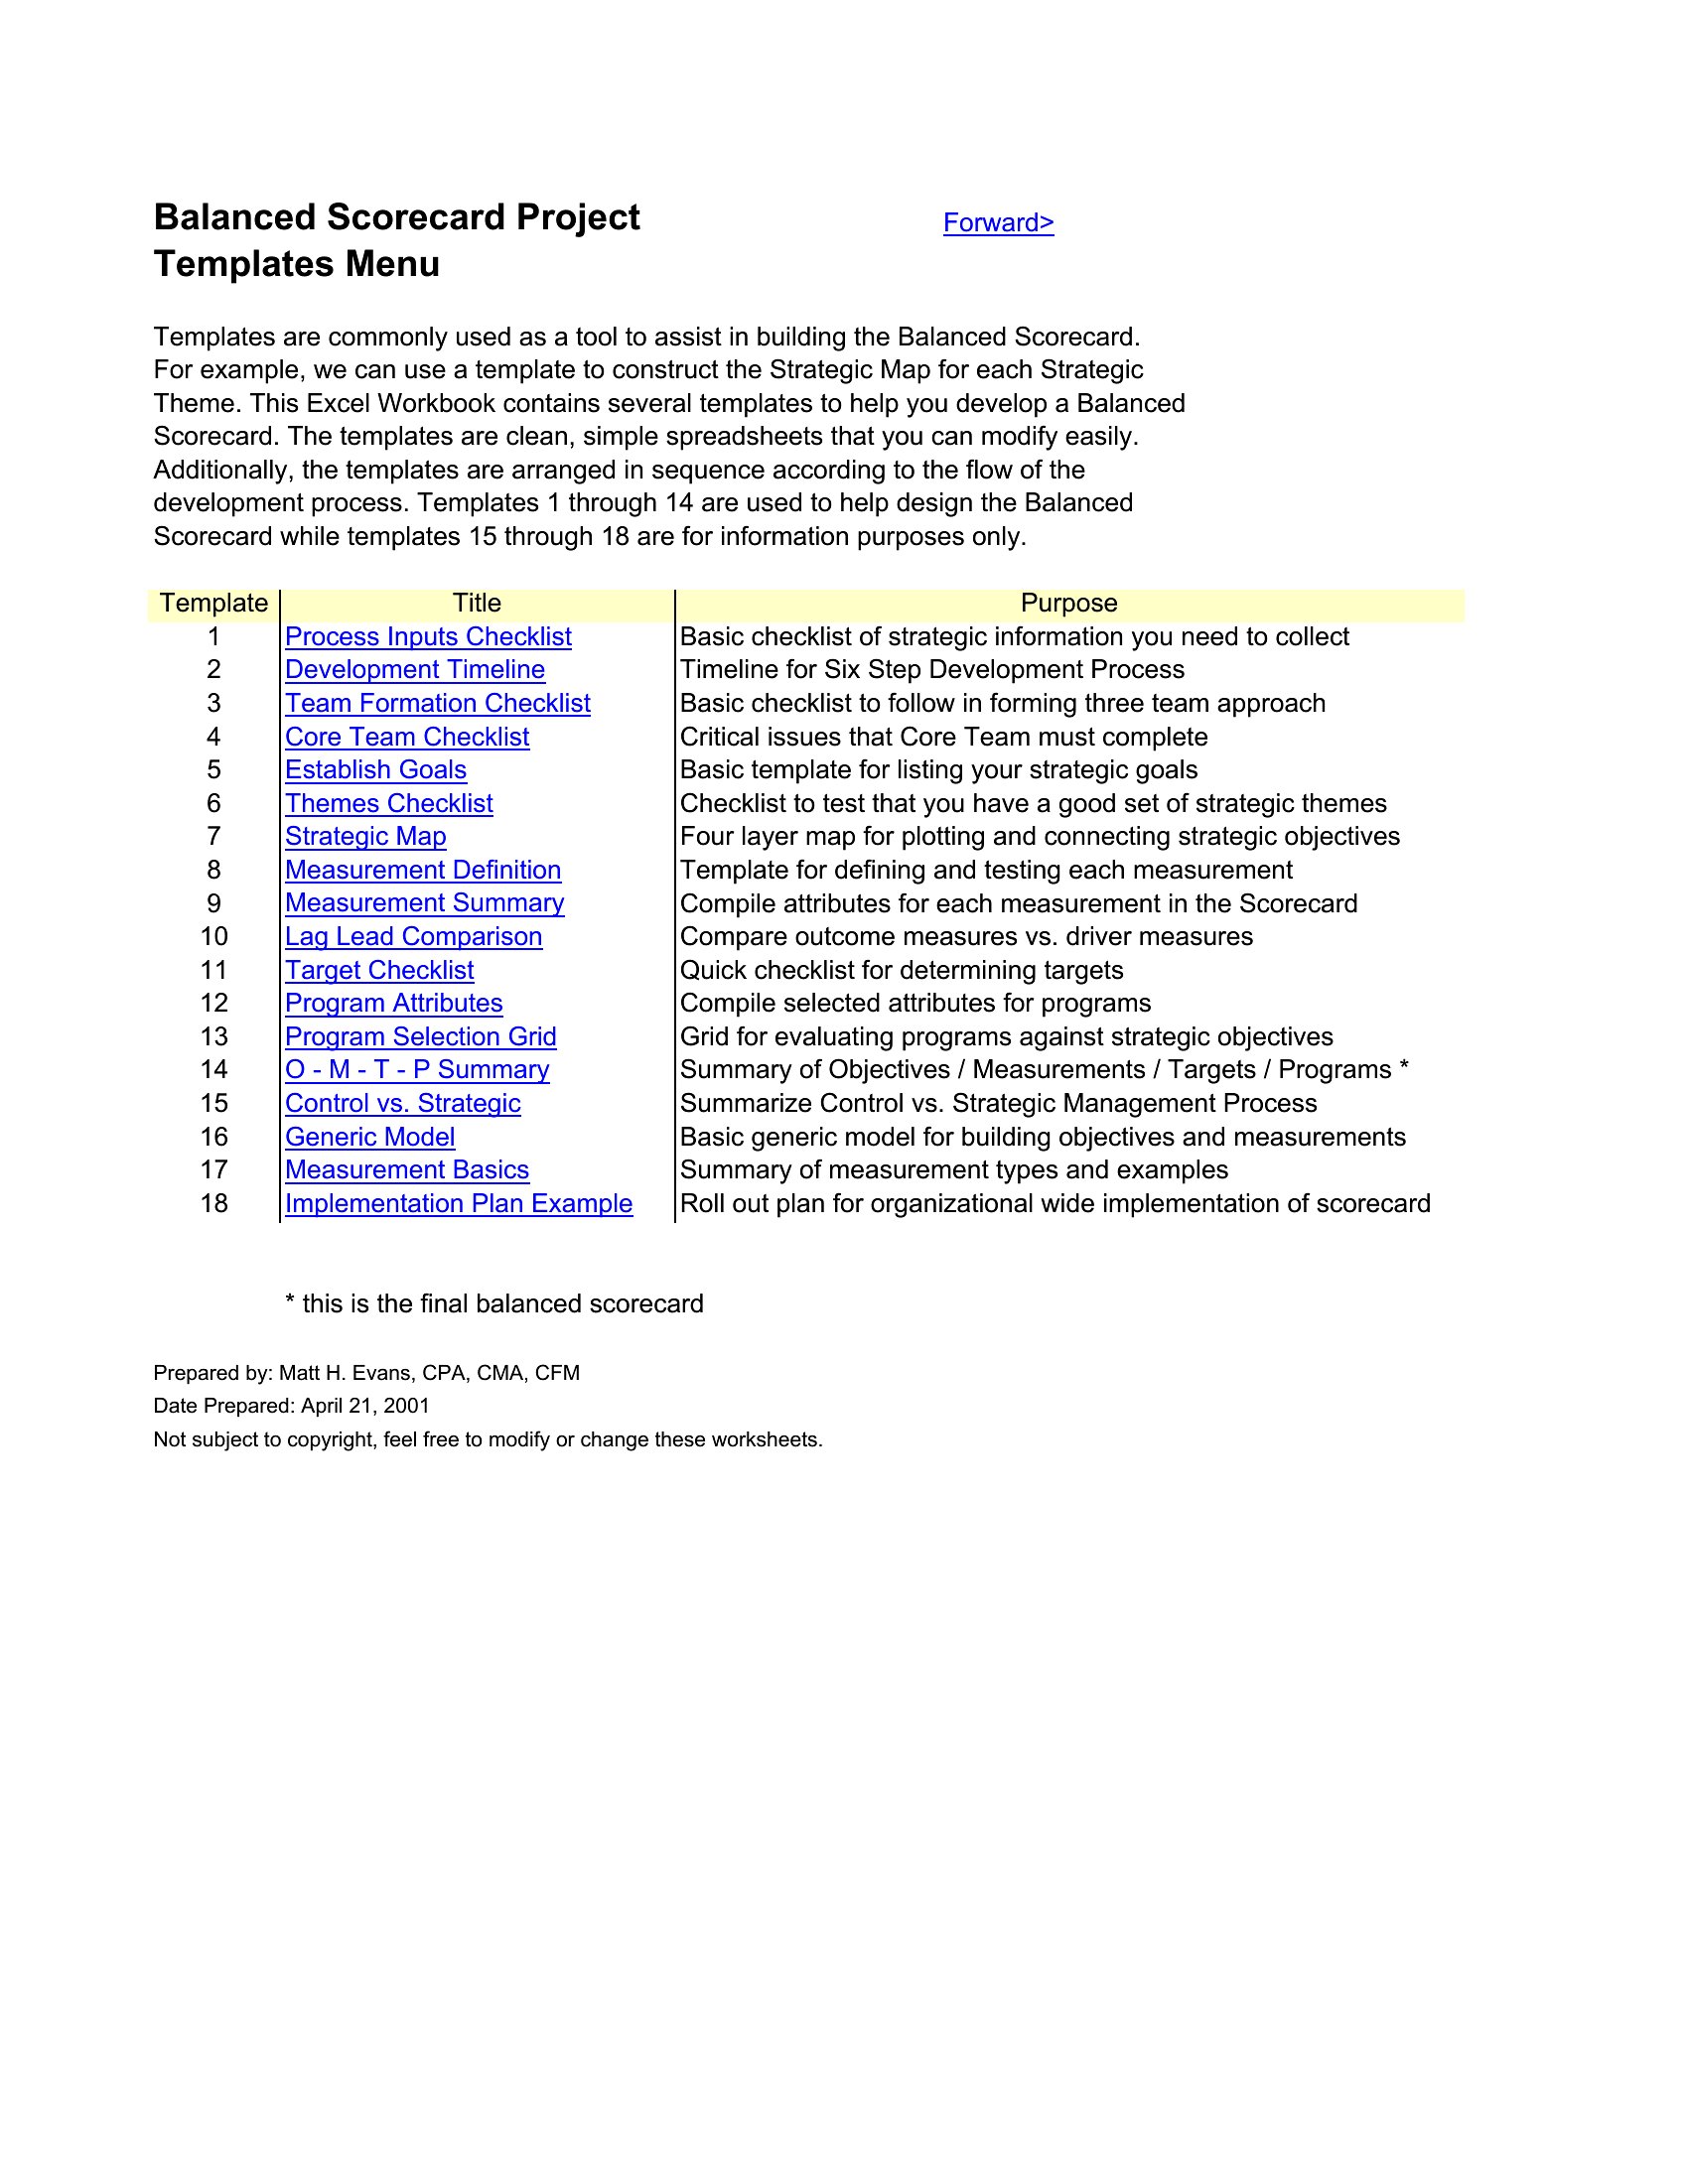
A balanced scorecard connects daily work to strategy by tracking performance across four views: financial, customer, internal process, and learning and growth. This set of 30 templates helps managers, executives, and HR teams turn big-picture goals into measurable objectives and targets. Lay out your metrics in one place and you can see at a glance whether the strategy is actually working.

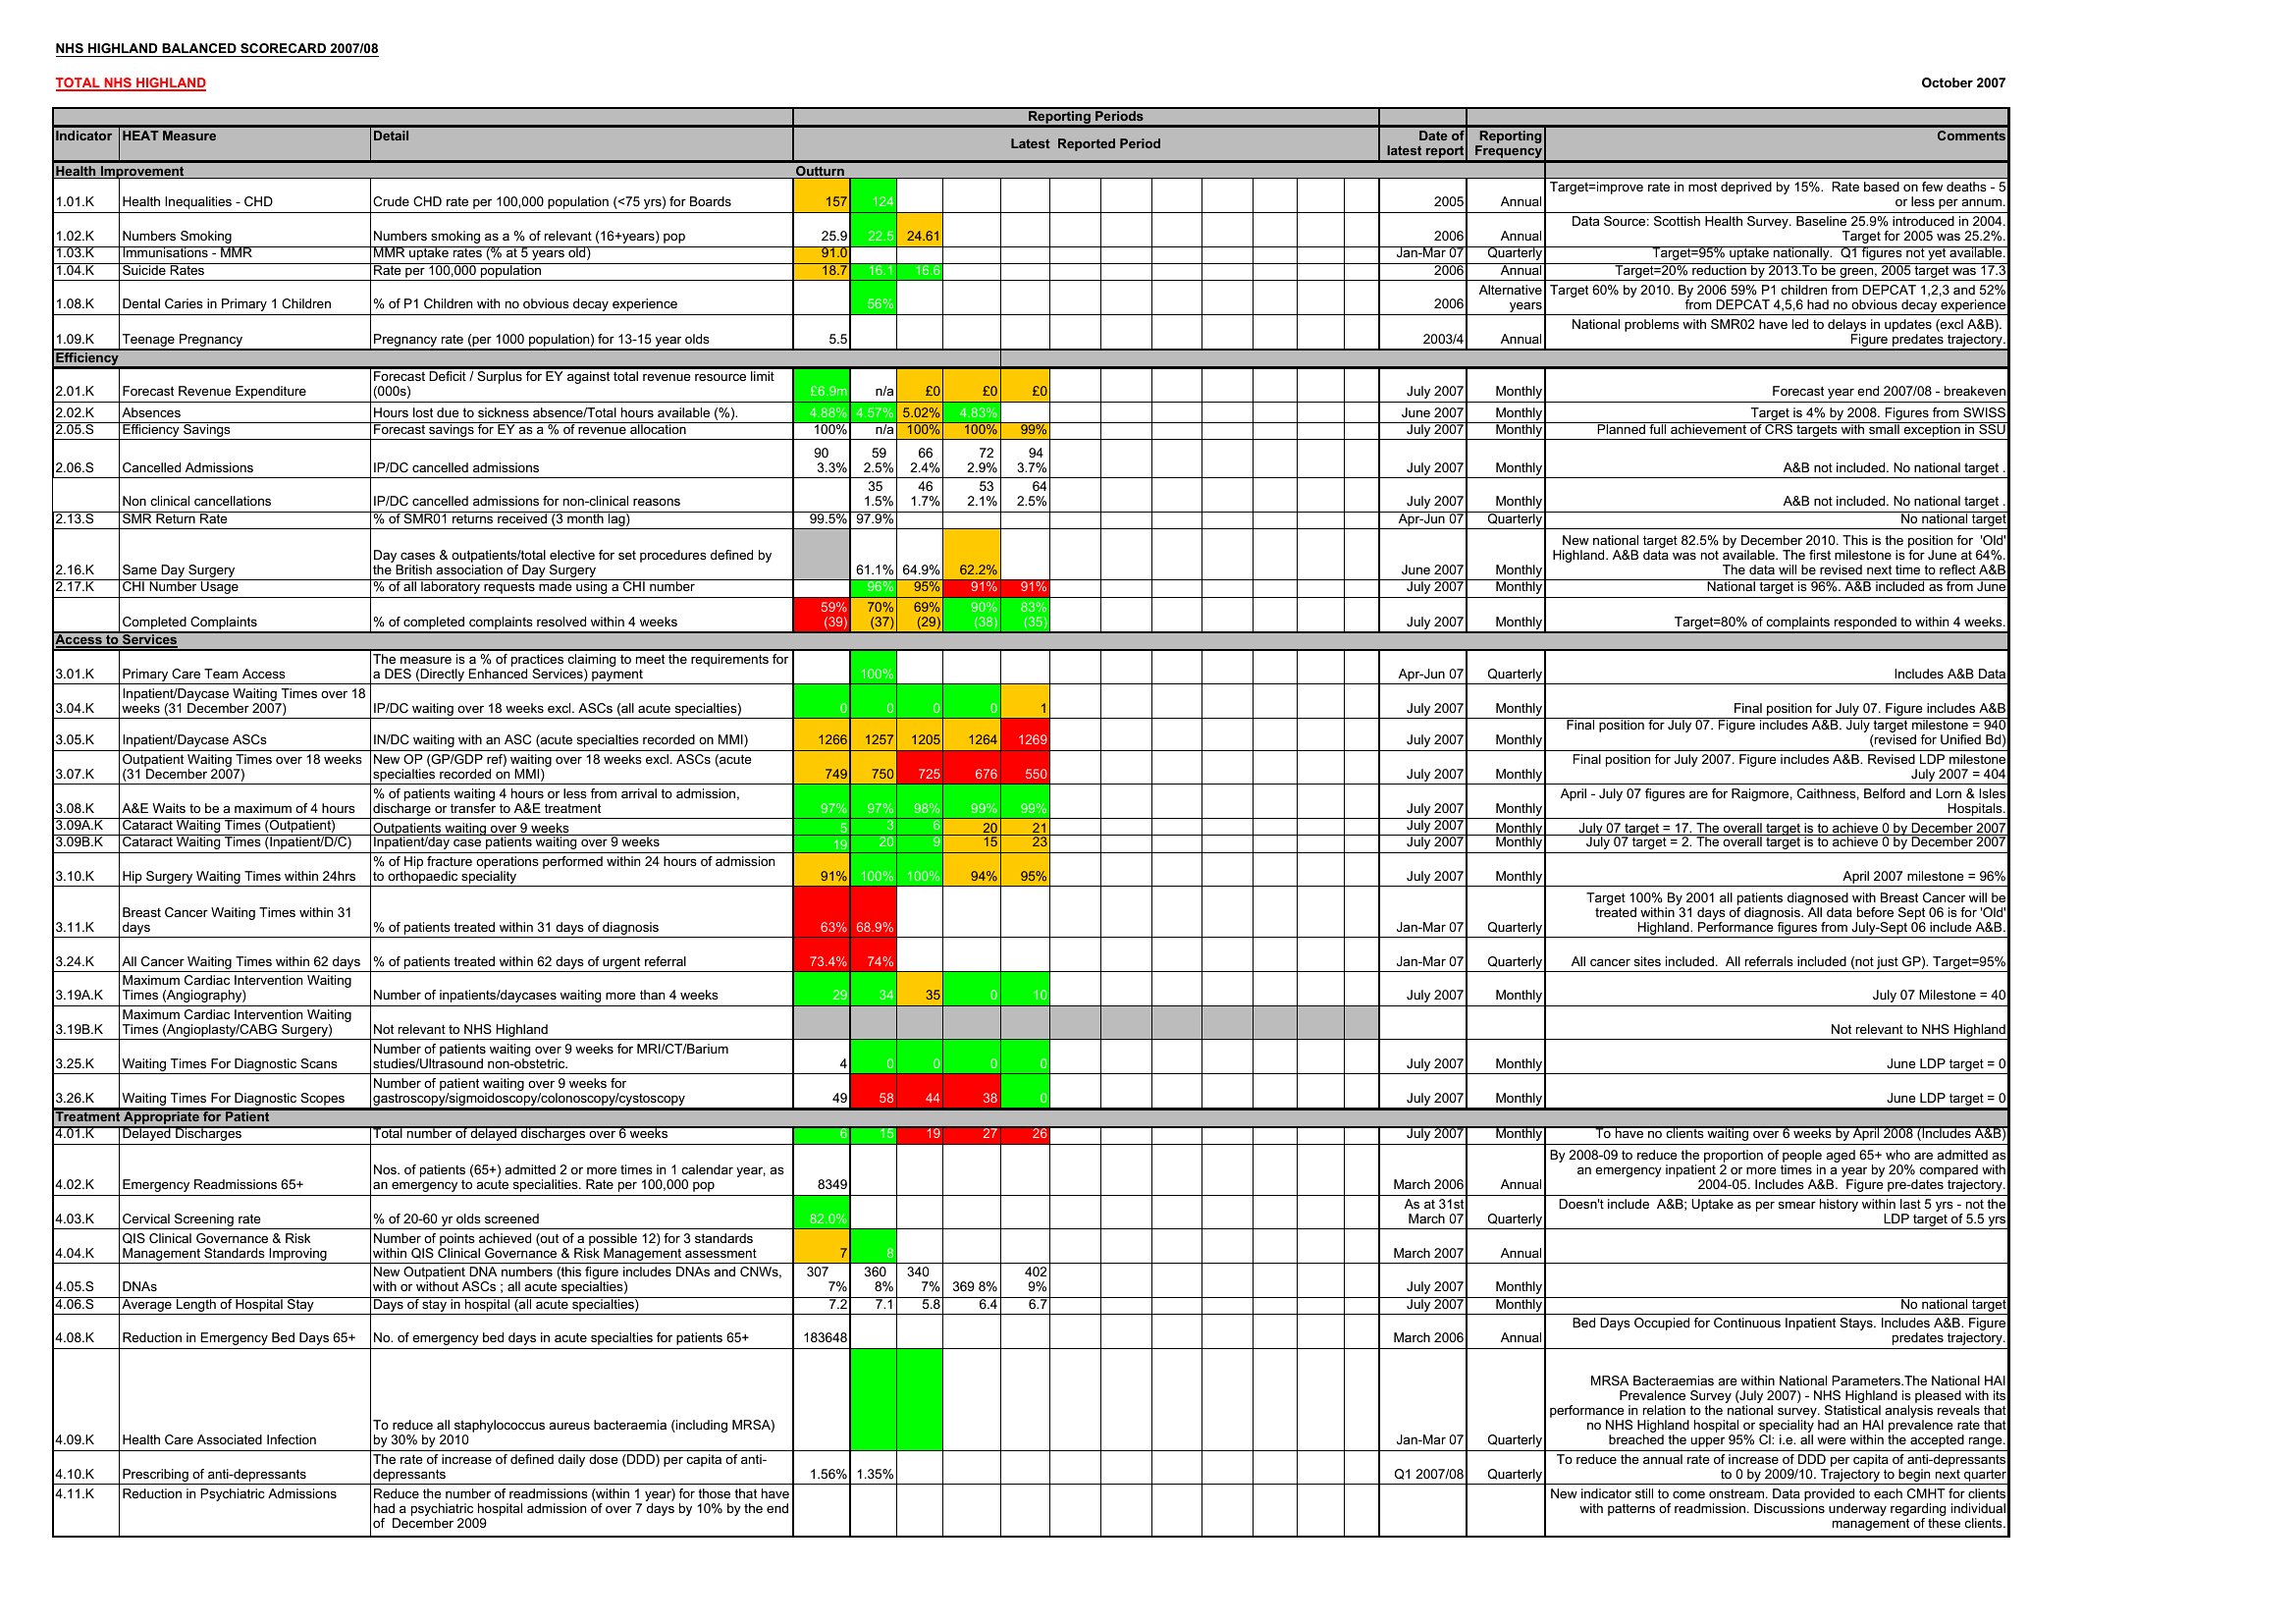
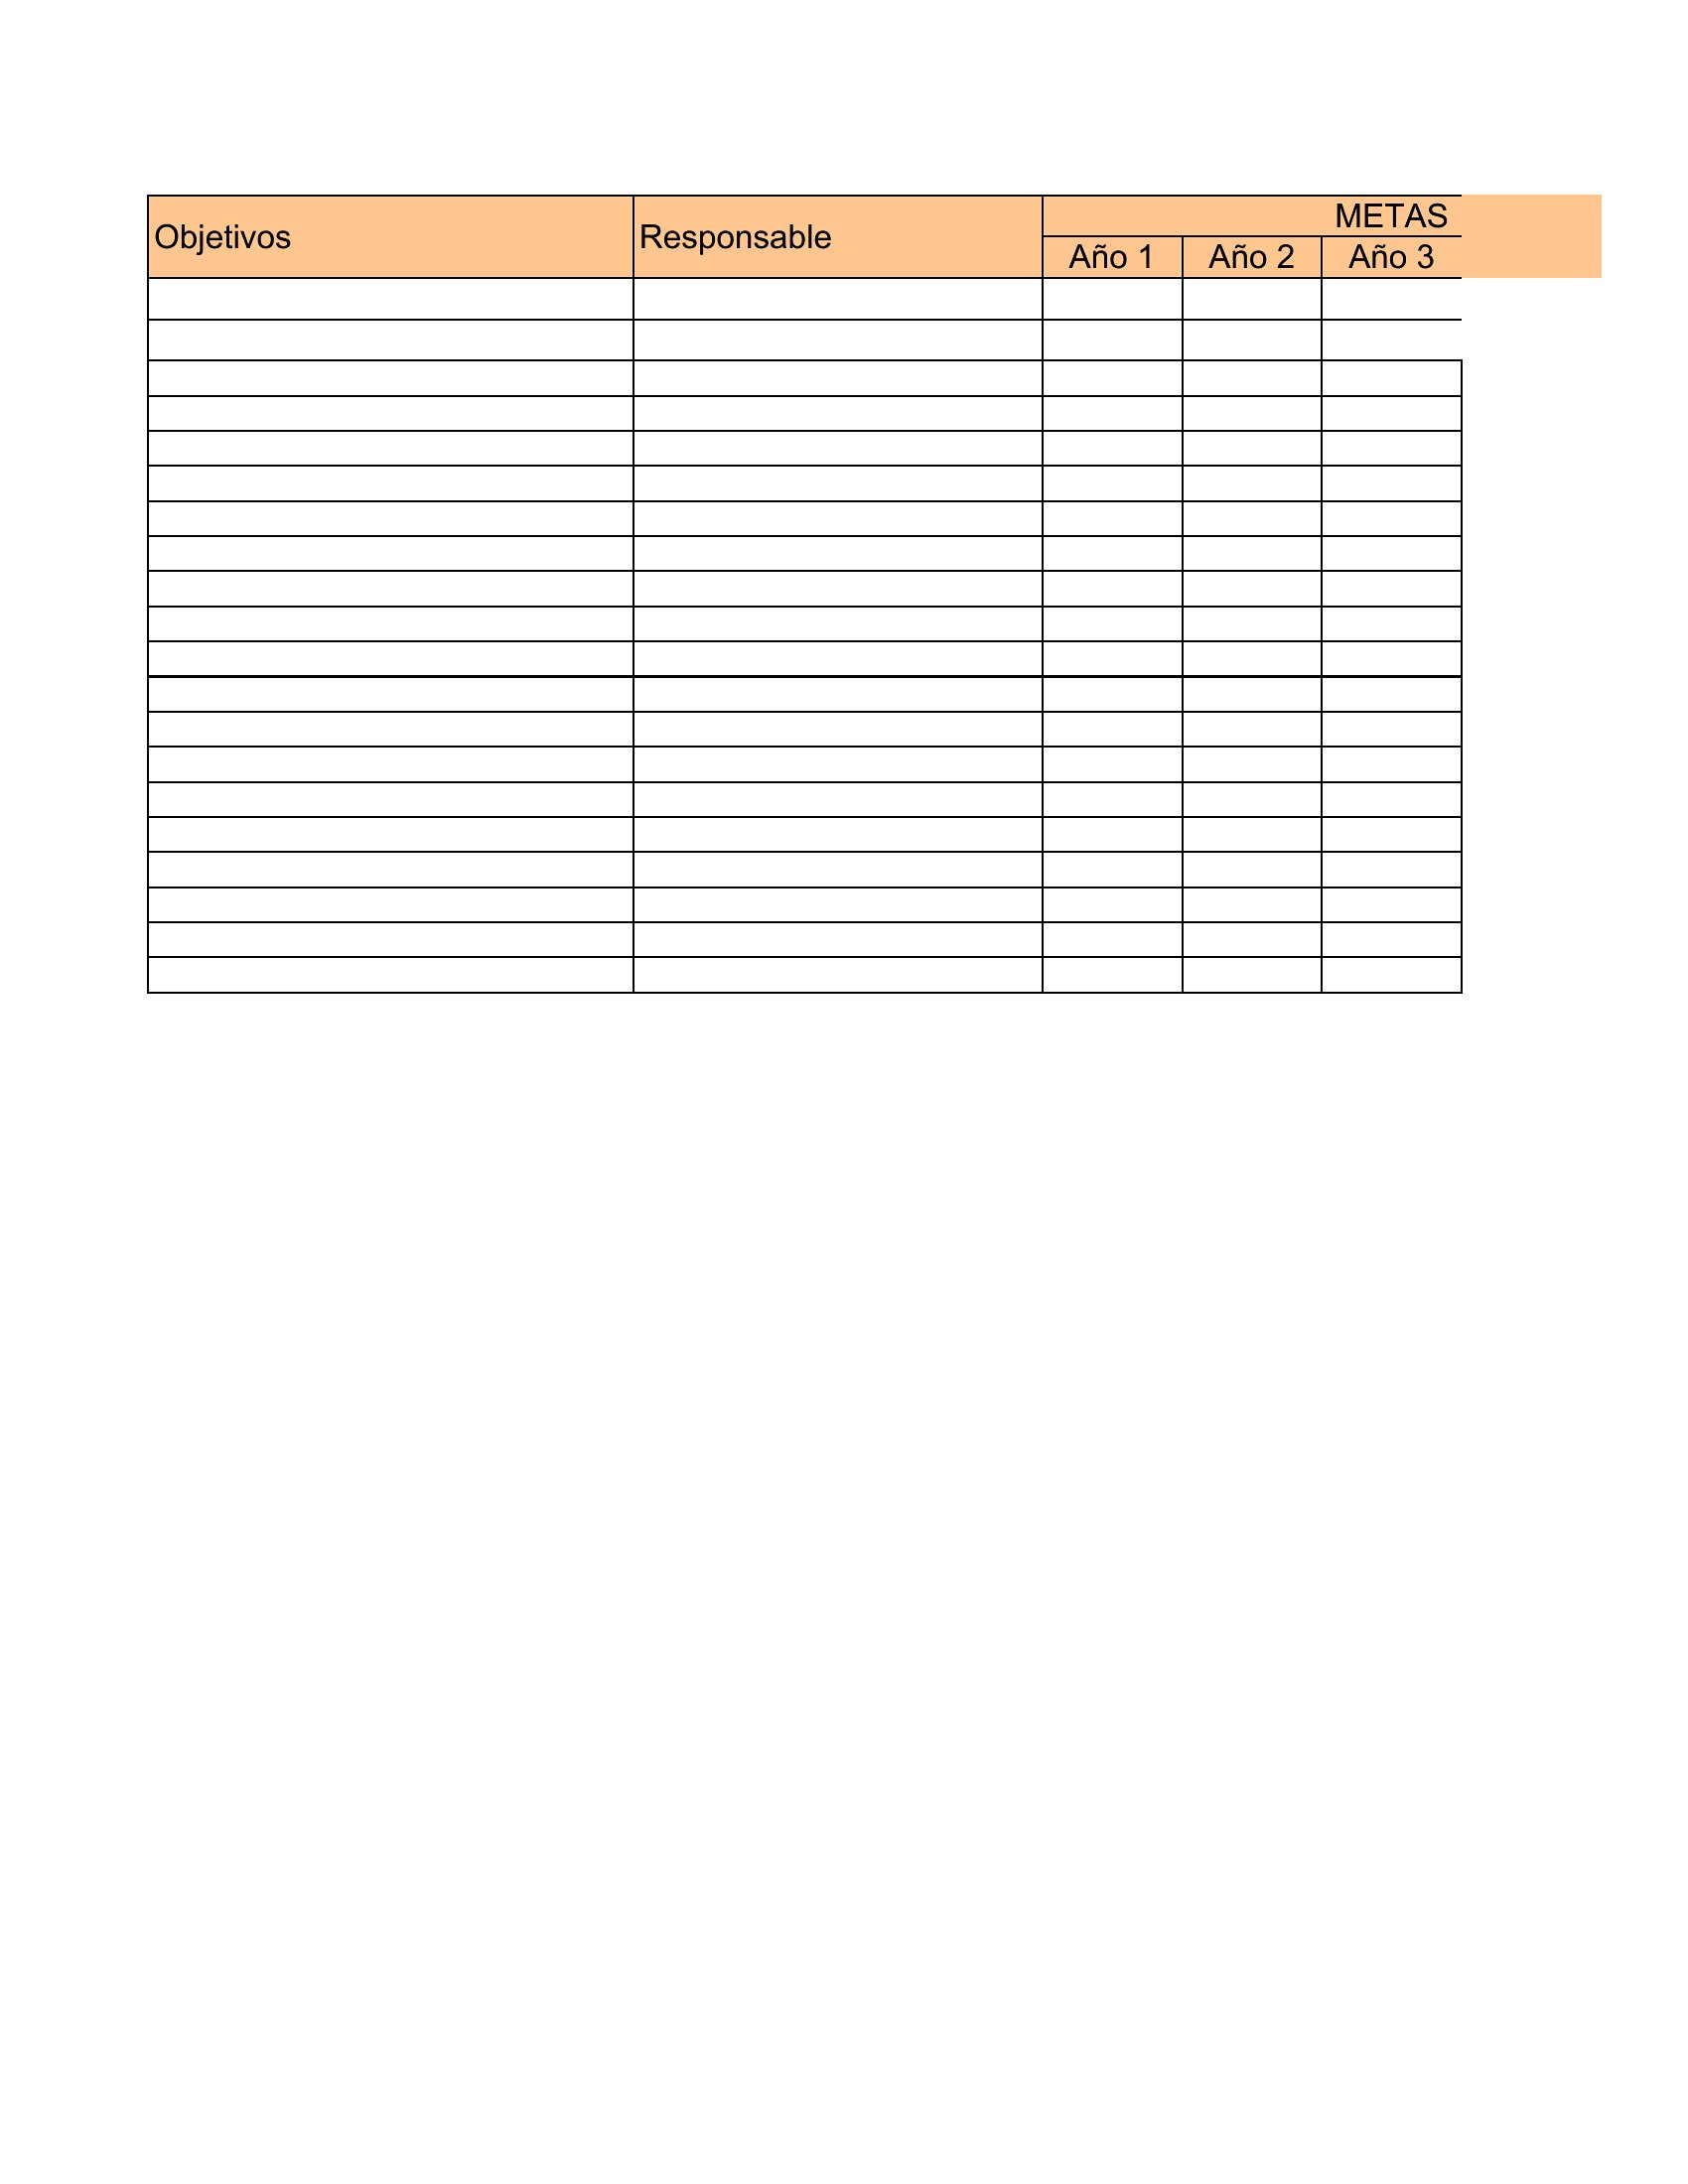
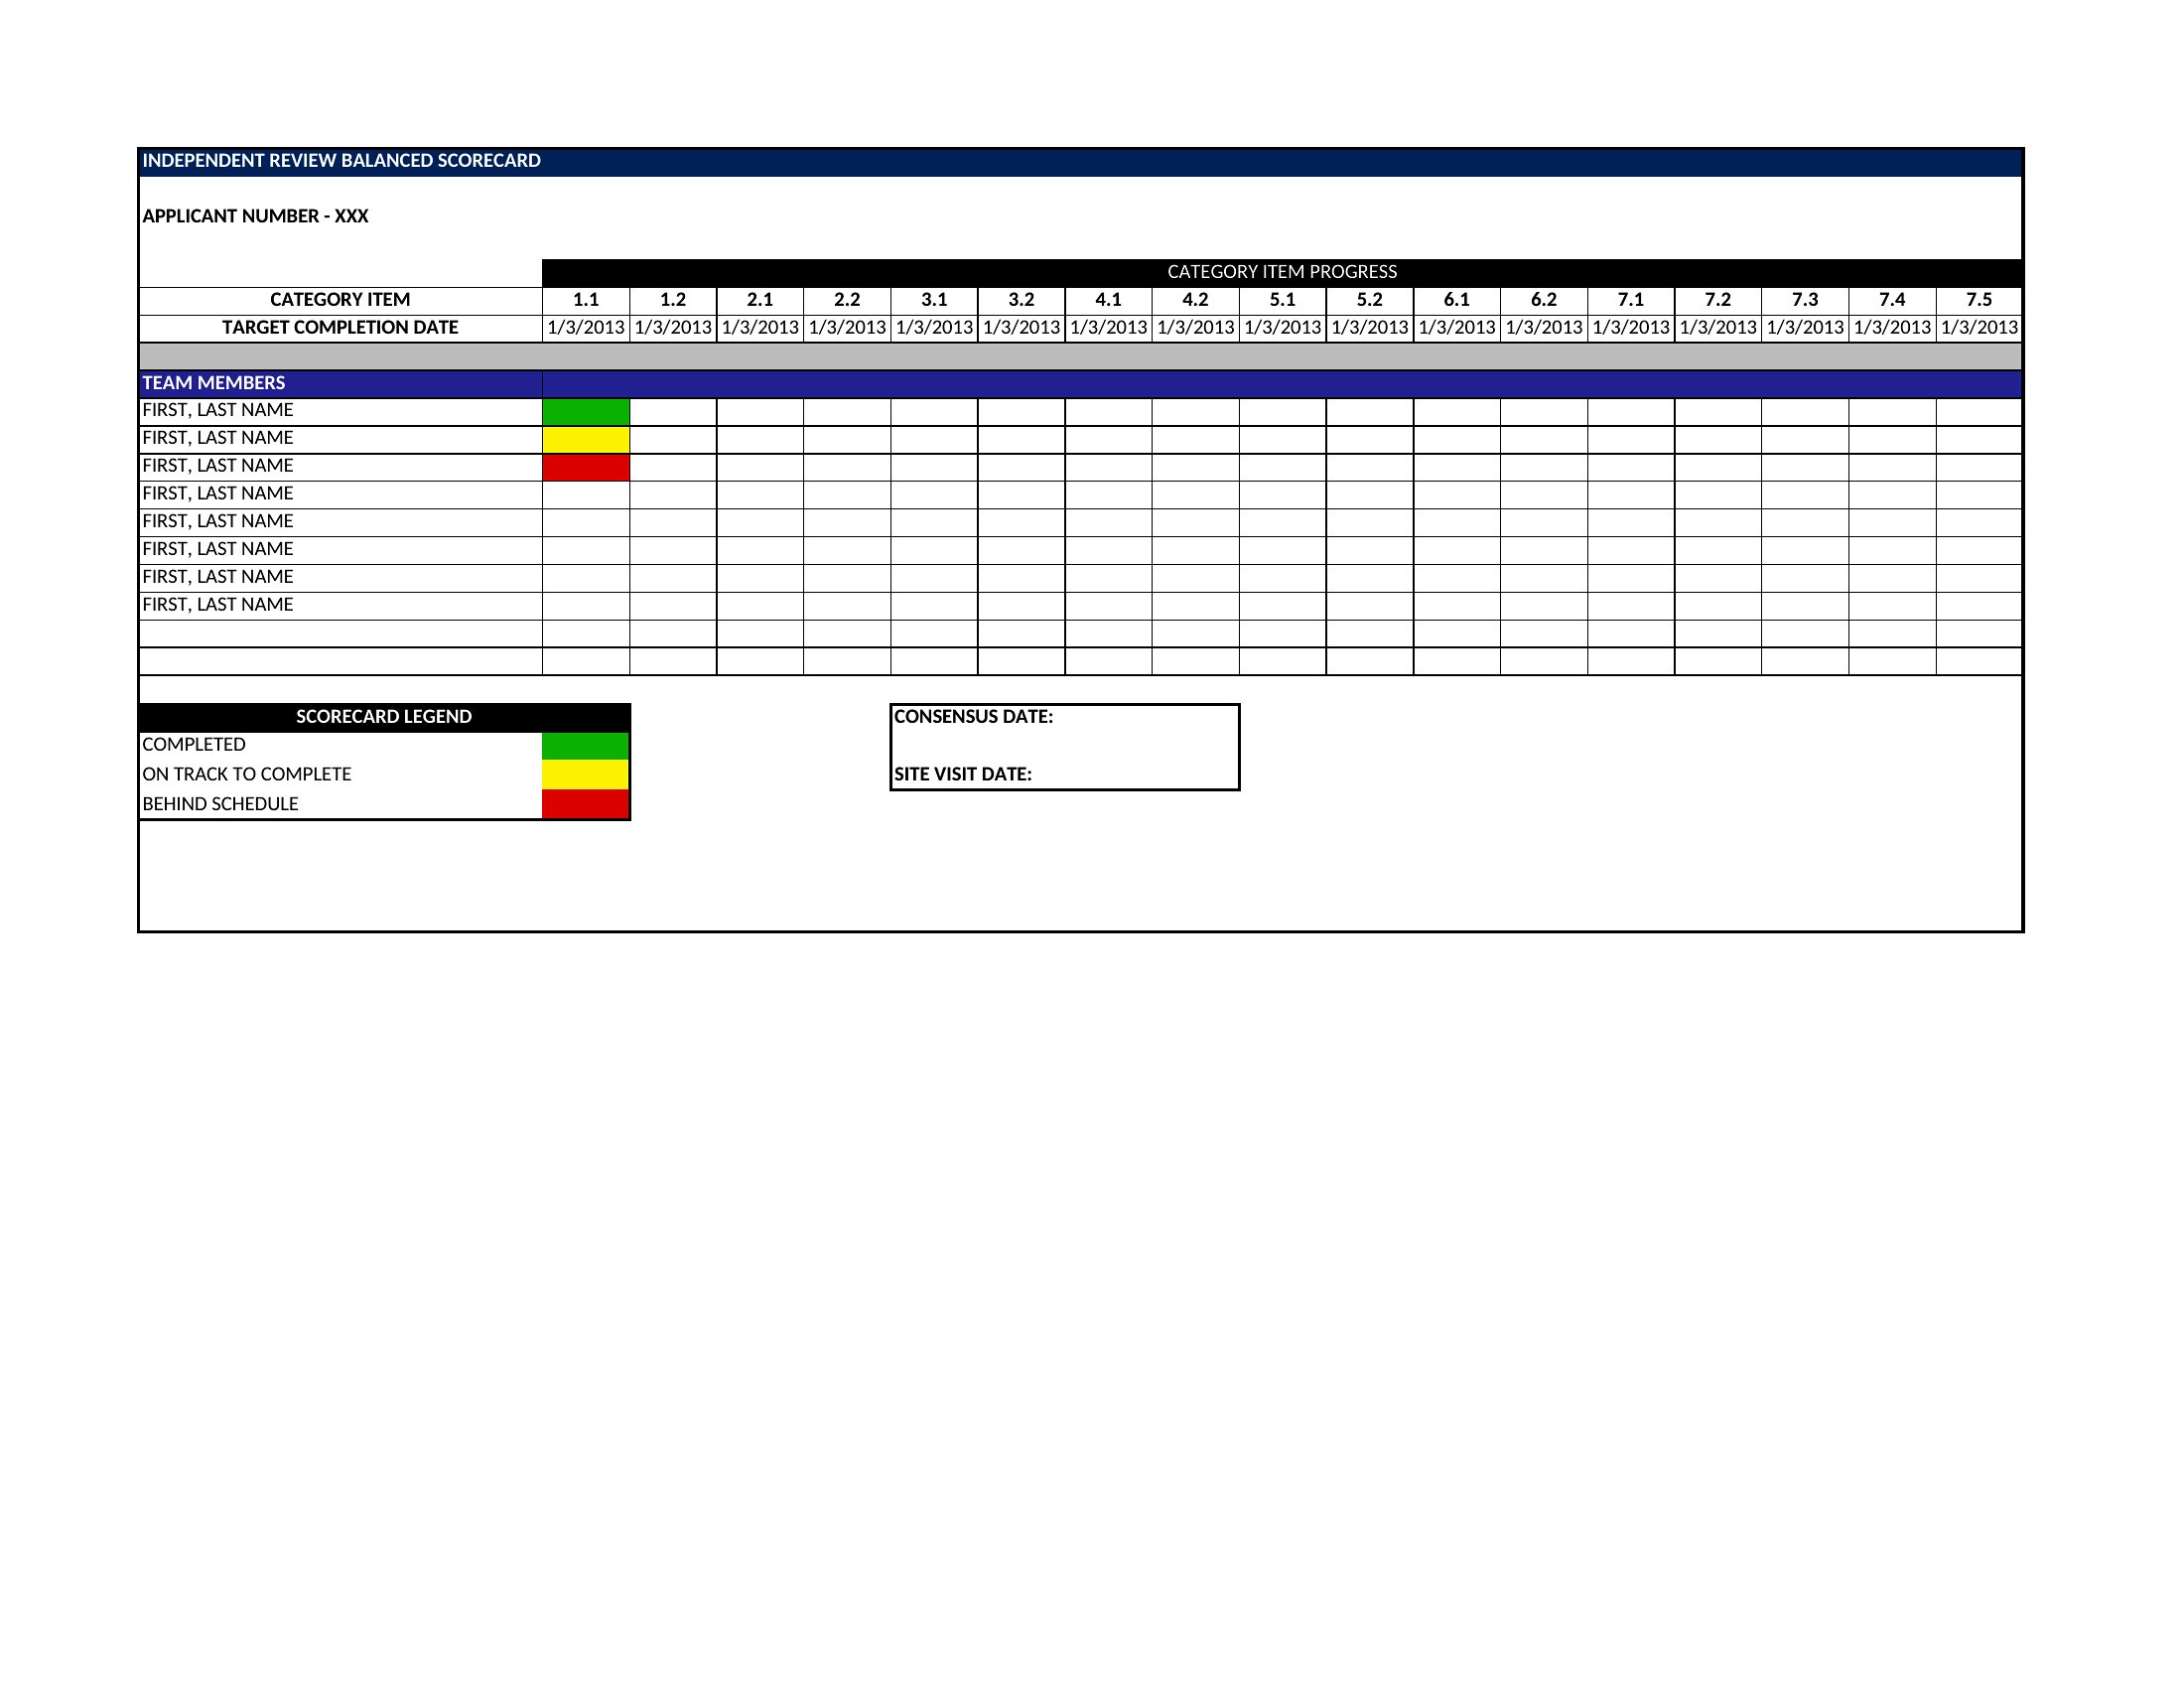
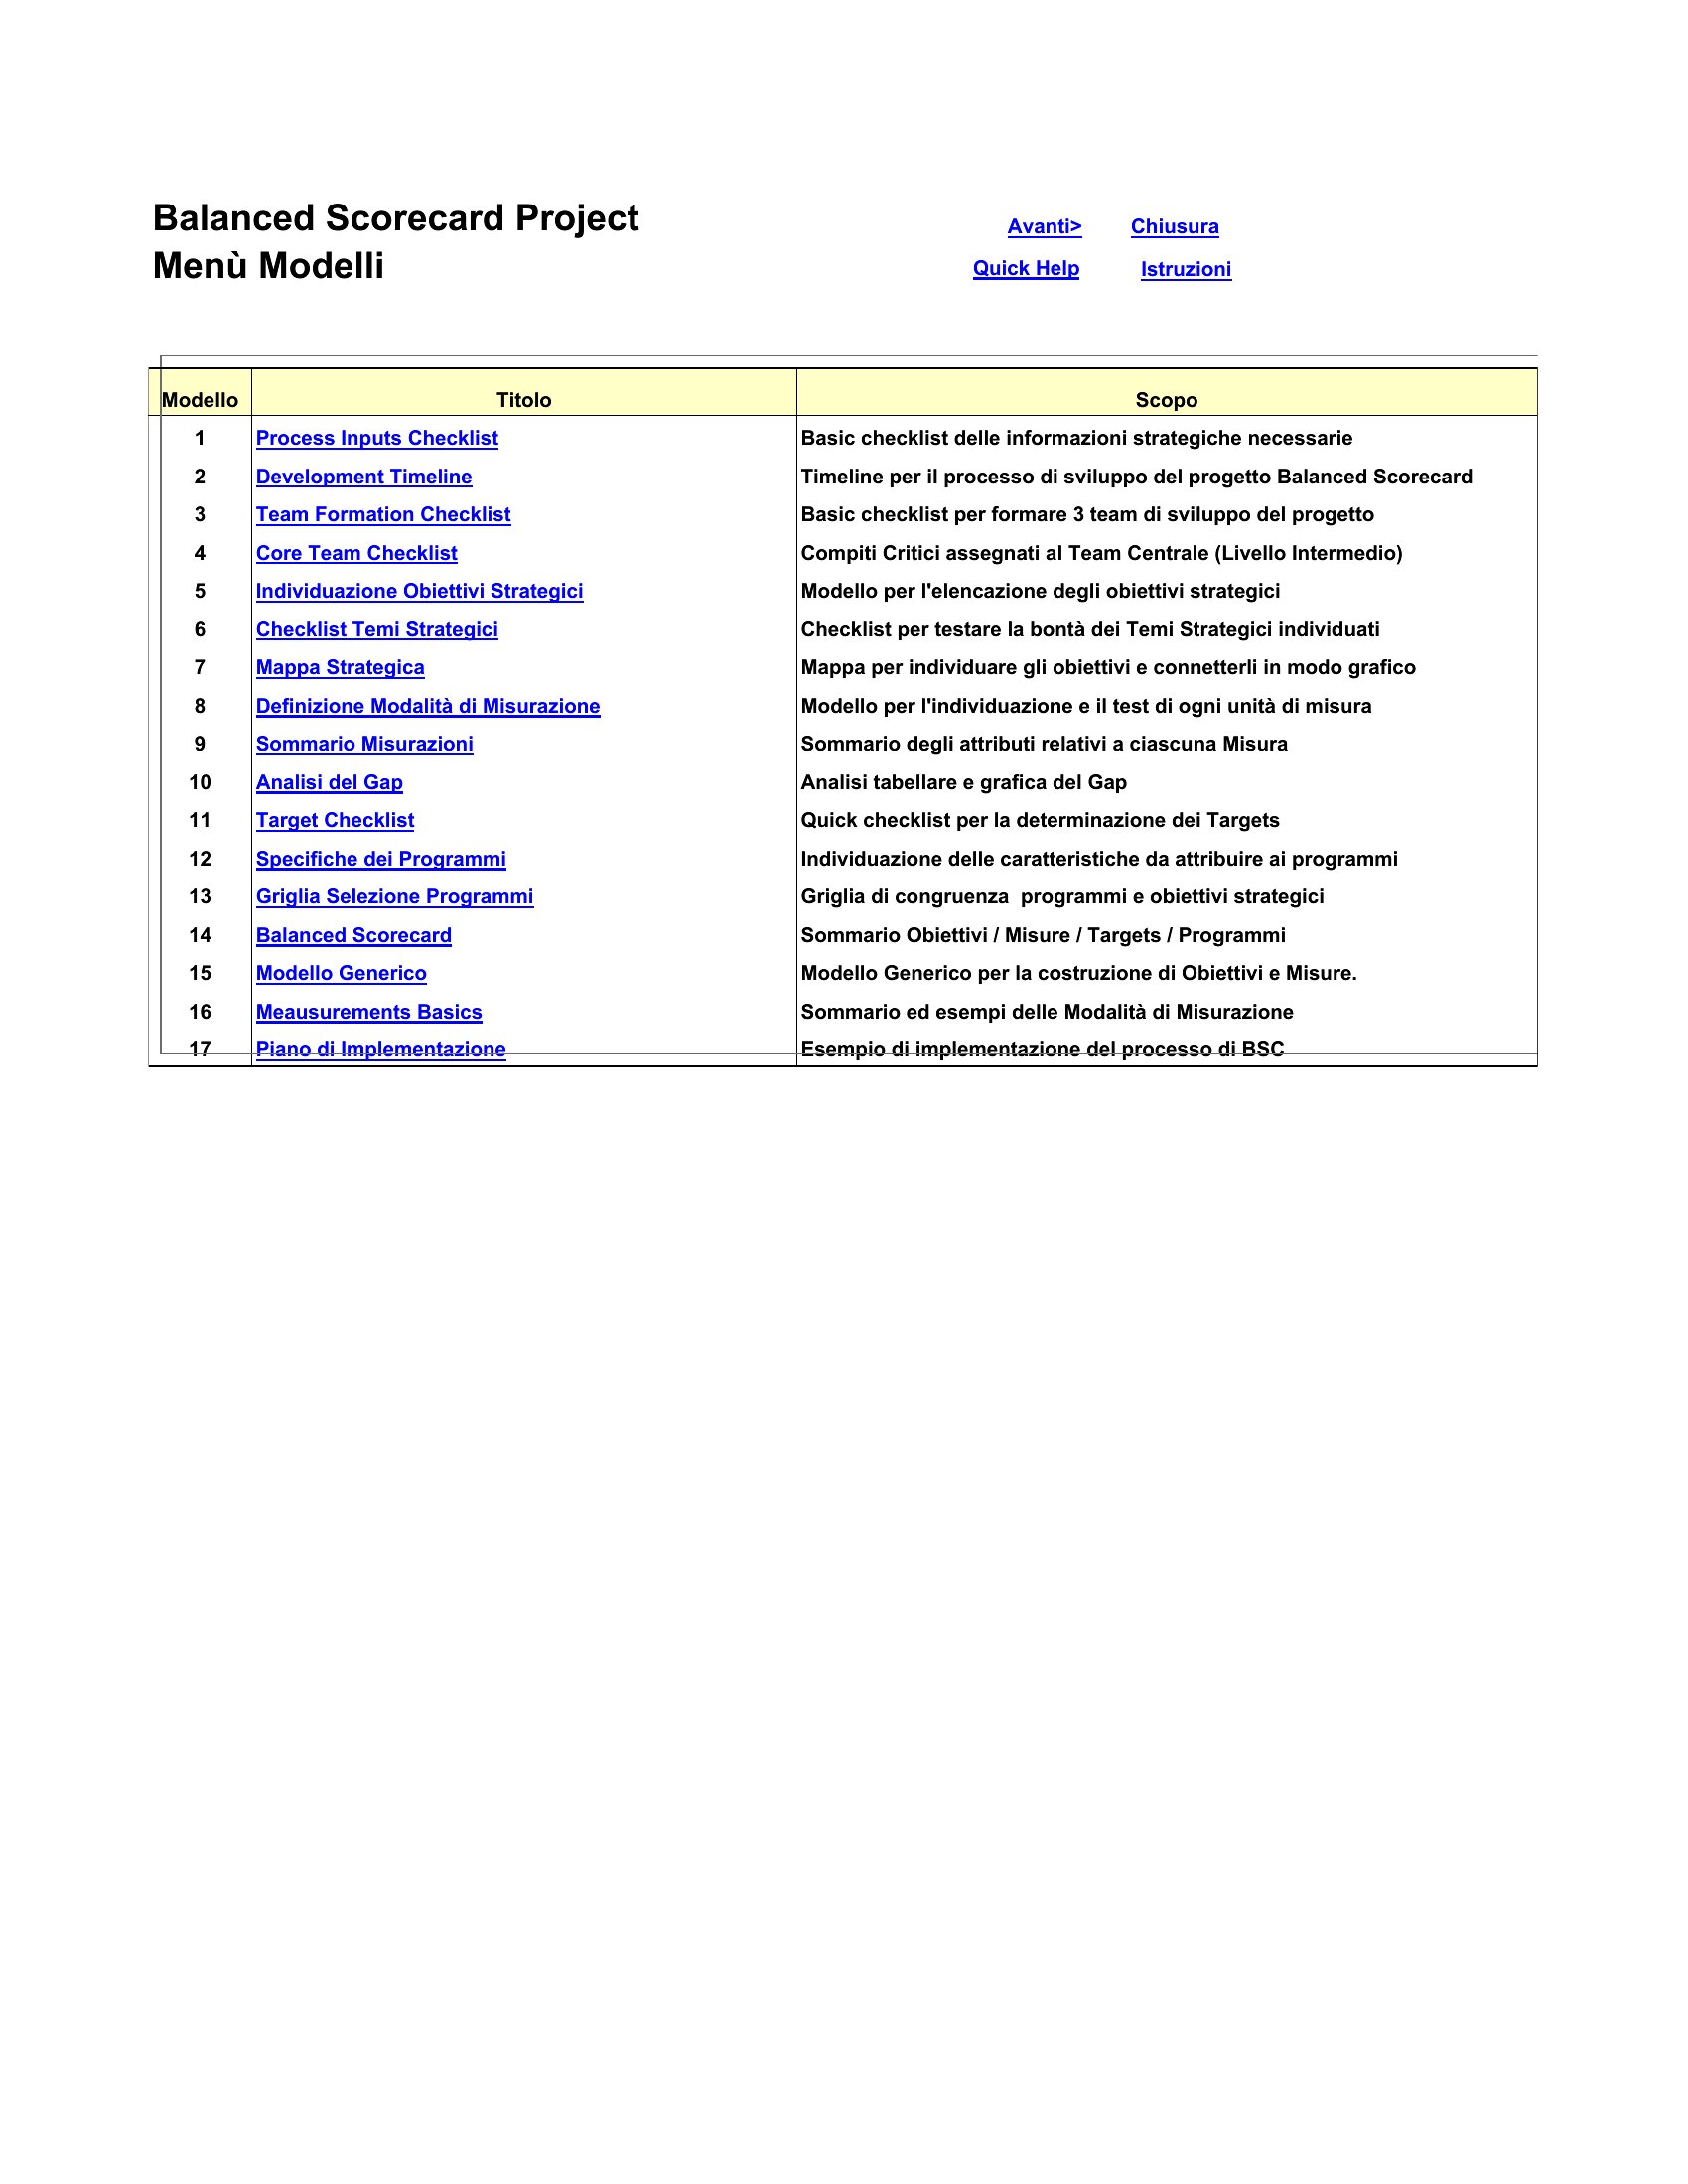
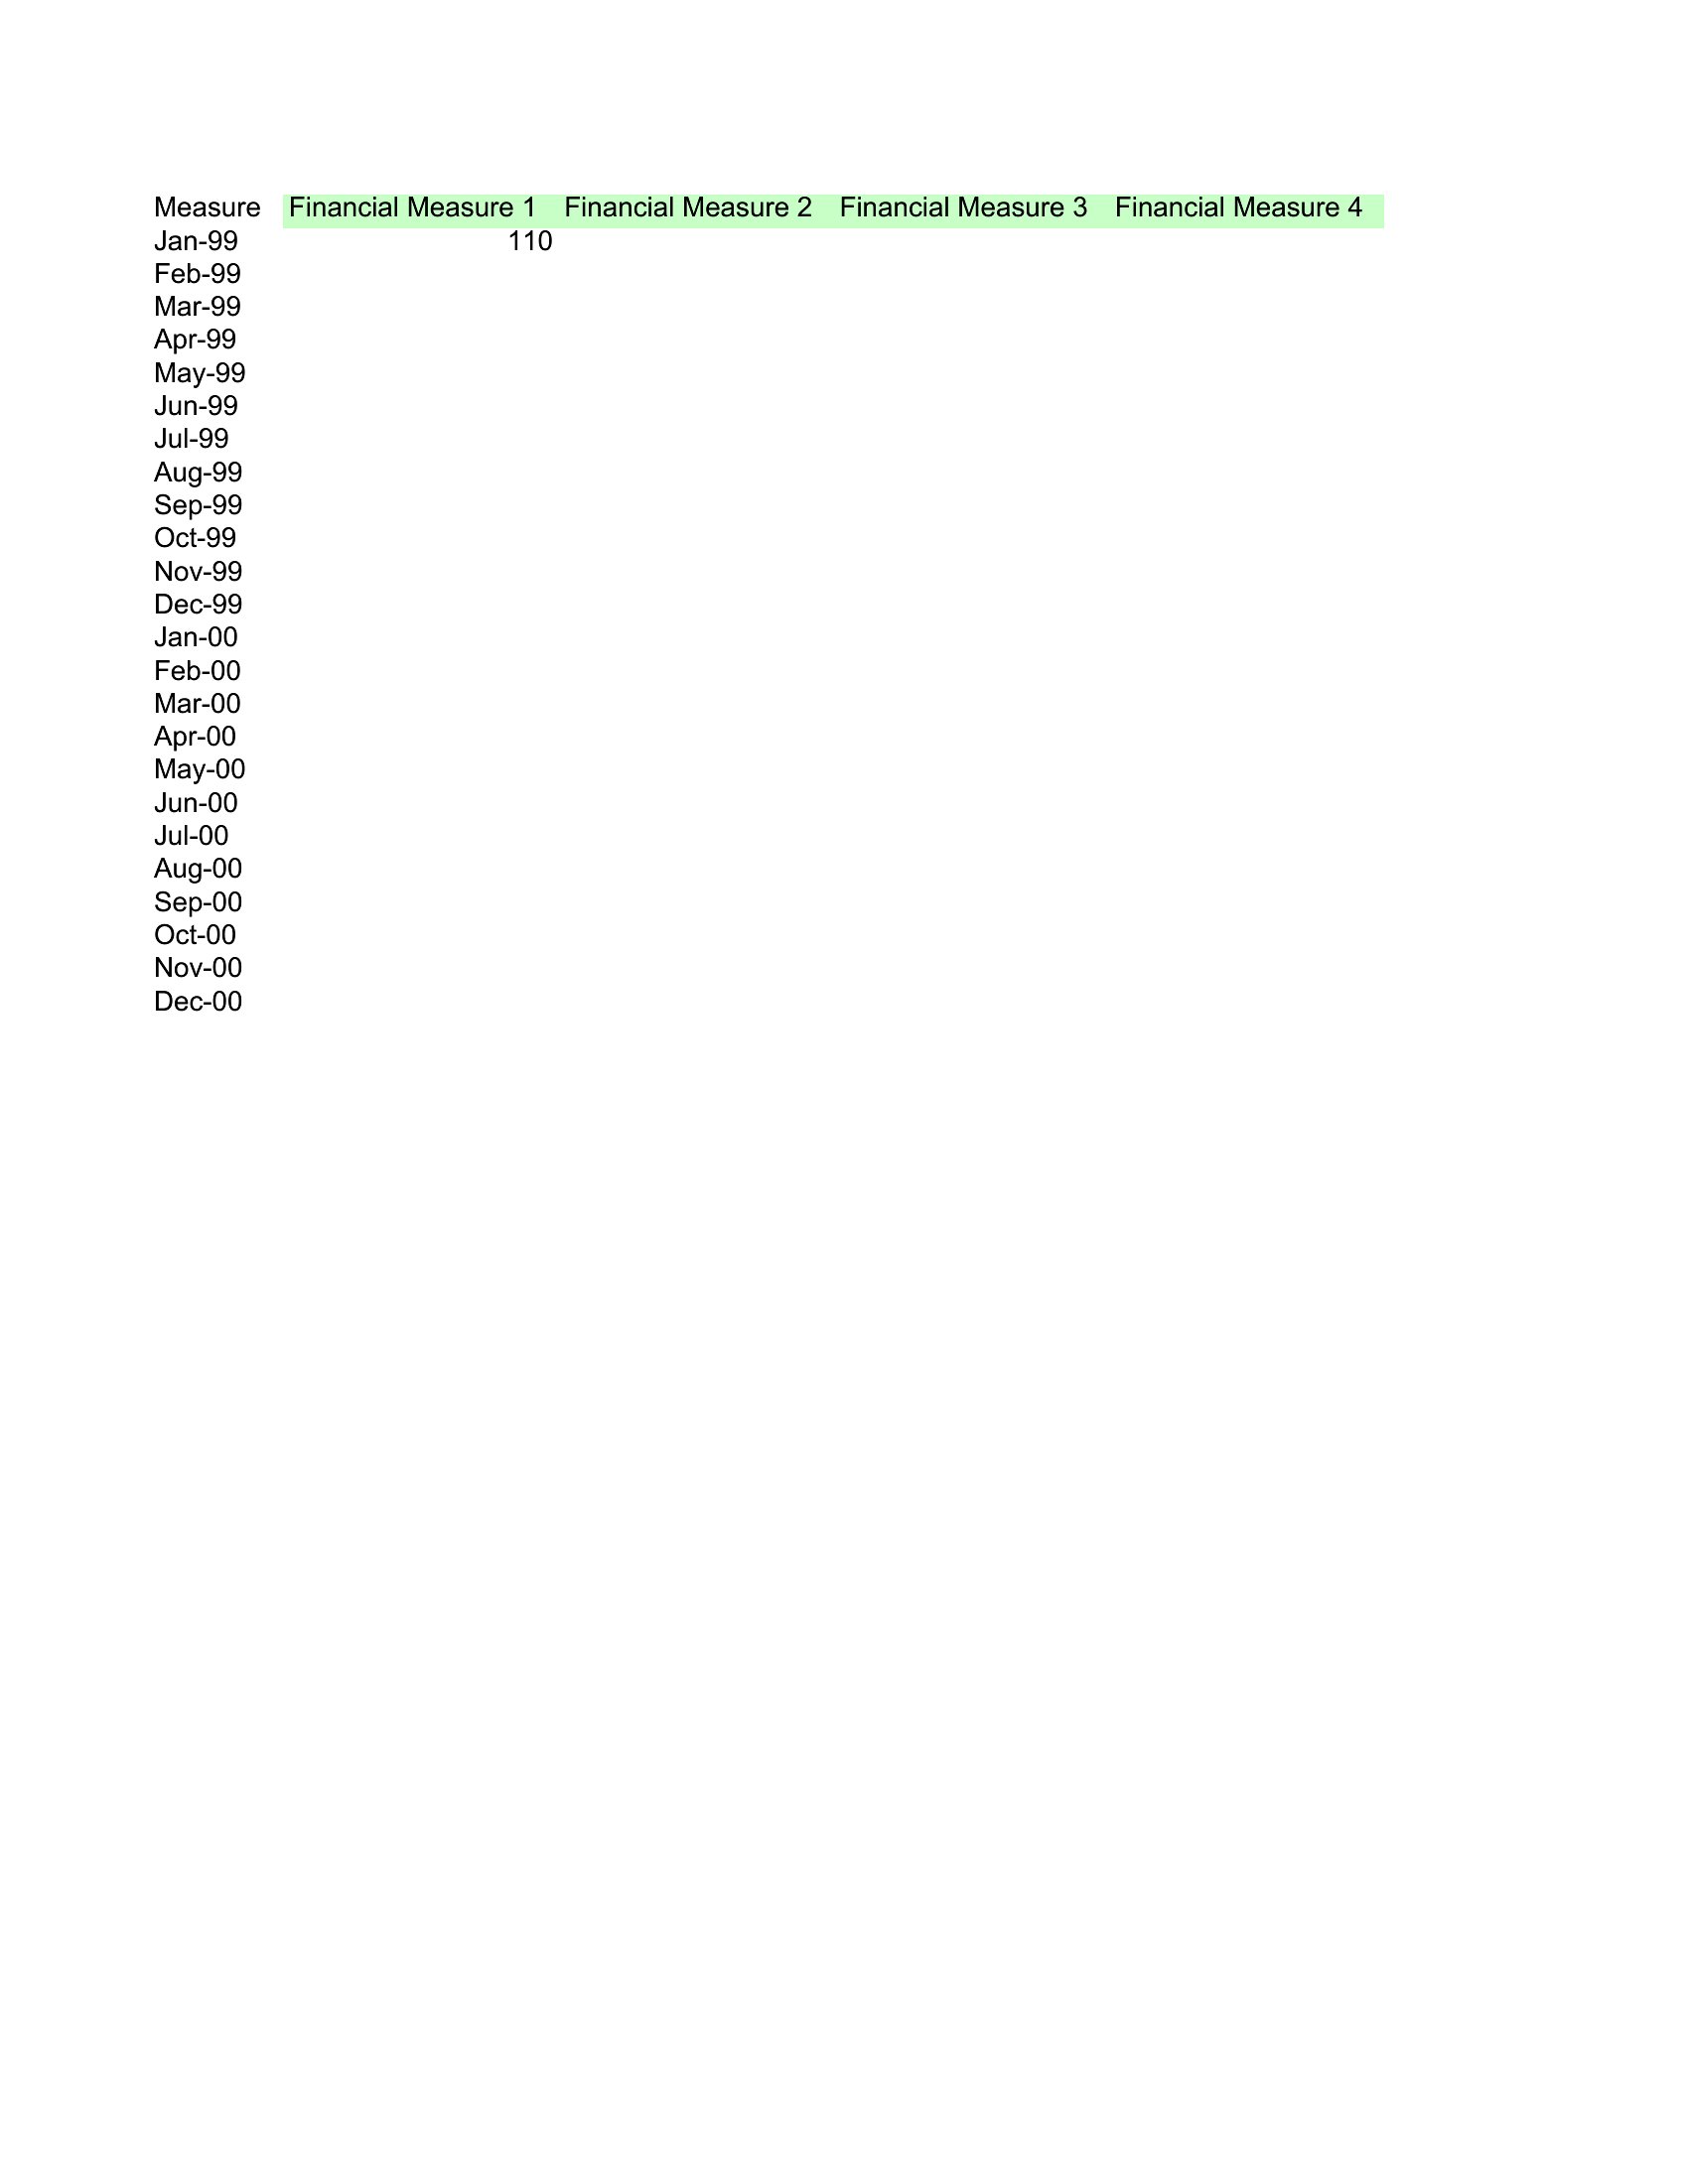
The scorecards come as Excel spreadsheets, so you can plug in your KPIs, set targets, and let the totals and progress update as you enter data. Adapt the perspectives to fit your company or department, then share a clean view with your team. Download the template that matches your goals and start measuring what matters.

When to use this Balanced Scorecard template

  • Mid-sized manufacturing managers align production teams with quarterly revenue goals by tracking financial KPIs alongside customer satisfaction scores in a single dashboard, ensuring quality improvements don’t overshadow profitability.
  • Executives at a healthcare nonprofit monitor patient outcomes (learning and growth) alongside donor retention (customer) and operational efficiency (internal processes) to justify budget requests to board members.
  • HR directors at a tech startup use the scorecard to tie employee training programs (learning and growth) to retention rates (customer) and productivity metrics (internal processes), proving L&D investments drive business impact.
  • Regional sales directors for a retail chain compare store-level financials (sales growth, cost per transaction) against customer loyalty metrics (repeat visits, survey scores) to reallocate resources to underperforming locations.

Which format should I download?

Excel

Stick with Excel for this balanced scorecard collection—it’s the only format included, and it’s purpose-built for the calculations, conditional formatting, and linked cells you’ll need. Excel’s pivot tables let you drill into performance data by department, team, or time period, while its charting tools visualize trends across all four perspectives. Use the pre-built templates as frameworks, then customize the formulas, weightings, and thresholds to match your organization’s priorities and data sources.

How to use this Balanced Scorecard template

Can I adjust the weightings of each perspective (e.g., financial vs. learning and growth) in these templates?

Yes, all templates let you modify the percentage weightings assigned to each of the four perspectives—financial, customer, internal processes, and learning and growth. Simply edit the cells designated for weights in the ‘Strategy Map’ sheet, then recalculate the scorecard to reflect your organization’s priorities. For example, a R&D-heavy company might allocate 40% to learning and growth while a retail chain may prioritize customer metrics at 35%. Save a copy before editing to preserve the original structure.

How do I handle conflicting metrics, like high customer satisfaction scores but low profitability in a specific department?

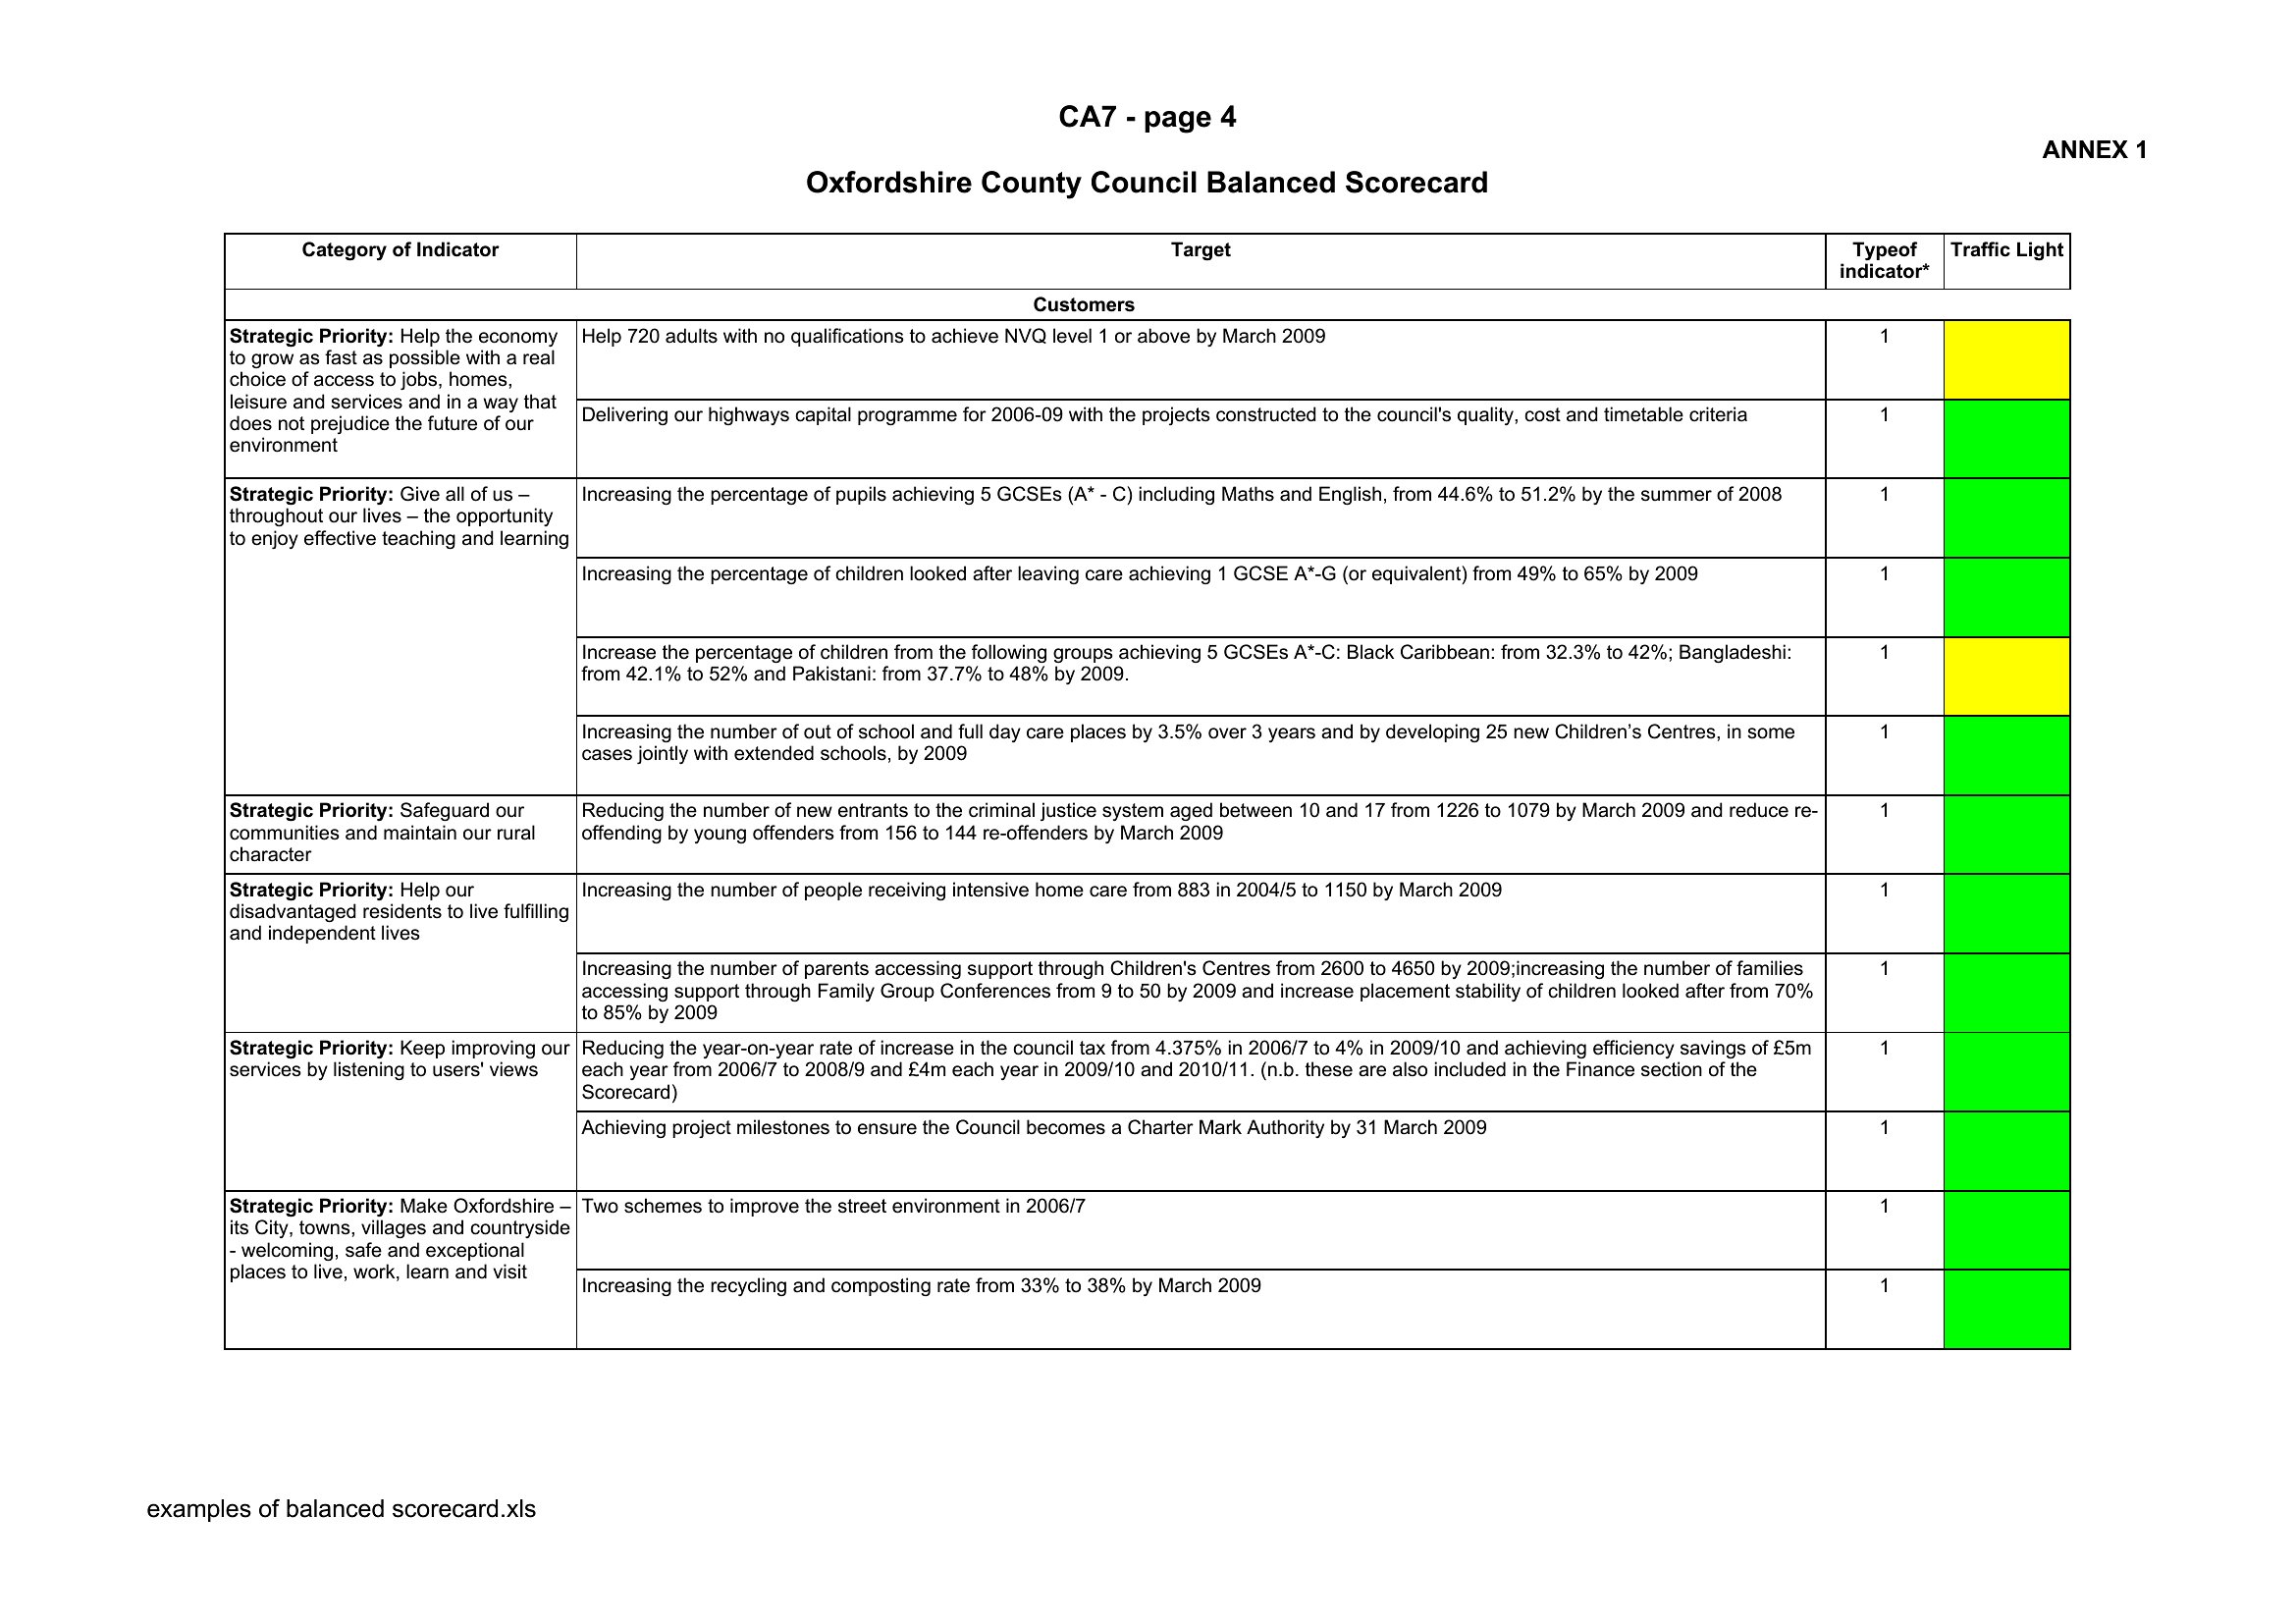
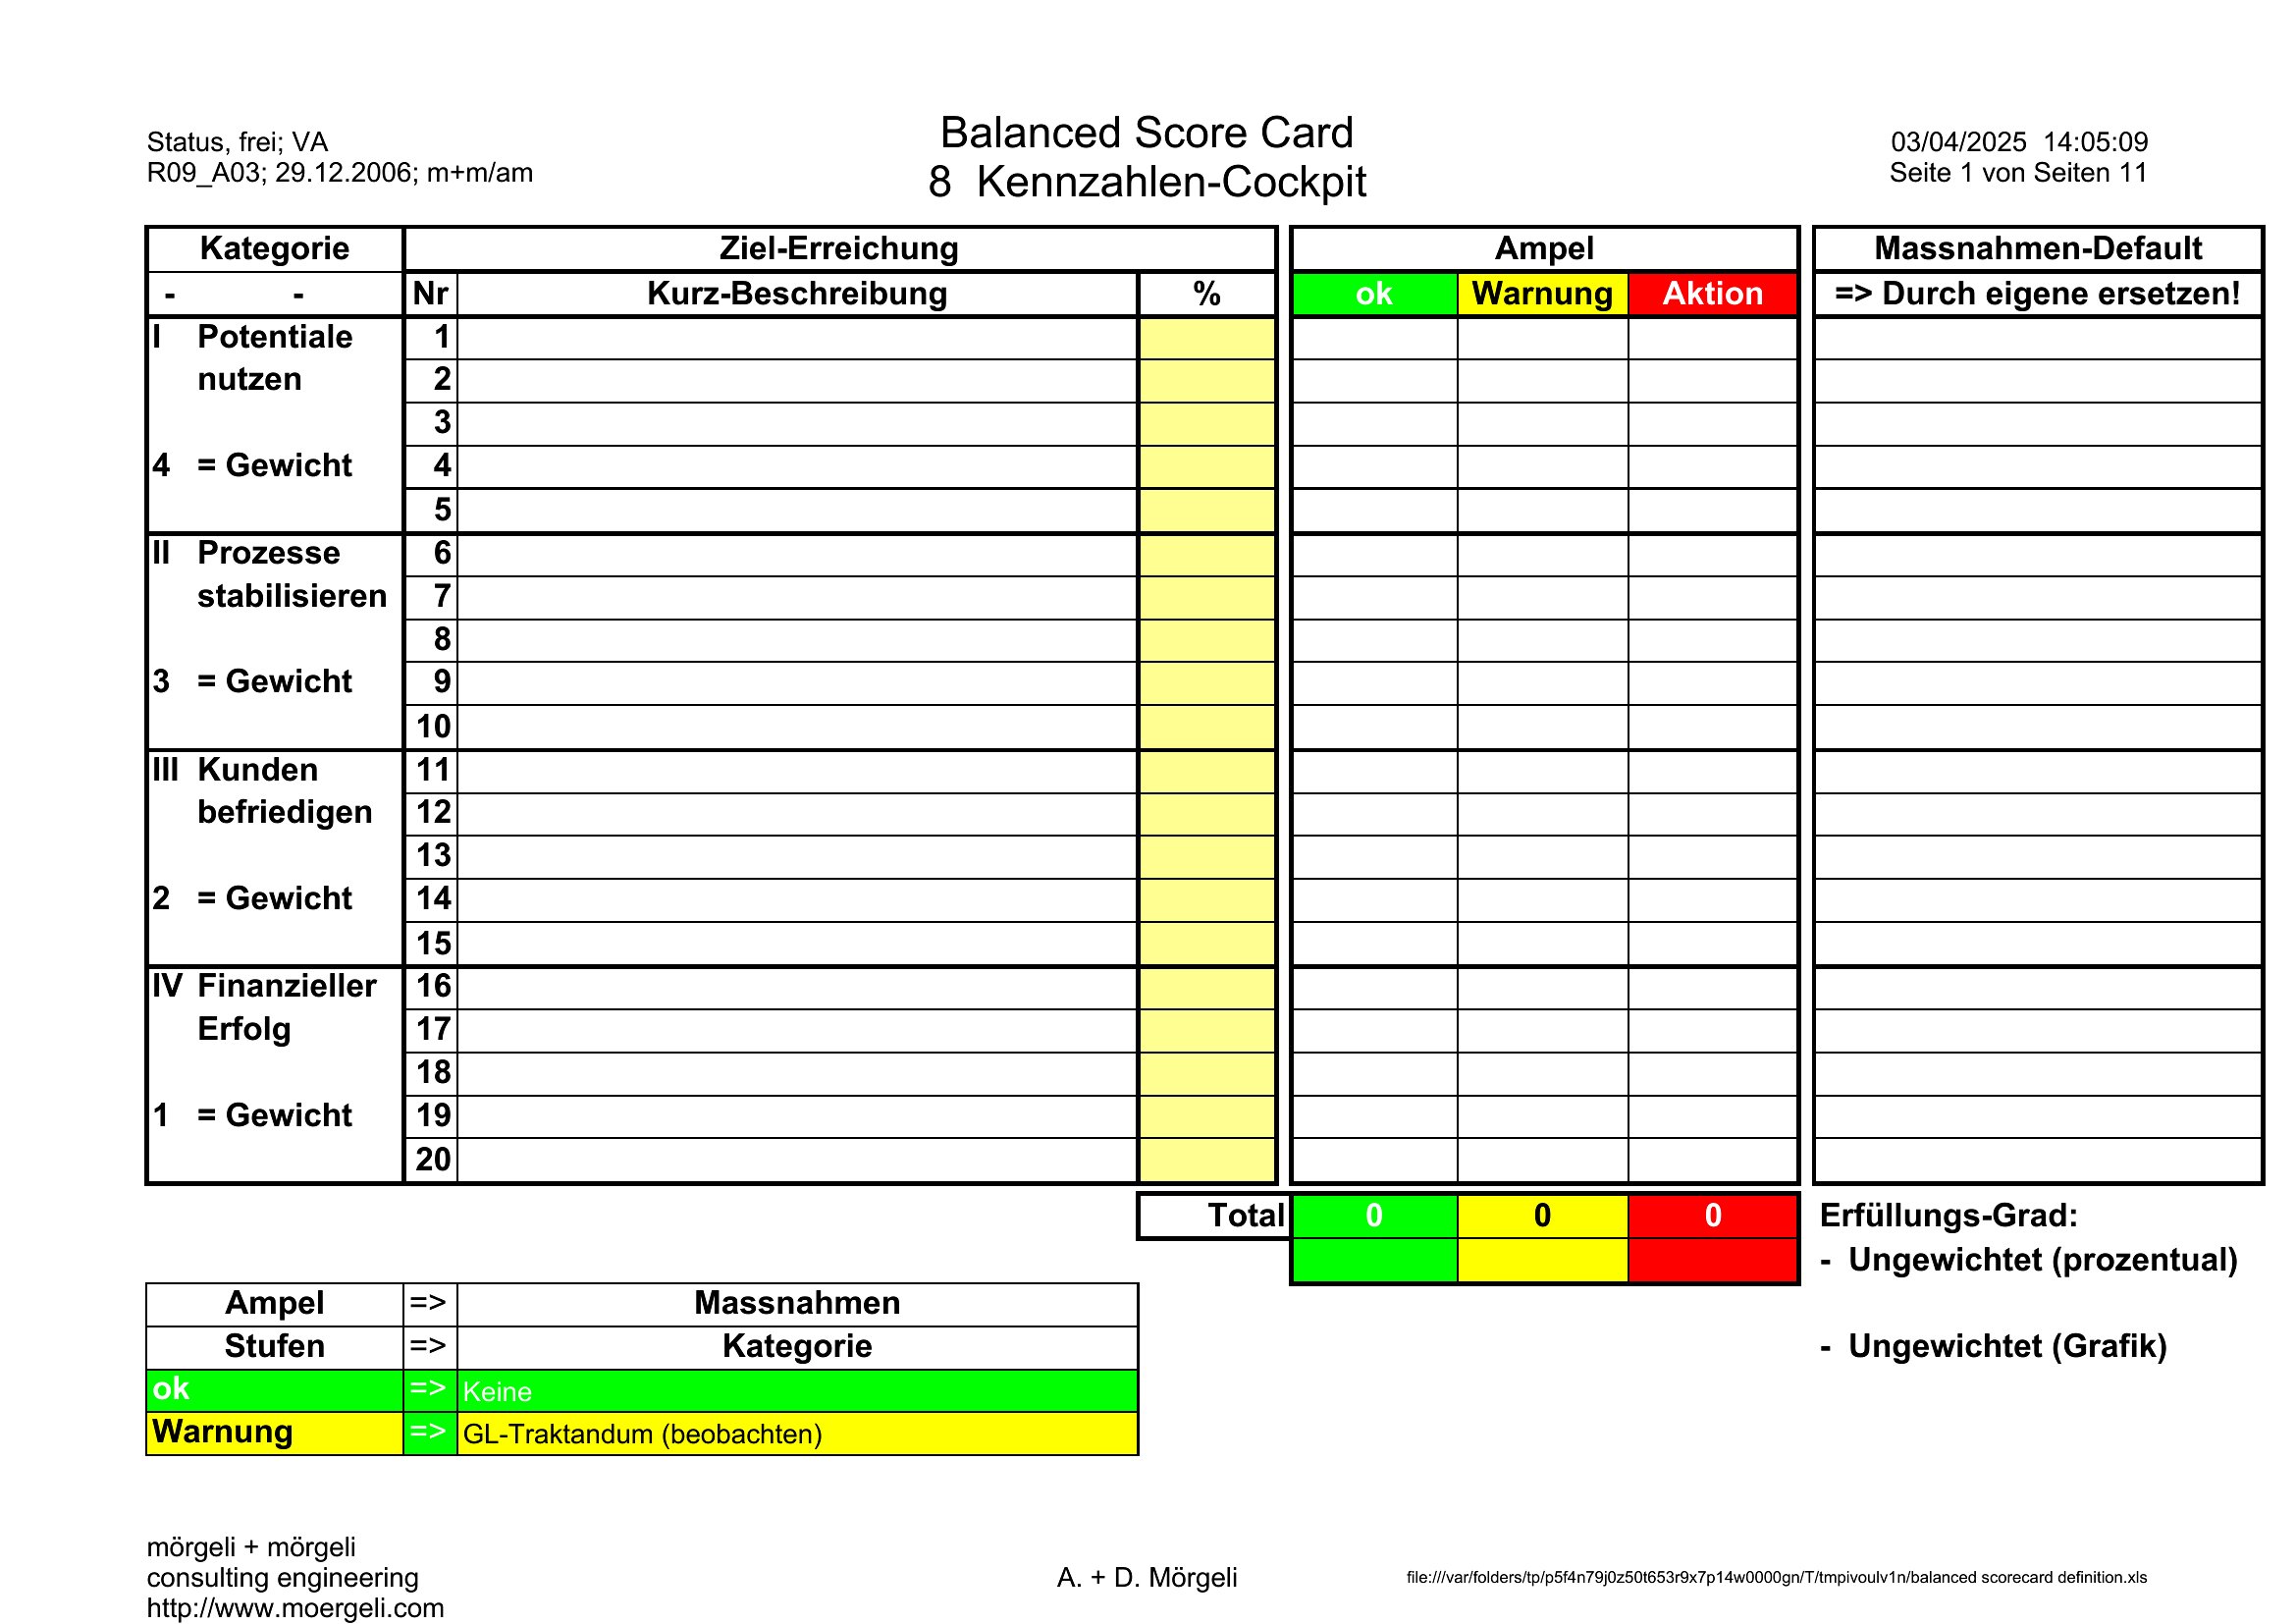
These templates include a ‘Red-Yellow-Green’ traffic light system to flag inconsistencies—like strong customer feedback but weak financials—which prompts further investigation. Use the comments section in the ‘Internal Processes’ tab to document hypotheses (e.g., high-cost service delivery) or risks (e.g., churn if prices rise). Link these notes to your strategic review meetings to decide whether to reallocate resources, renegotiate terms, or adjust expectations. The scorecard isn’t a solver, but it surfaces tensions for discussion.

What if my team’s goals don’t fit neatly into the four standard perspectives? Can I add a fifth category?

While the balanced scorecard framework is designed around the four perspectives, you can adapt these templates by combining or renaming categories—just ensure the new labels remain actionable. For instance, a sustainability-focused team might merge ‘internal processes’ and ‘learning and growth’ into ‘eco-efficiency initiatives.’ Avoid adding a fifth column, as it dilutes the balance of the model. Instead, redefine objectives under existing headings (e.g., ‘customer’ could include ‘community impact’ metrics) or use the ‘Notes’ tab to track outliers that don’t fit.

Comments

Join the conversation

Sign in to share your thoughts and leave a comment on this resource.

Newsletter

Get Weekly Design Updates

Join our community to receive curated resources and inspiration.

Weekly Tips Resources Early Access

We respect your privacy. Confirmation email required. Privacy Policy