
Free Excel Dashboard Templates (Excel)
Data by ashleyalexander
A good dashboard turns rows of data into a picture you can read in seconds. This set of 15 Excel dashboard templates comes with charts, KPI summaries, and clean layouts already wired up, so analysts, managers, and small-business owners can track sales, budgets, or projects without building formulas from scratch. Just point them at your numbers.
Because they're built in Excel, the charts and totals update automatically as you swap in your own data. Customize the colors, metrics, and layout to match what you're measuring, and you've got a polished view to share with your team. Download the dashboard that fits your data and start seeing the story in your numbers.
When to use this Excel Dashboard template
- A regional sales manager who needs to track monthly revenue by territory, comparing actuals to targets, and share insights with a team of 10 reps via weekly Slack updates.
- A small-business owner monitoring cash flow, inventory turnover, and supplier payment deadlines, but lacks time to manually update pivot tables every Friday.
- A project coordinator overseeing three concurrent initiatives and wants a single dashboard to flag delays, budget overruns, and resource gaps before status meetings.
- A non-profit program director analyzing donor trends, grant expenditures, and volunteer hours across five locations, needing a clear way to present data to the board.
Which format should I download?
All 15 templates are Excel-based, so use this format exclusively. Choose this when you need dynamic calculations, interactive filters (like slicers), and the ability to pull live data from other sheets or external sources. Excel is ideal for teams already embedded in the Microsoft ecosystem or when you require formulas like SUMIFS, VLOOKUP, or data validation dropdowns to streamline data entry. Avoid if you’re working with purely static visuals or need real-time cloud collaboration beyond Excel’s built-in sharing.
Choose from 15 Excel Dashboard Templates
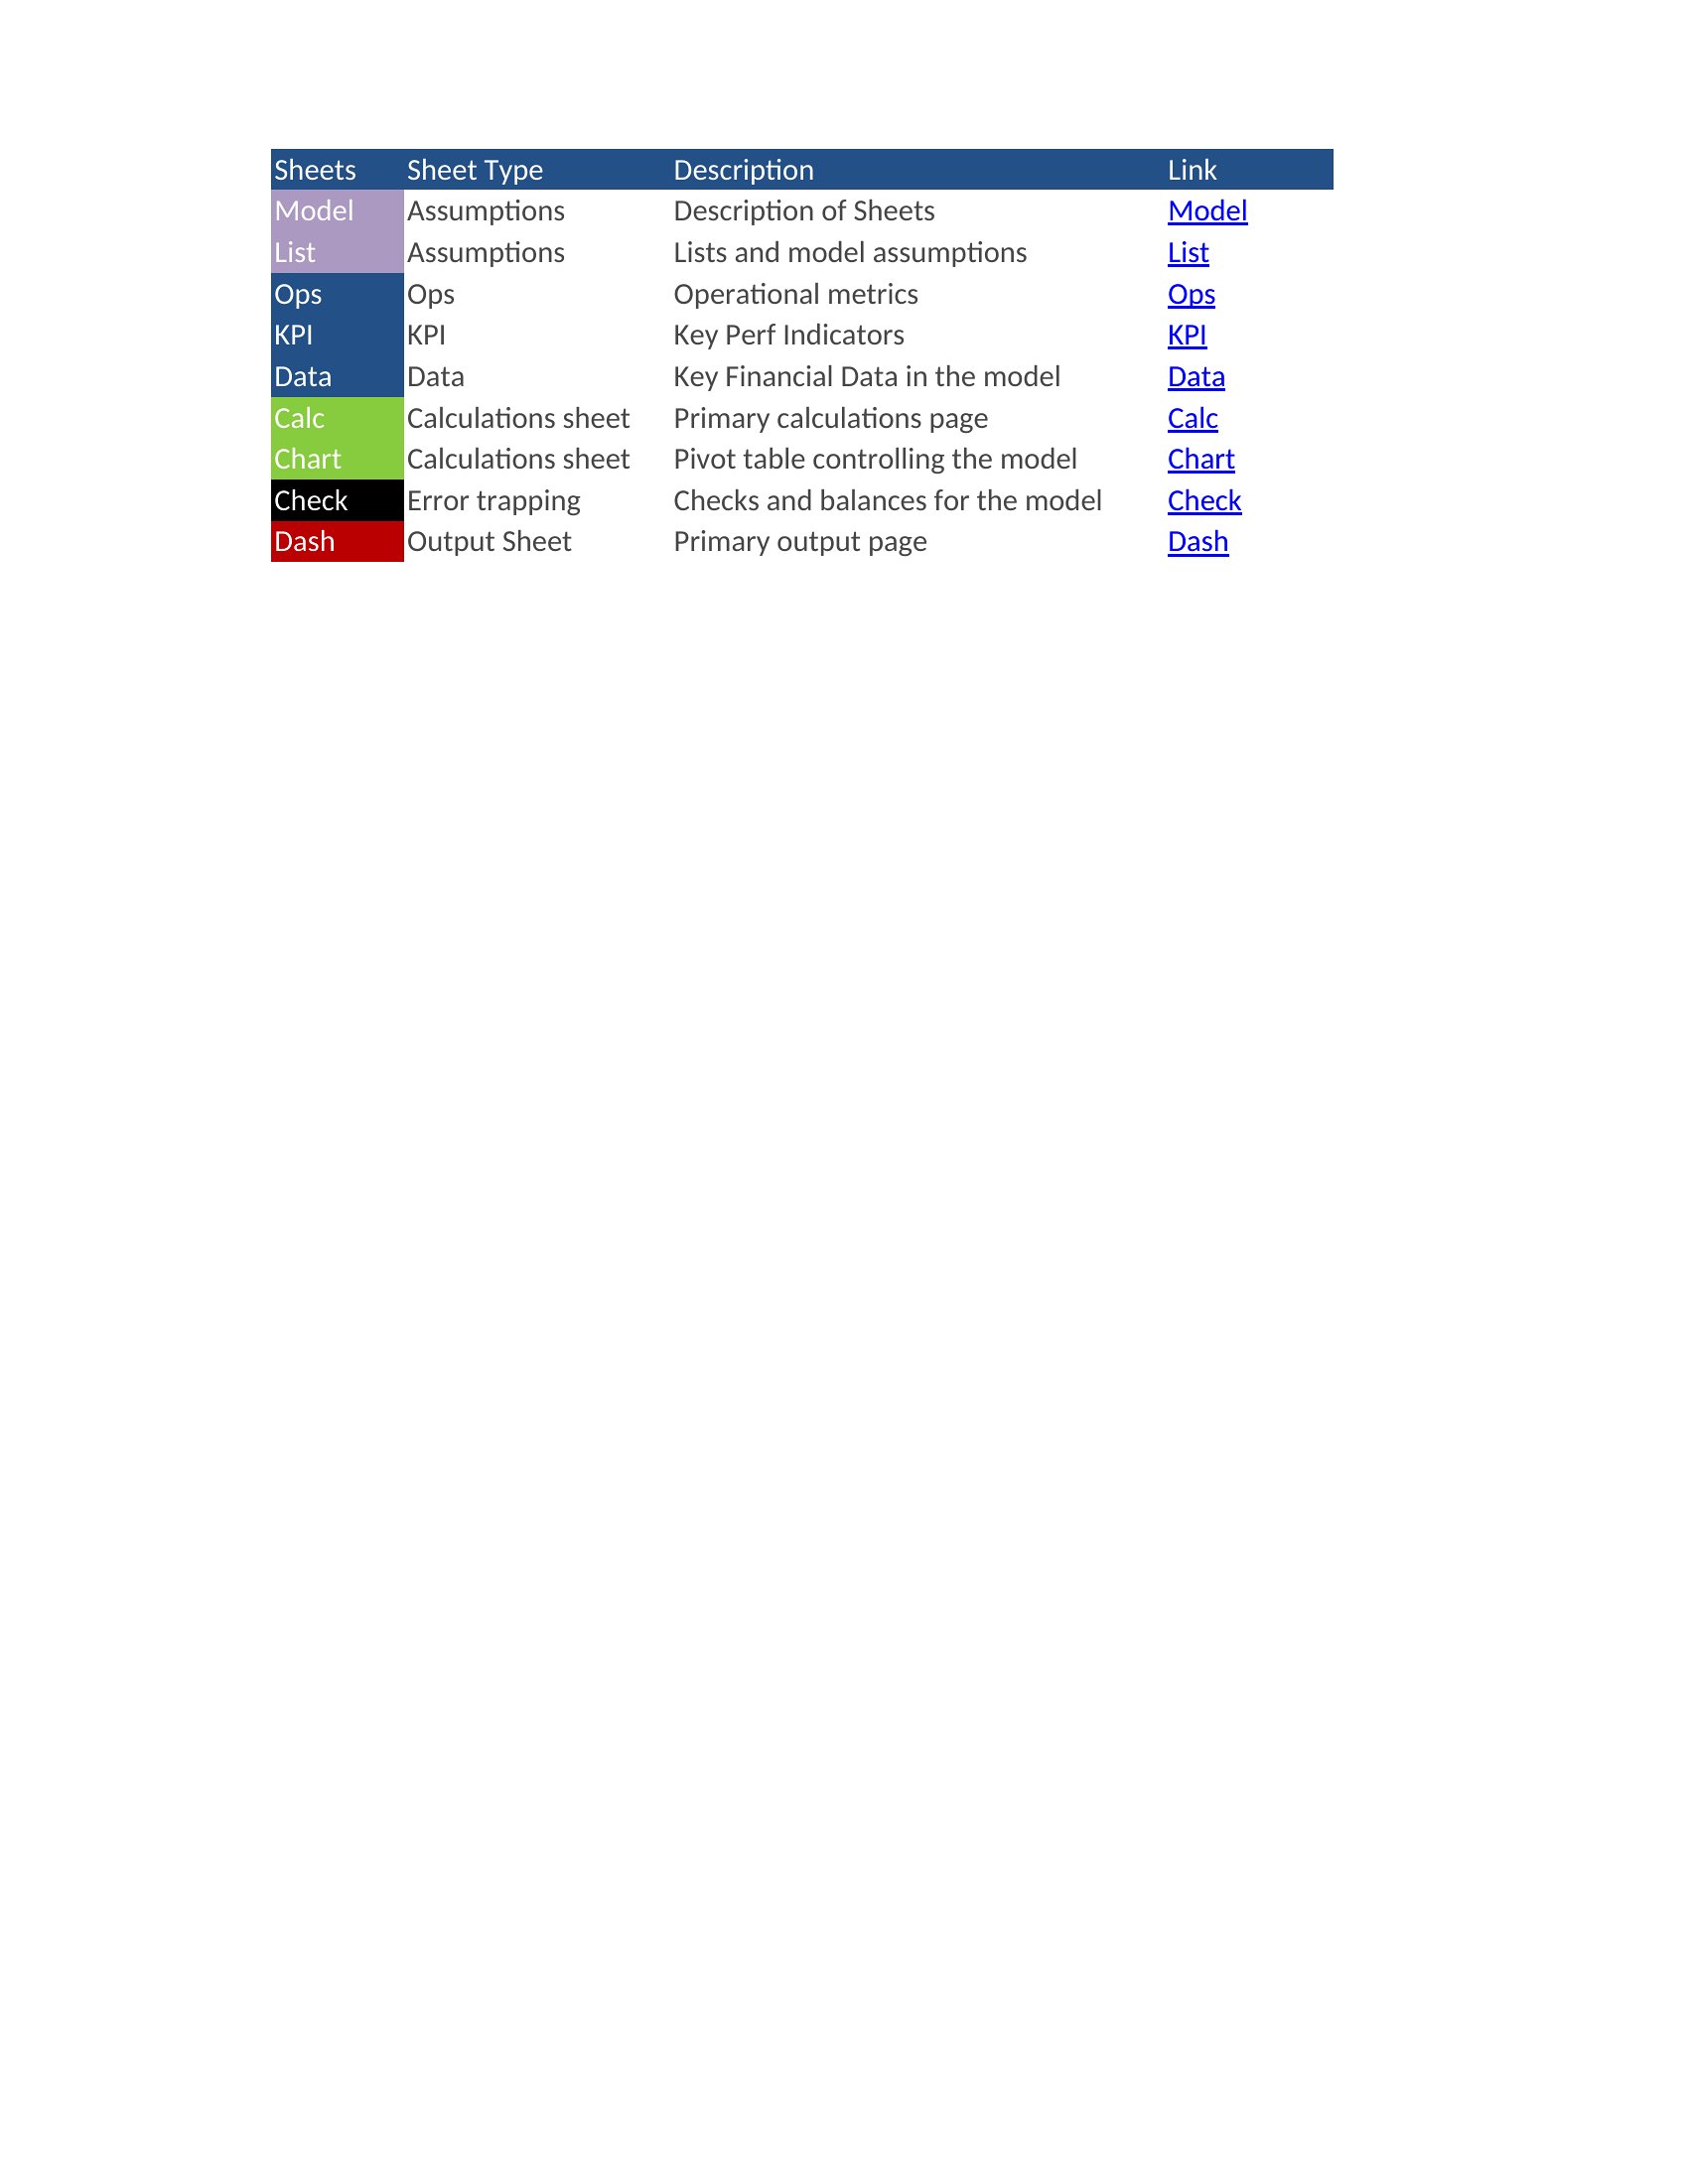

Excel Dashboards
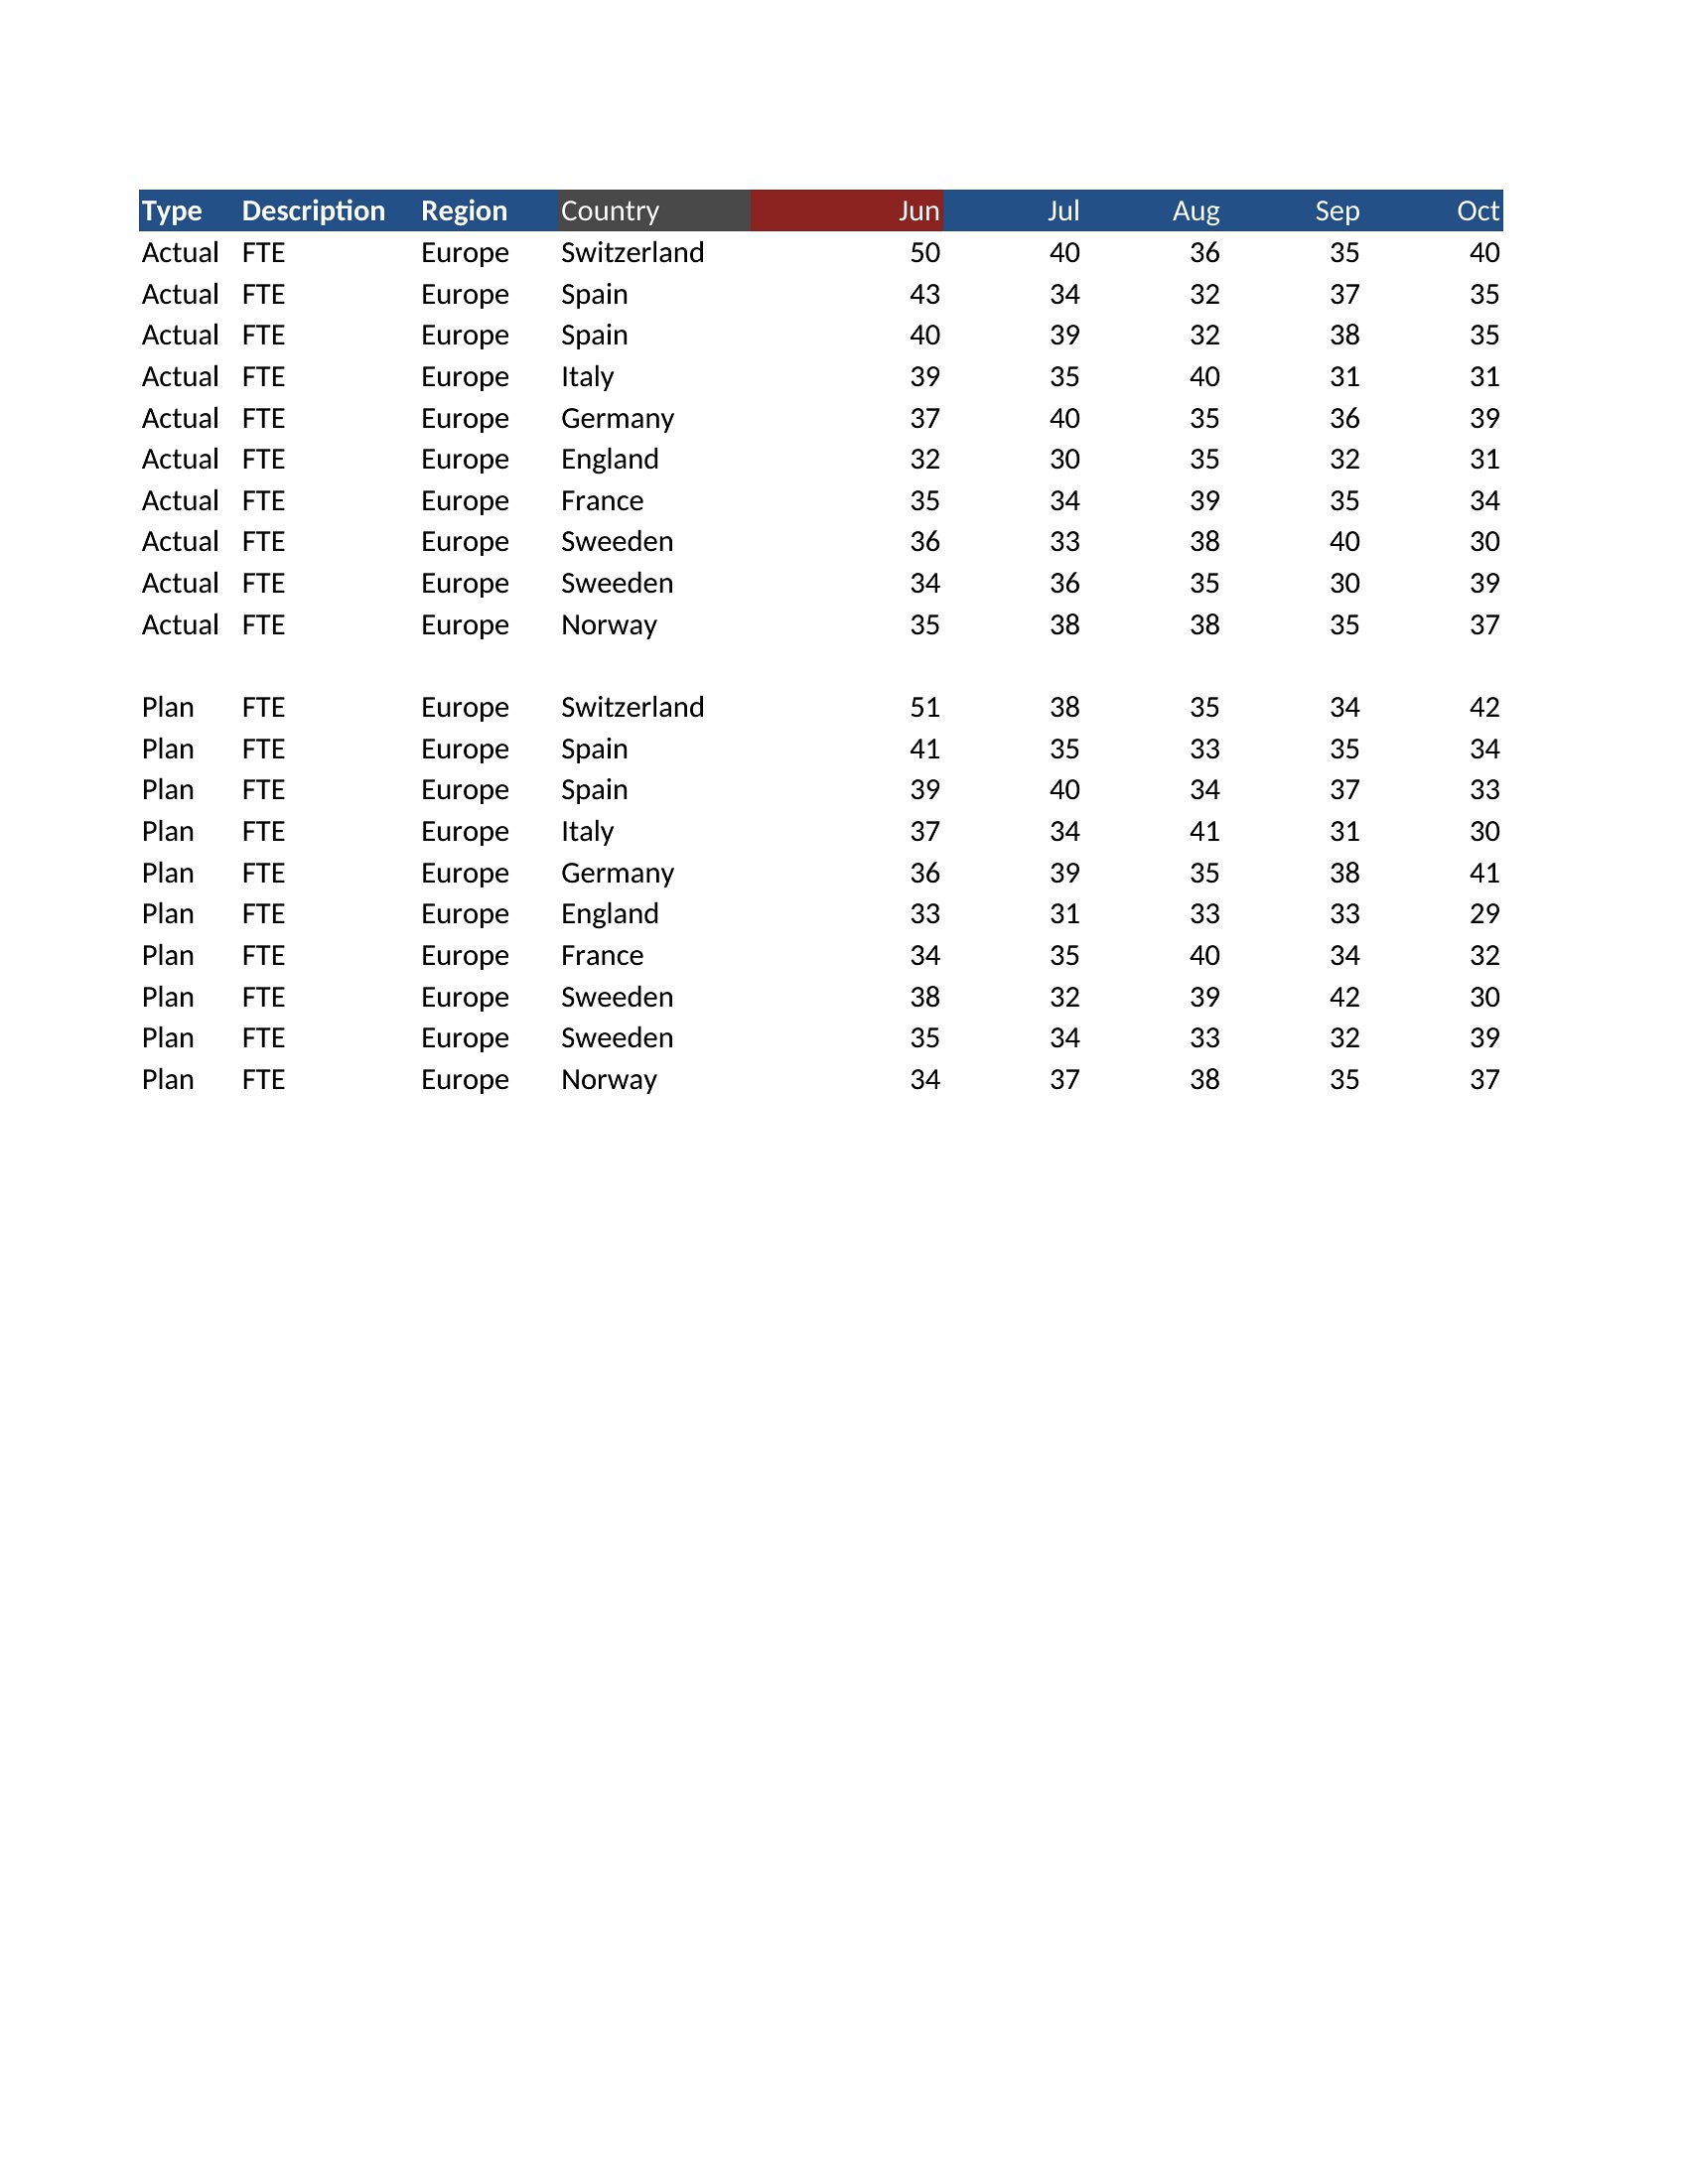
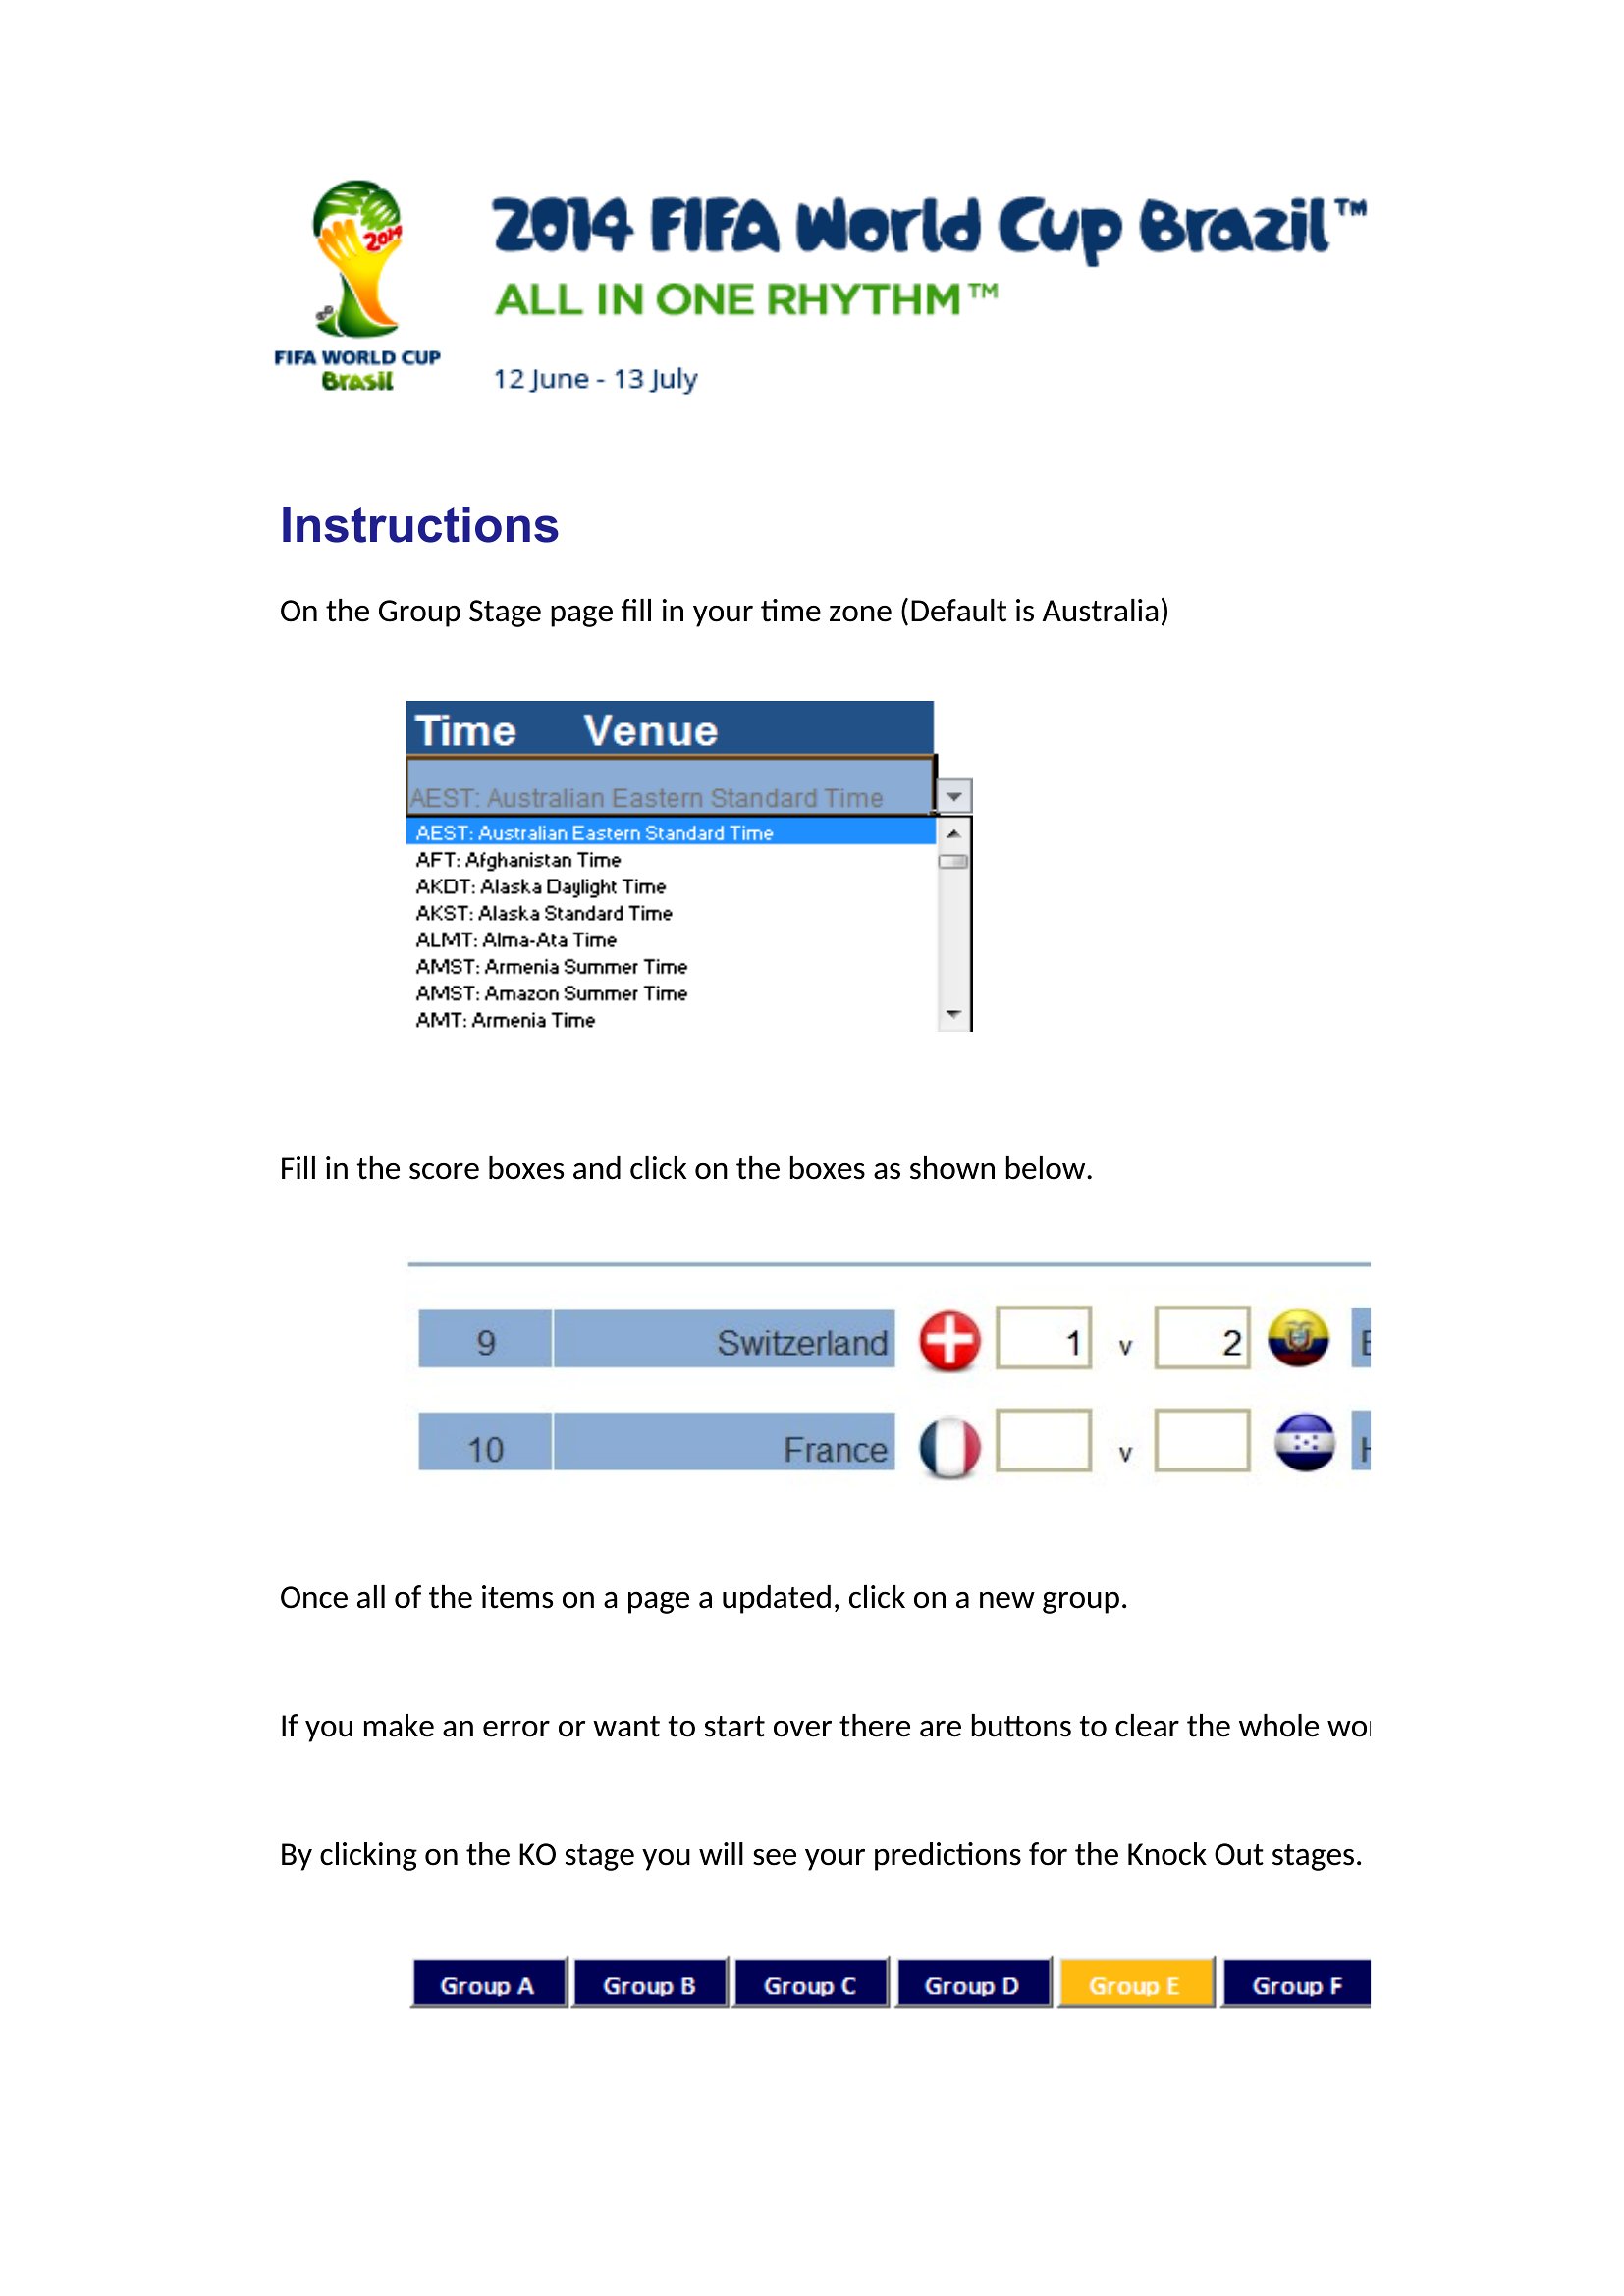
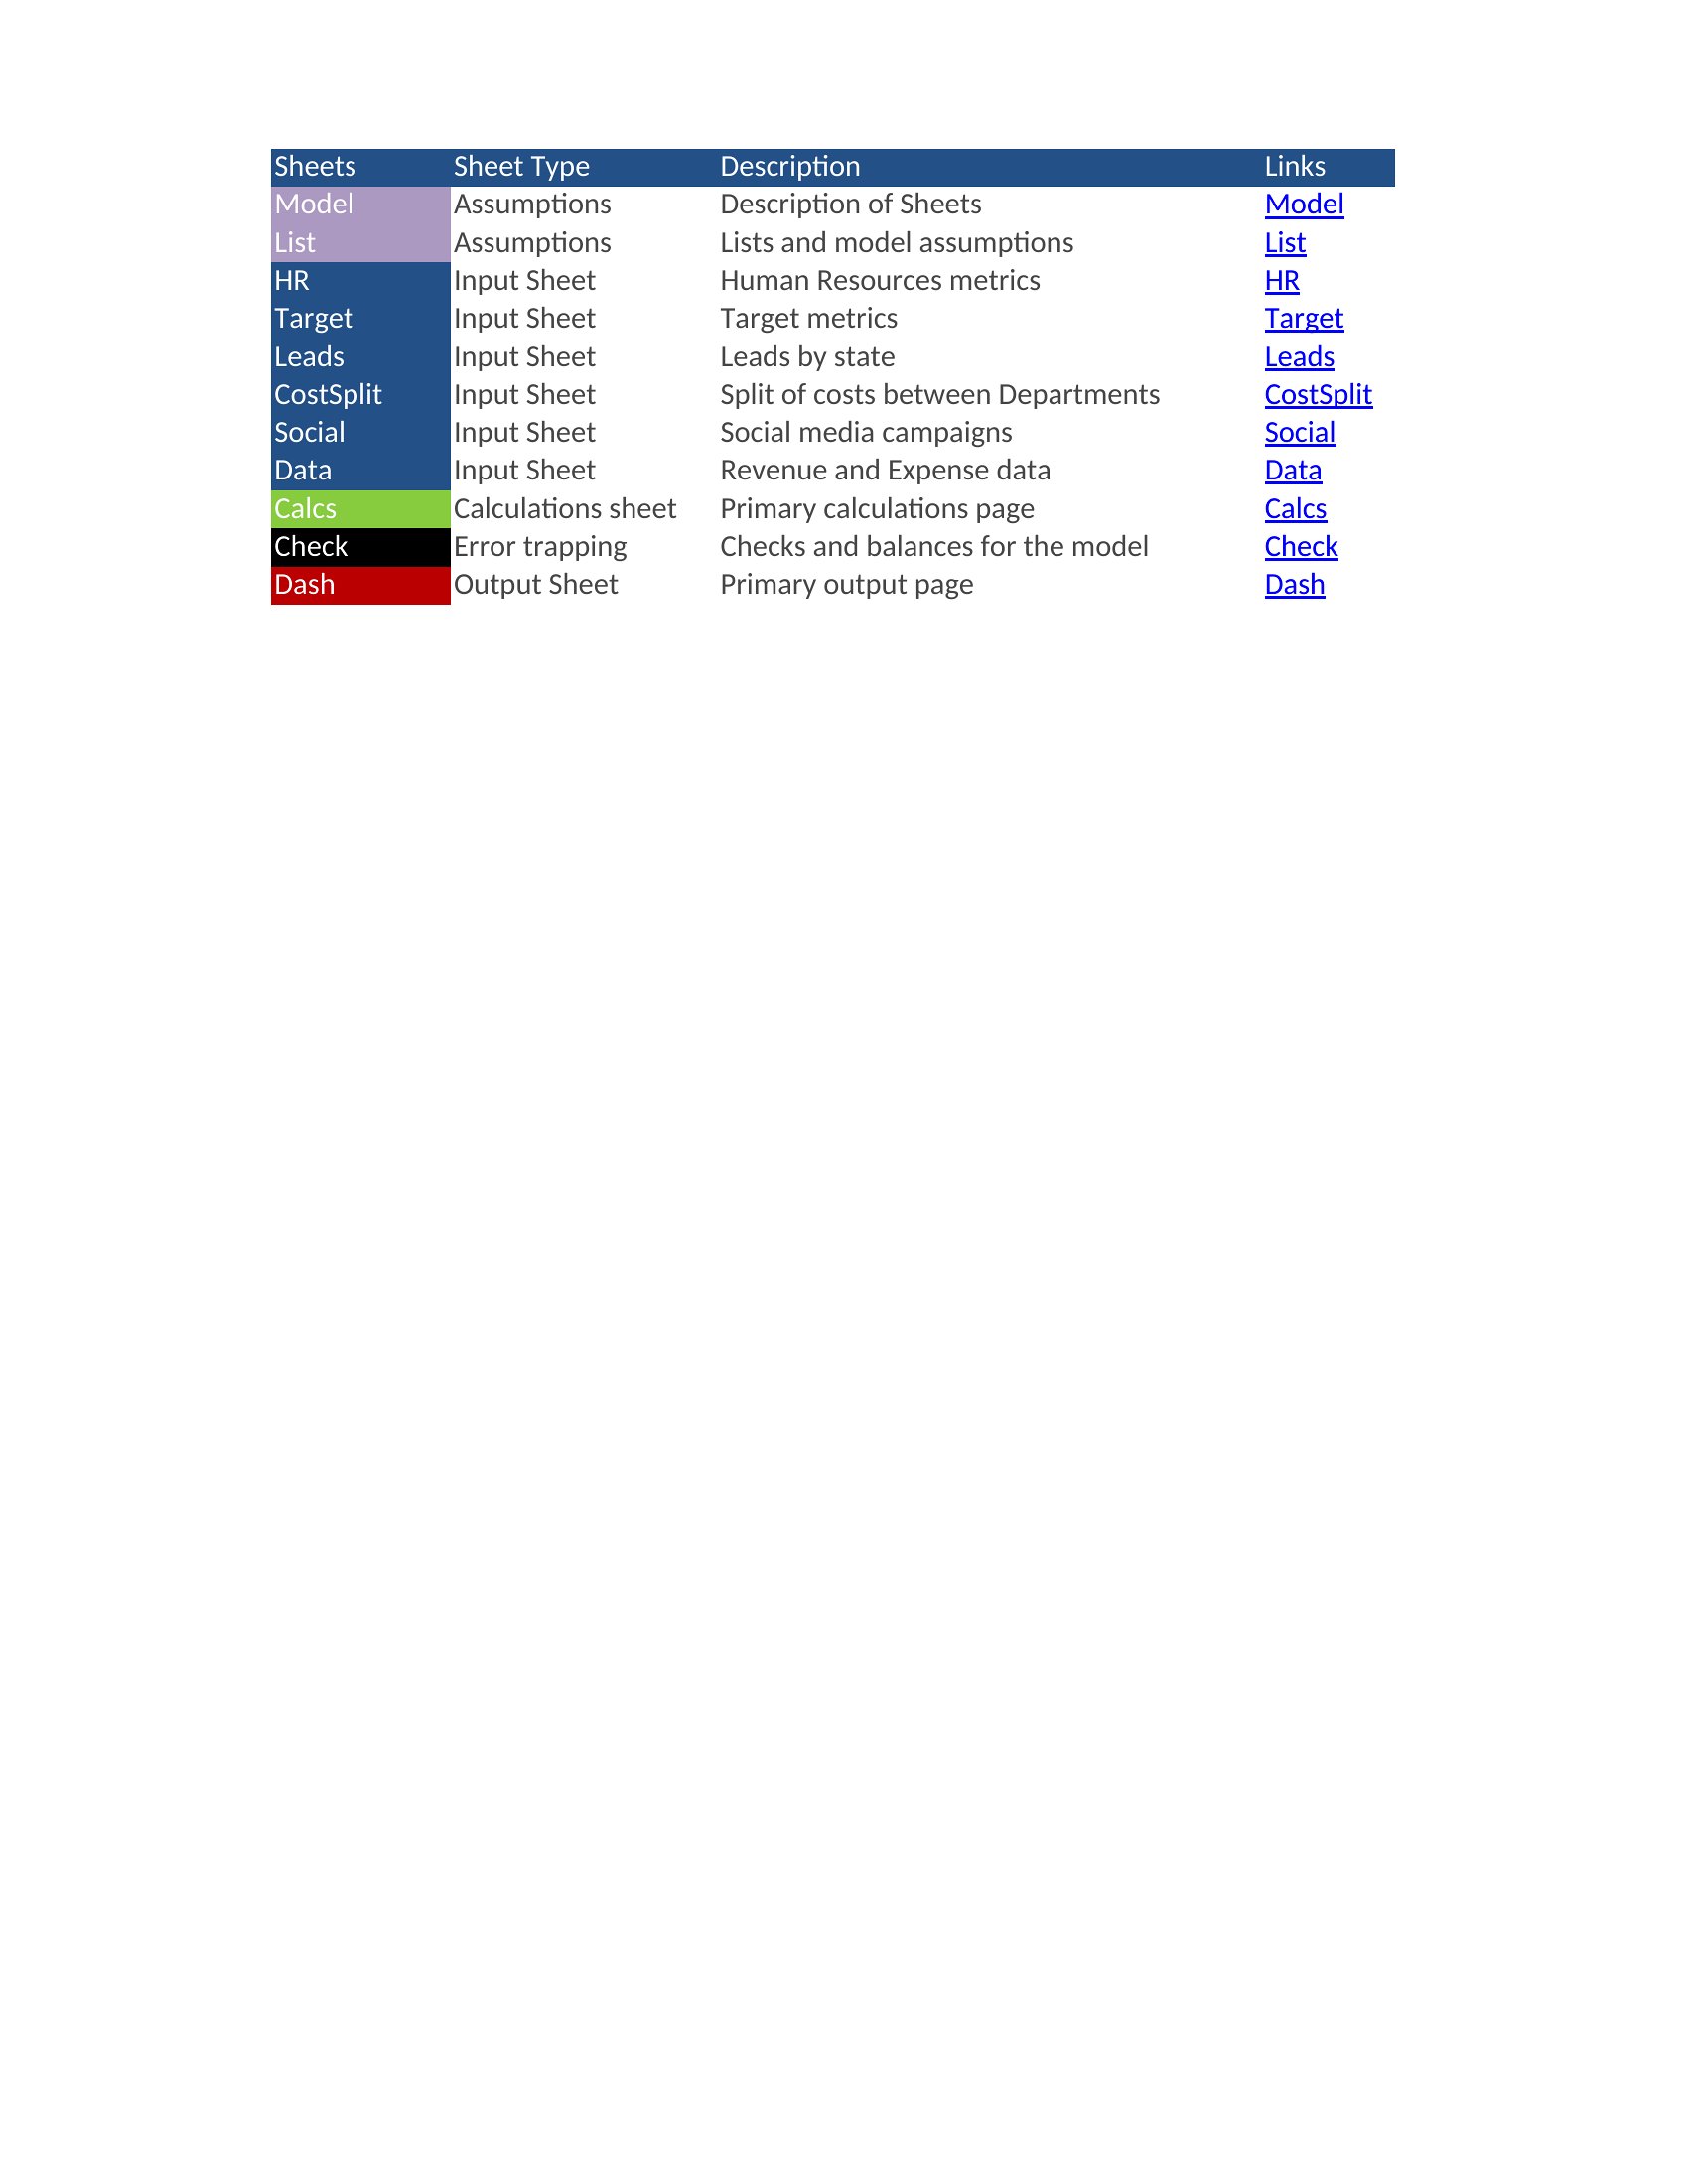
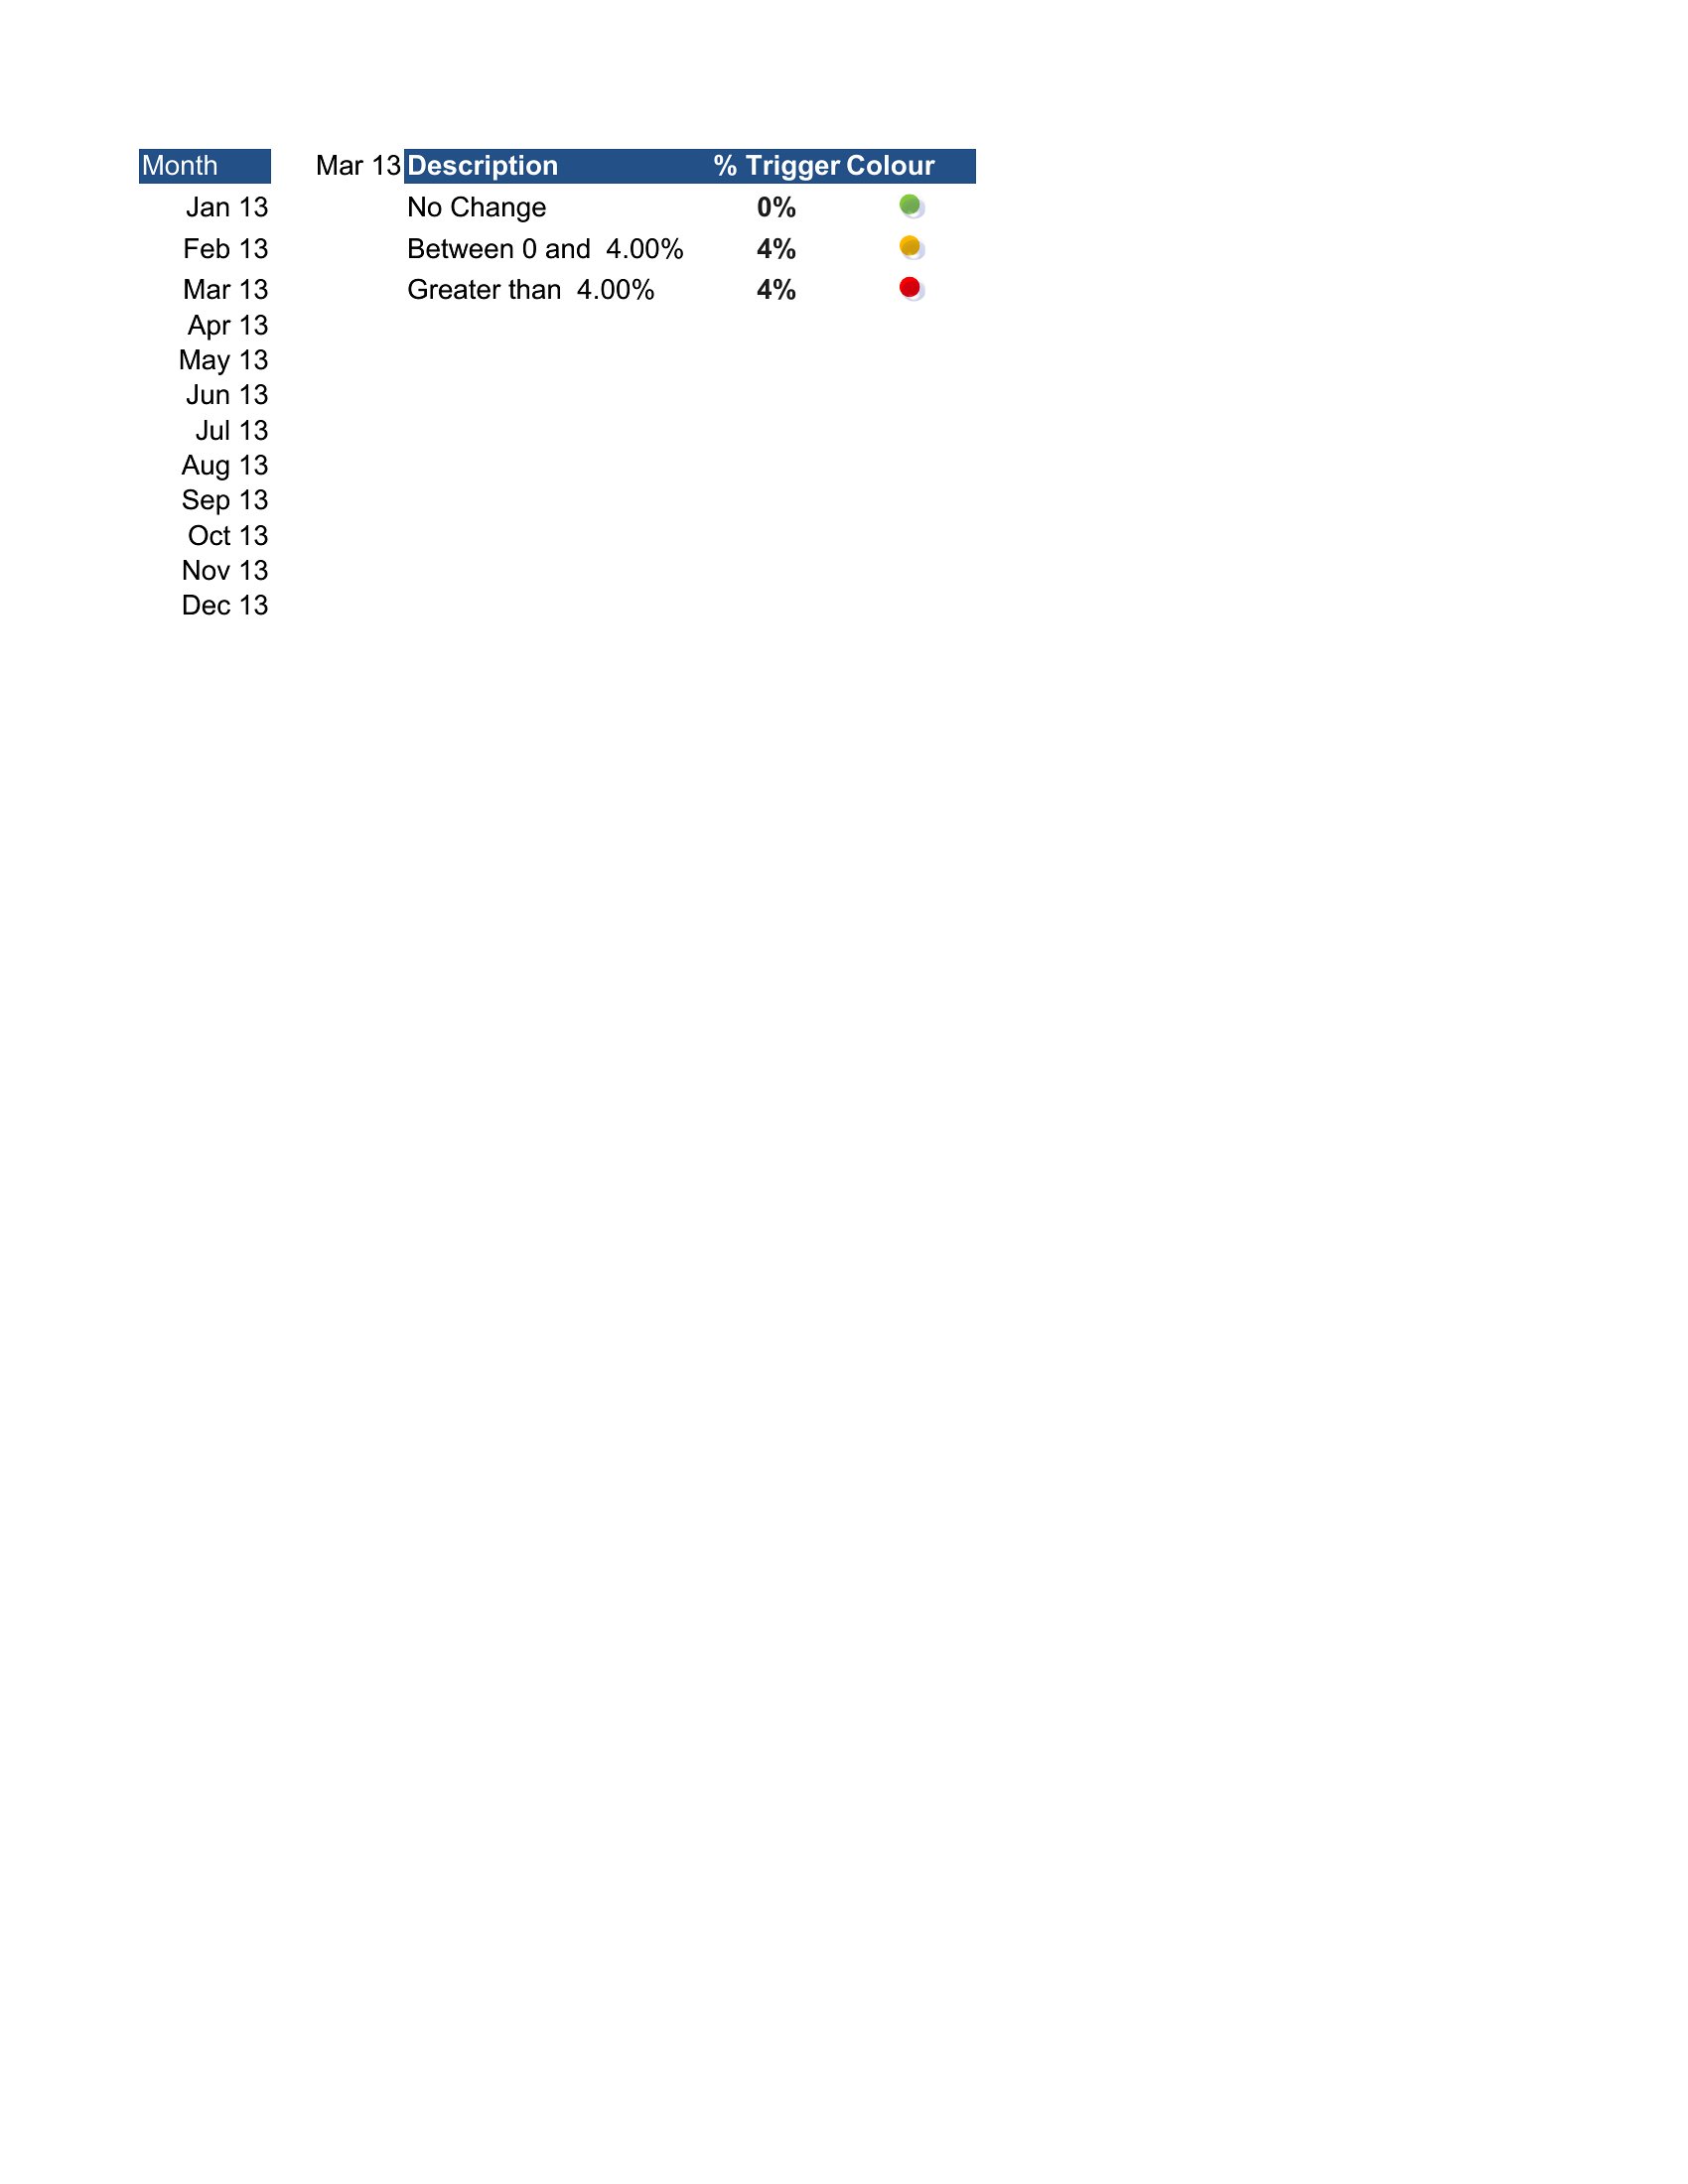
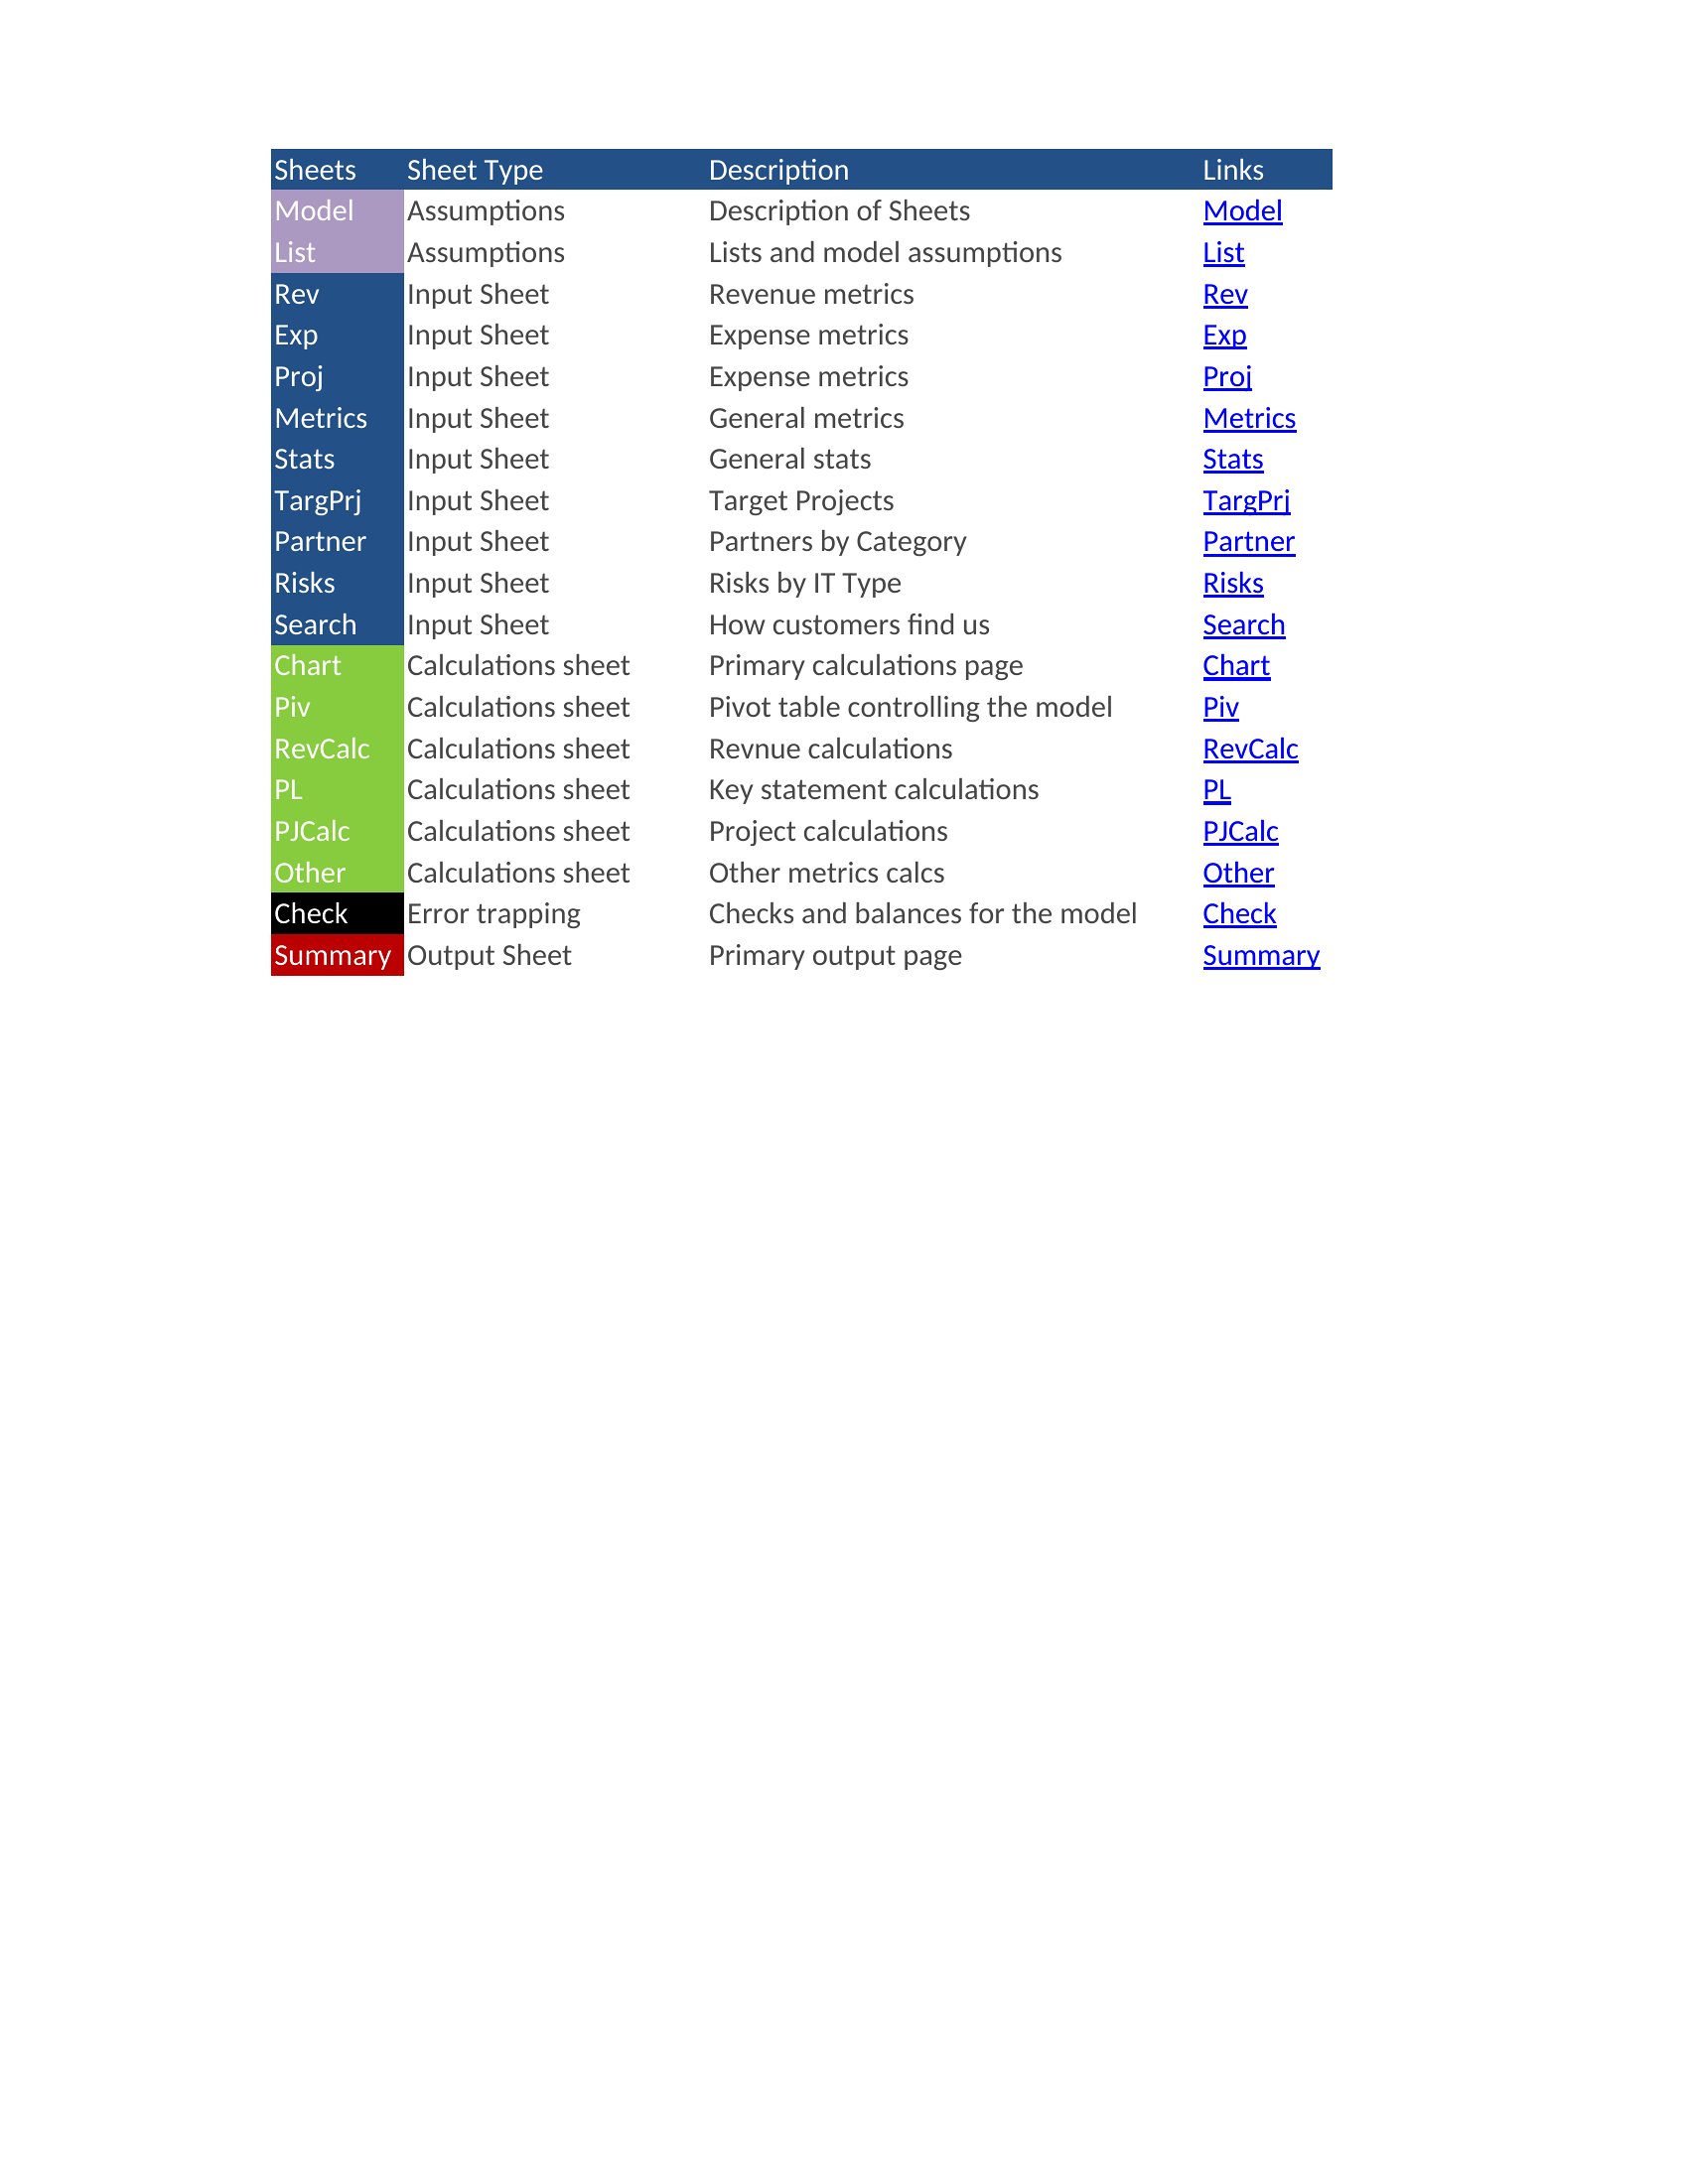

Dashboard Excel
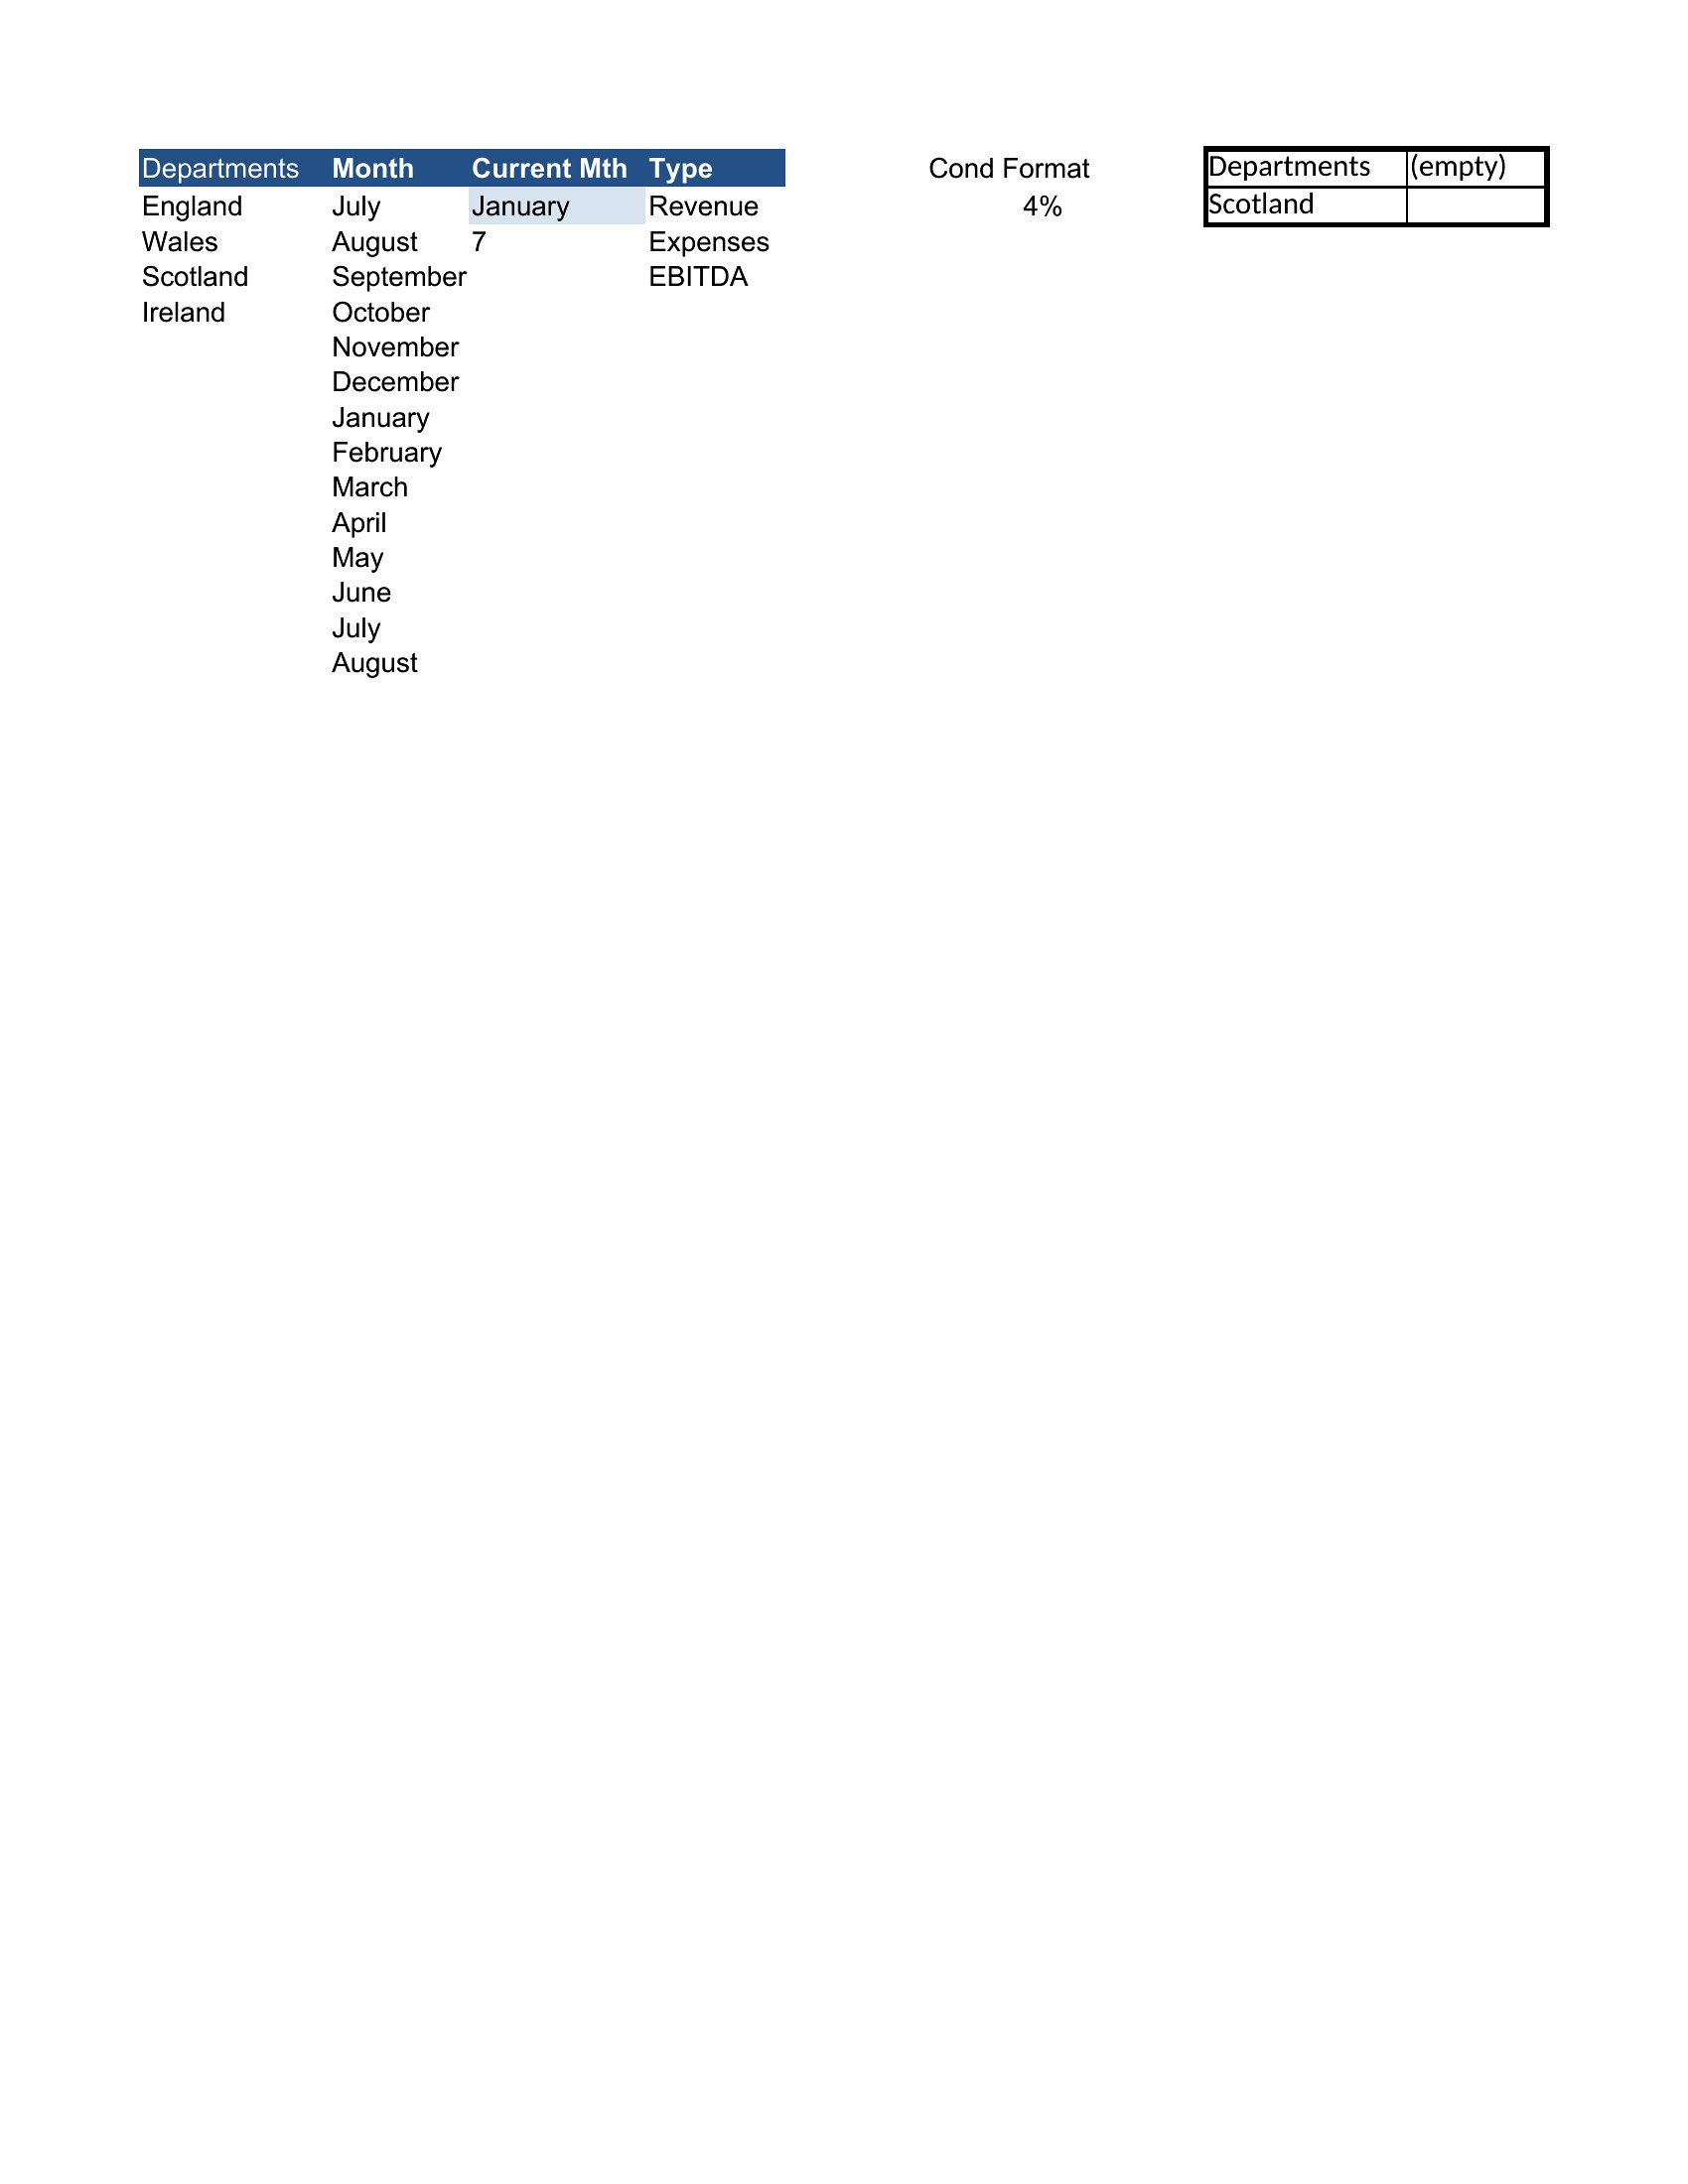
Dashboards Excel
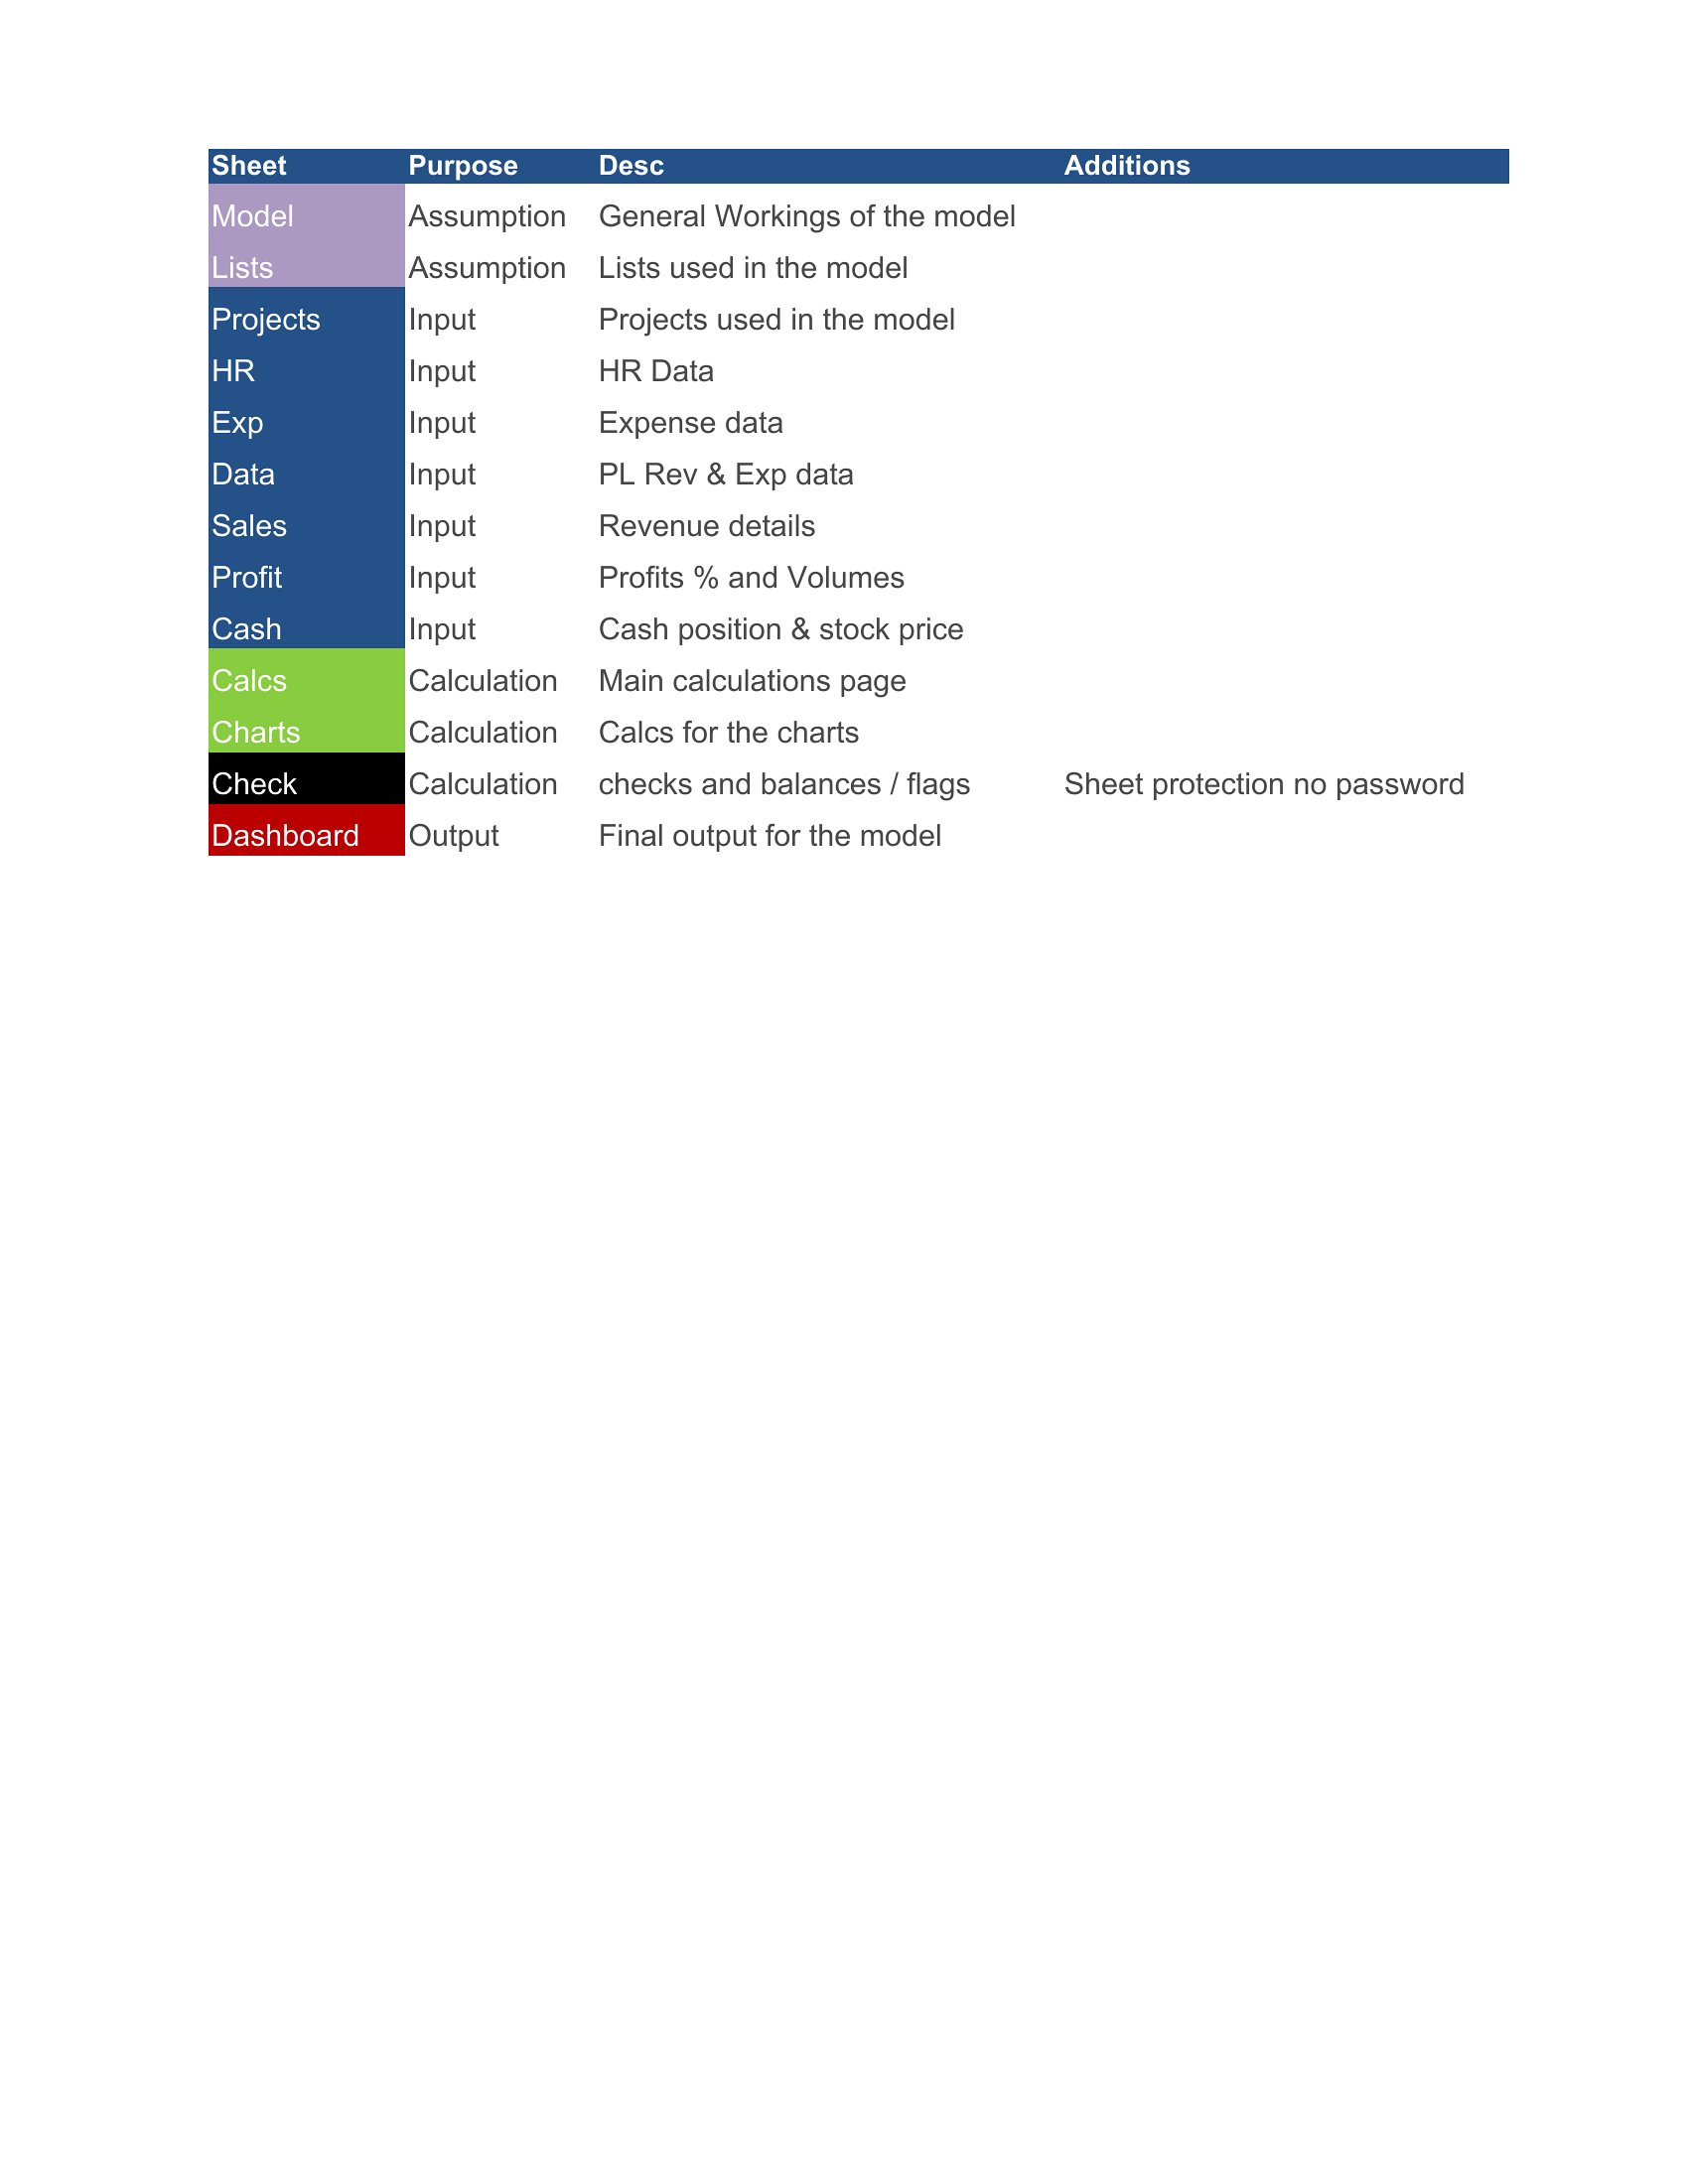
Excel Dashboard

How to use this Excel Dashboard template
Can these dashboards pull data from external sources like Google Sheets or a CRM?
Yes, but setup varies by template. Some include pre-built connections for tools like Google Sheets or require Power Query to link to databases or APIs. Check the template’s description for compatibility notes. For CRMs like Salesforce, you’ll typically need to export data first or use Excel’s Get Data feature.
How do I adjust the KPI thresholds or color-coding in the templates?
Most templates use conditional formatting or simple IF formulas tied to cell values. Open the ‘Settings’ or ‘Config’ sheet (if included) to modify thresholds, or edit the underlying formula in the chart data range. For dynamic ranges, ensure your data source names match exactly. Save a backup copy before experimenting.
What’s the best way to share these dashboards with stakeholders who don’t use Excel?
Export the dashboard as a static PDF for one-time reviews or use Excel Online to share a read-only link. For interactive access, save the file to OneDrive/SharePoint and set permissions. Note that shared users won’t see real-time updates unless the file is re-opened with fresh data. Consider exporting key charts as PNGs for presentations.
Comments
Join the conversation
Sign in to share your thoughts and leave a comment on this resource.