FAQ
What is an oil tank chart and how does it work?
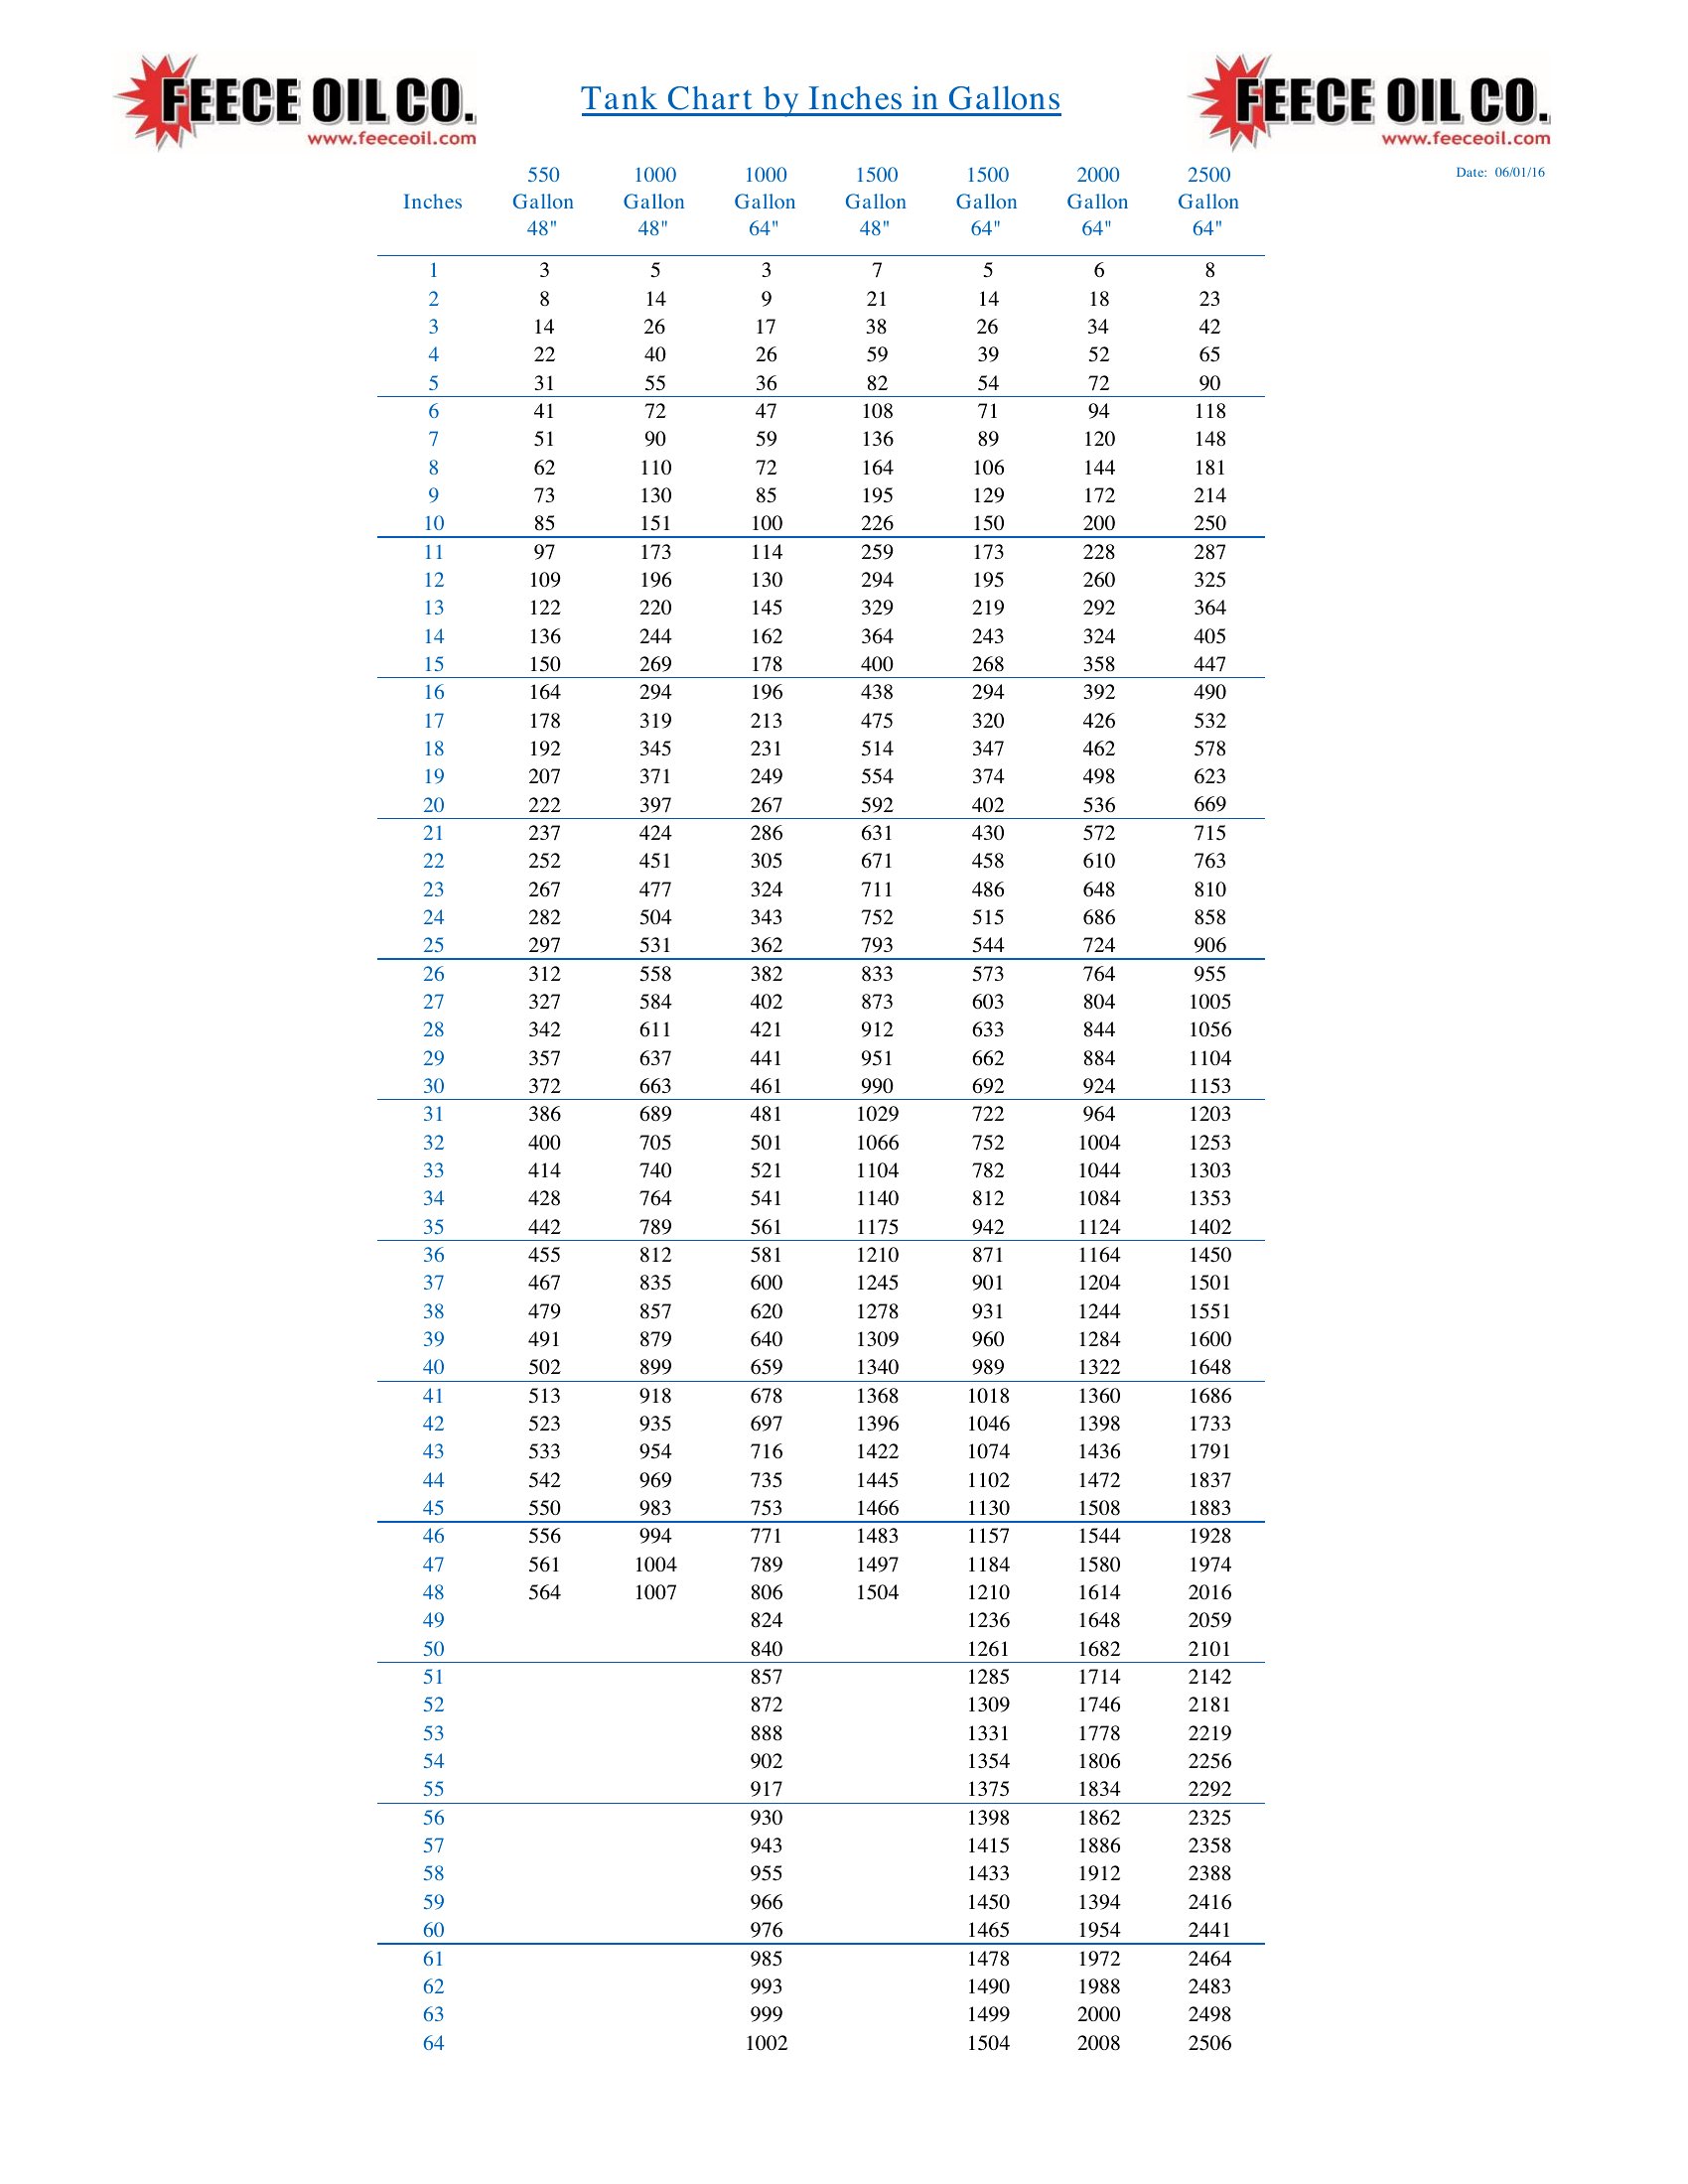
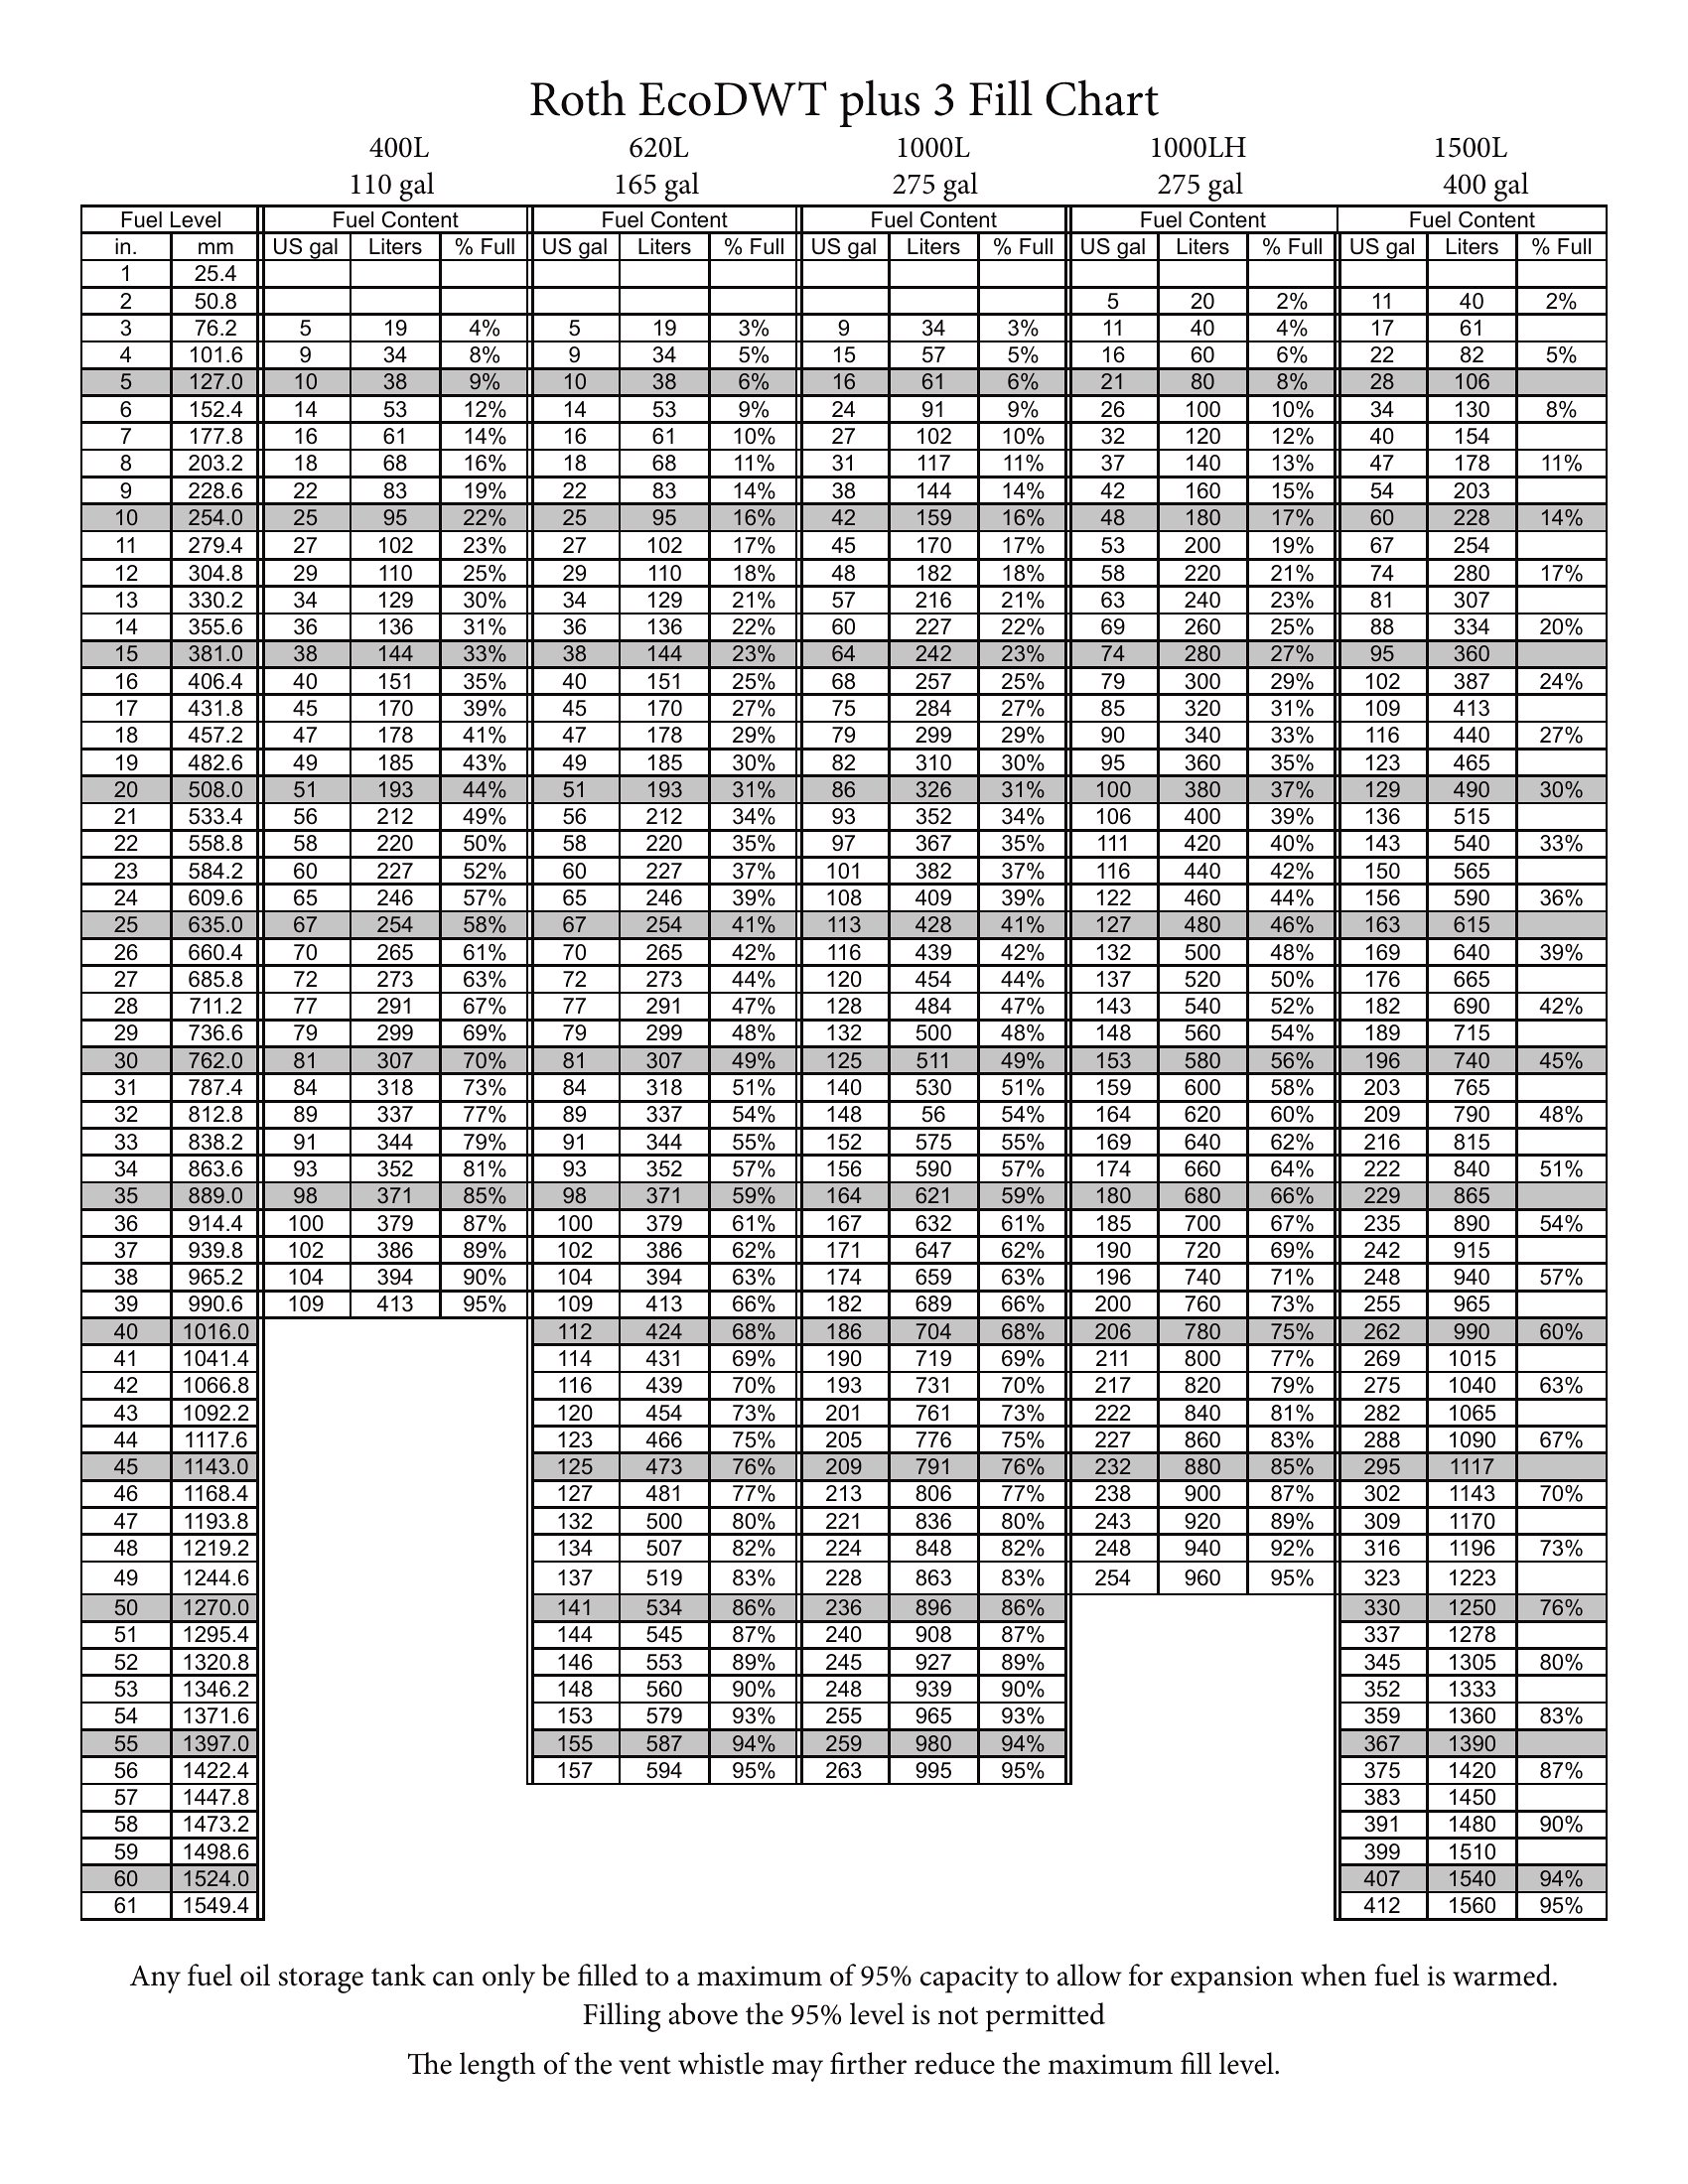
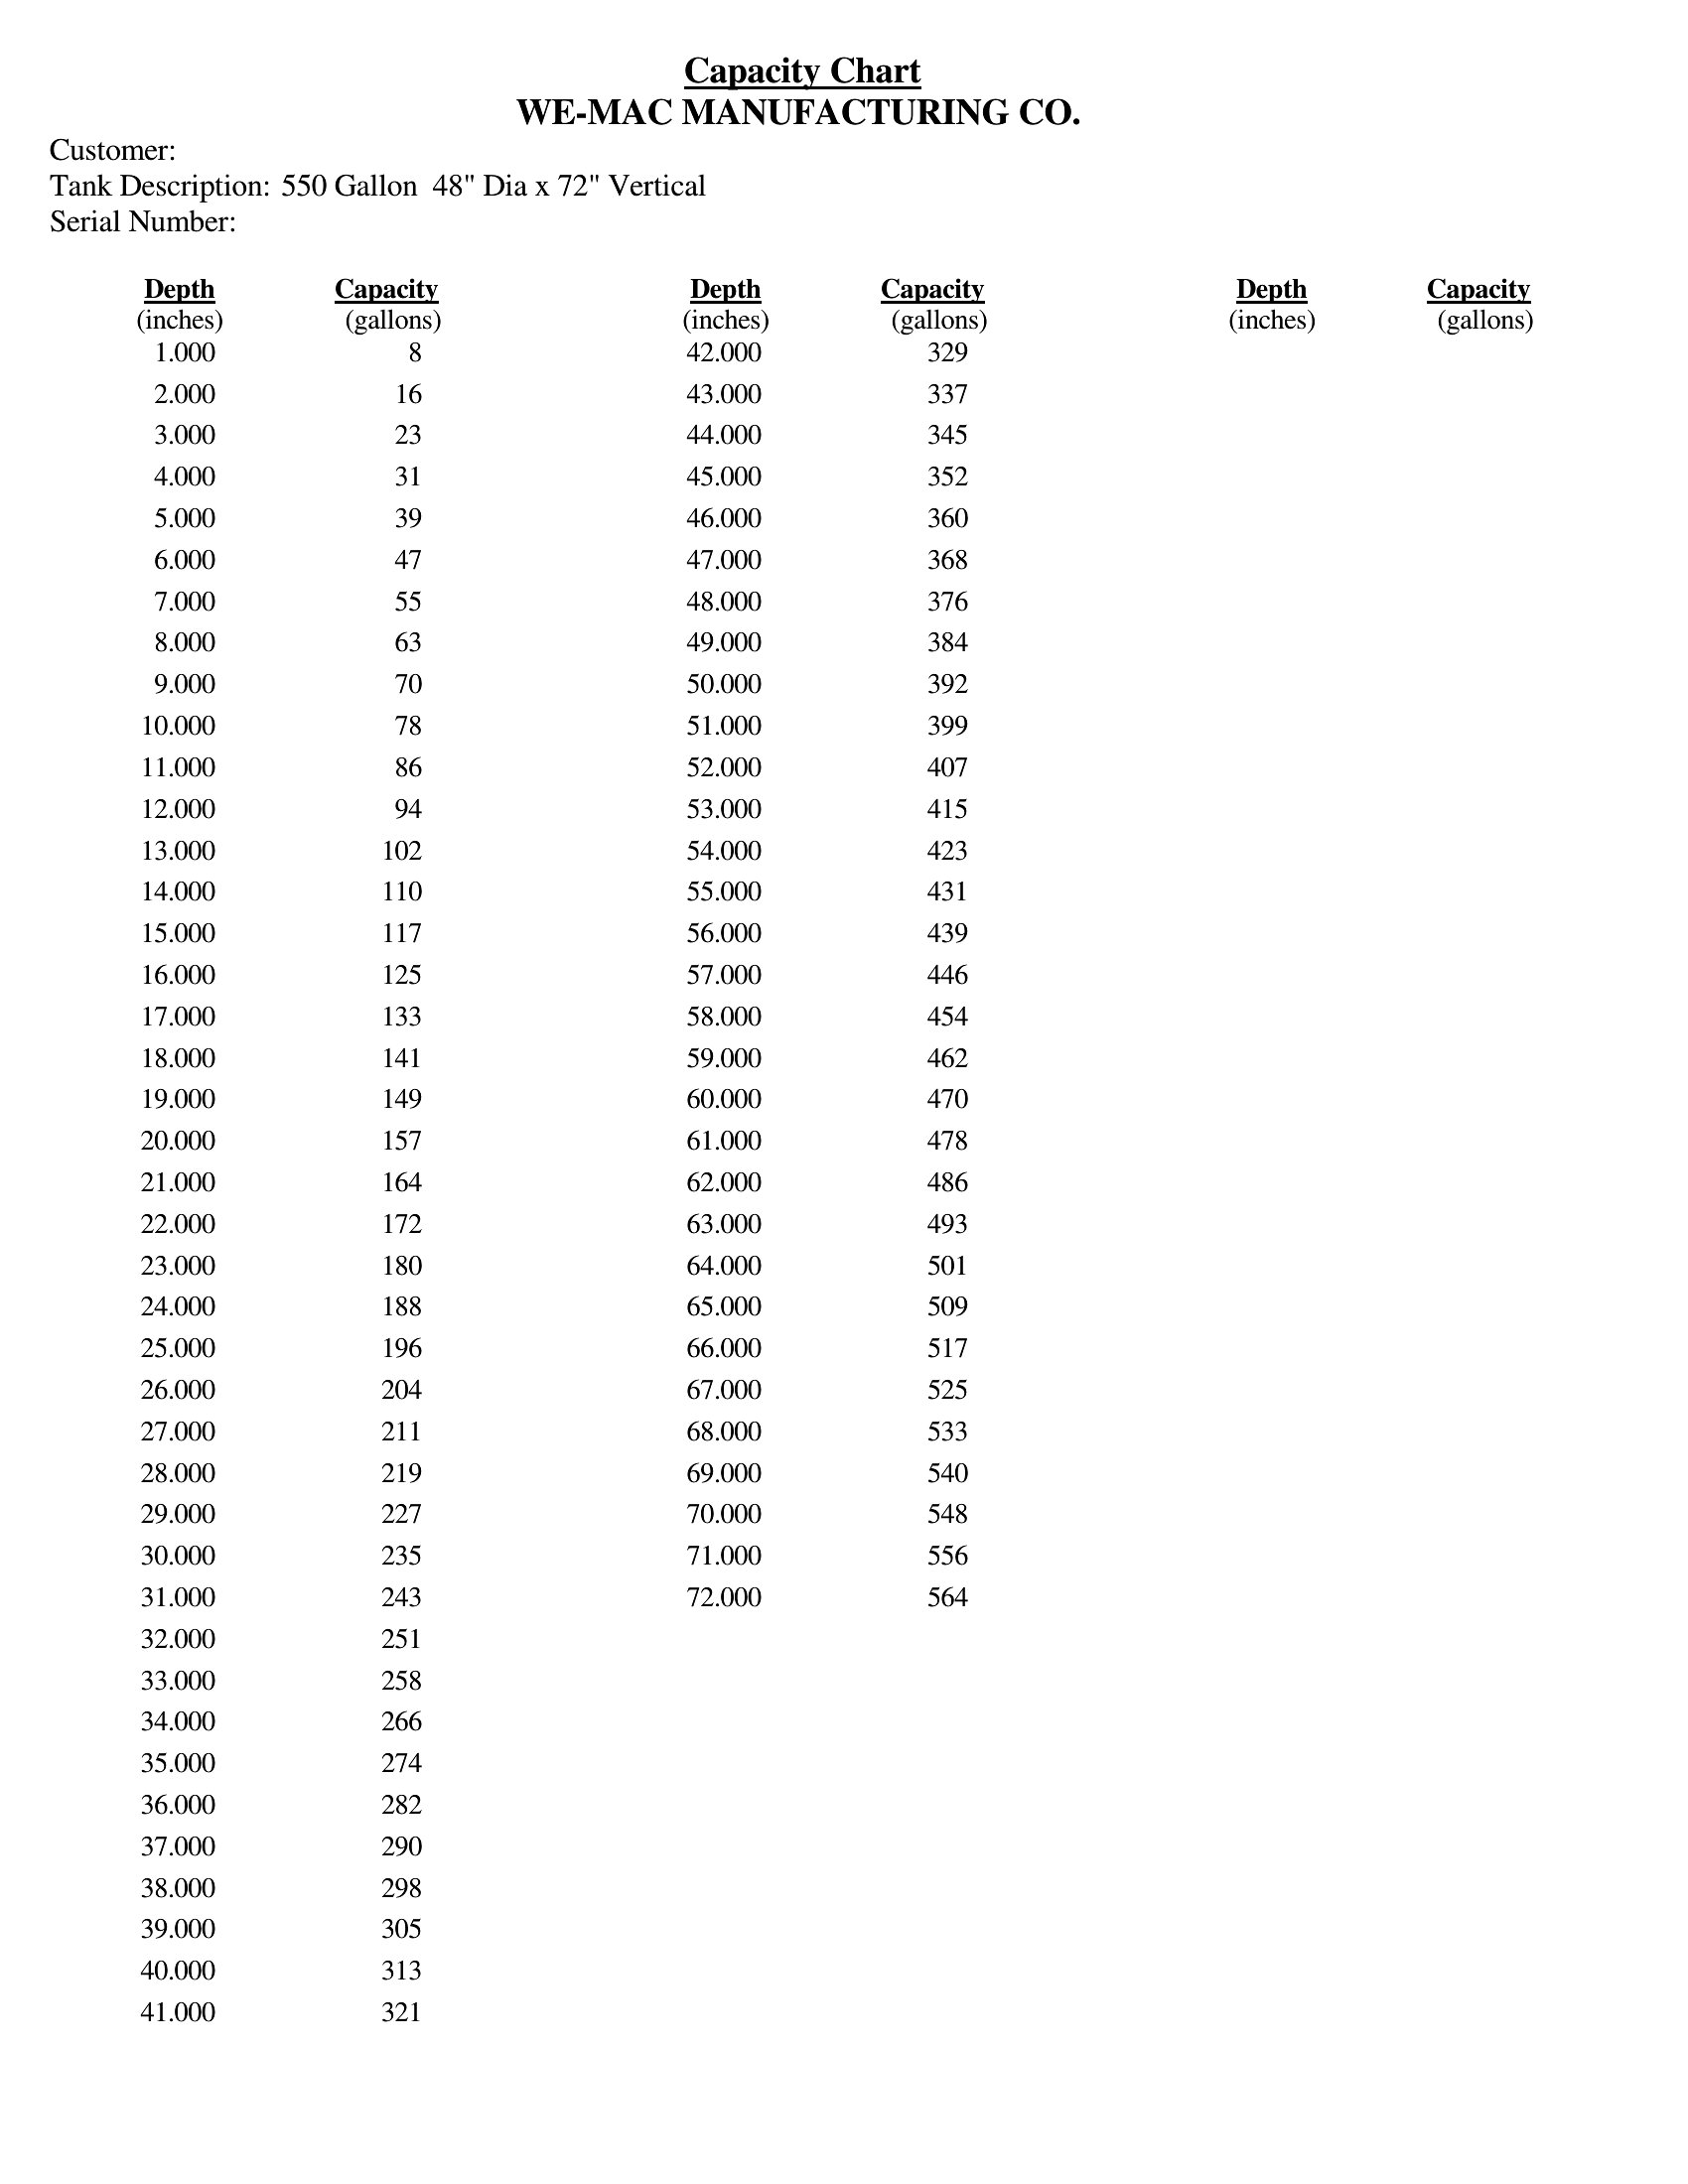
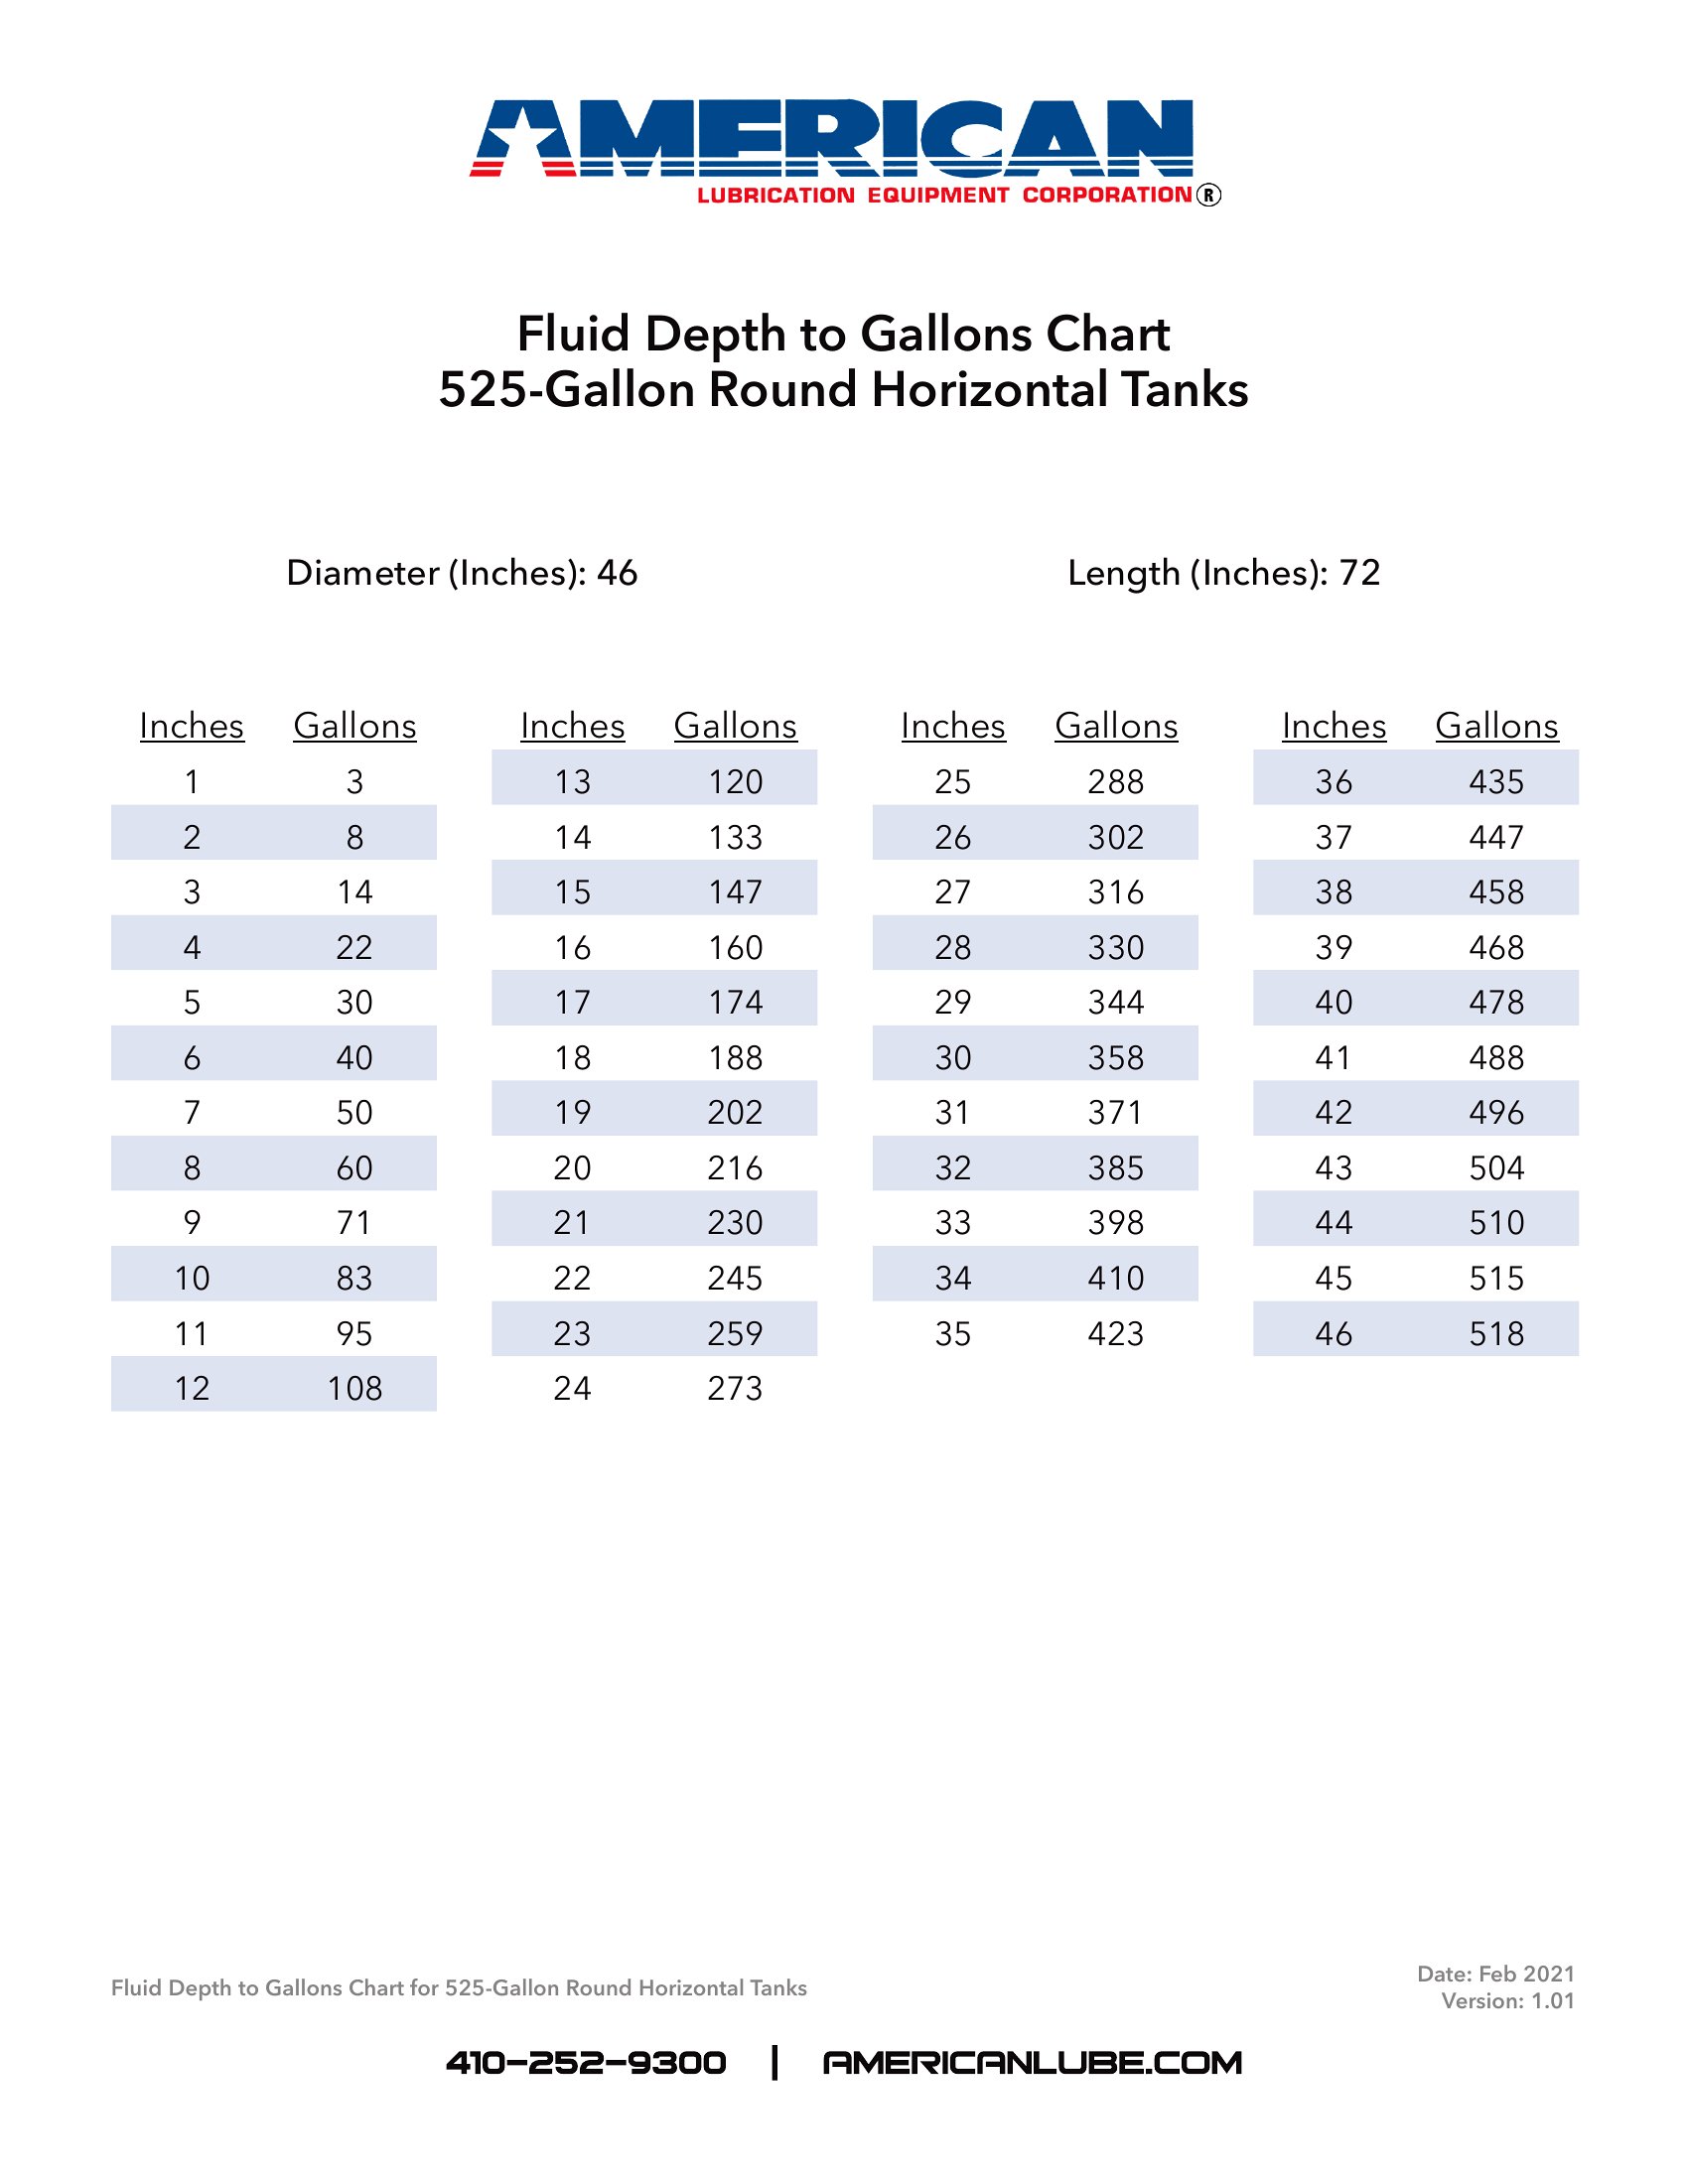
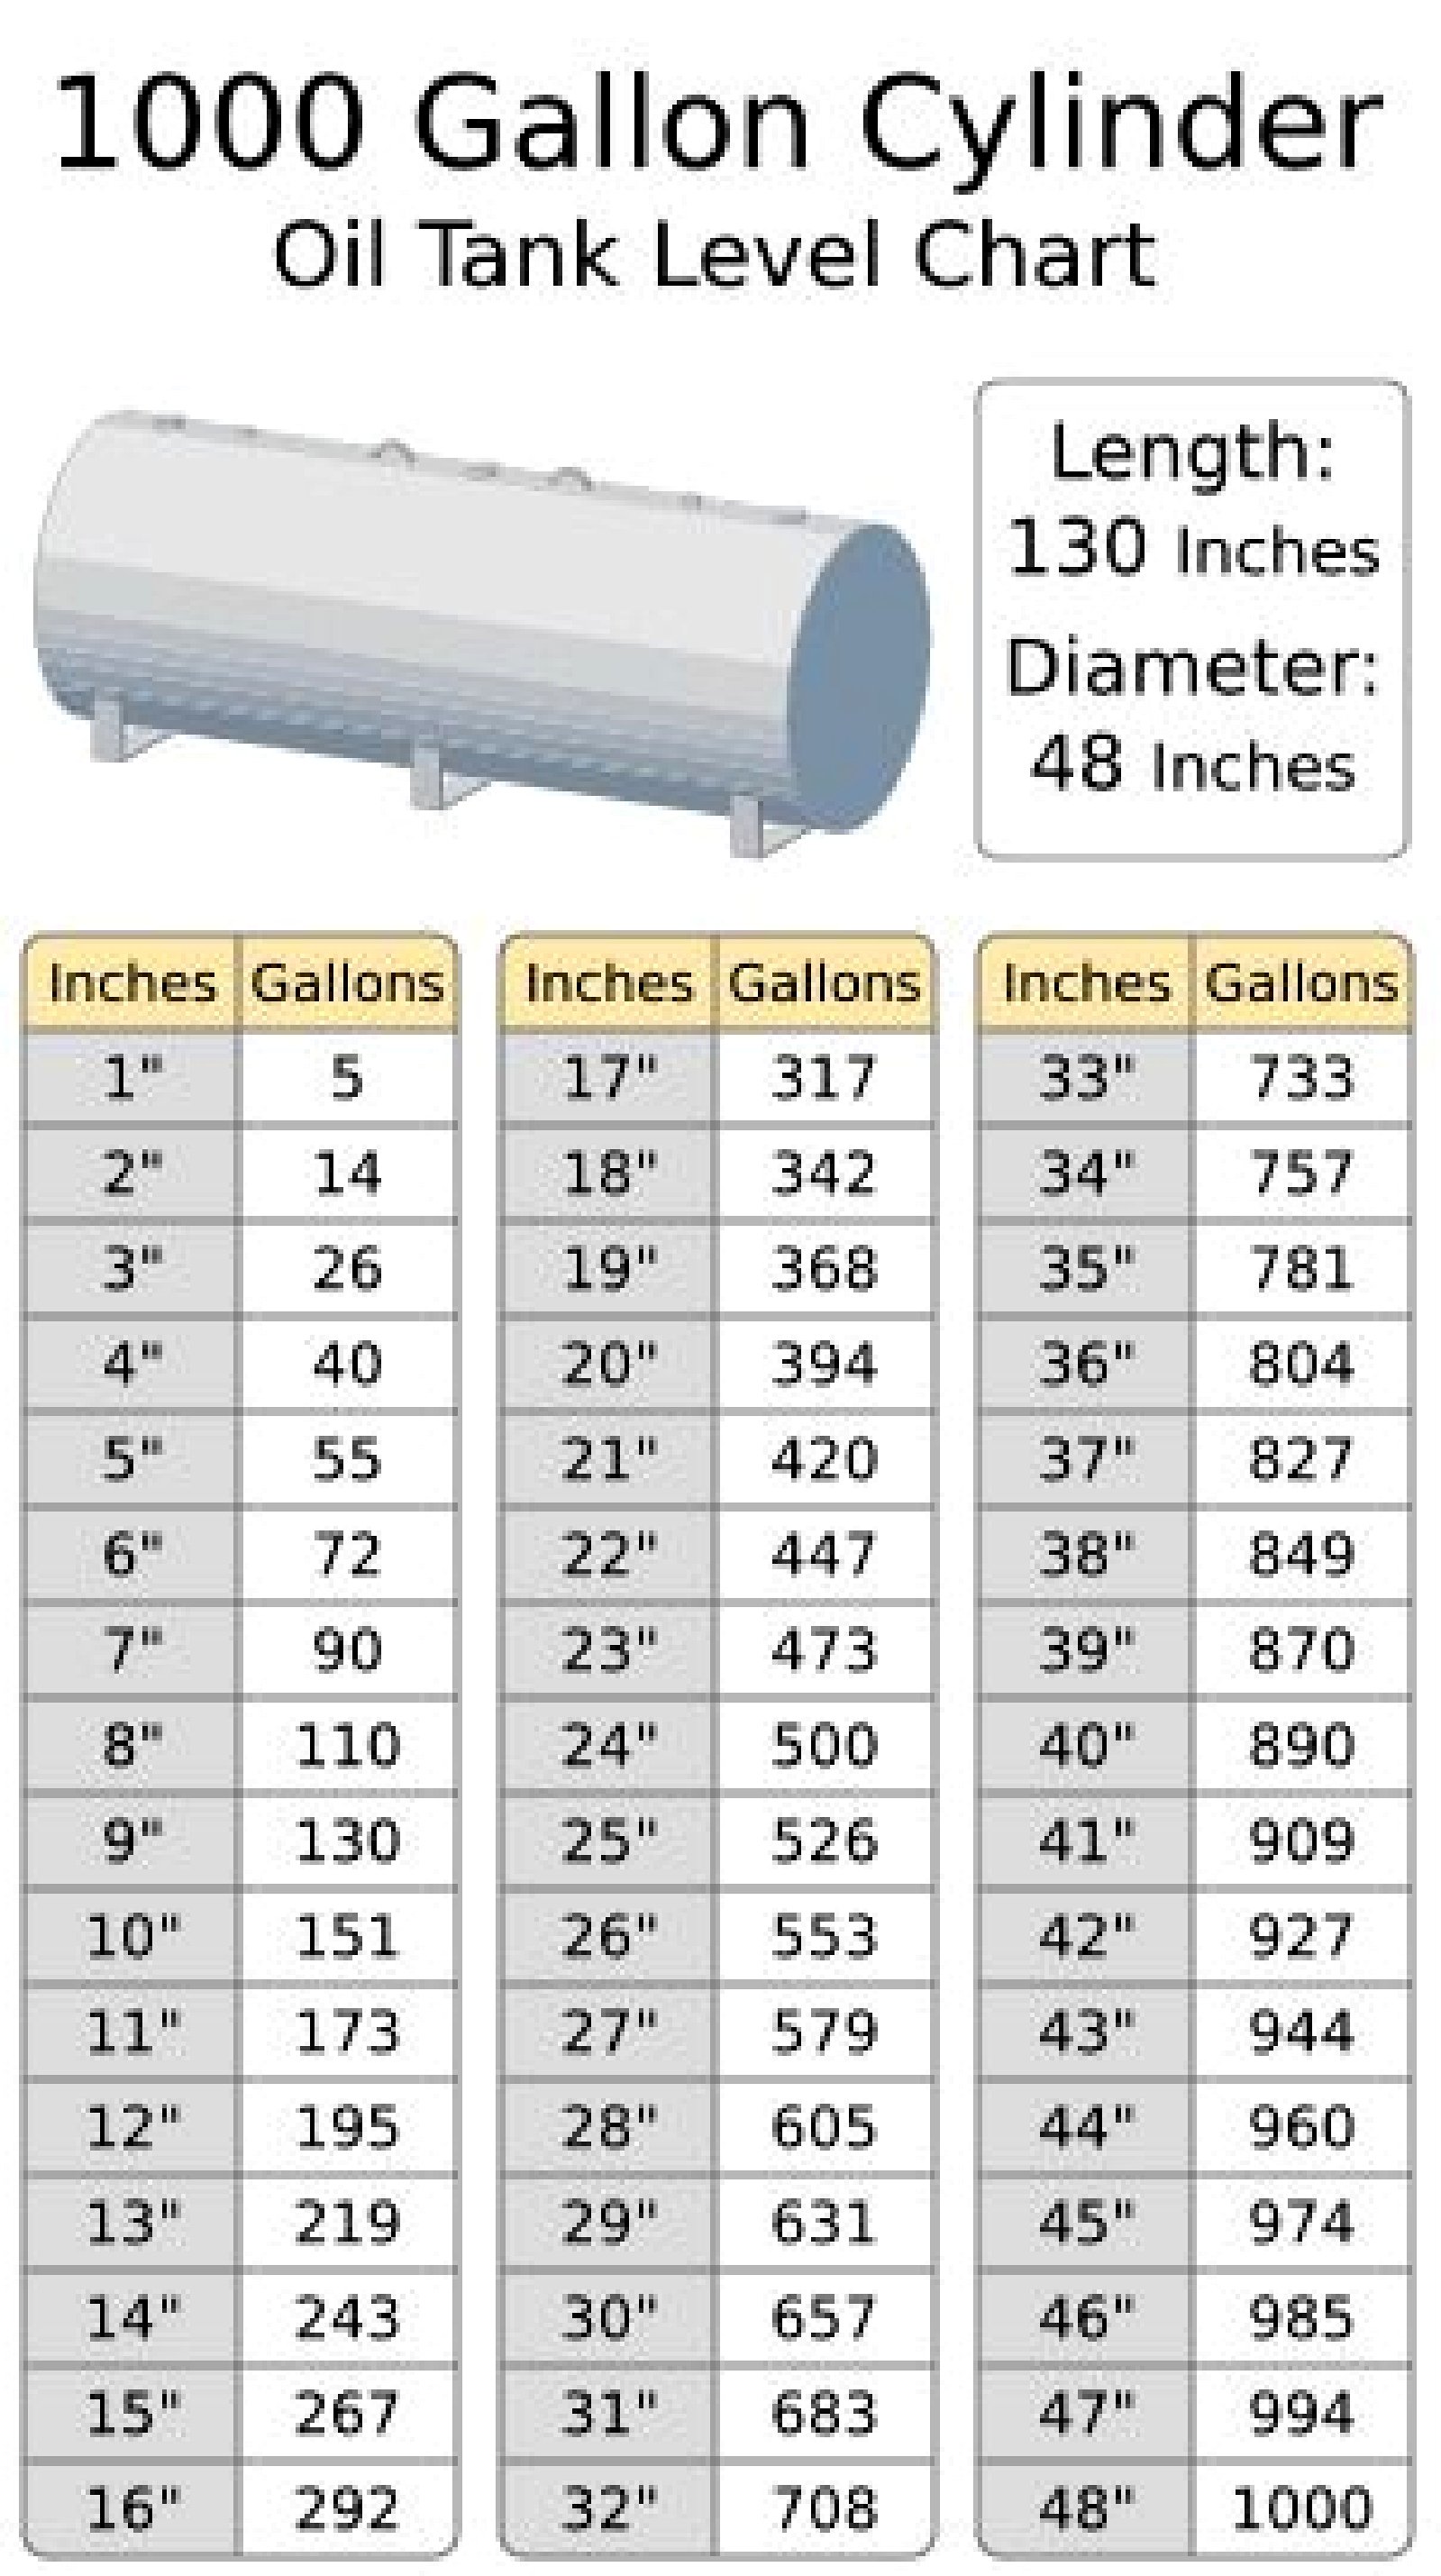
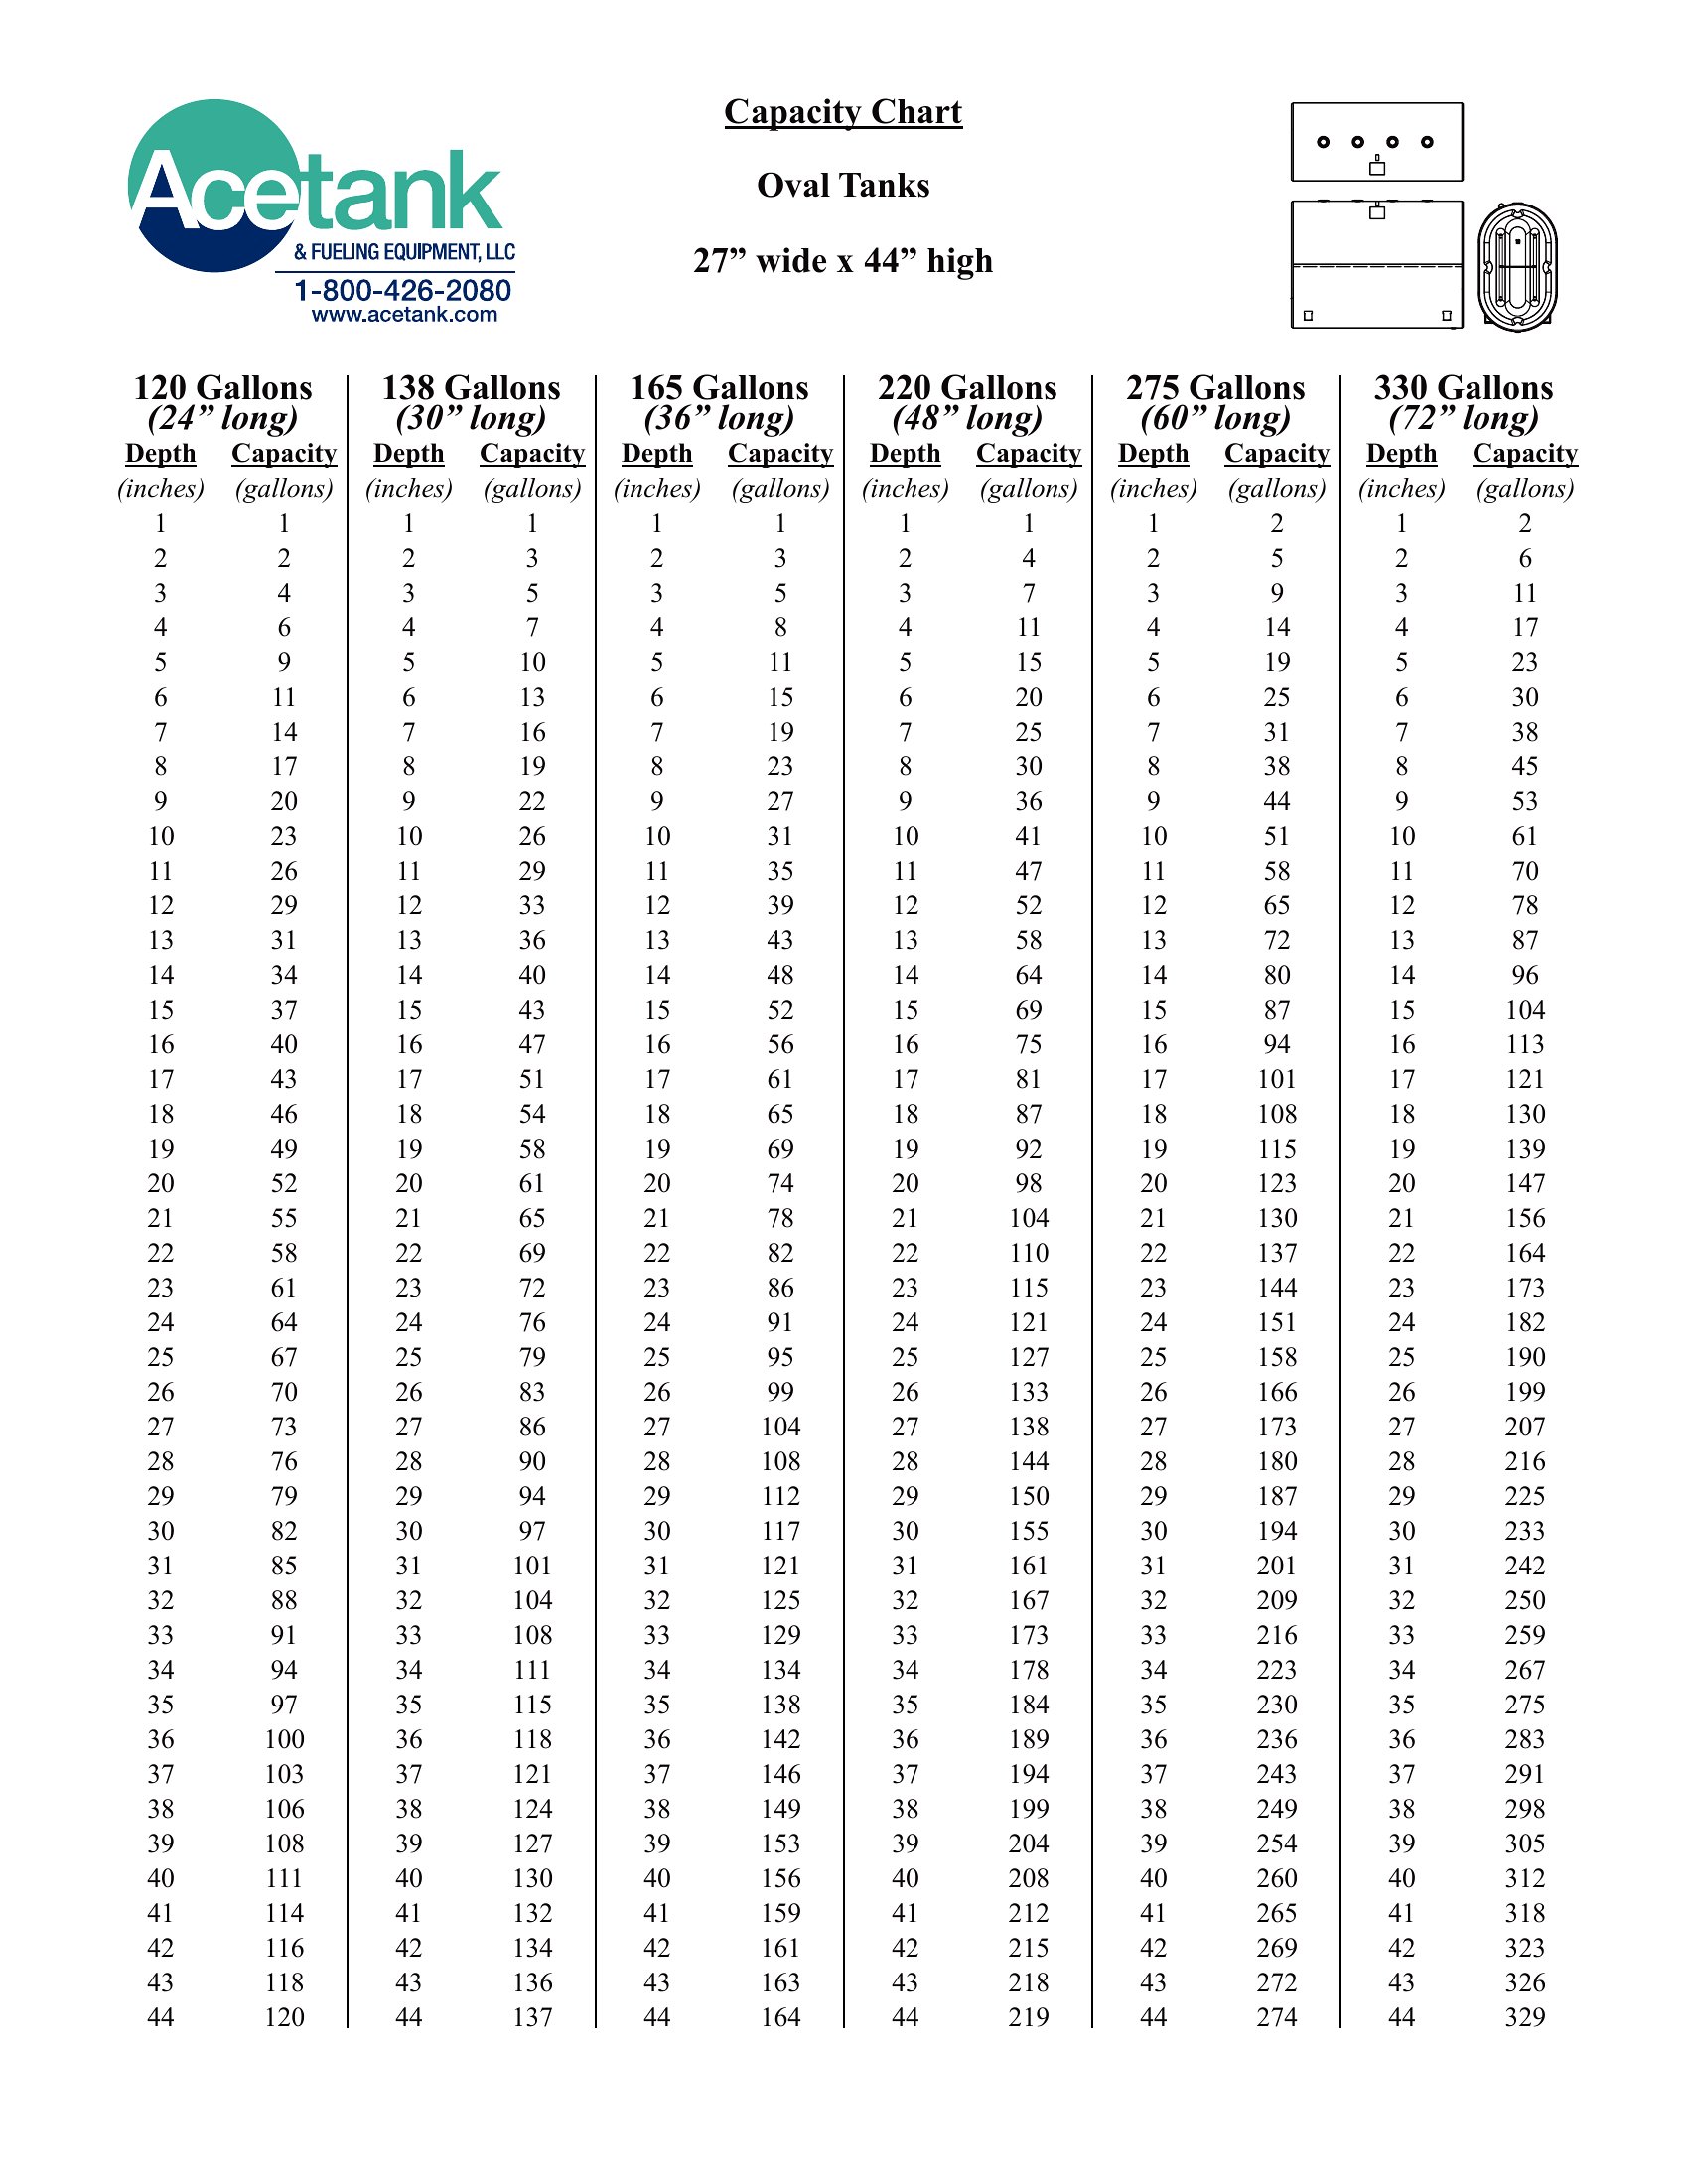
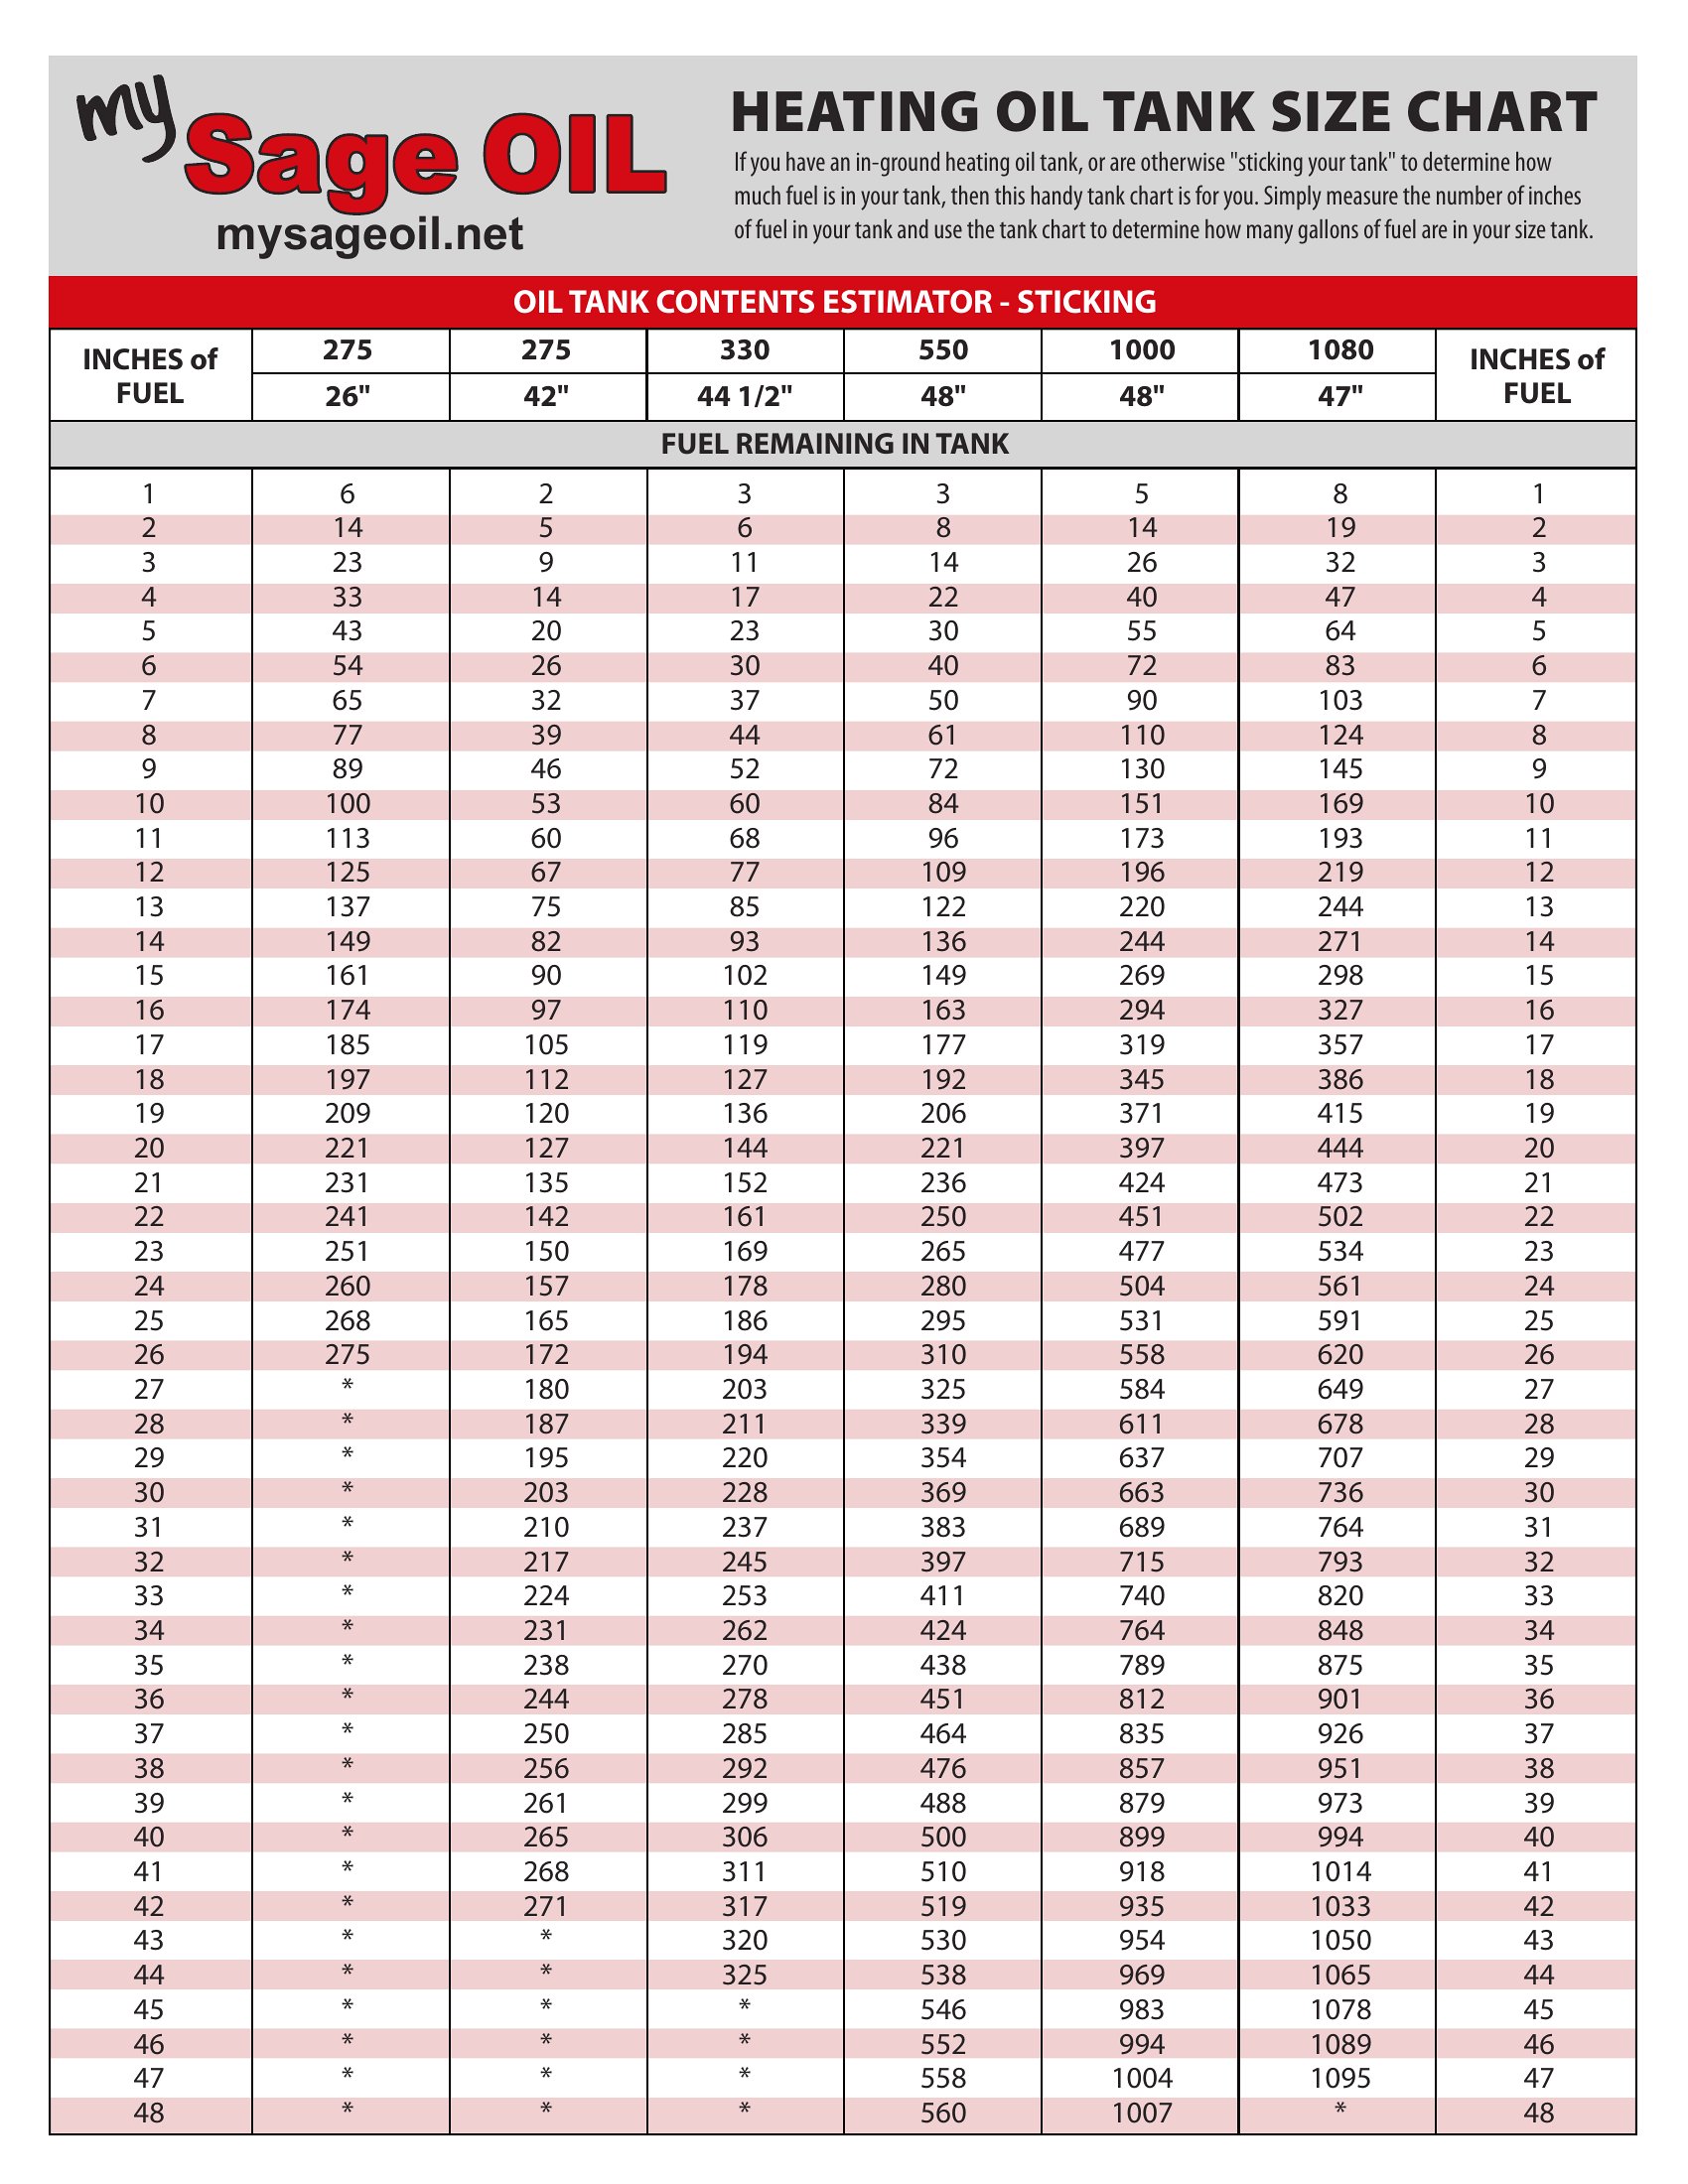
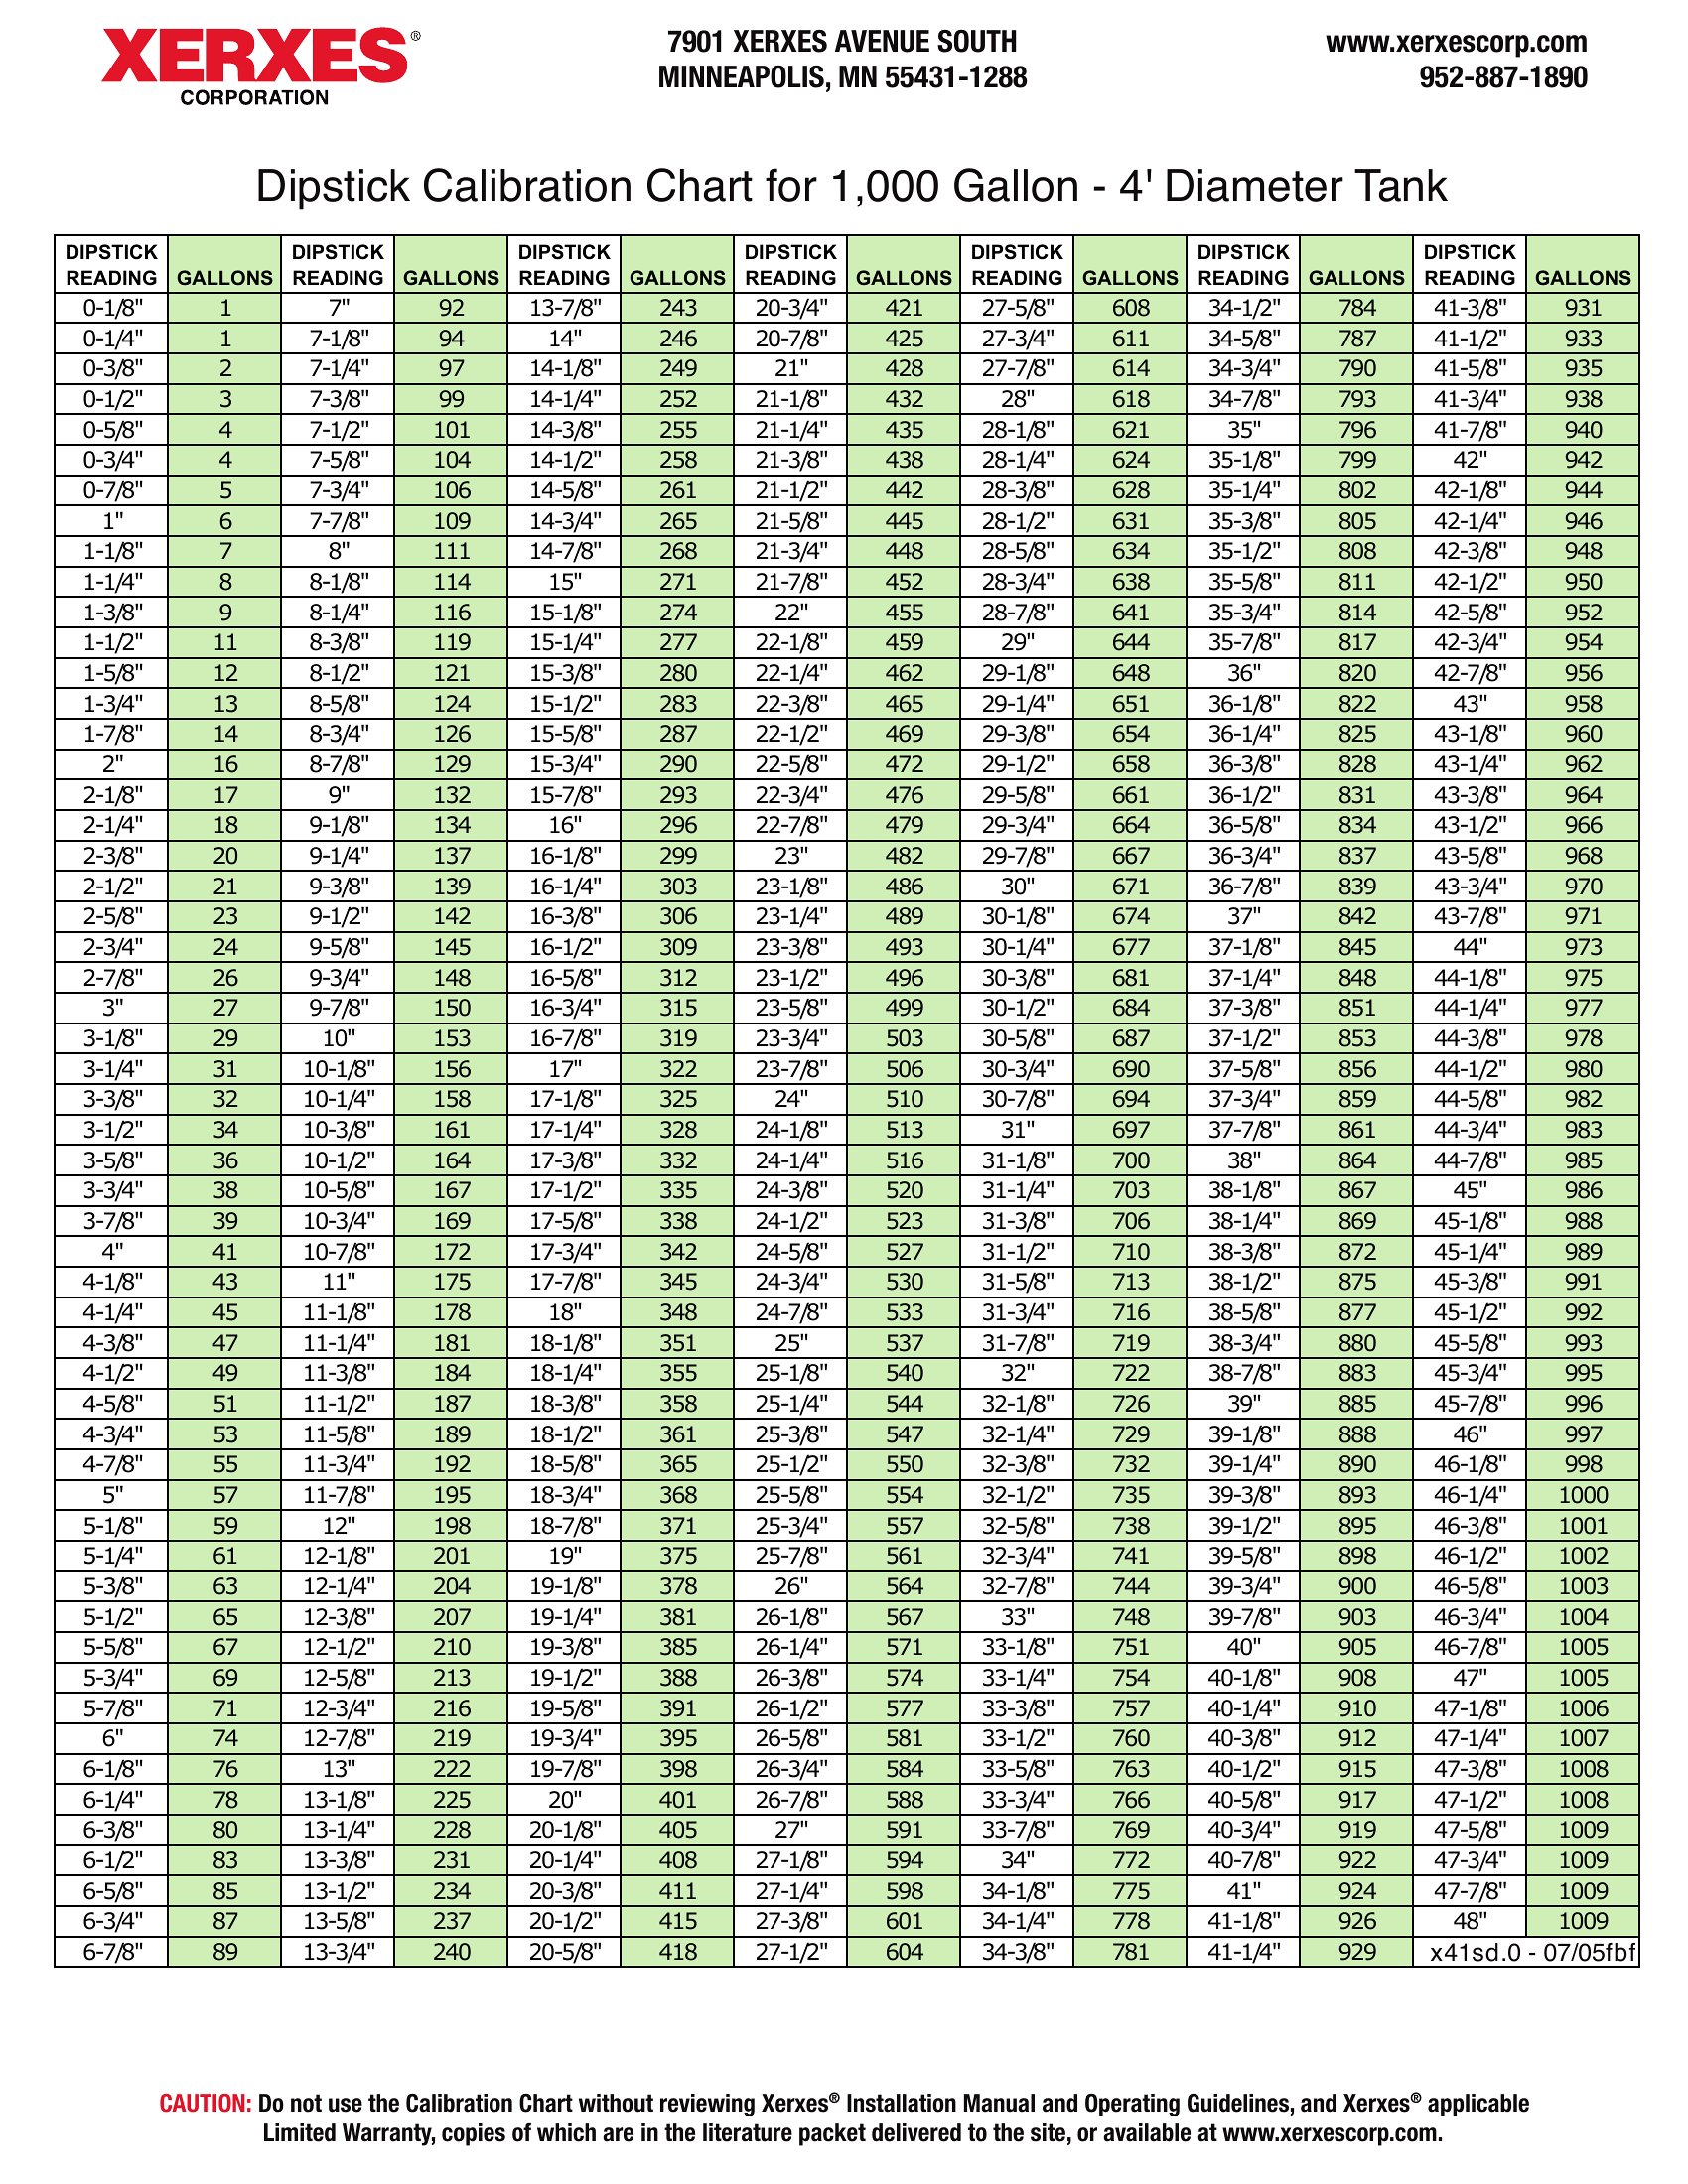
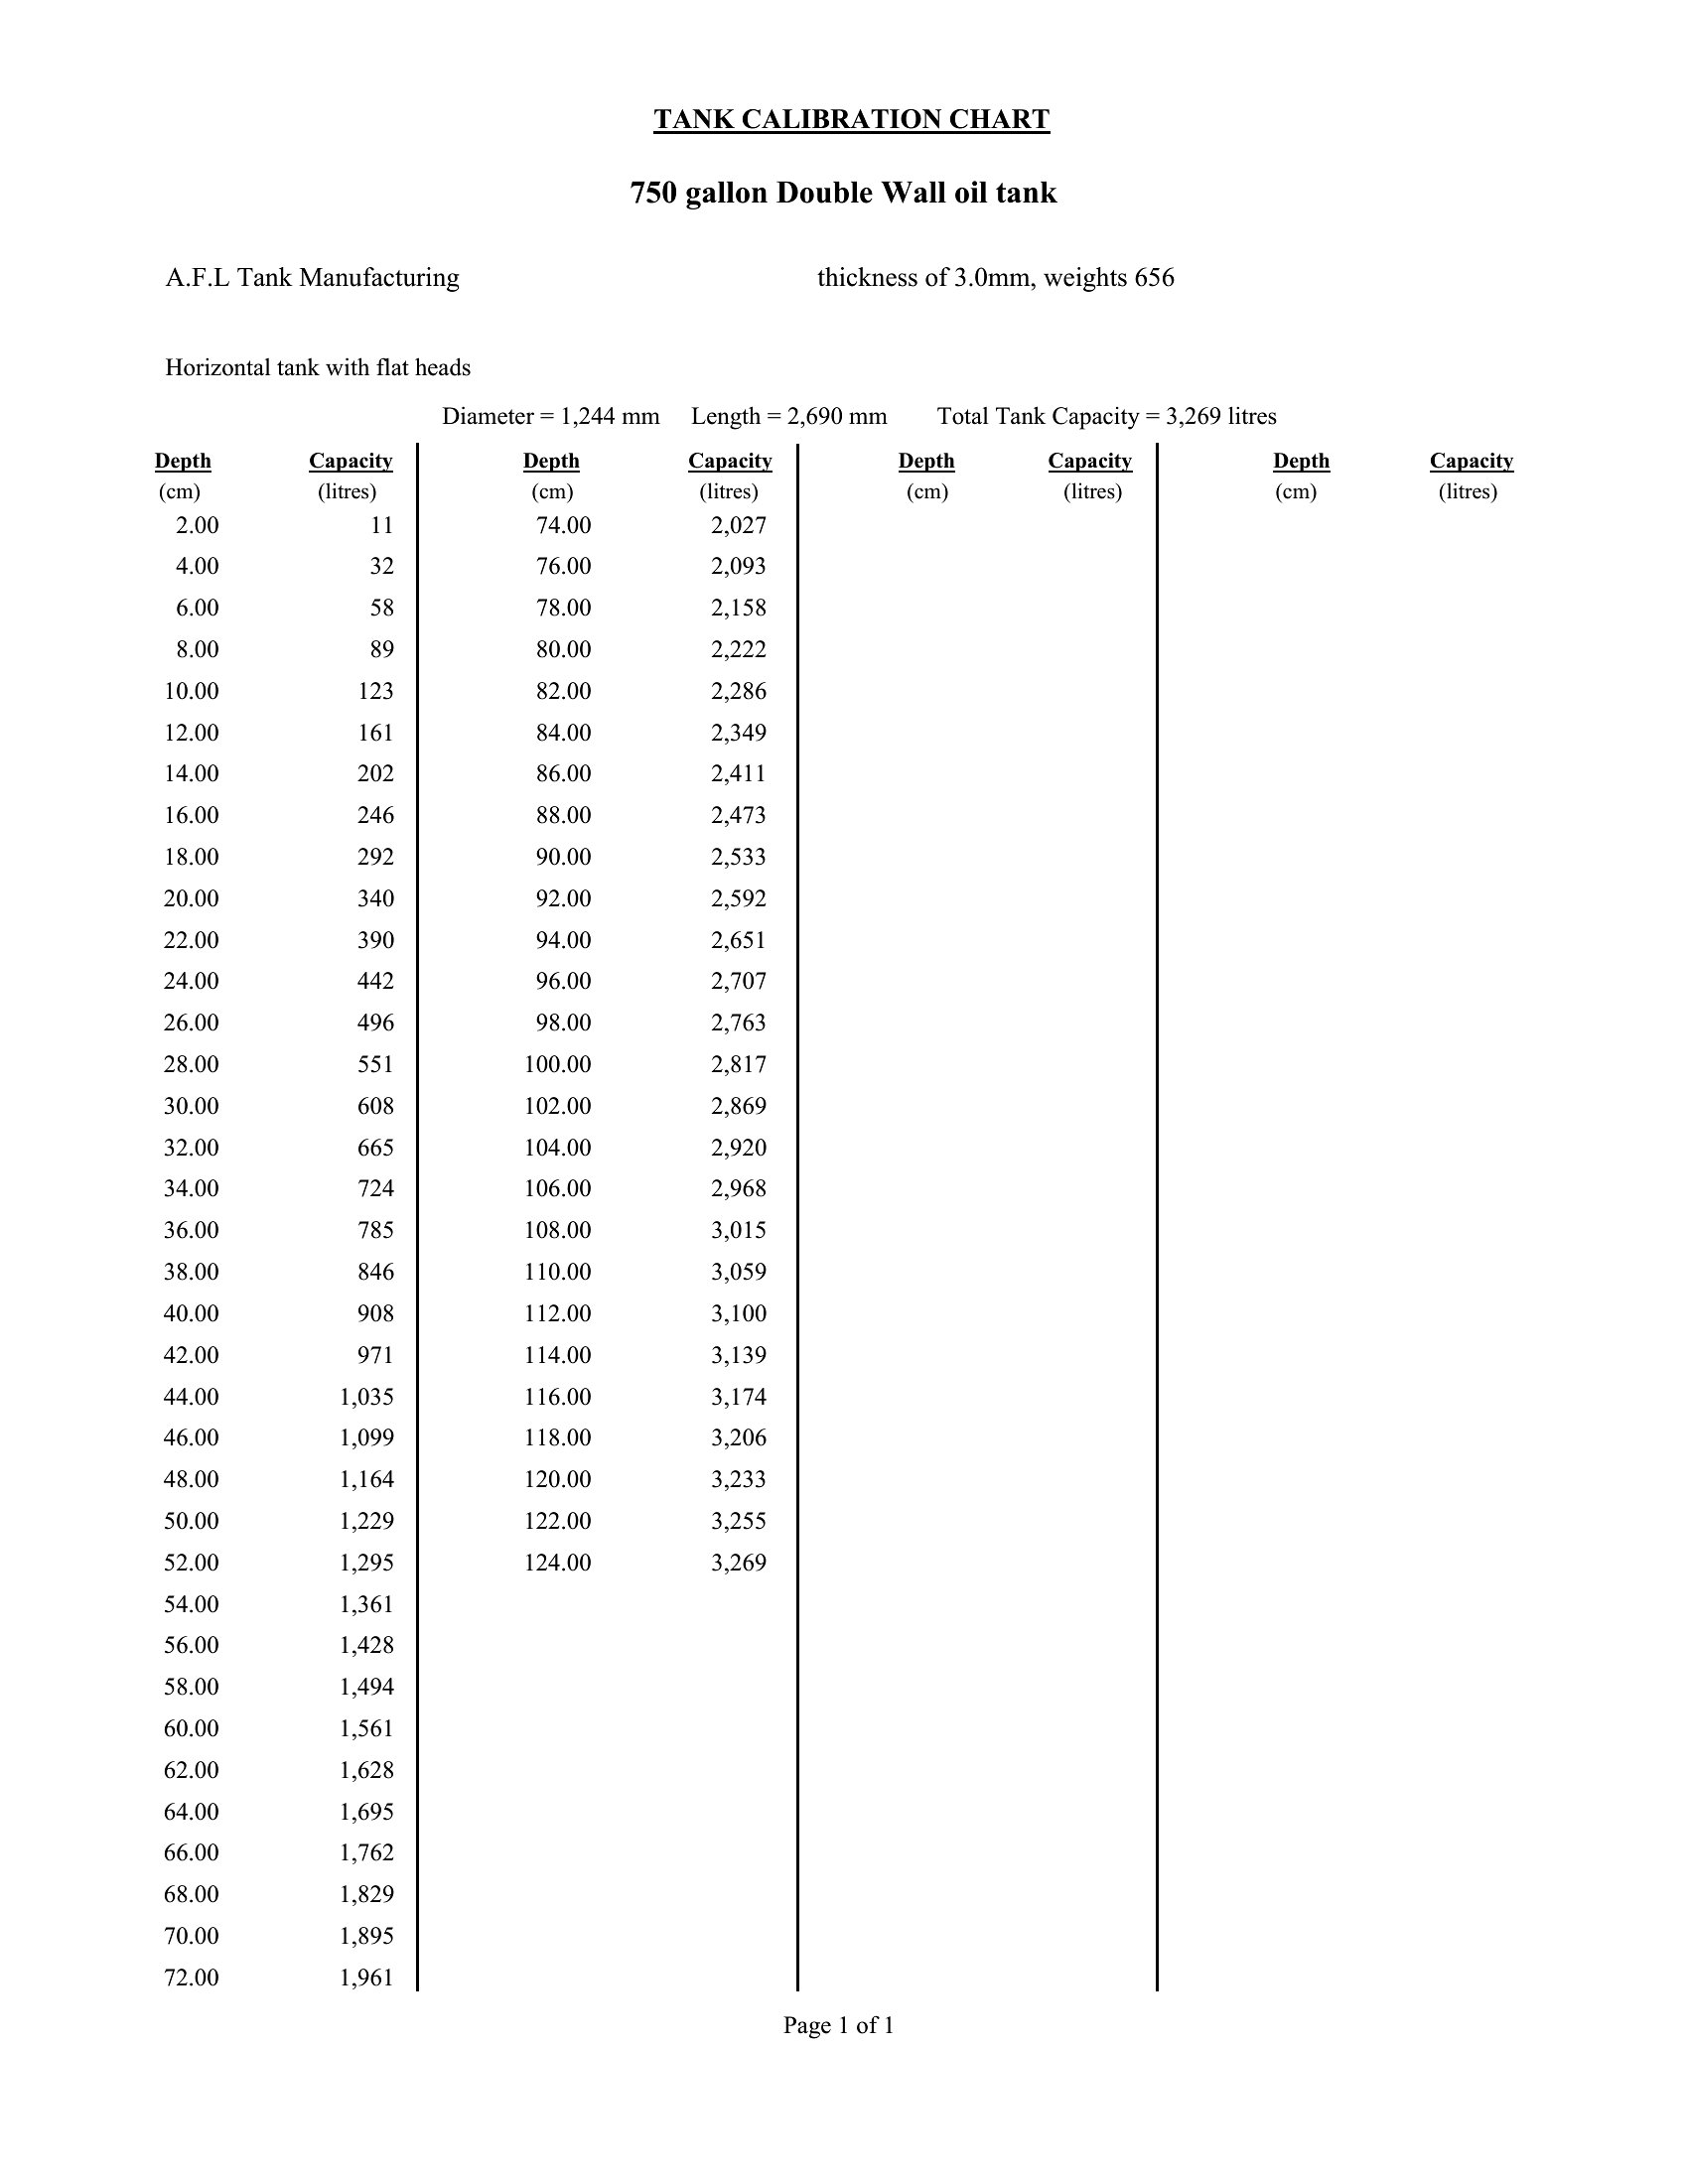
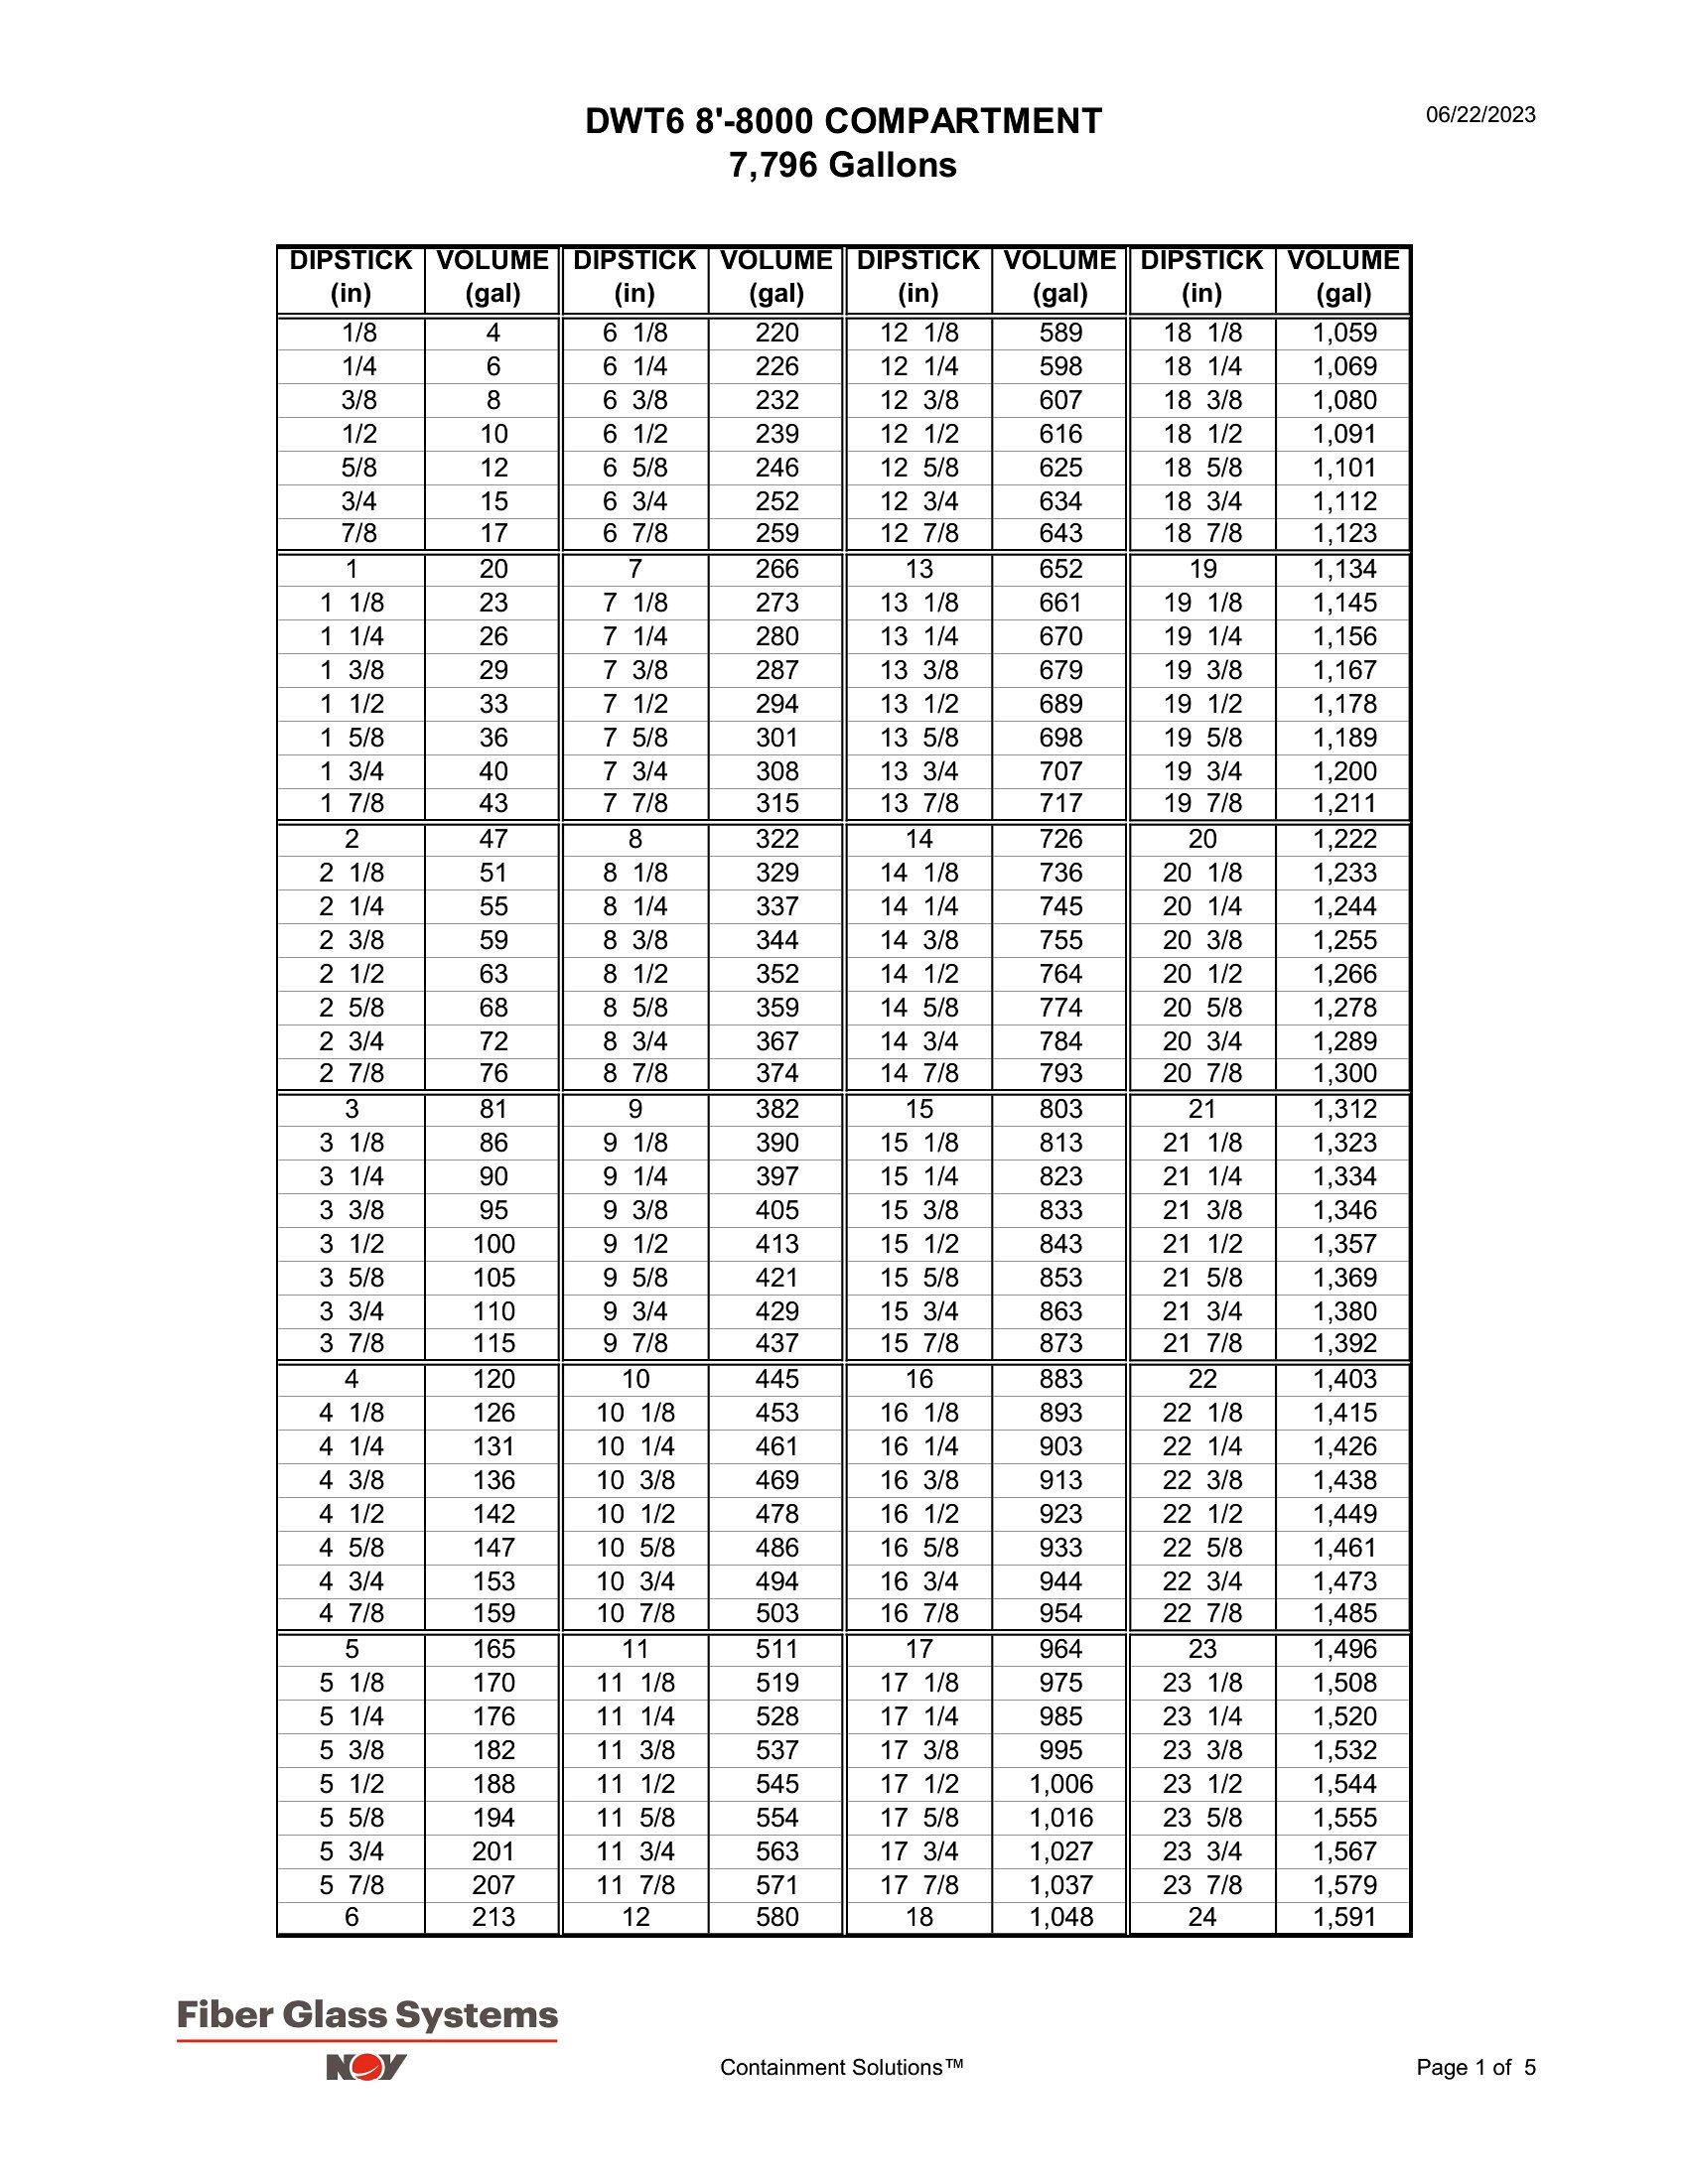
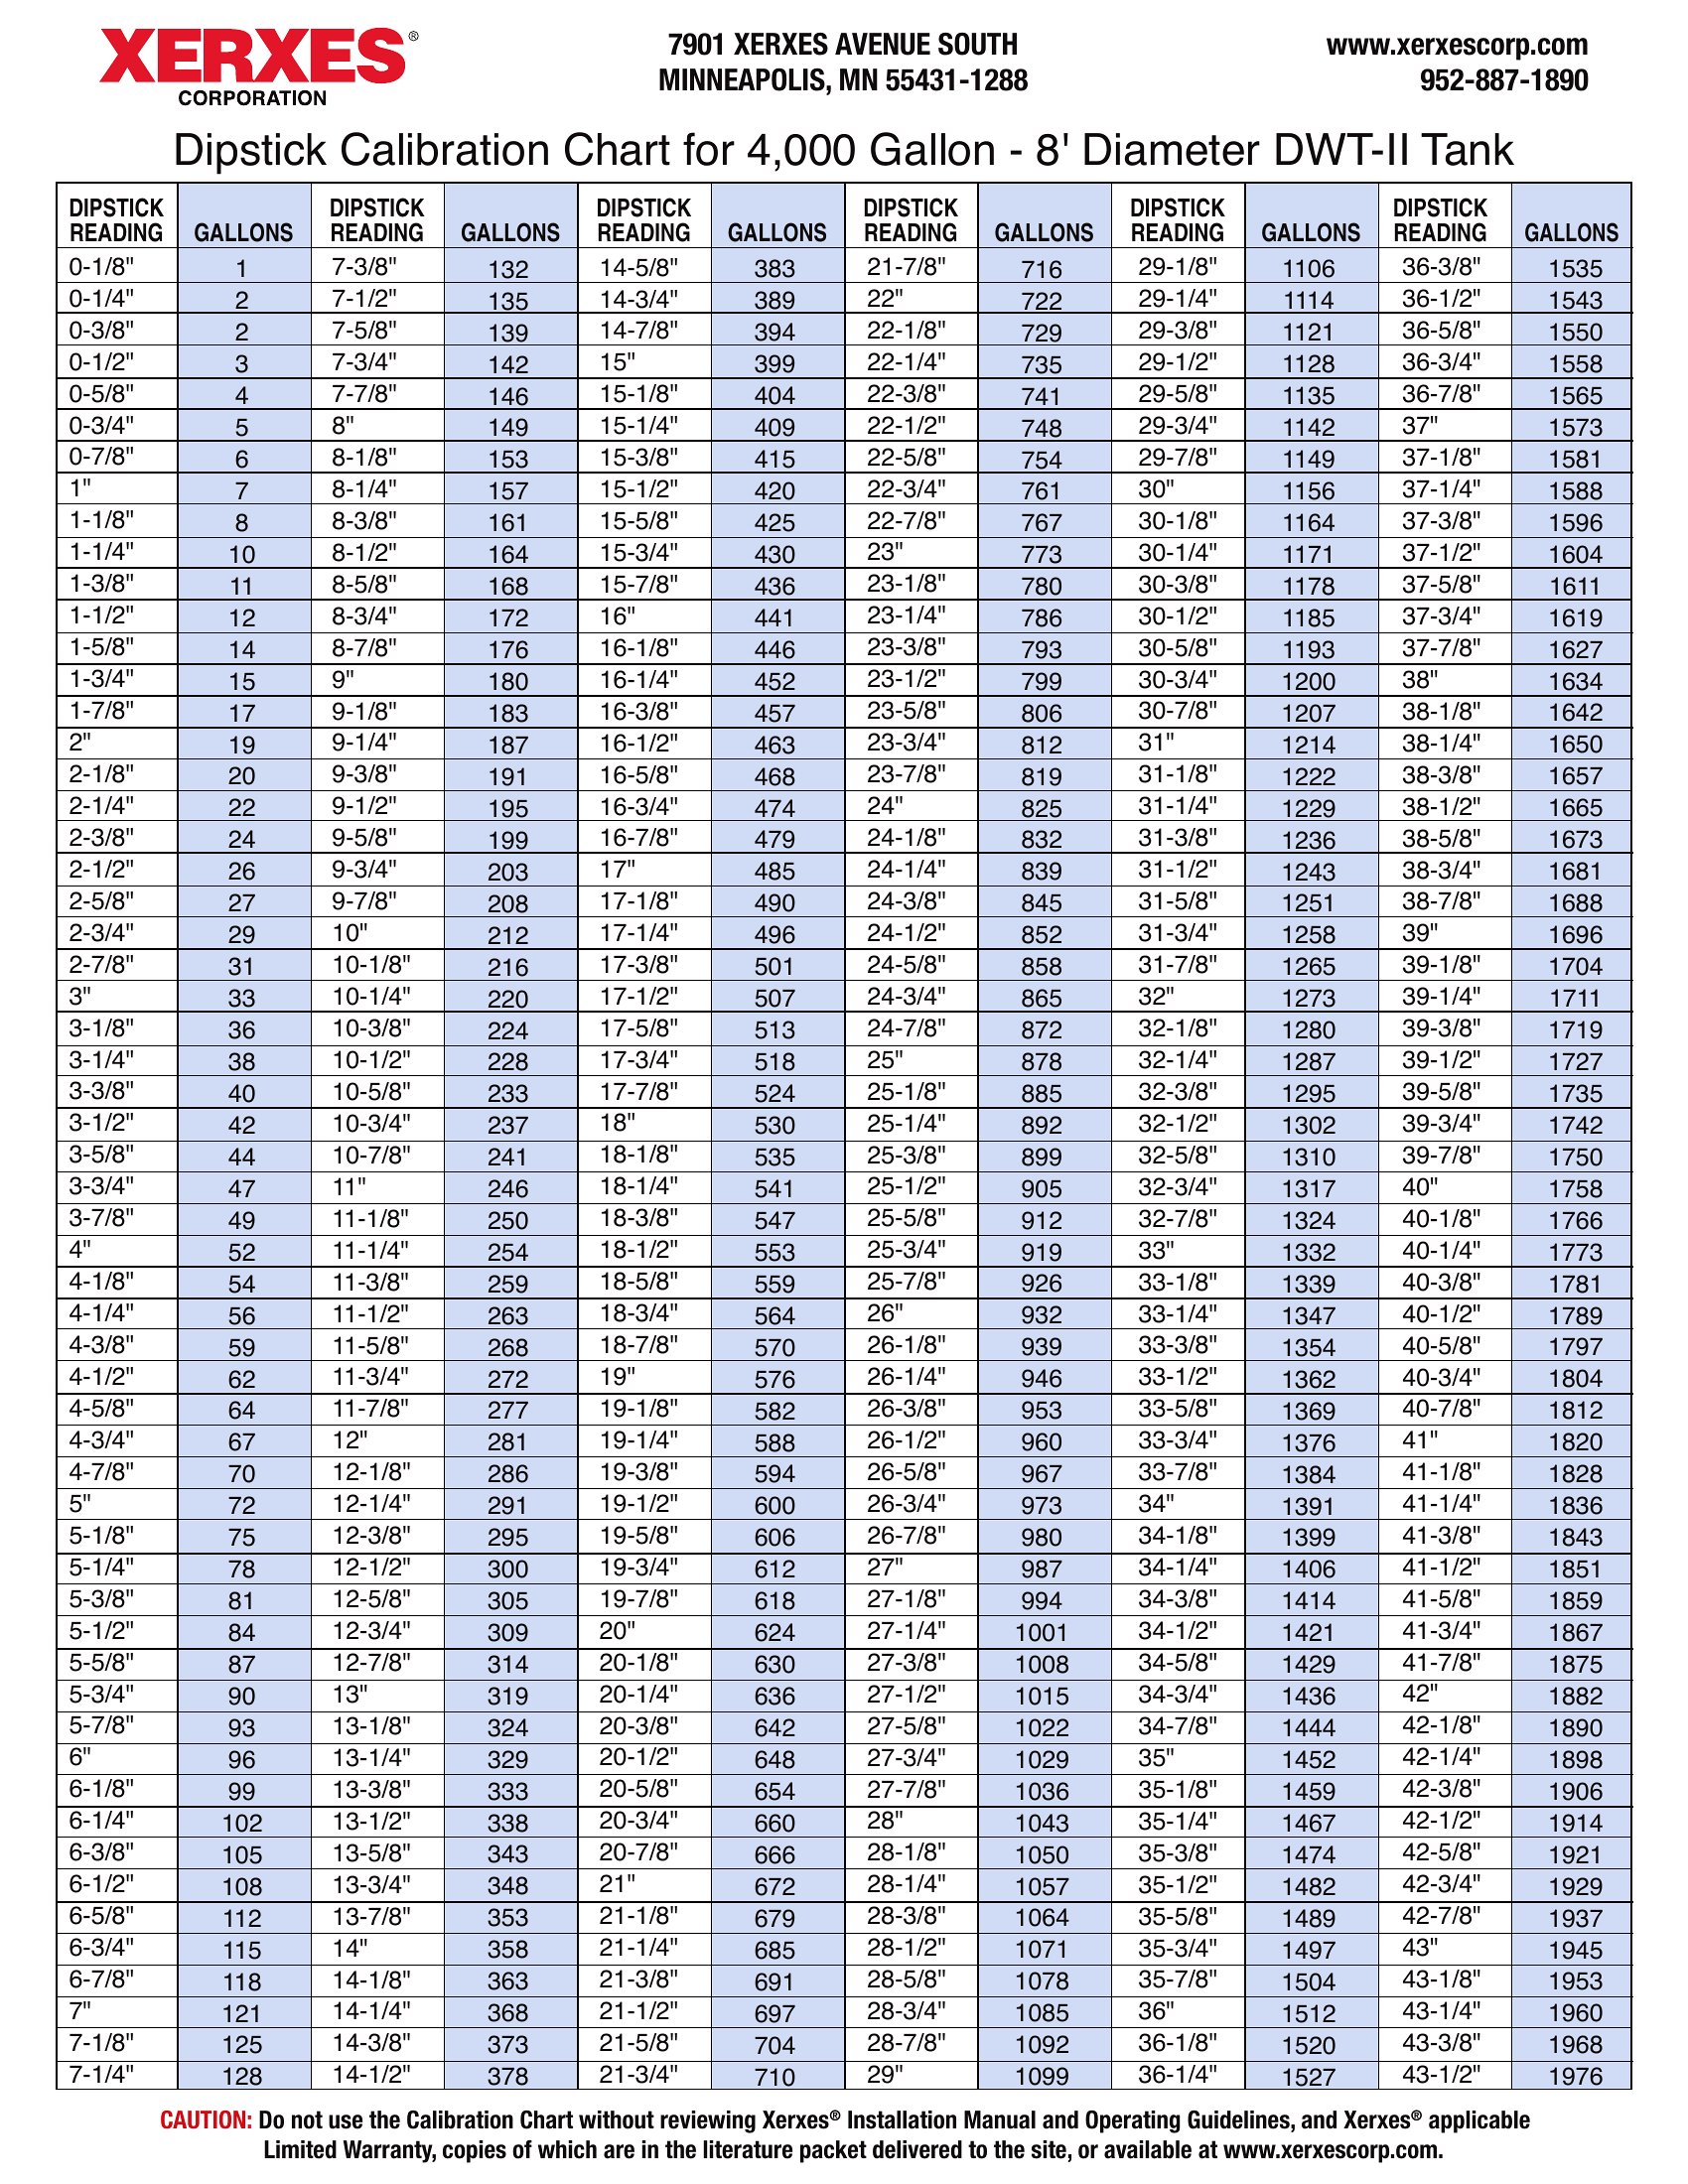
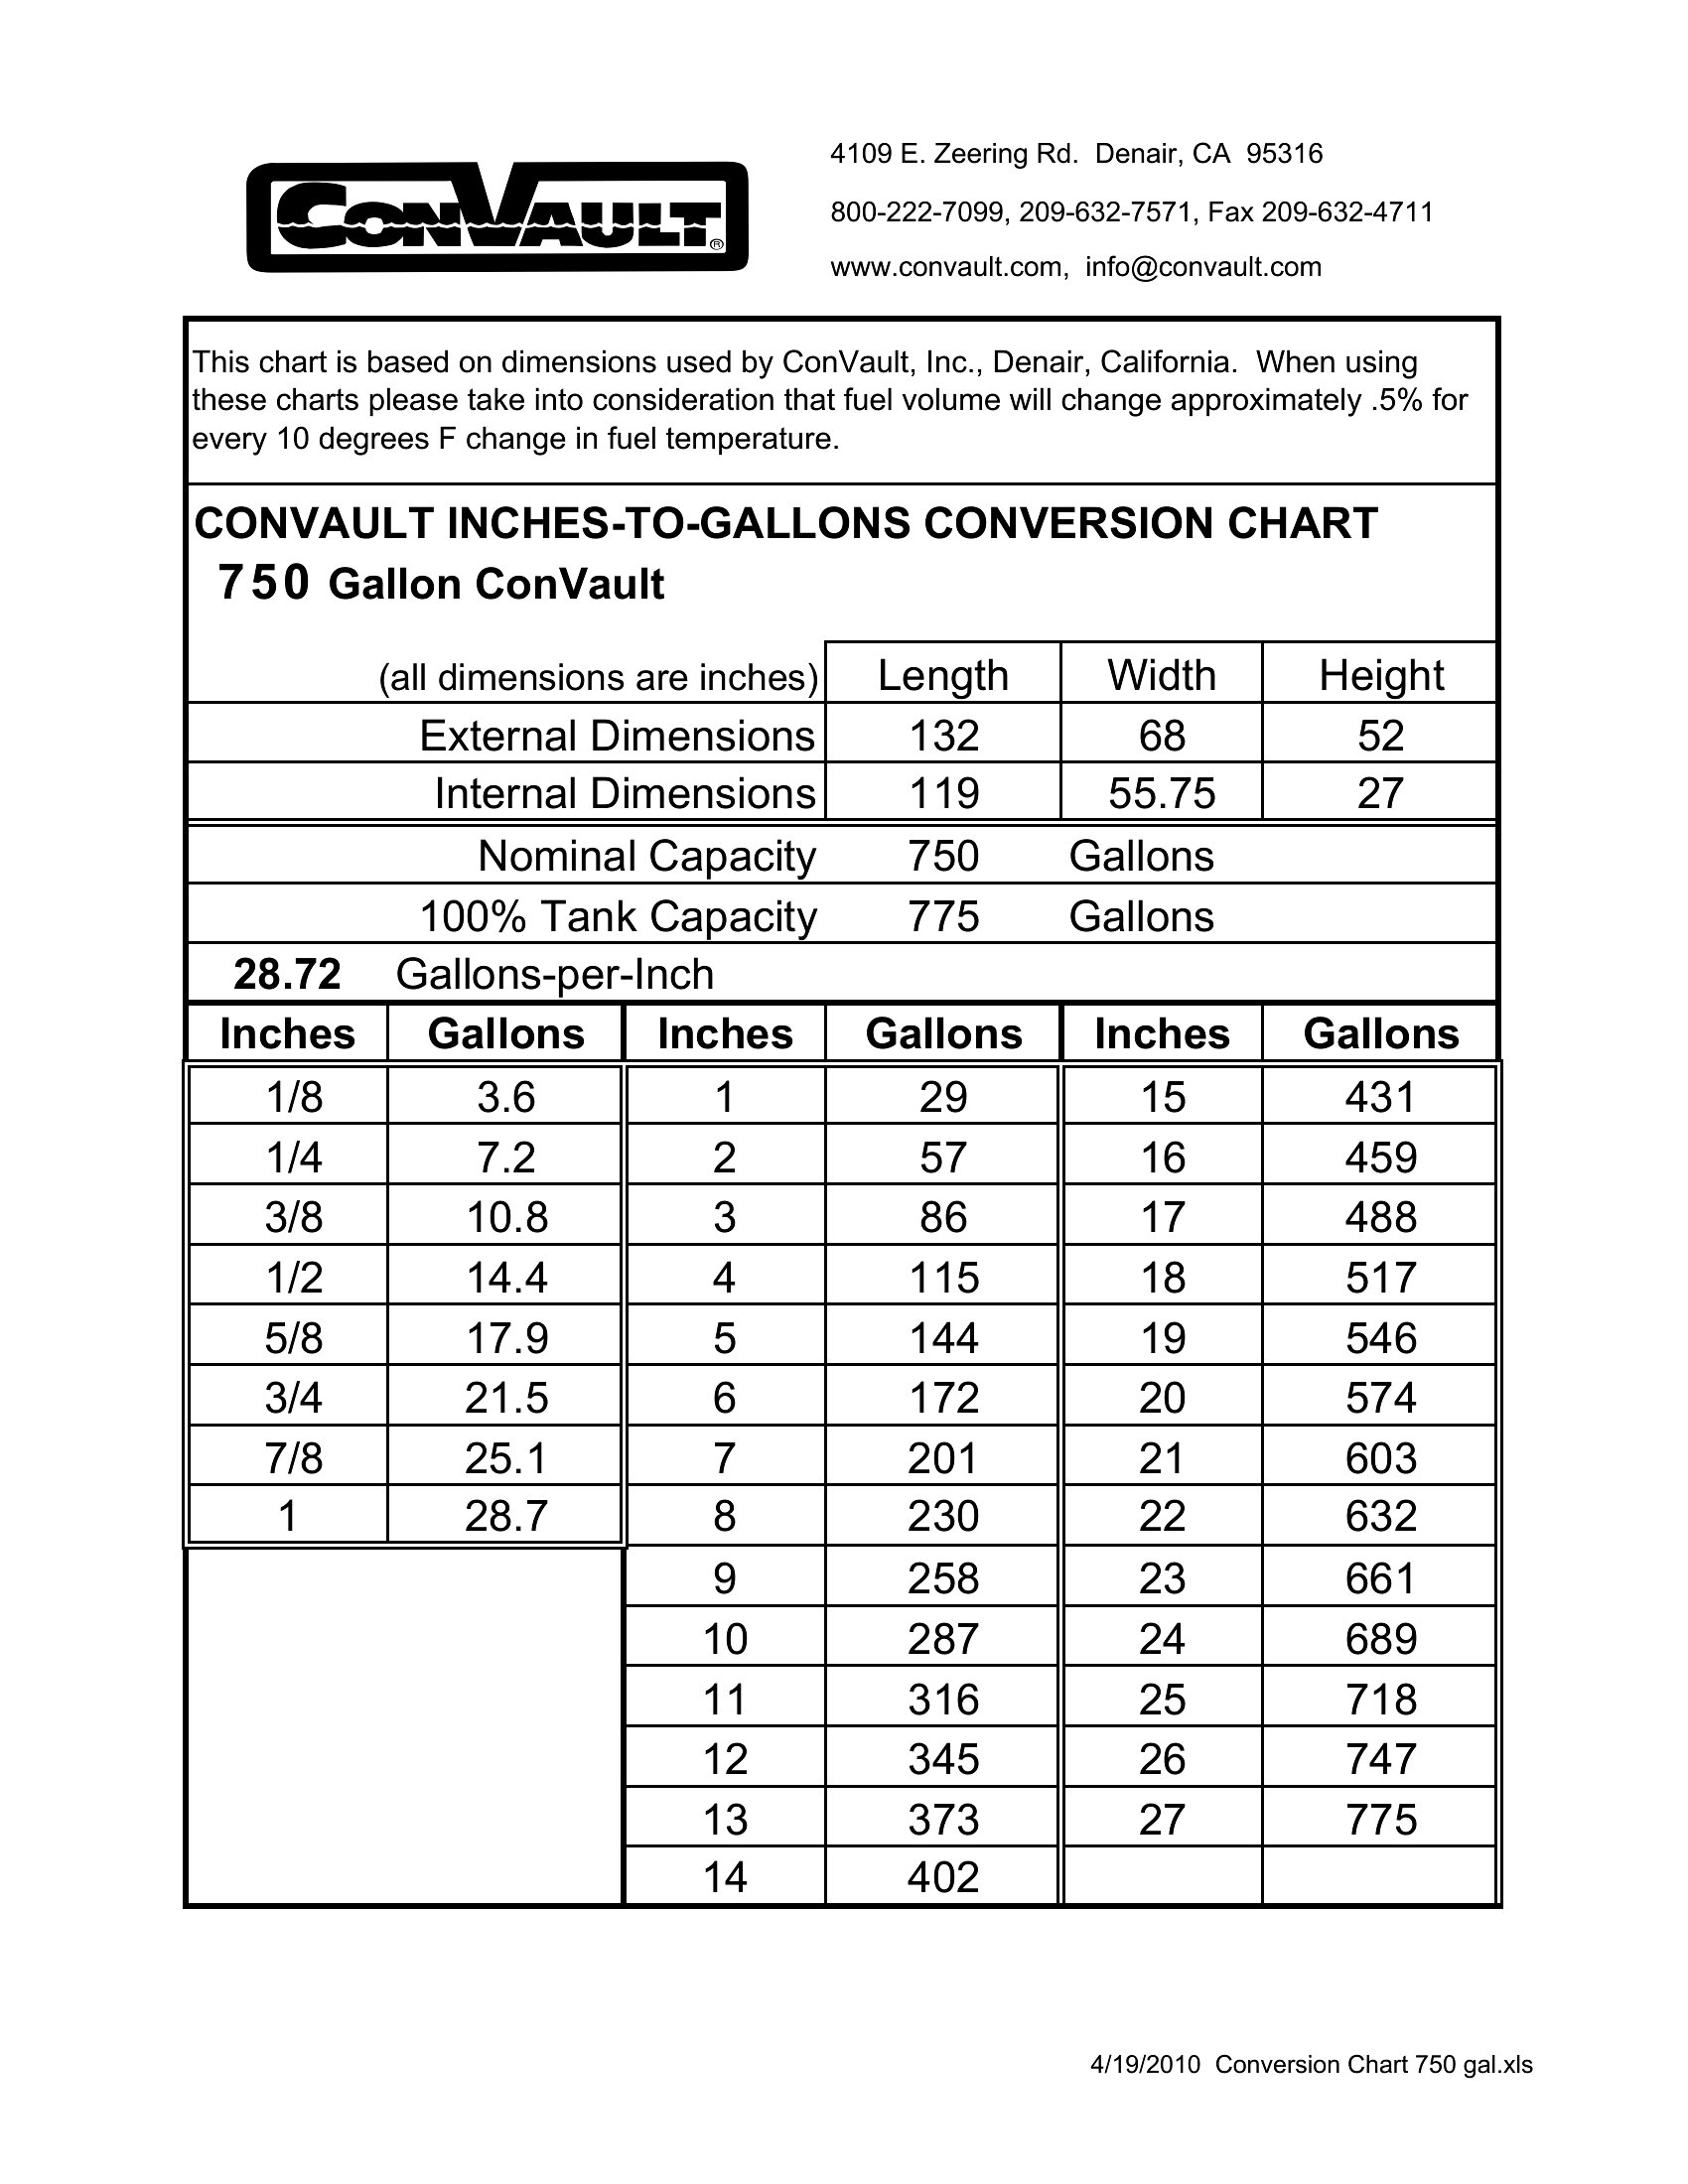
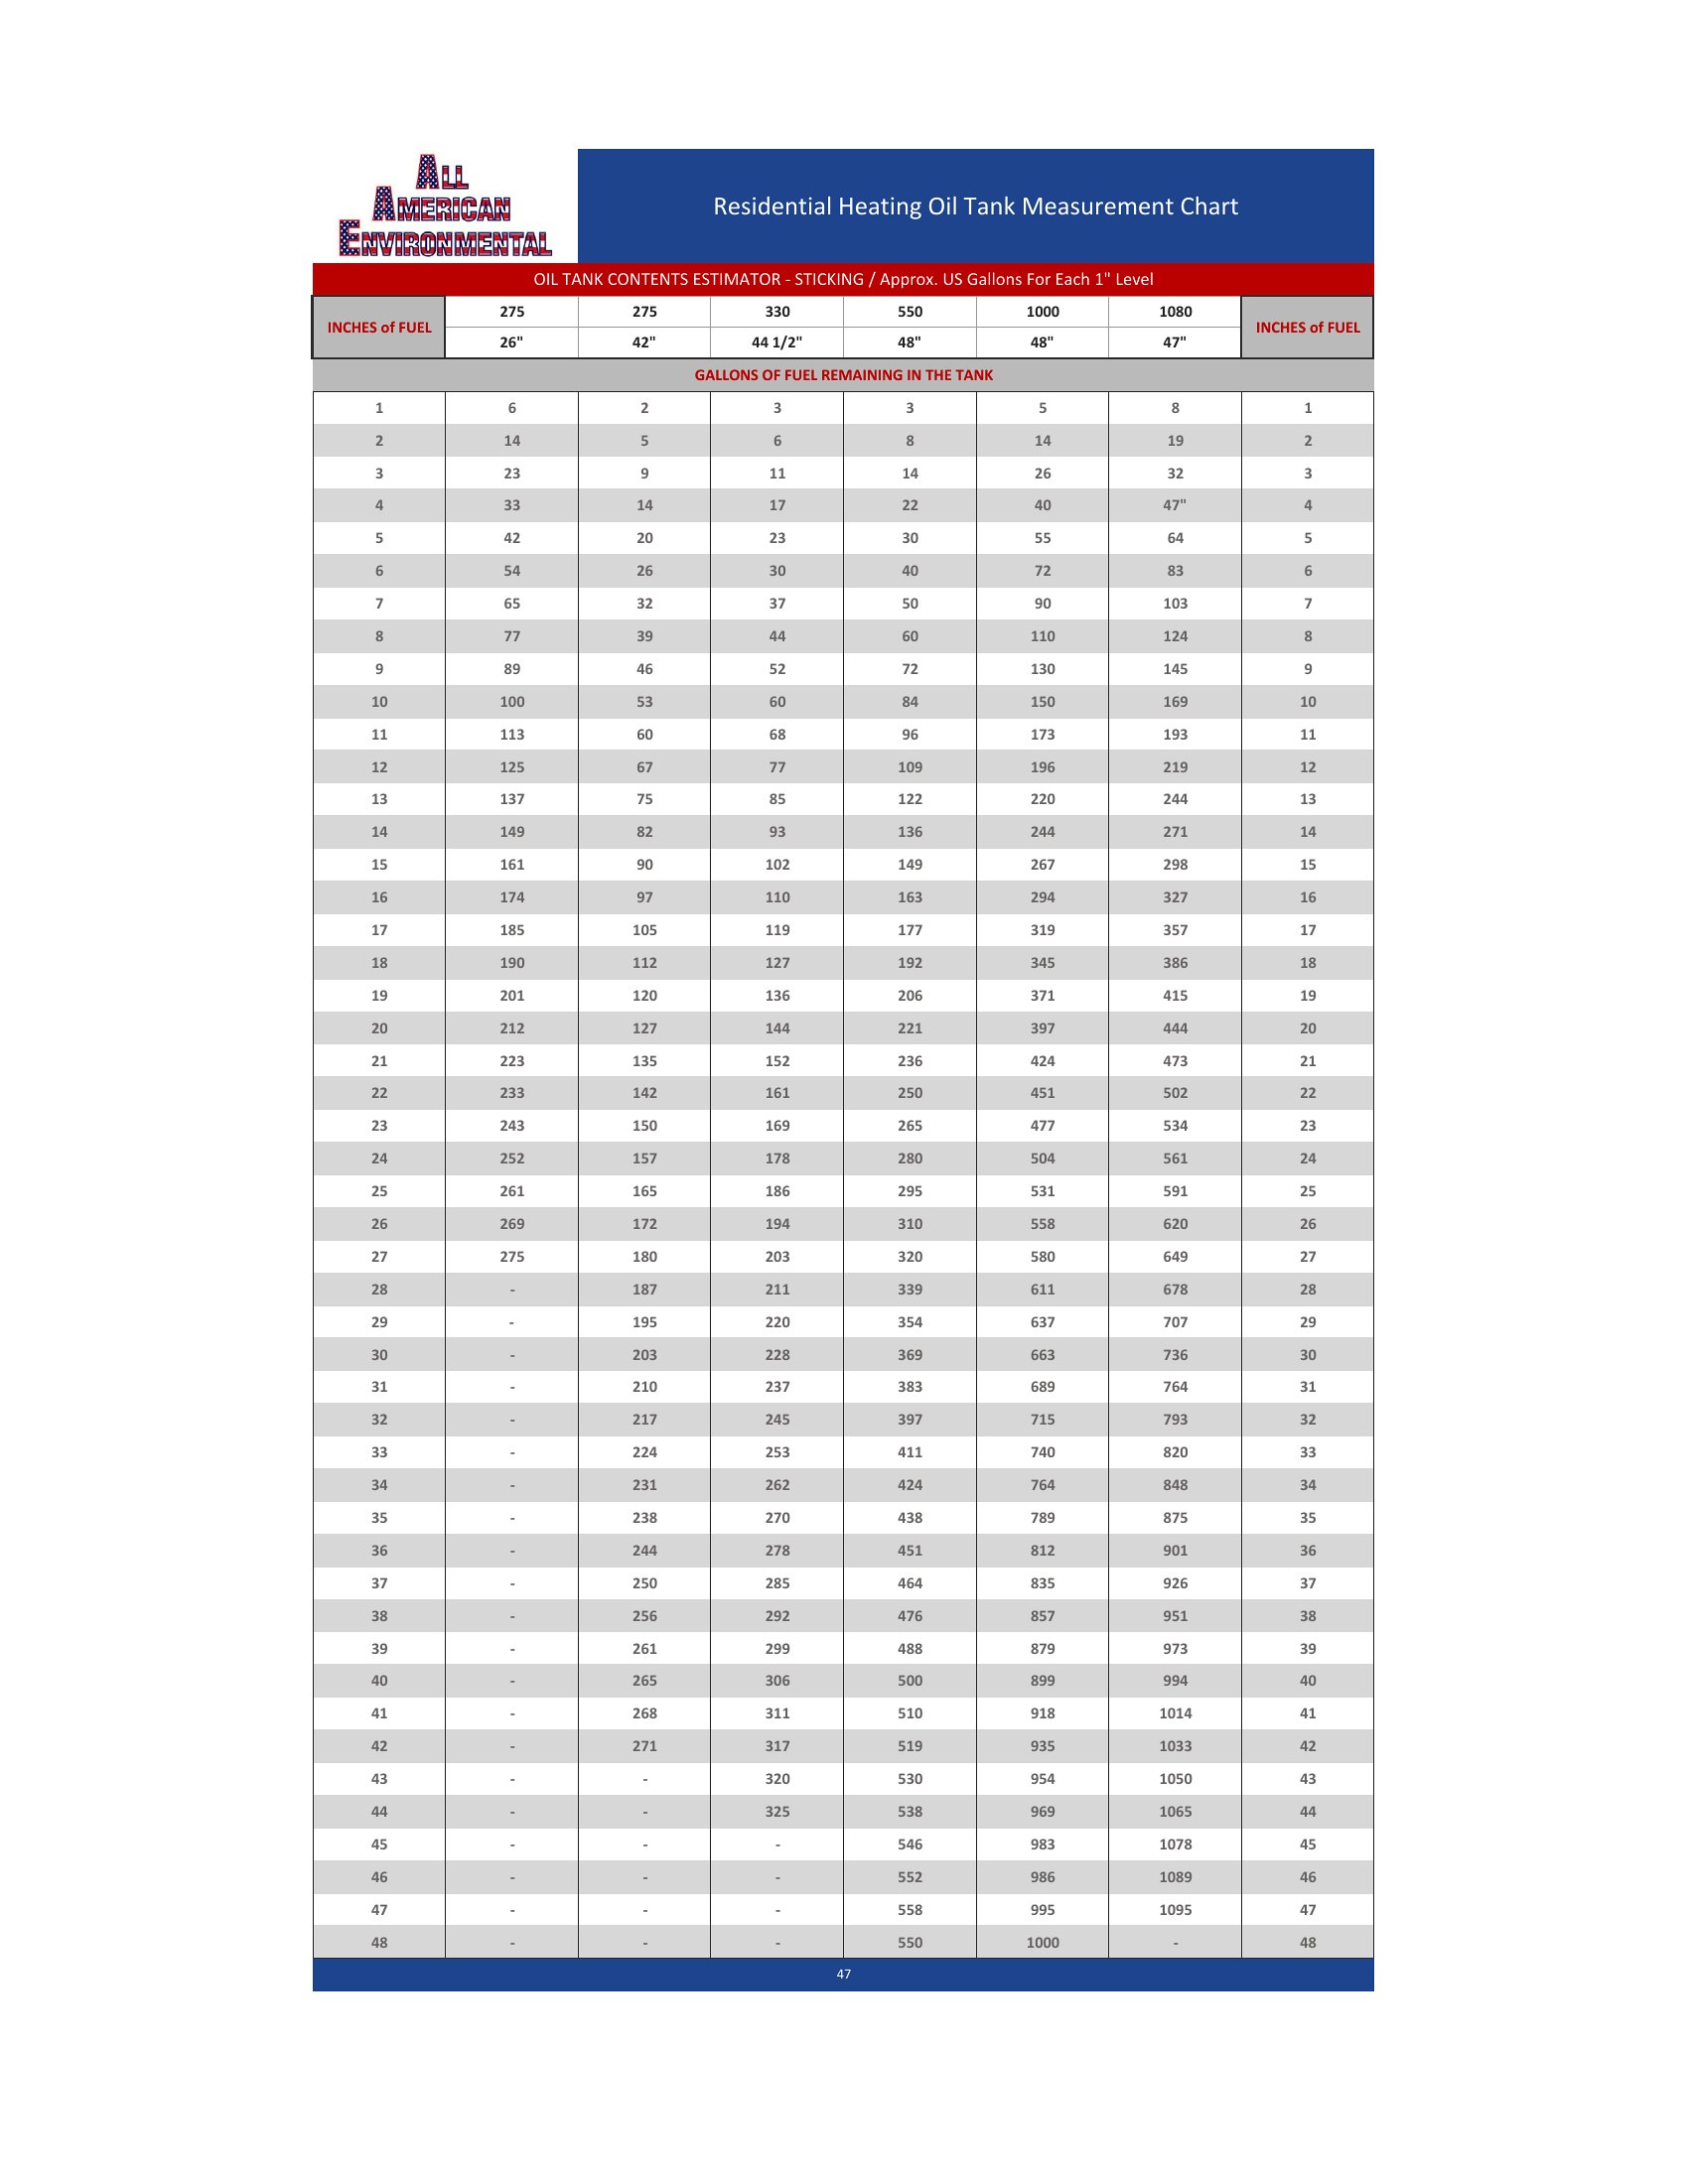
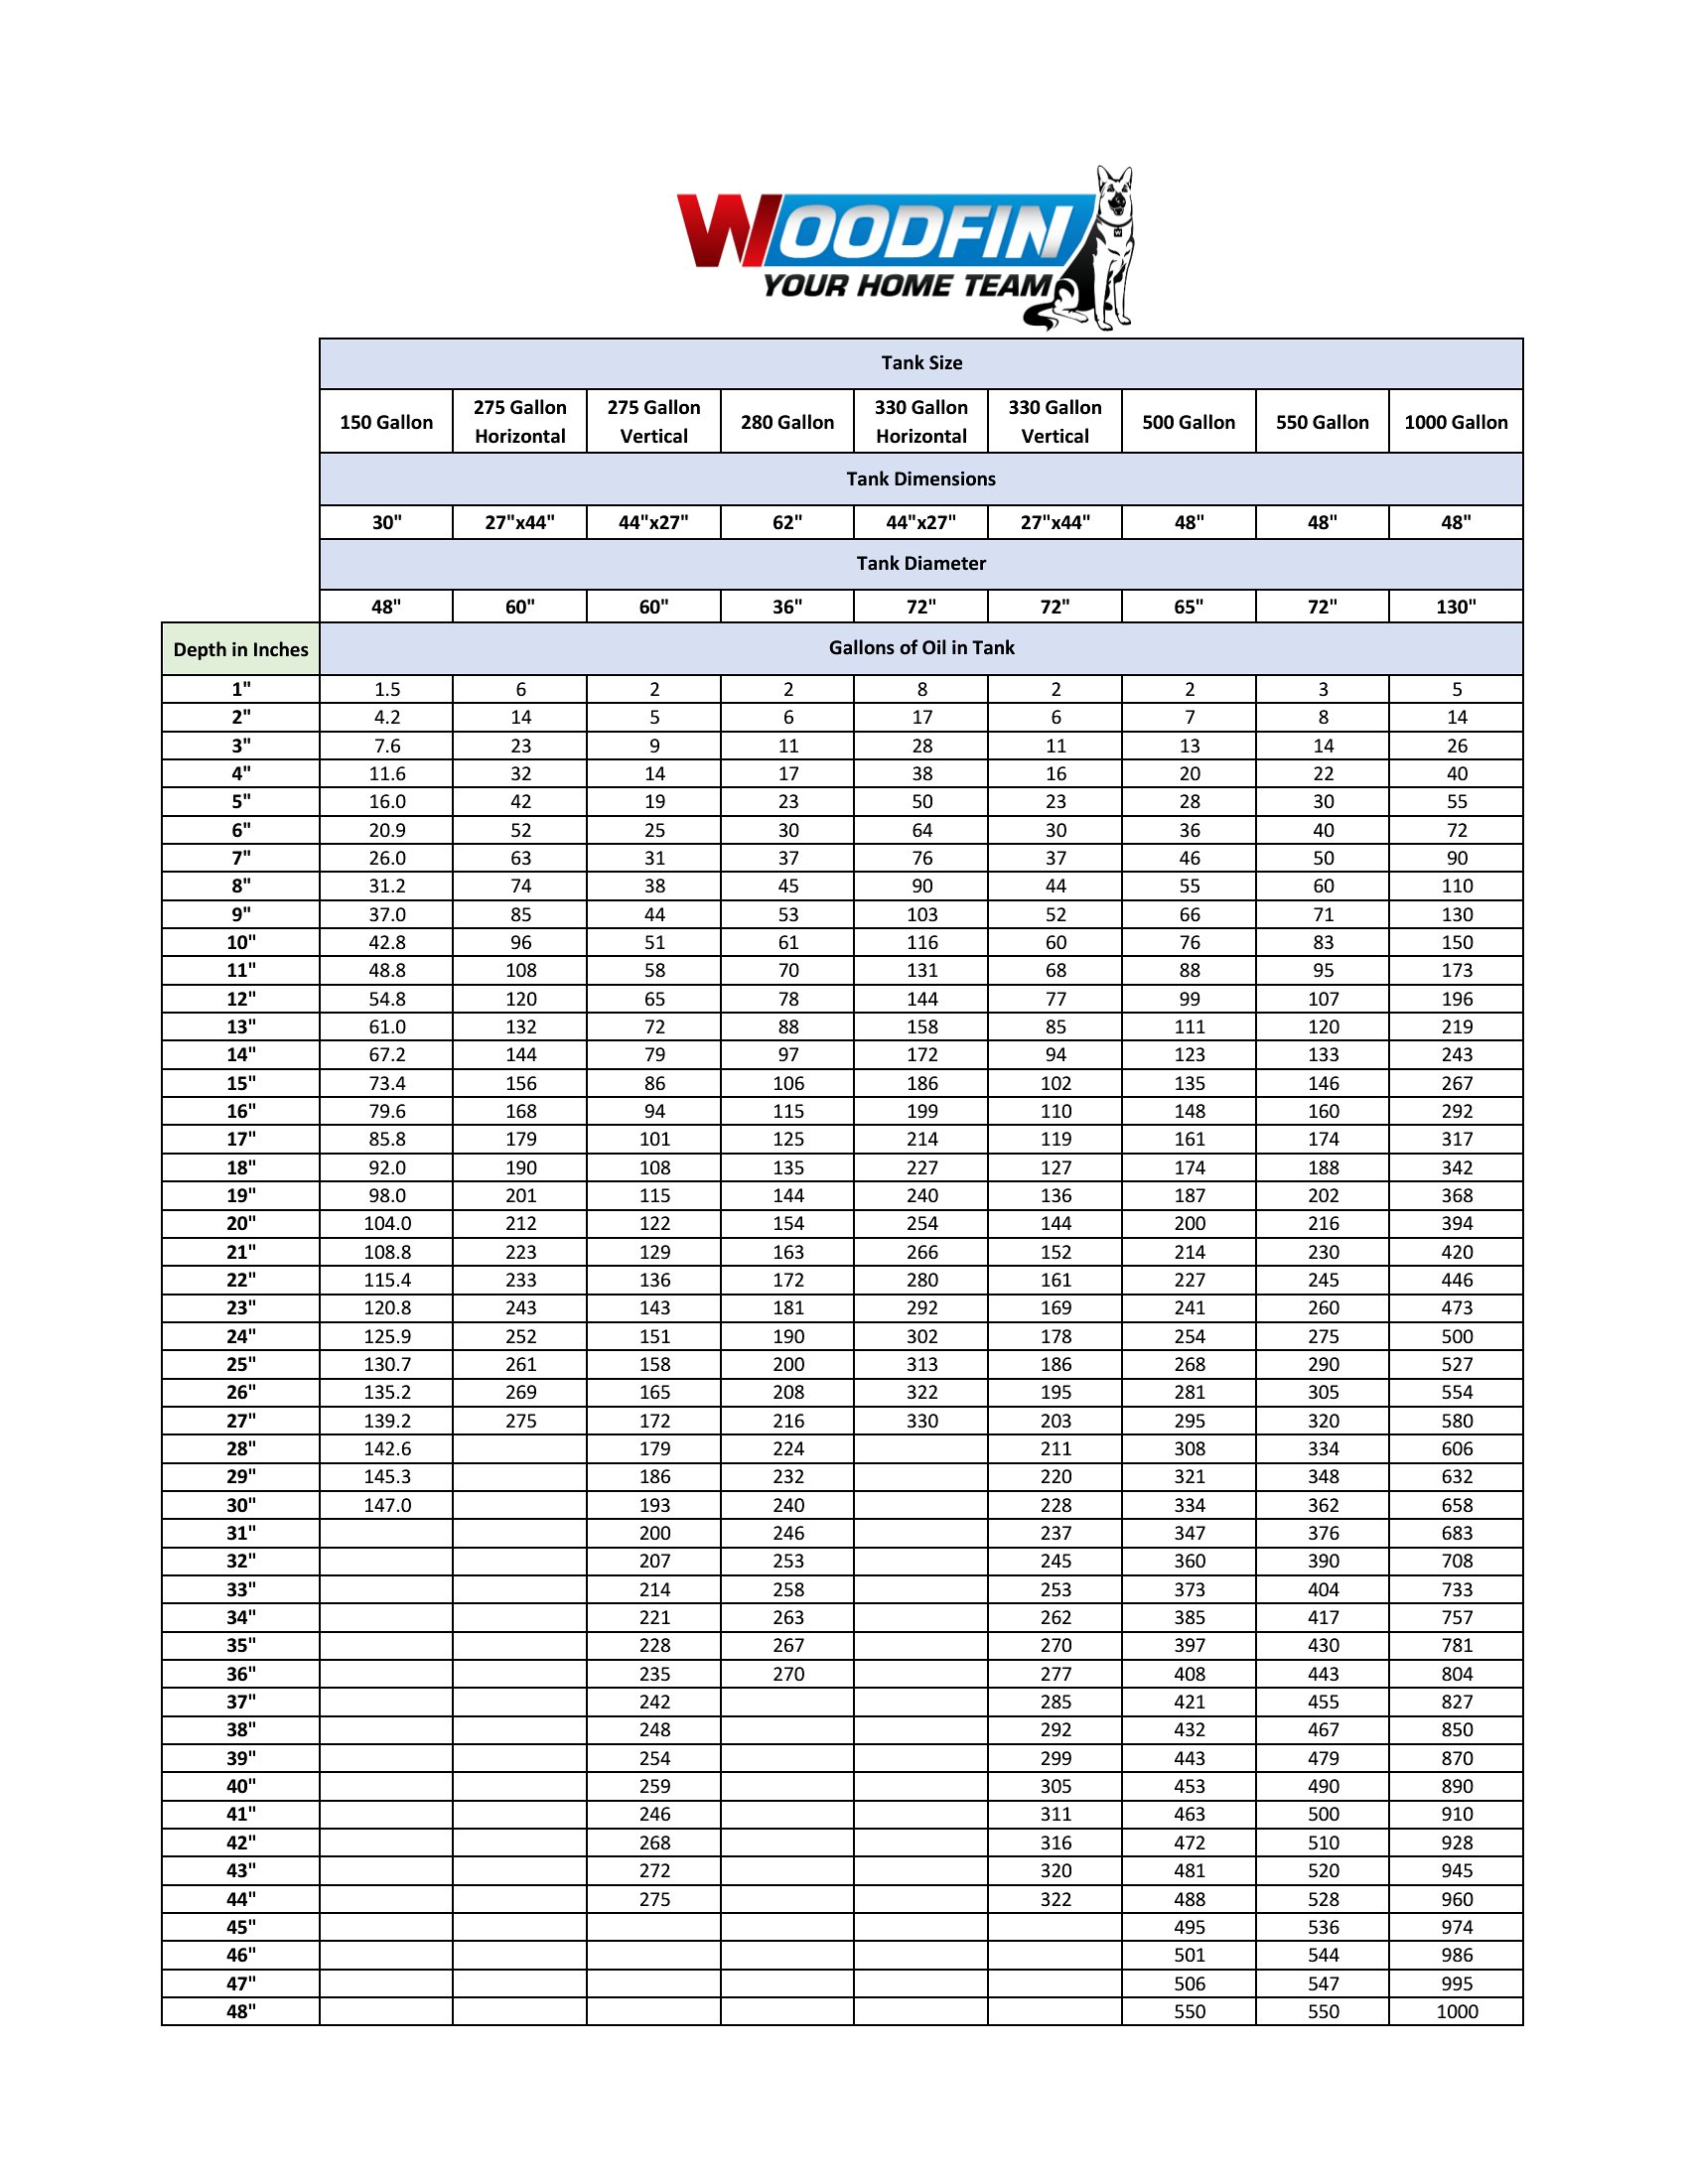
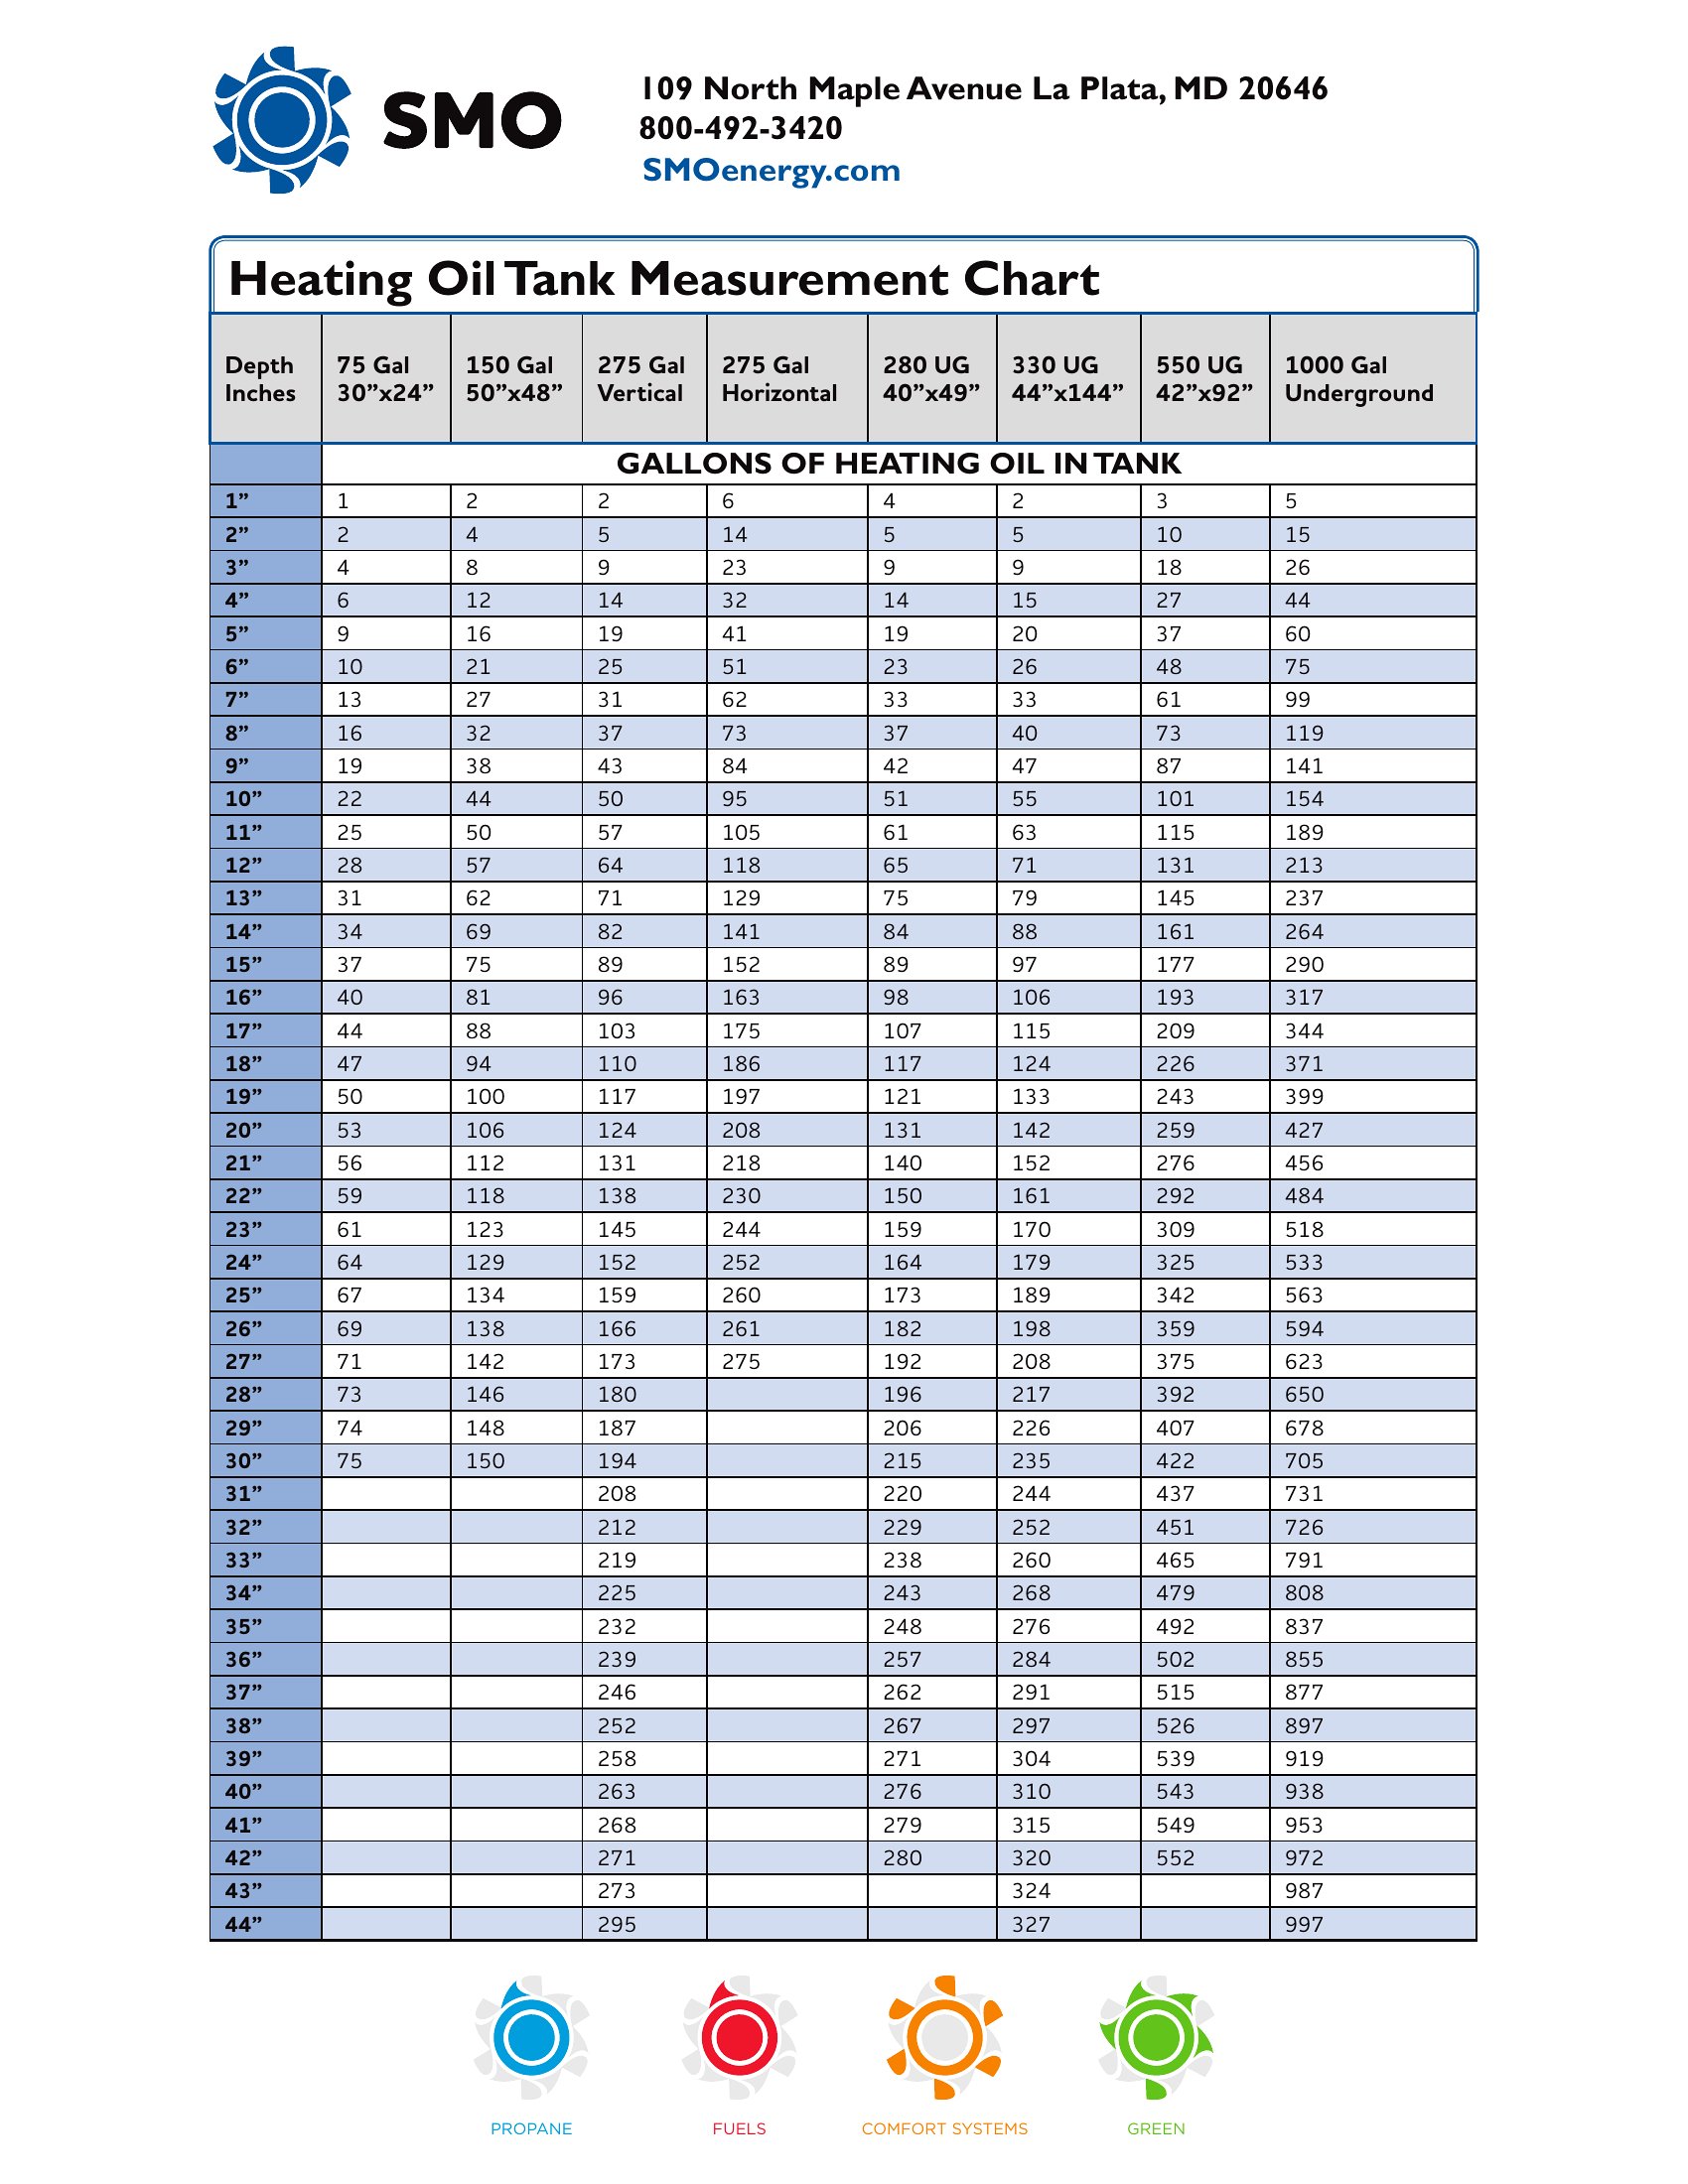
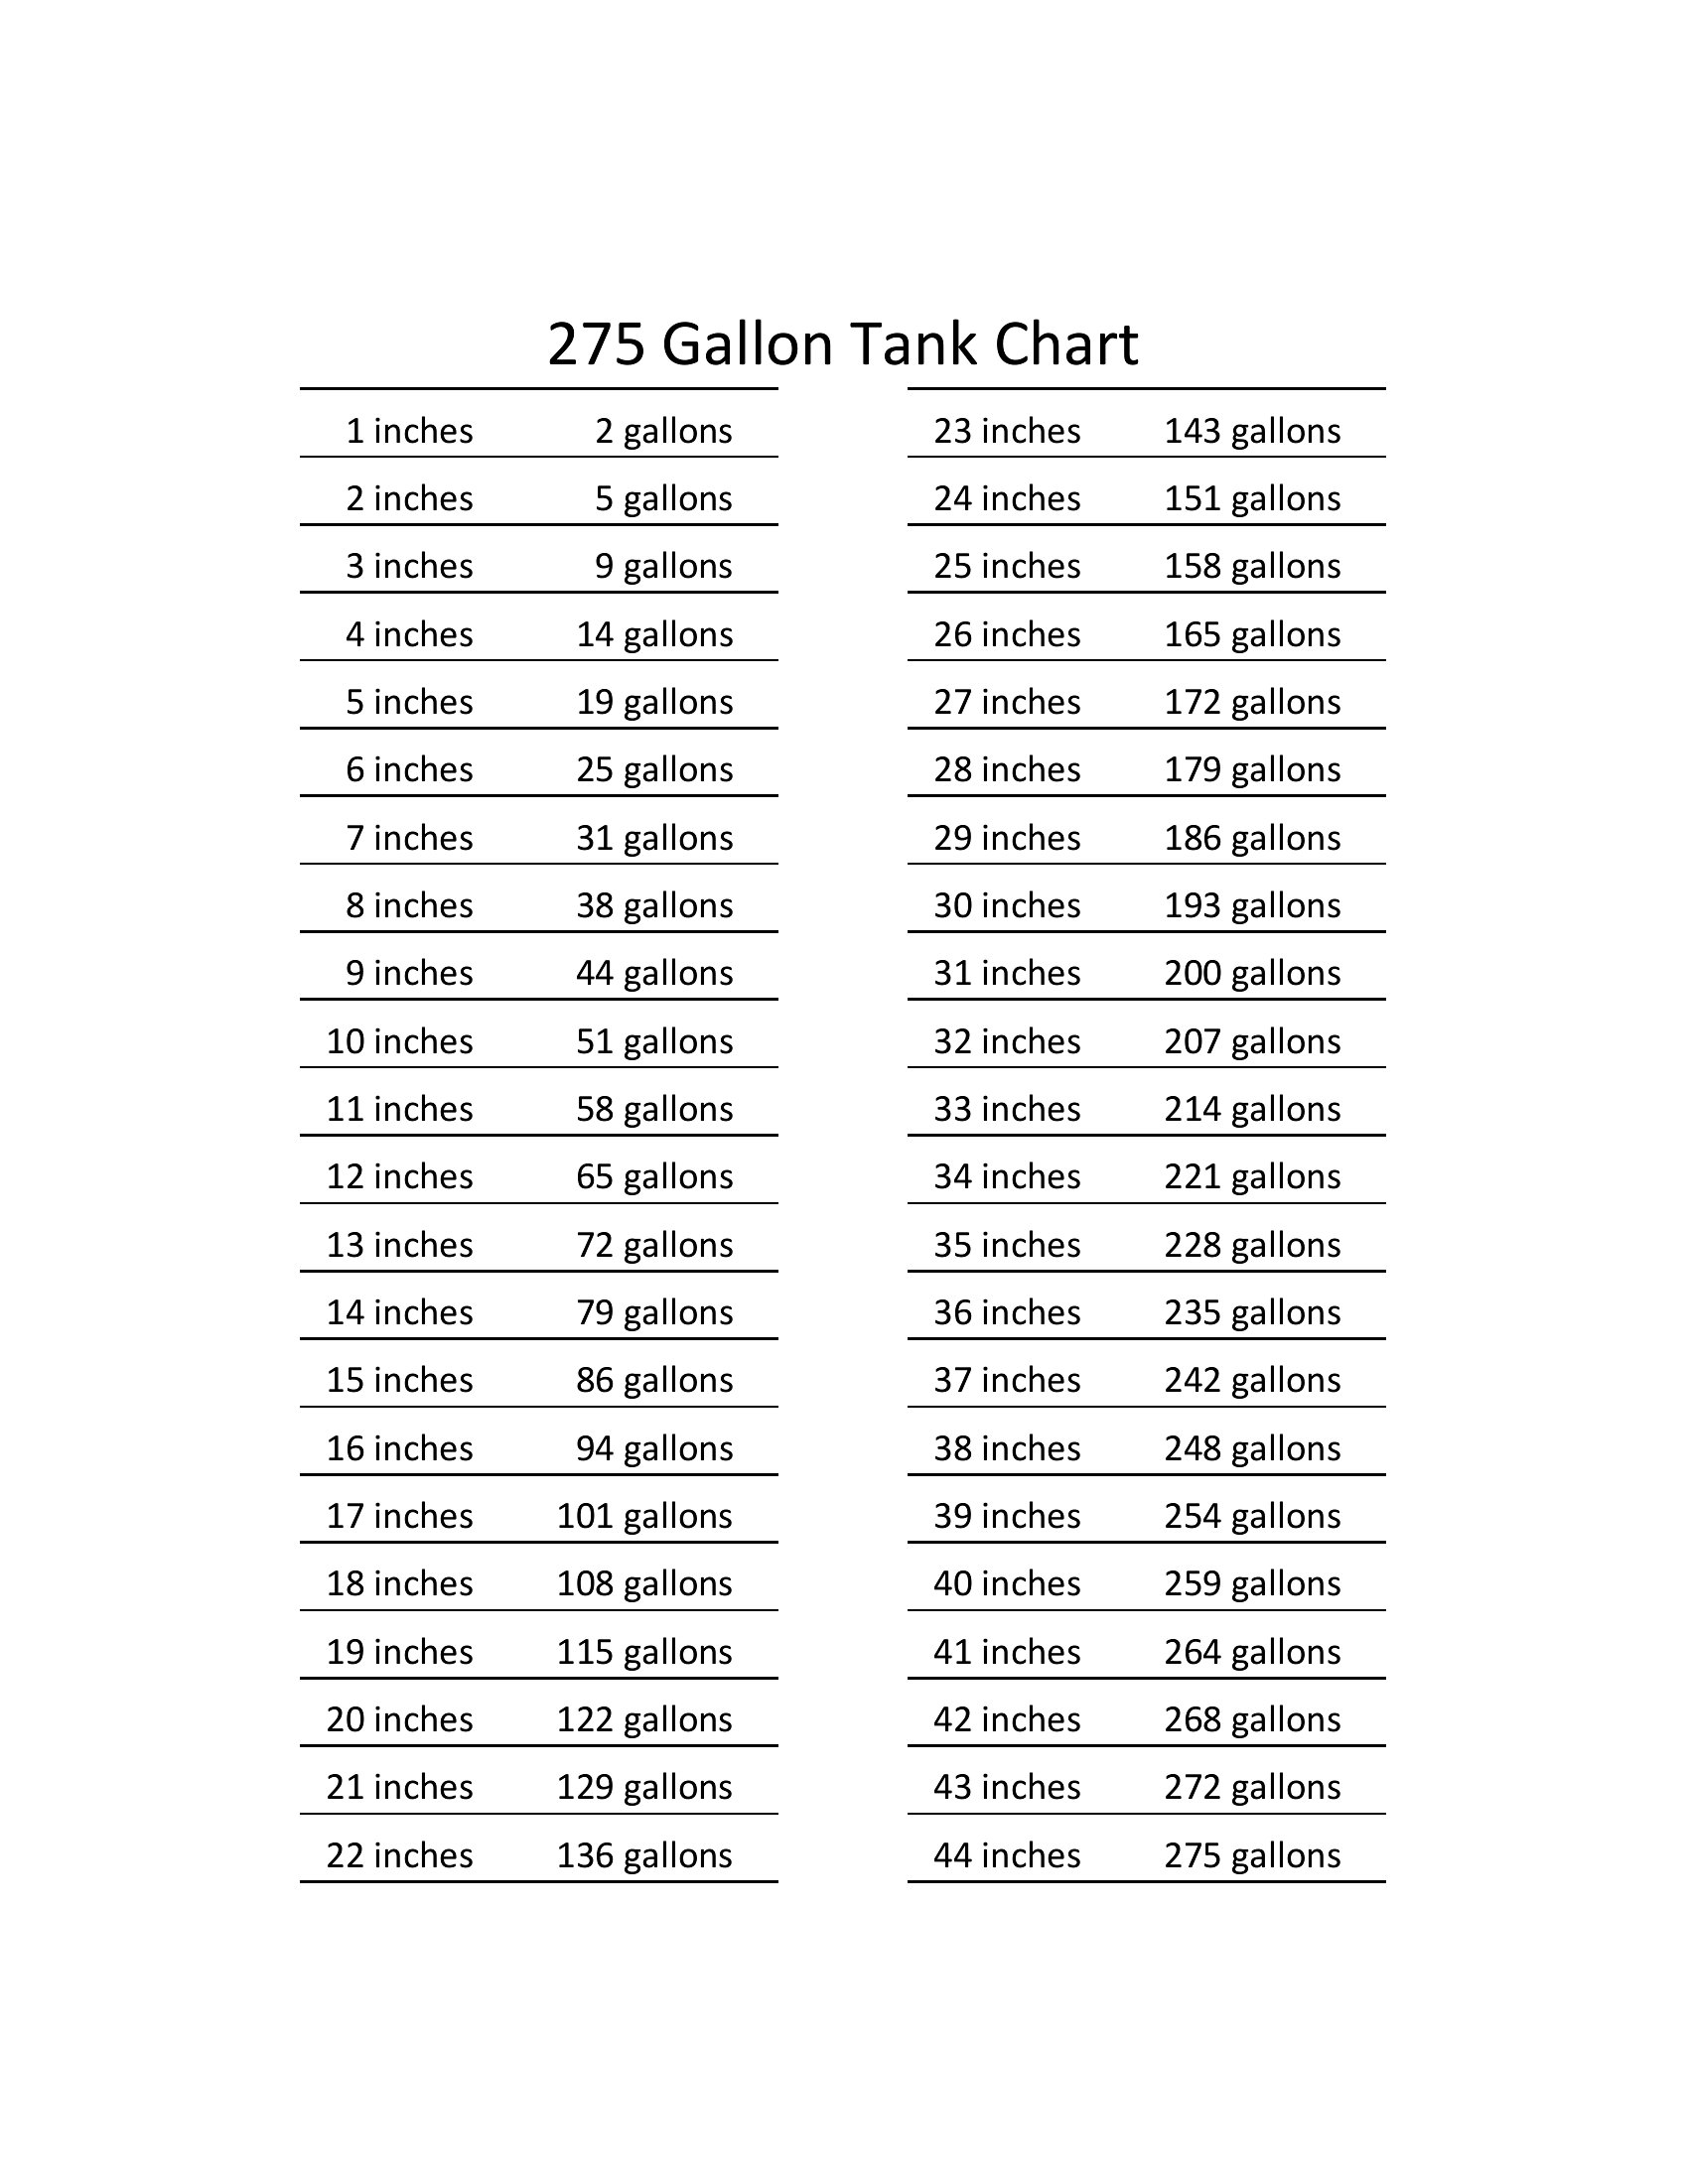
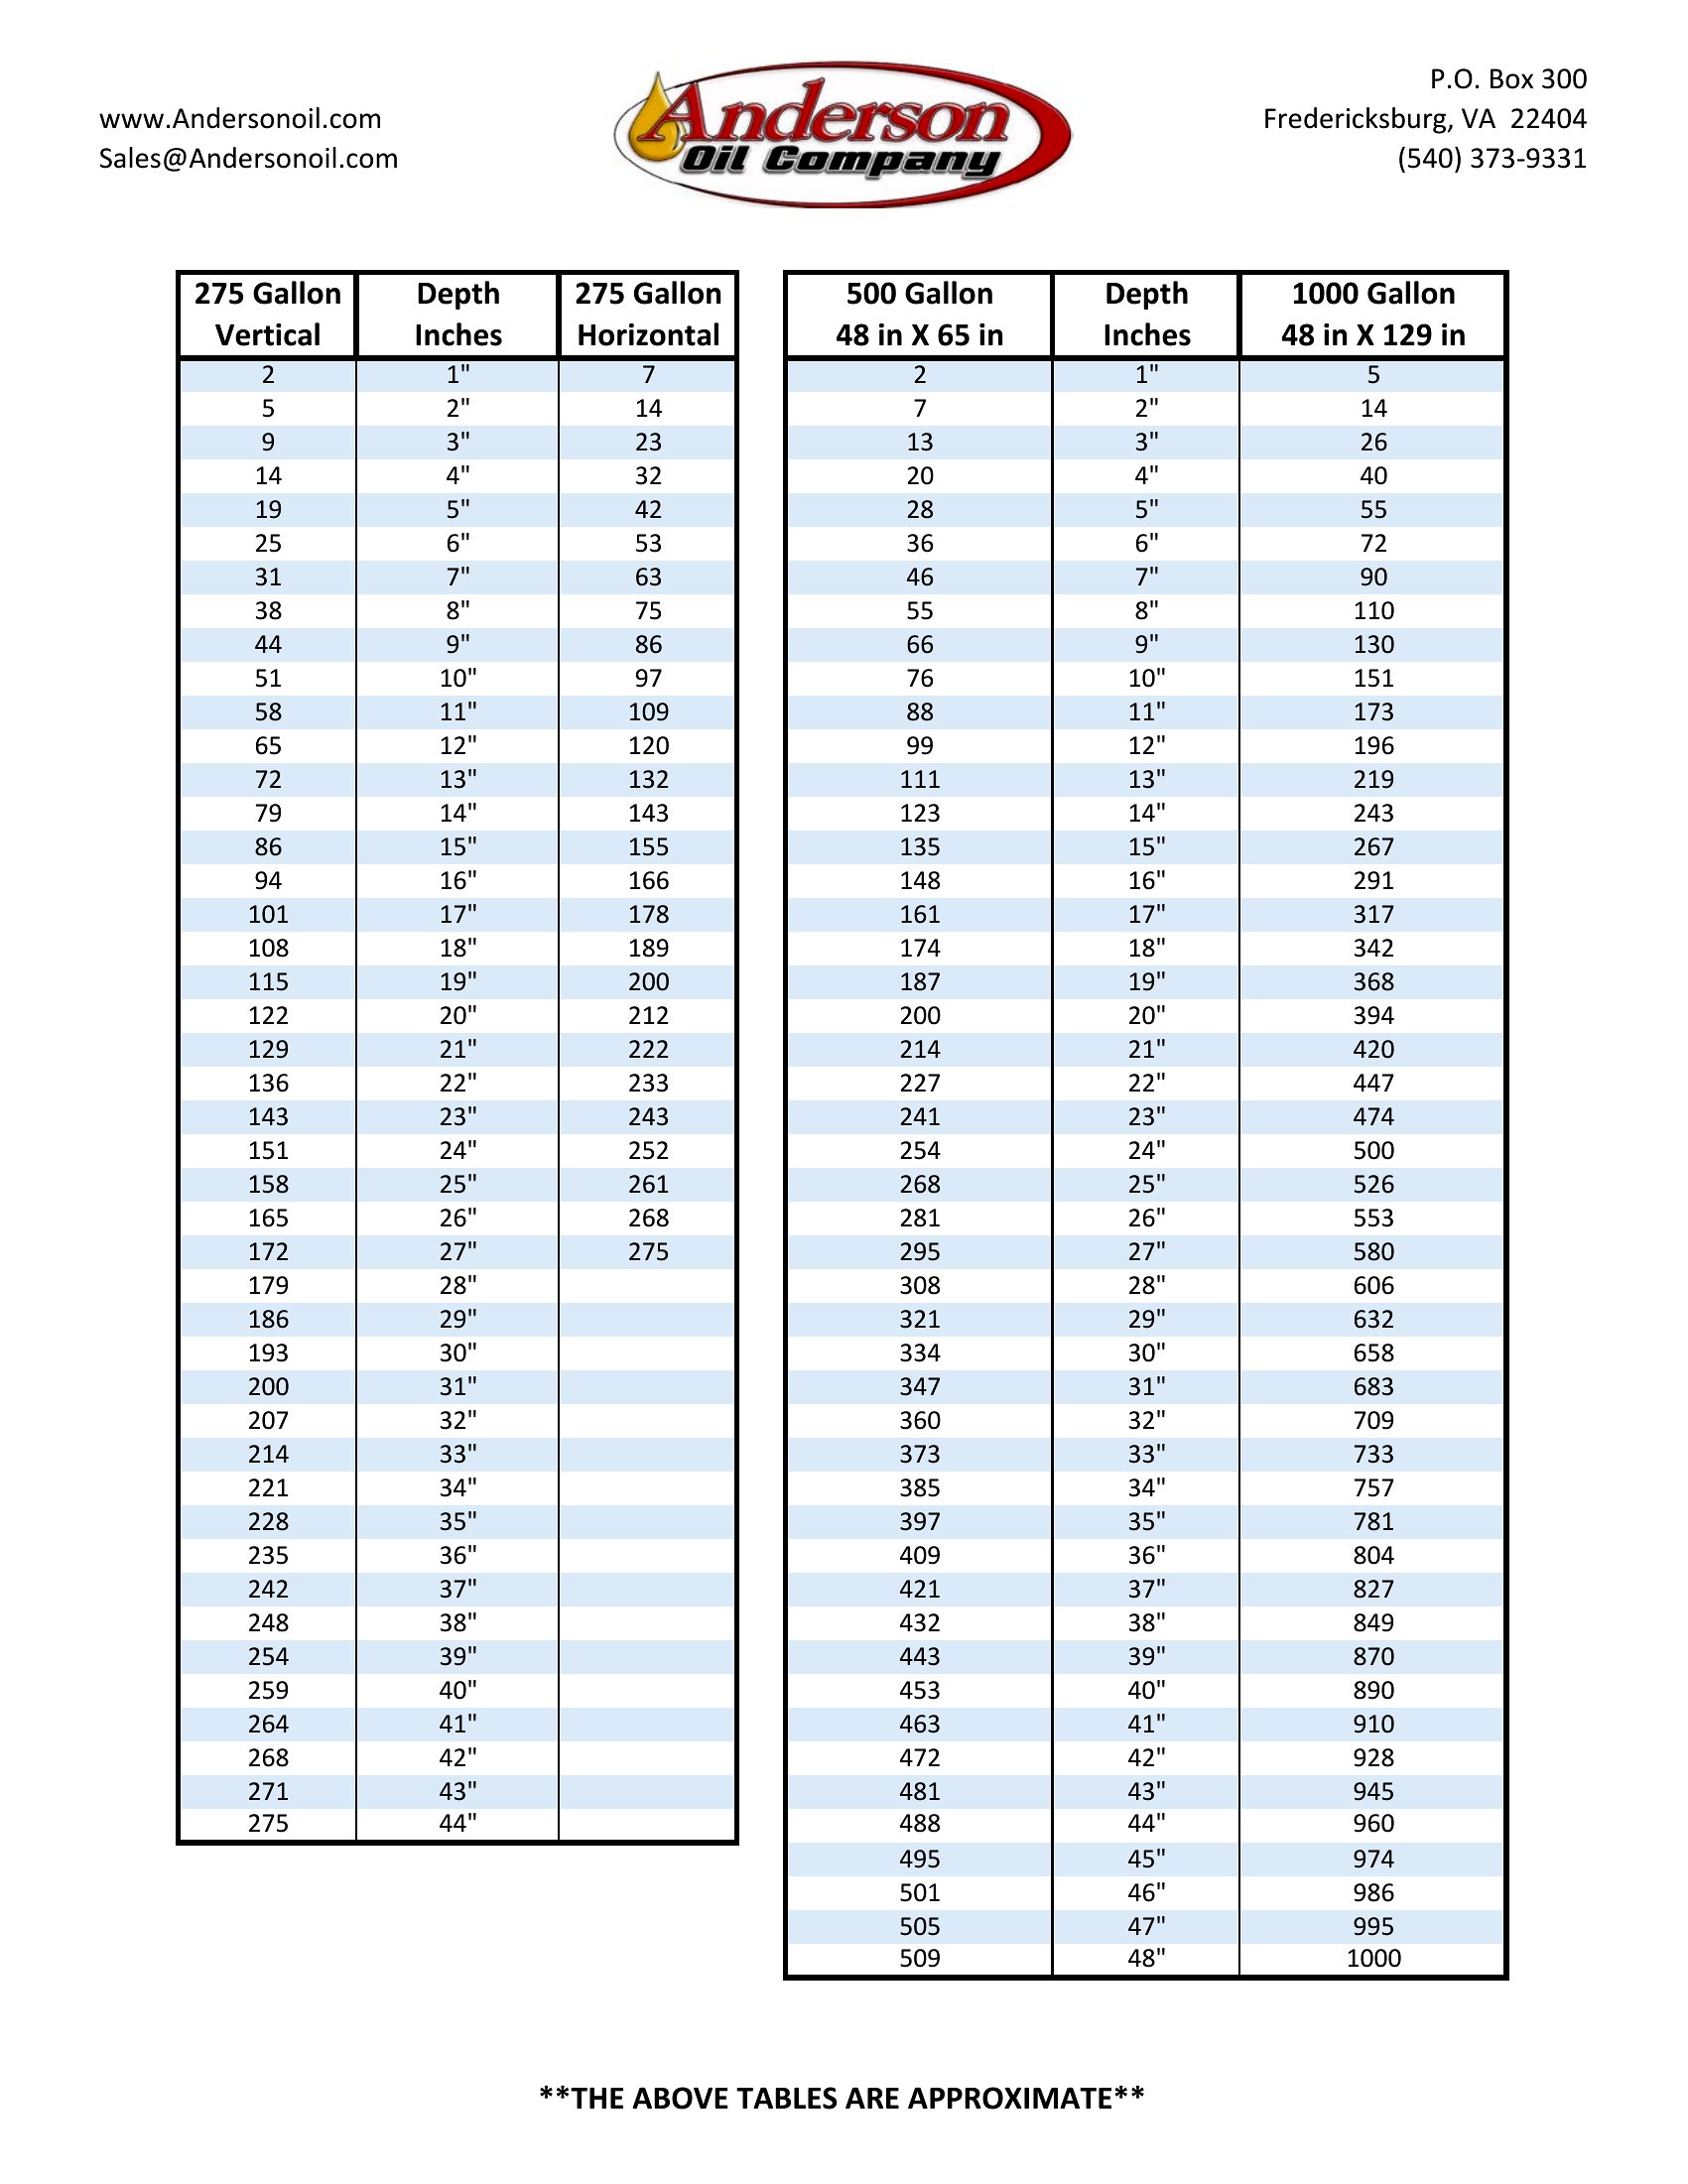
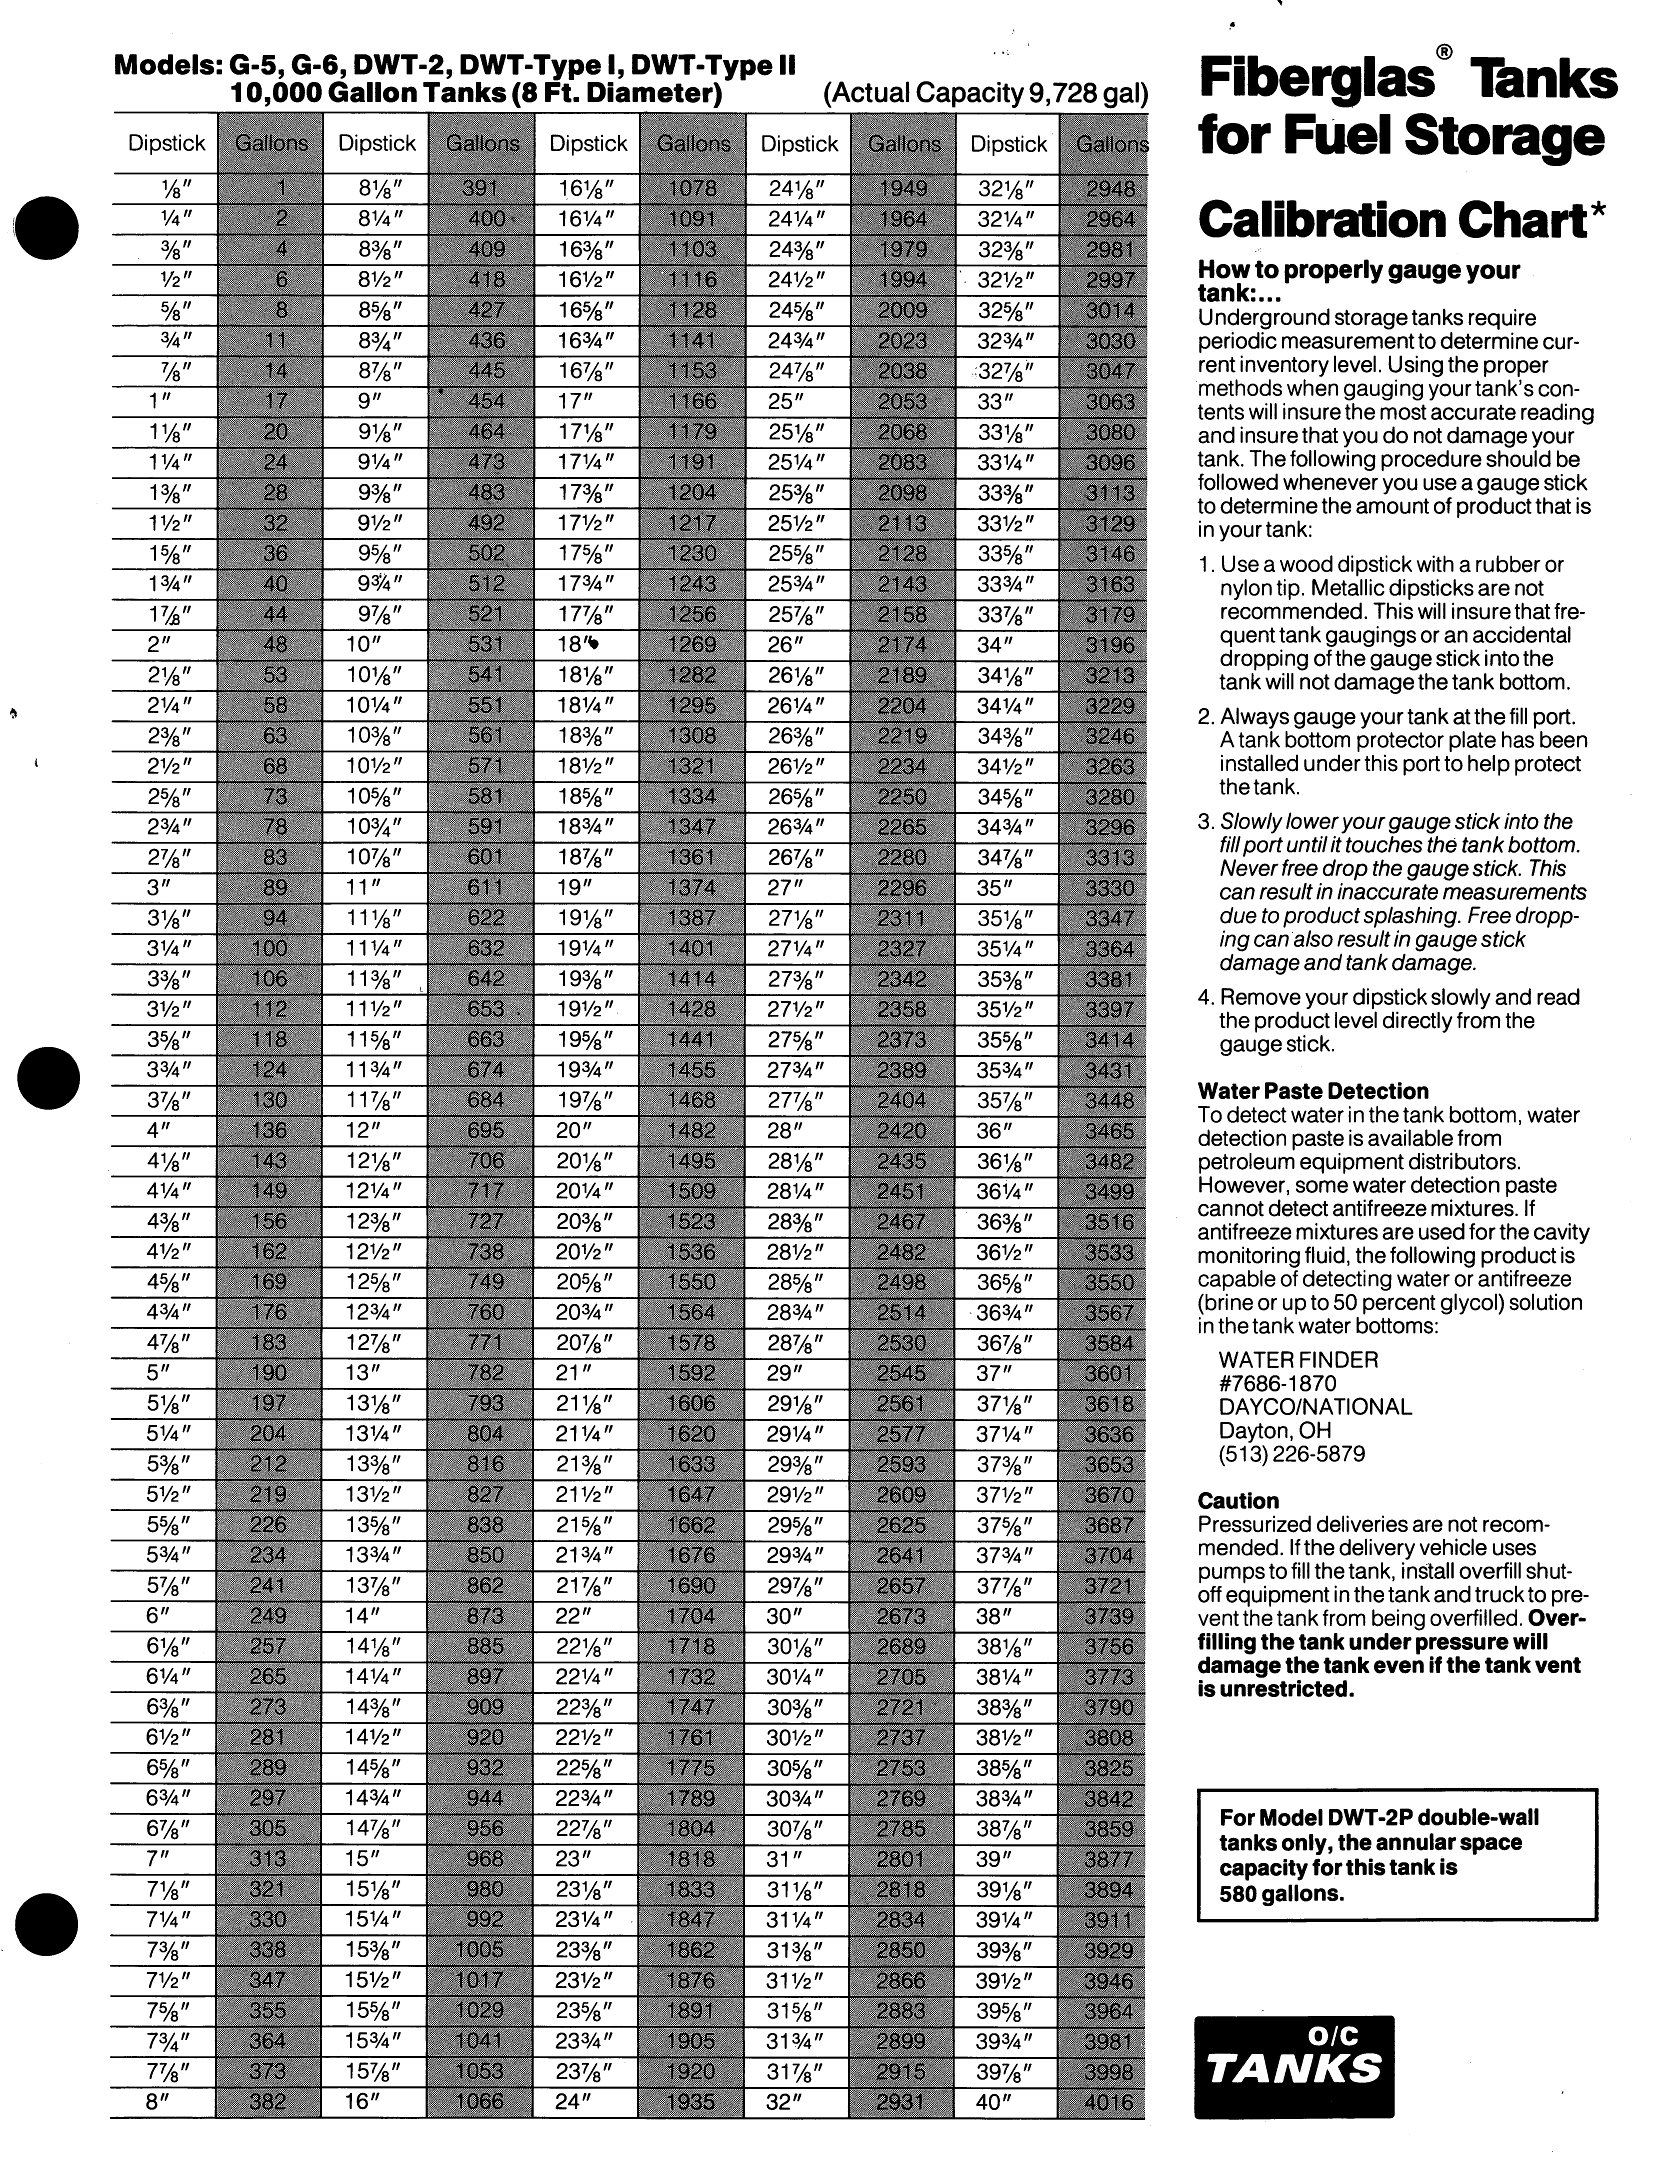
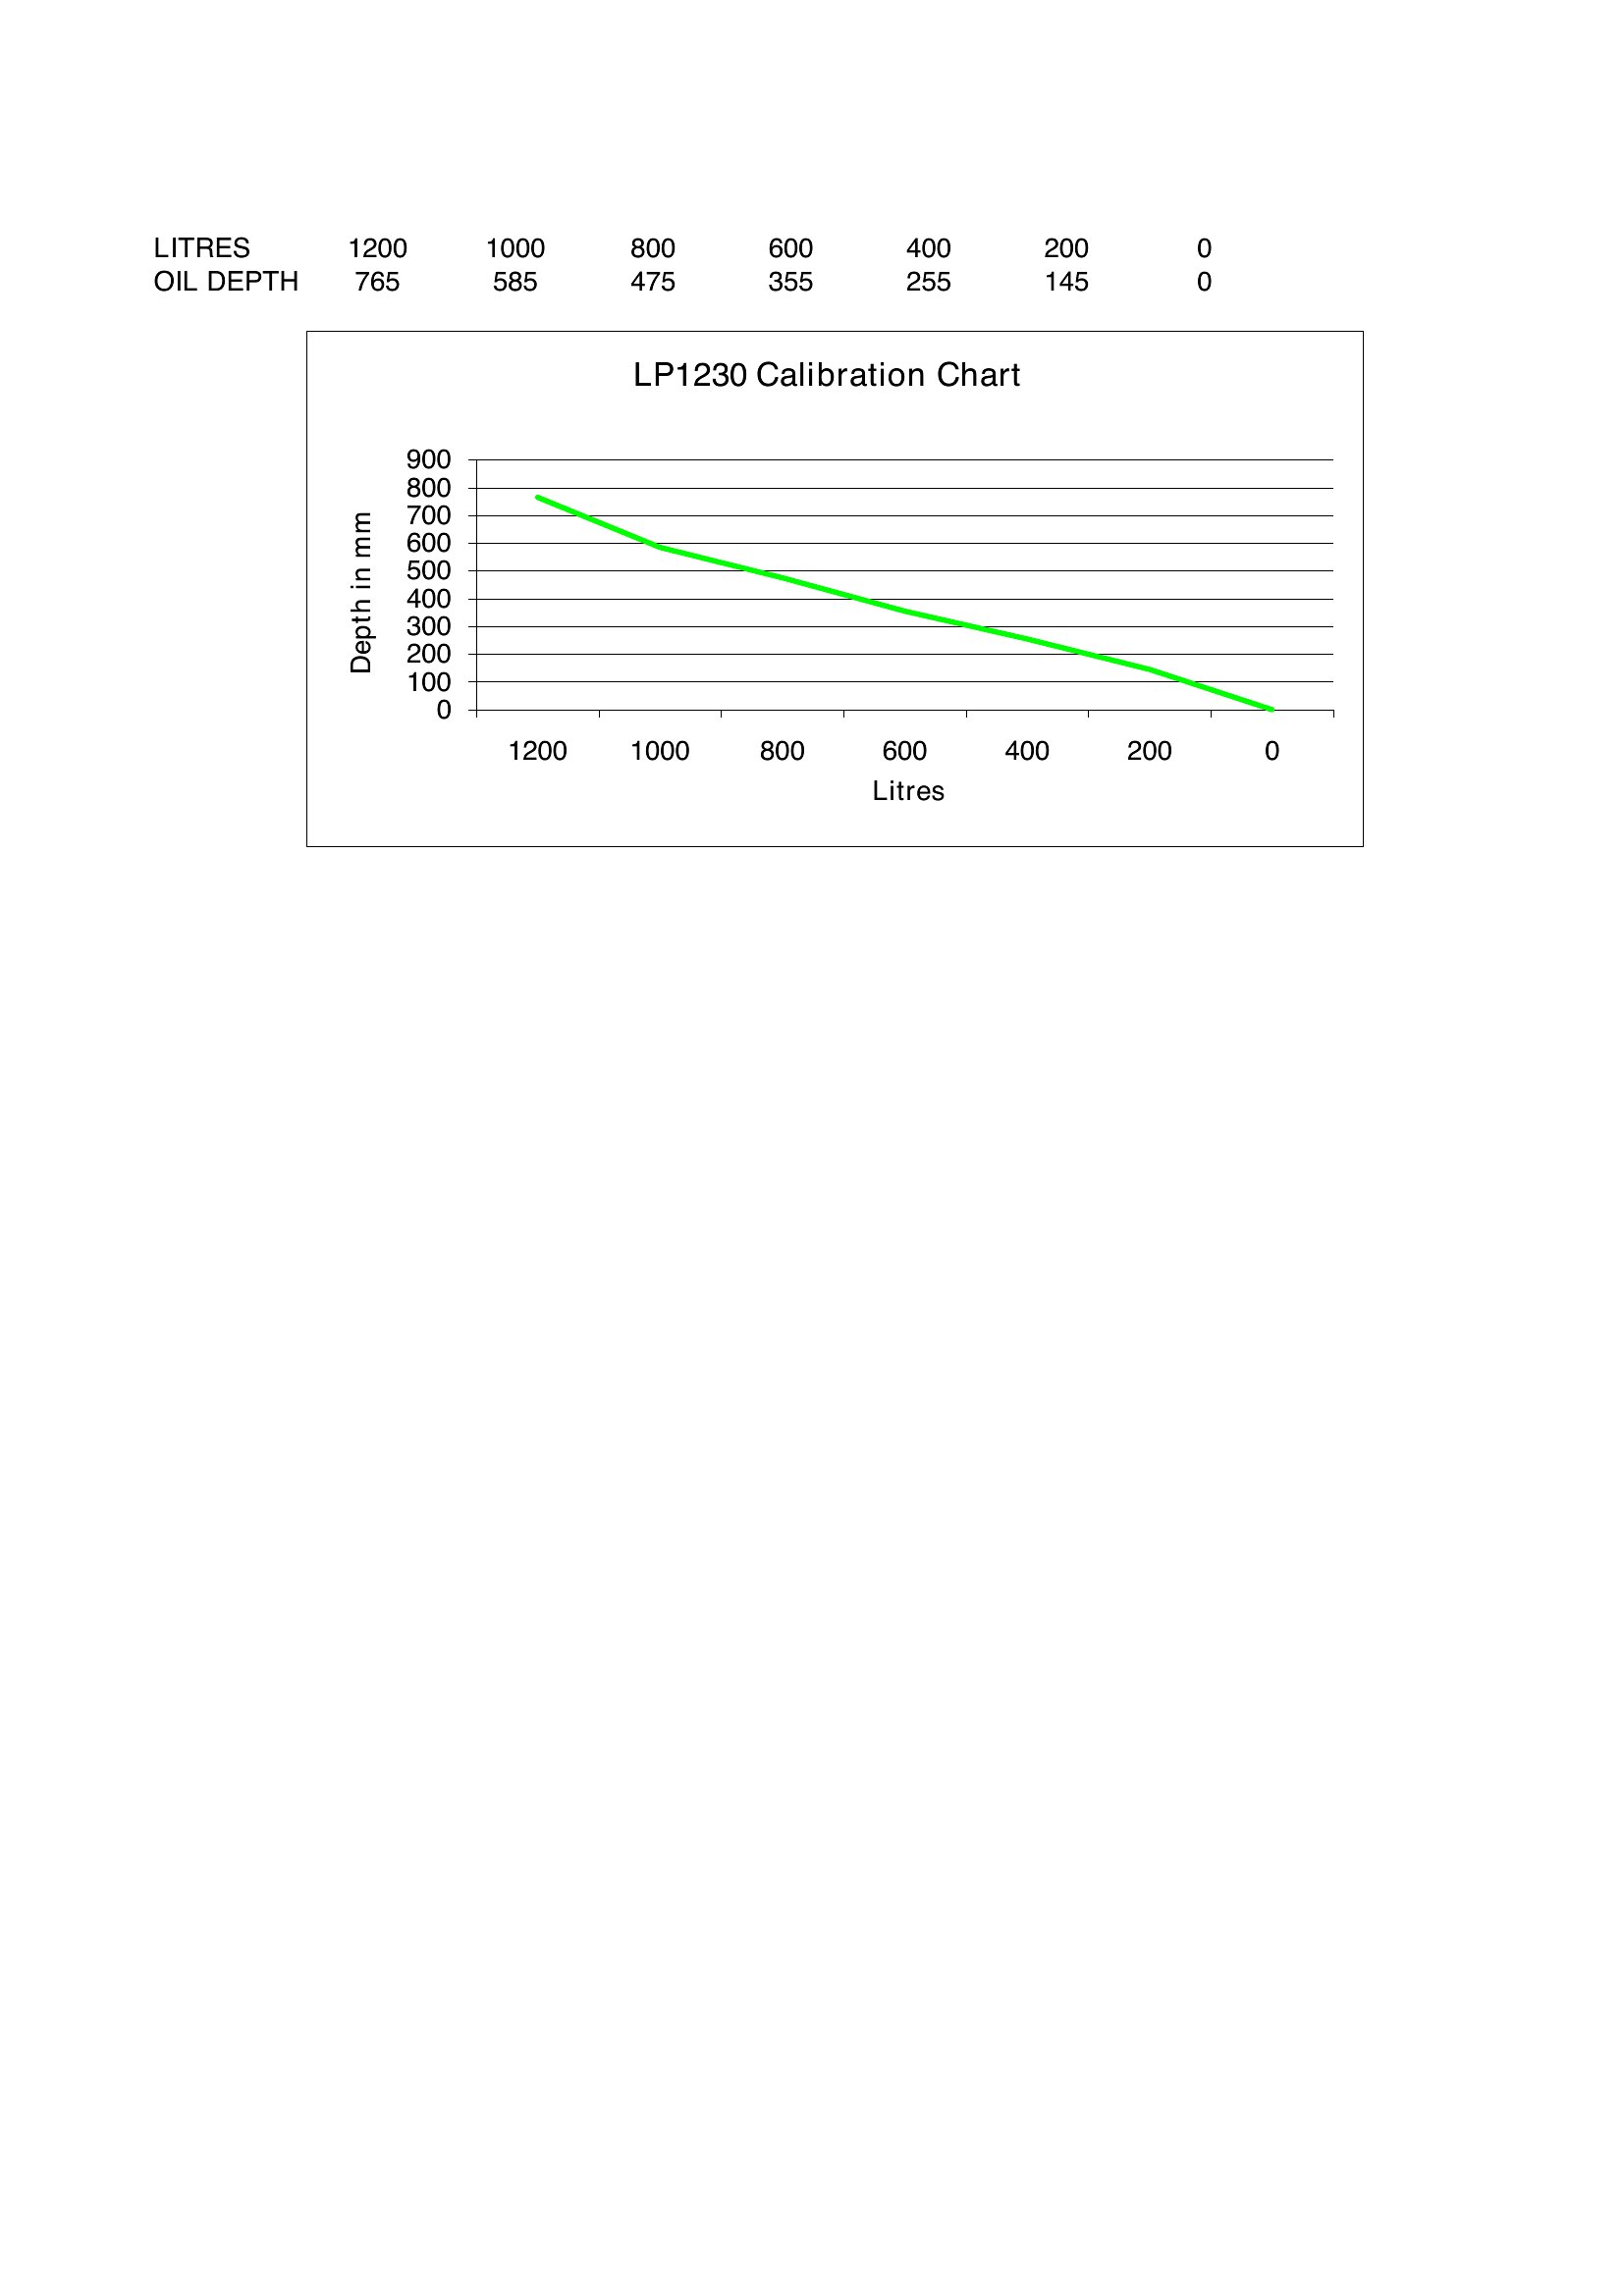
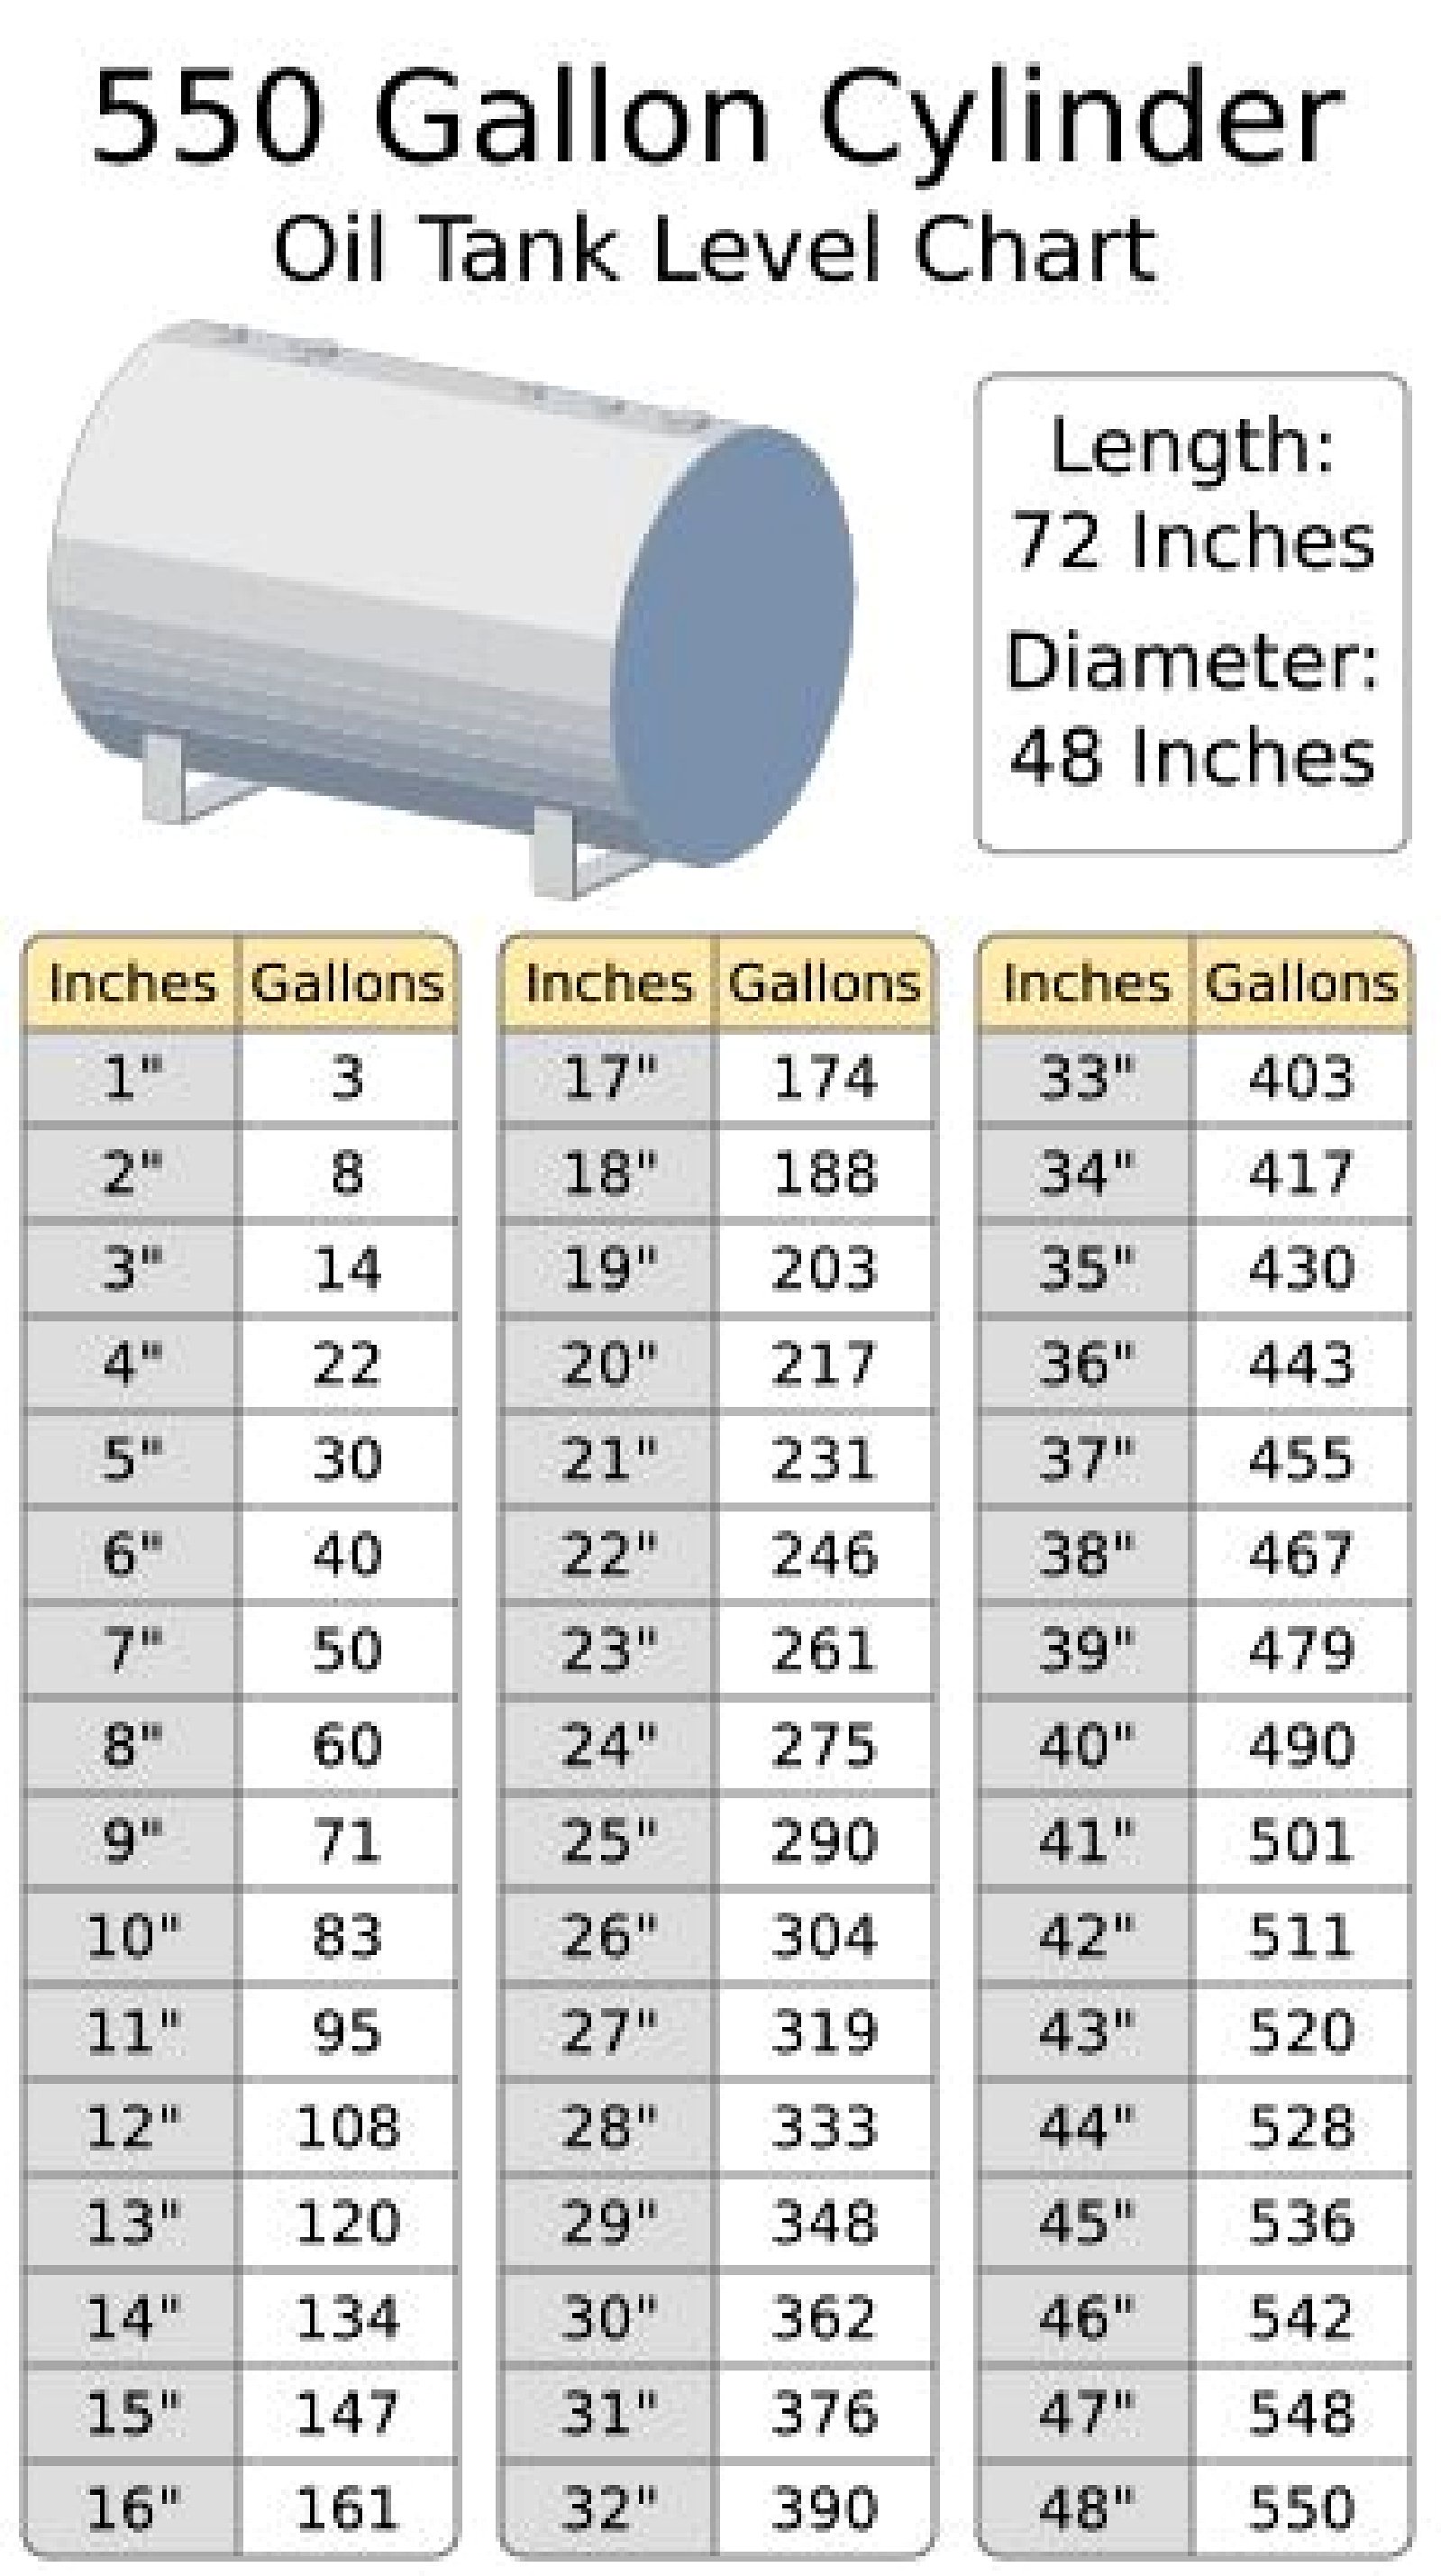
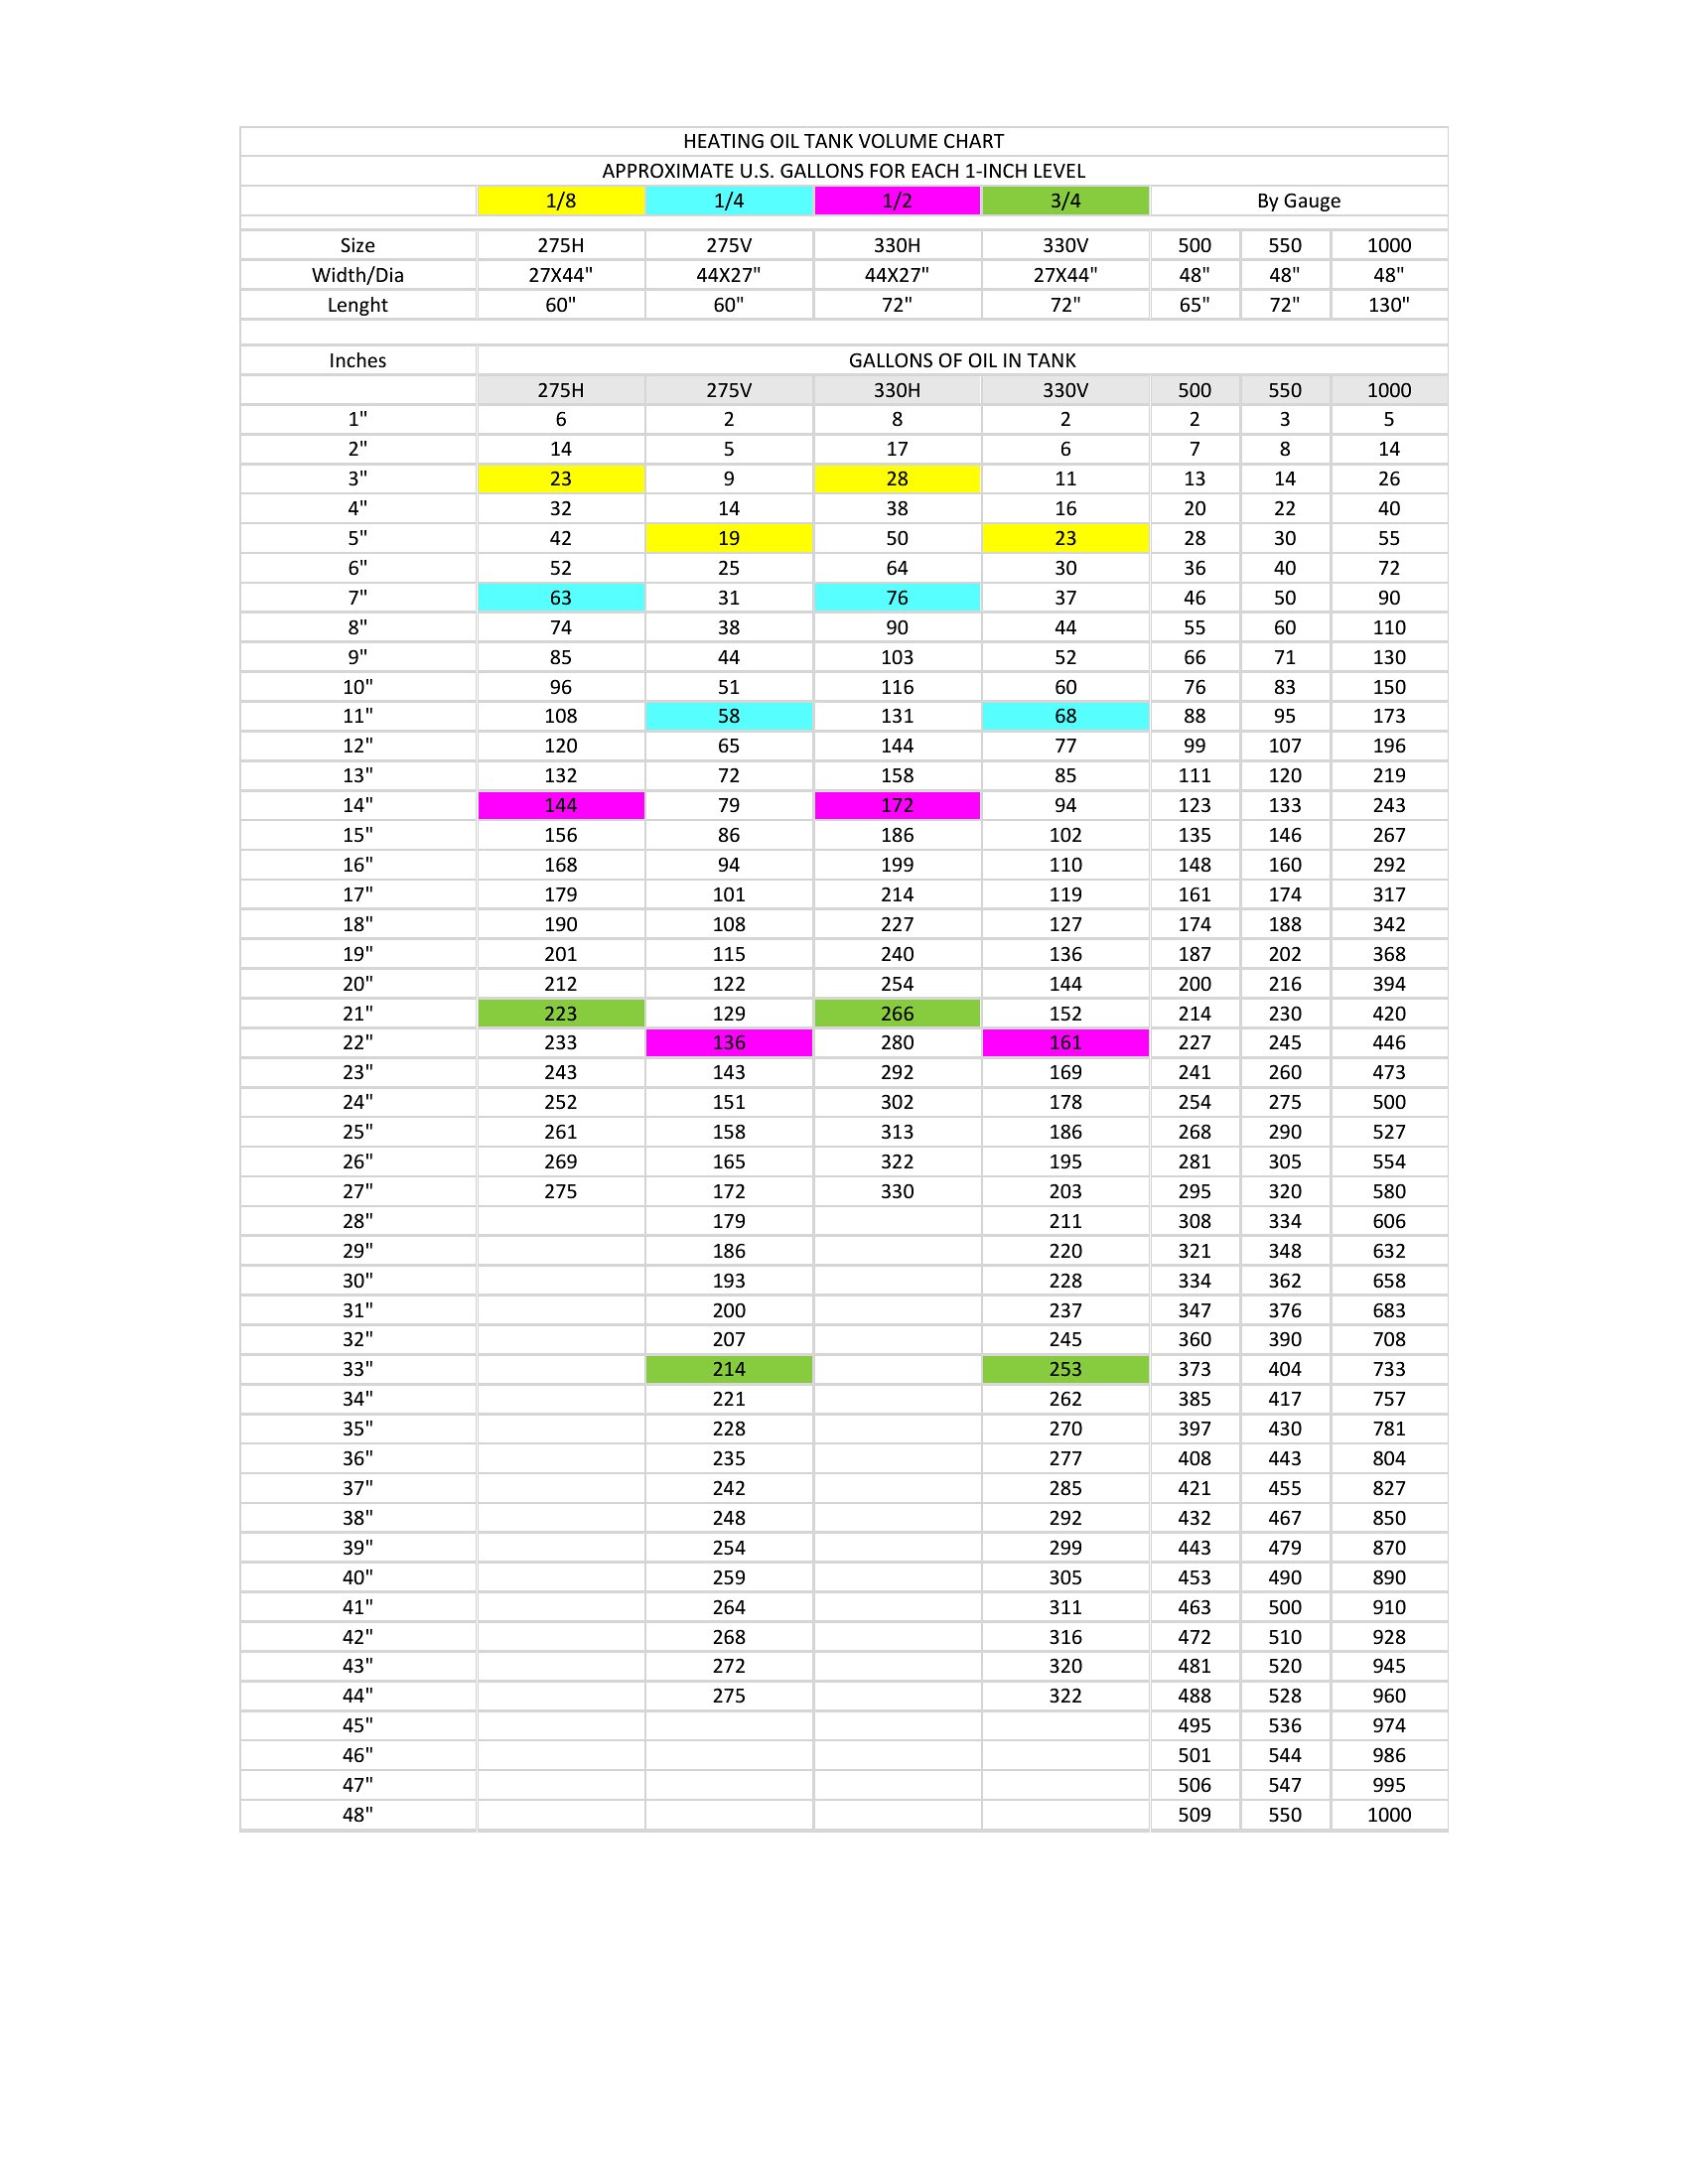
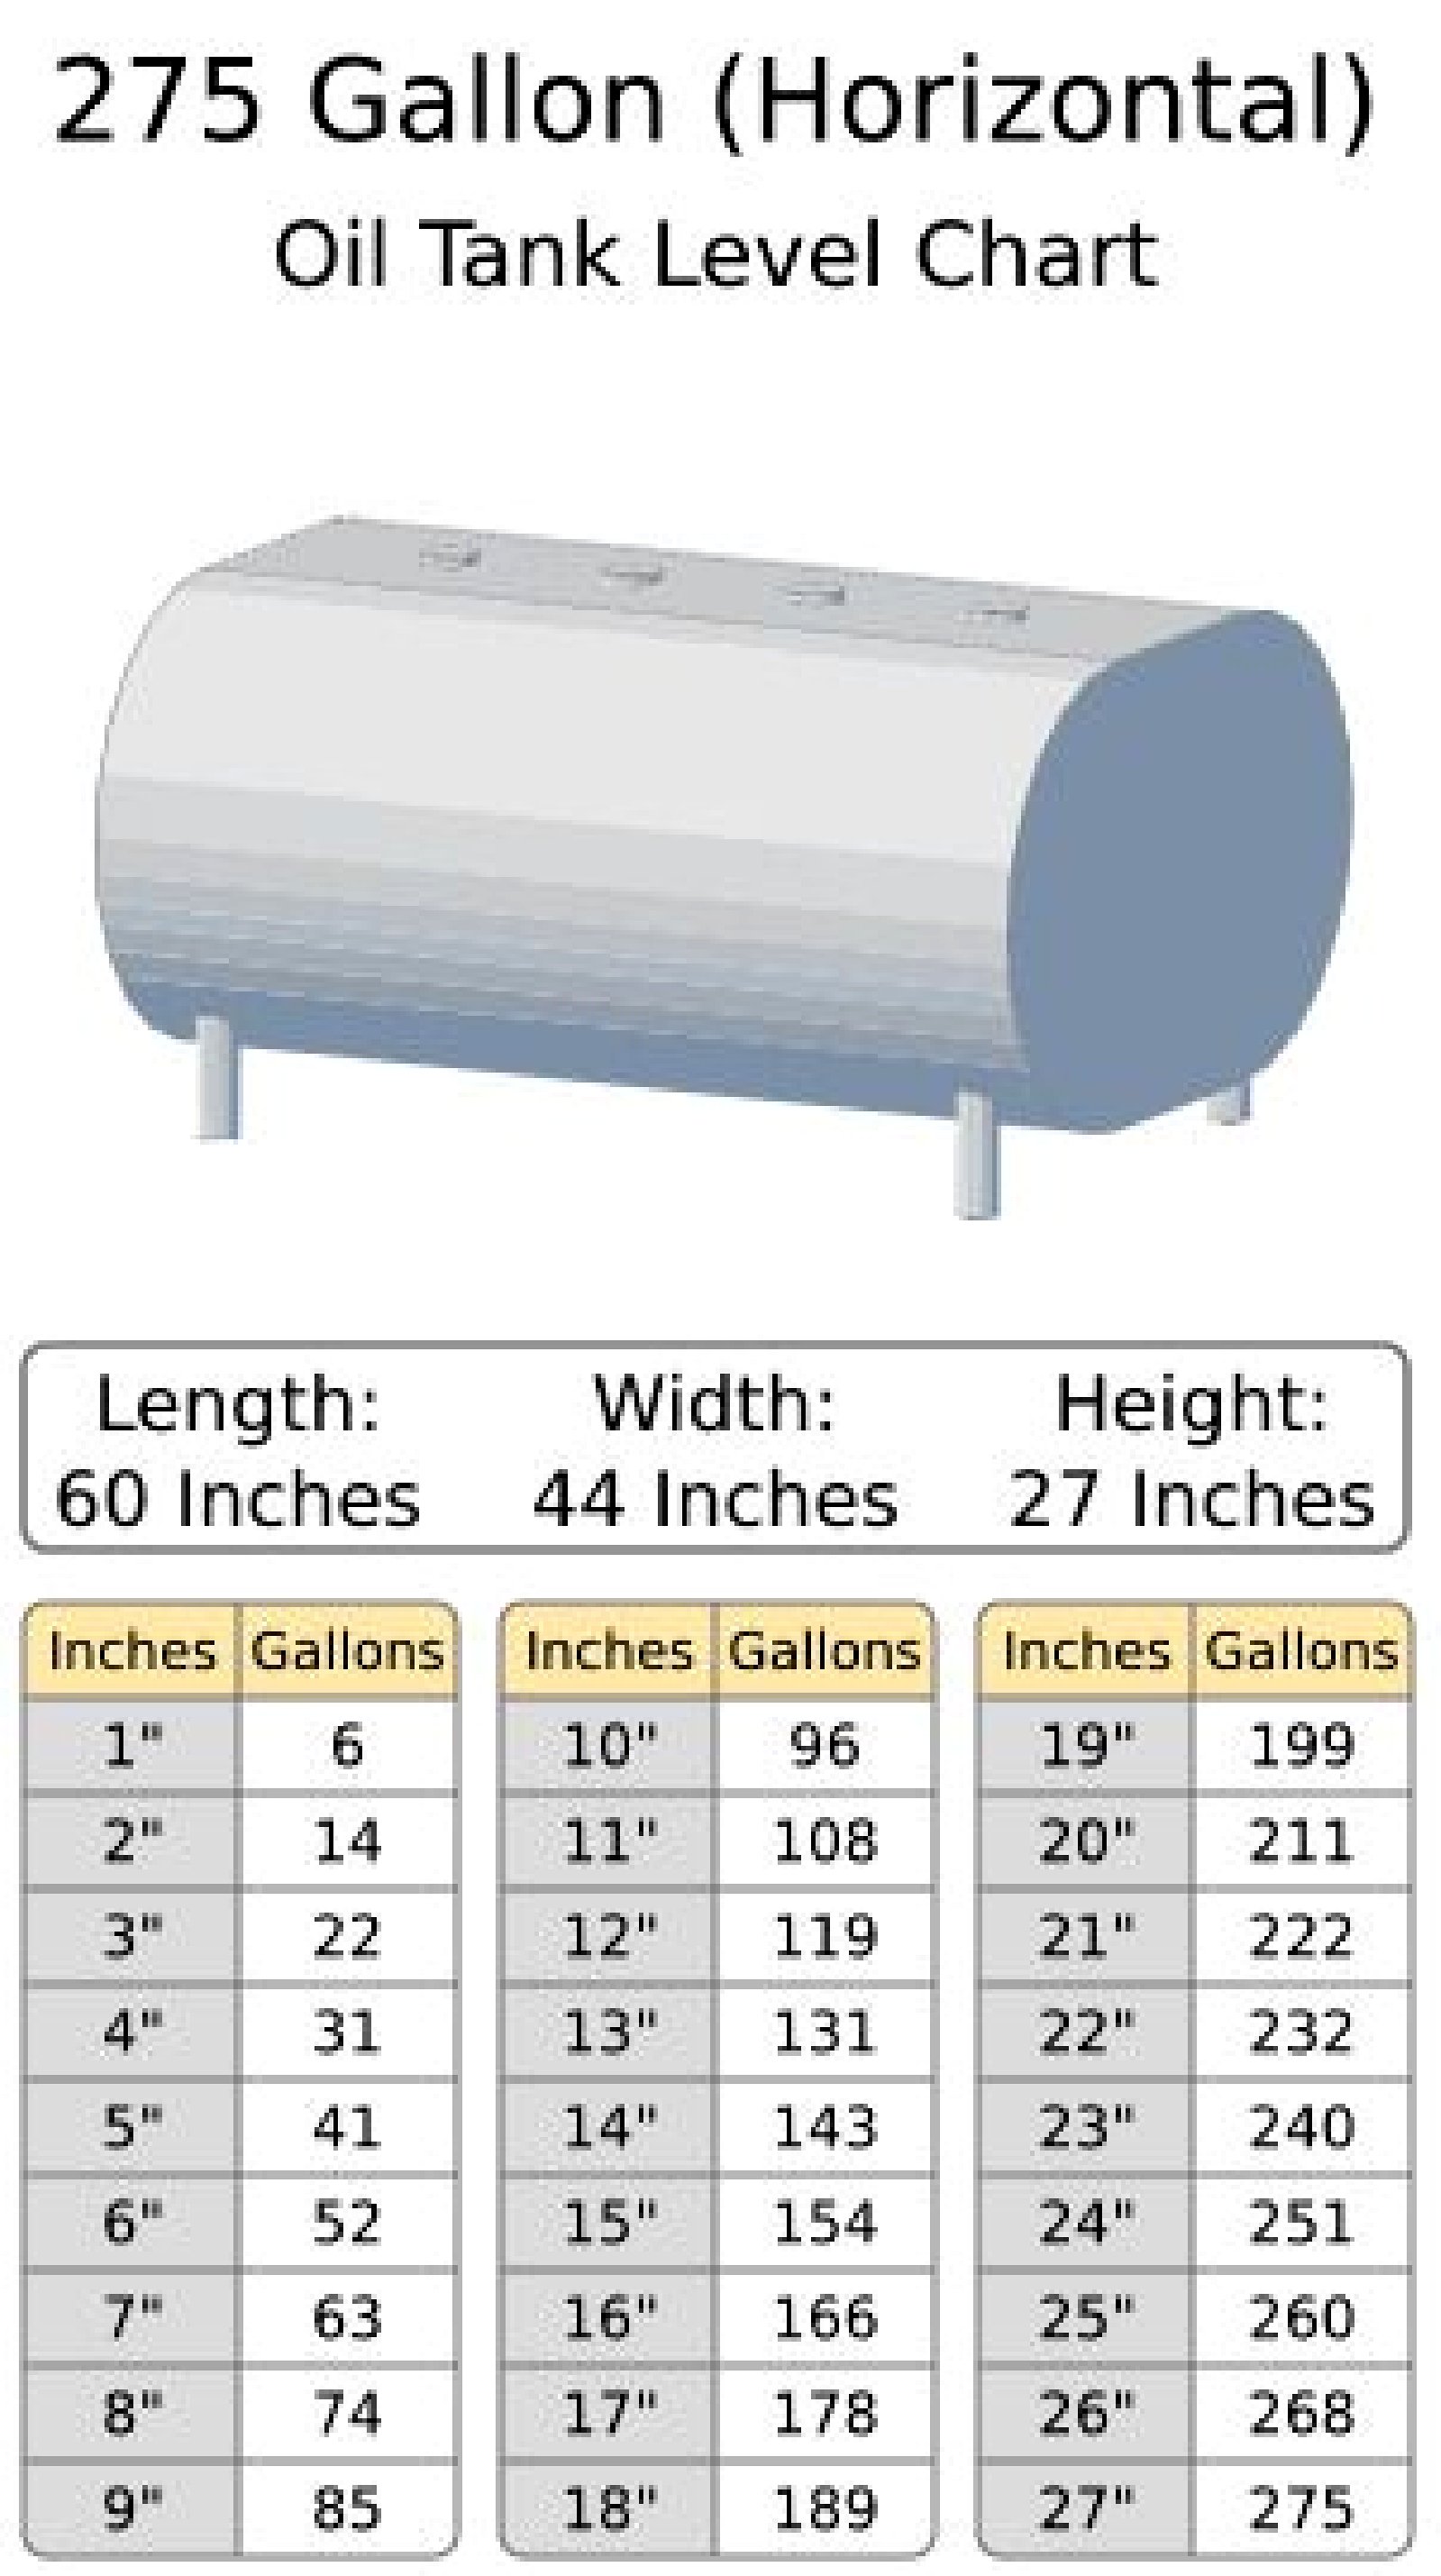
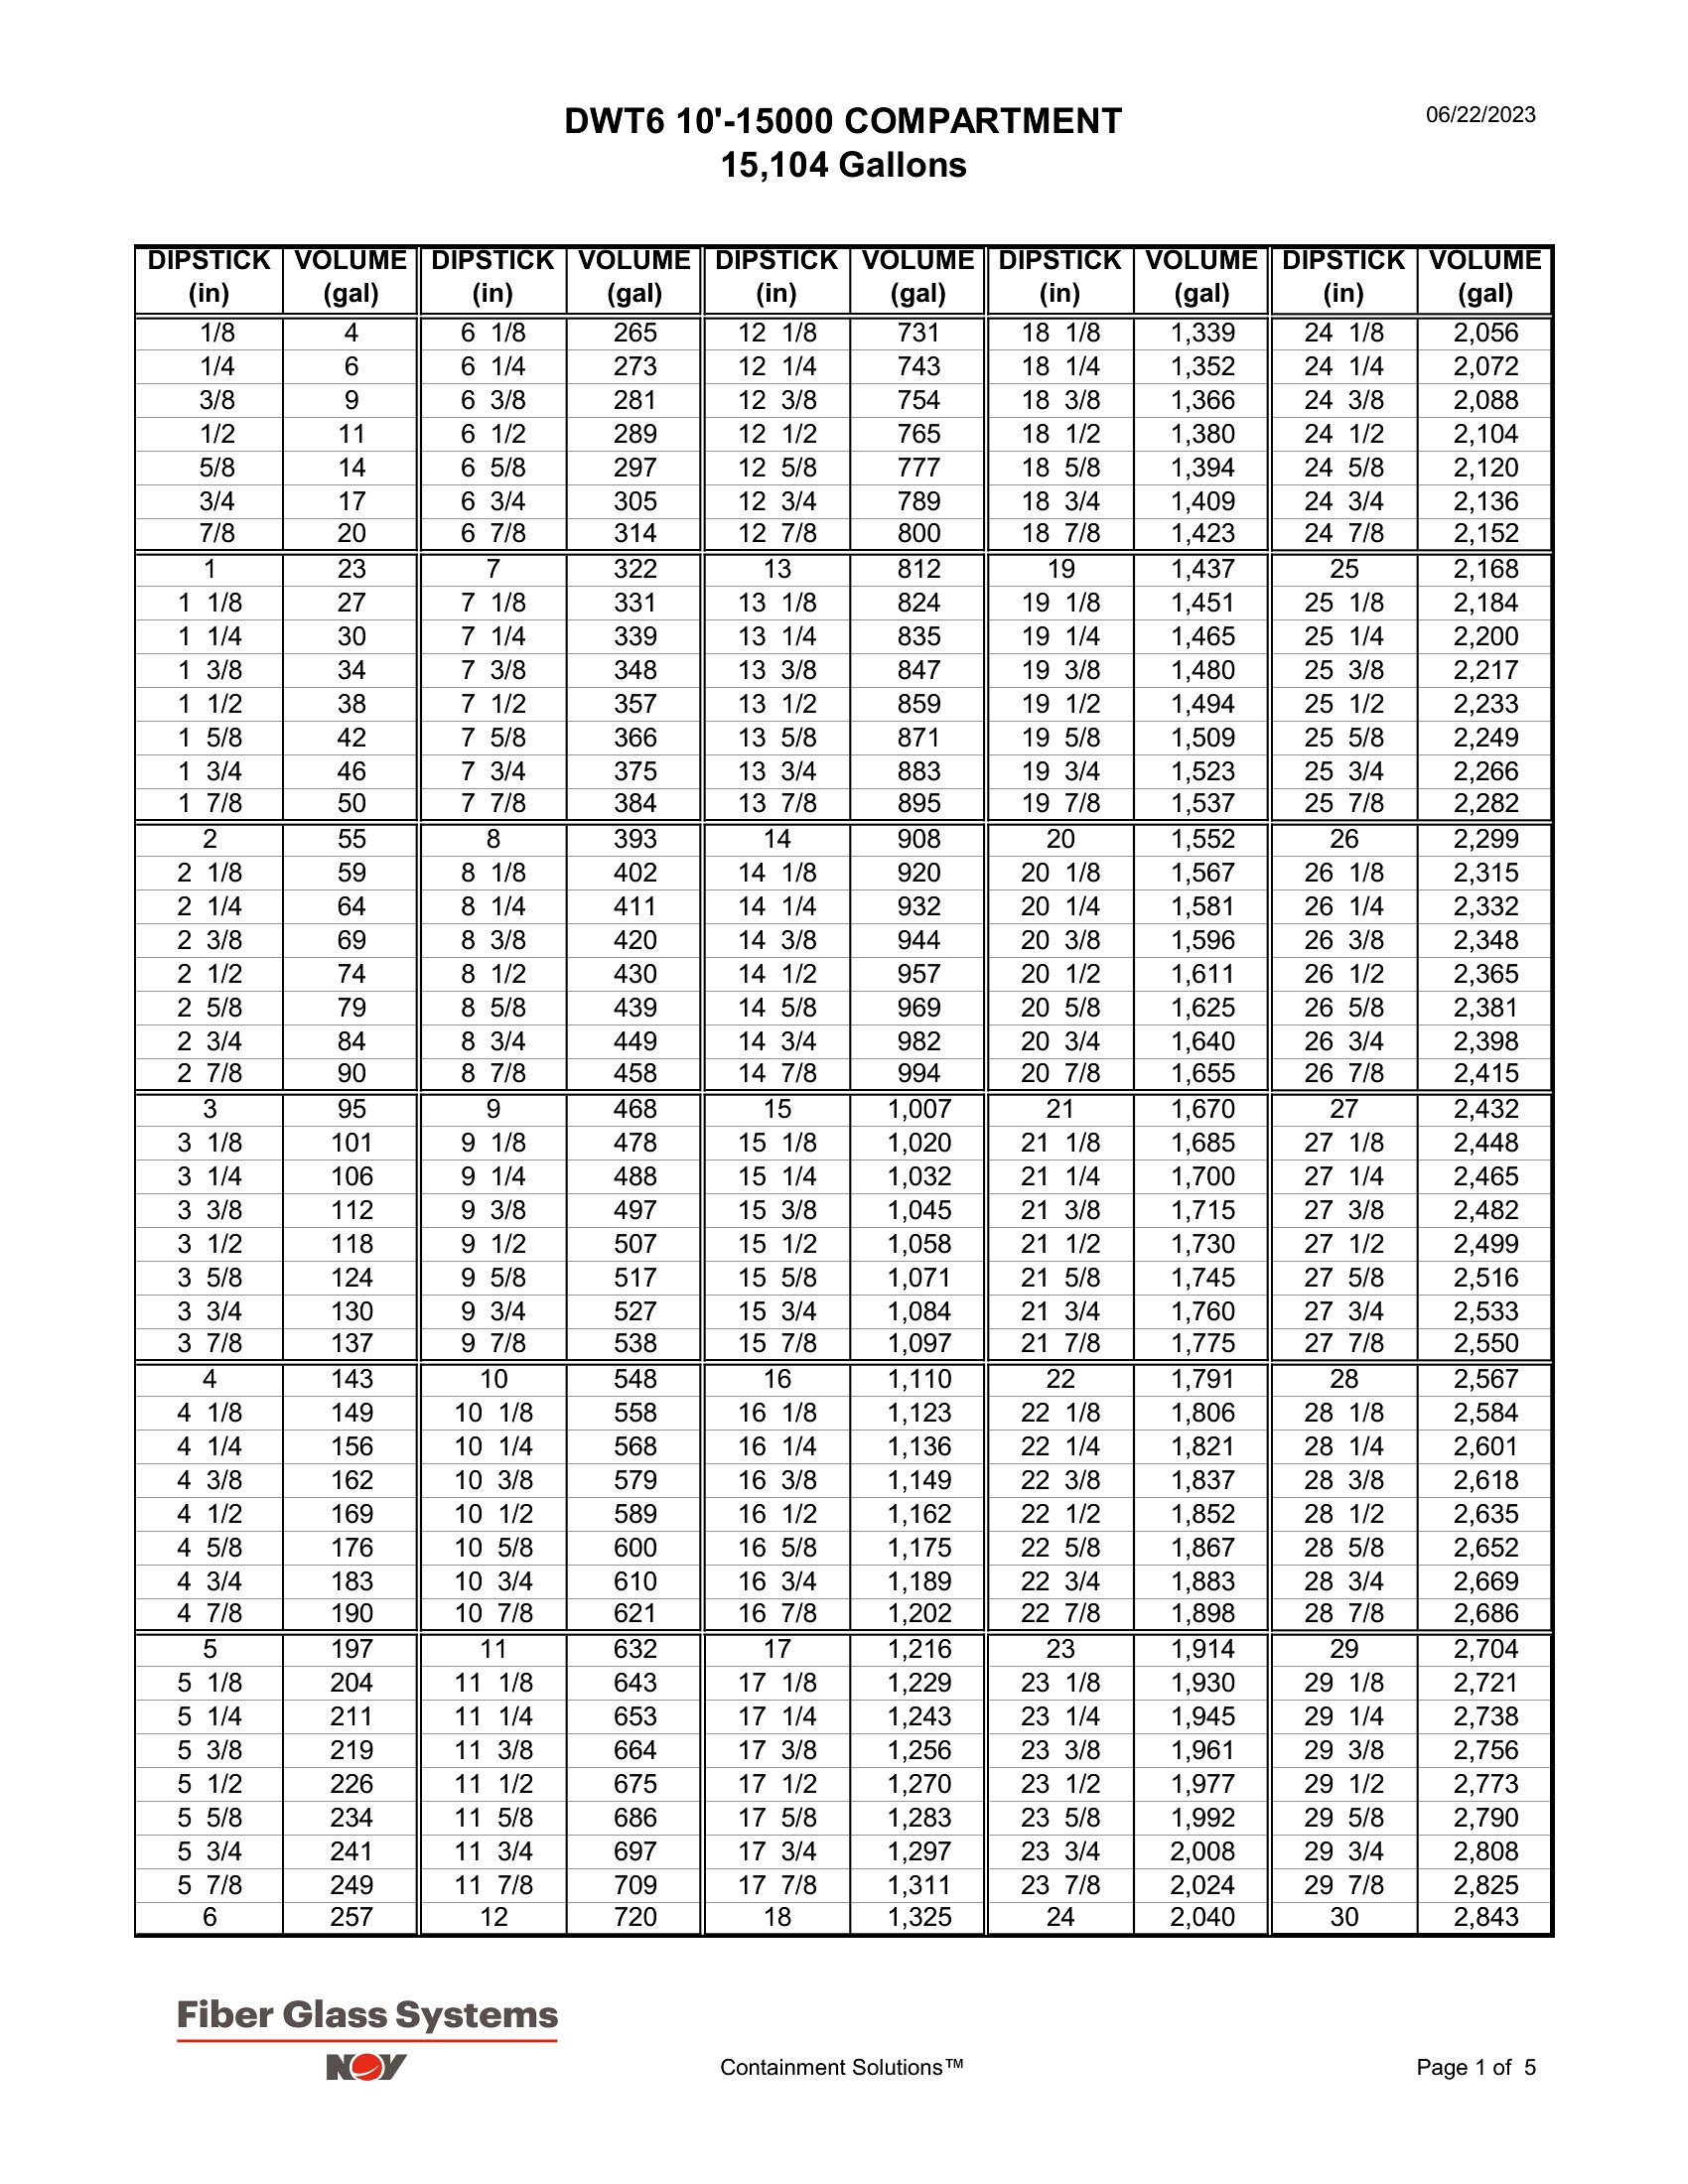
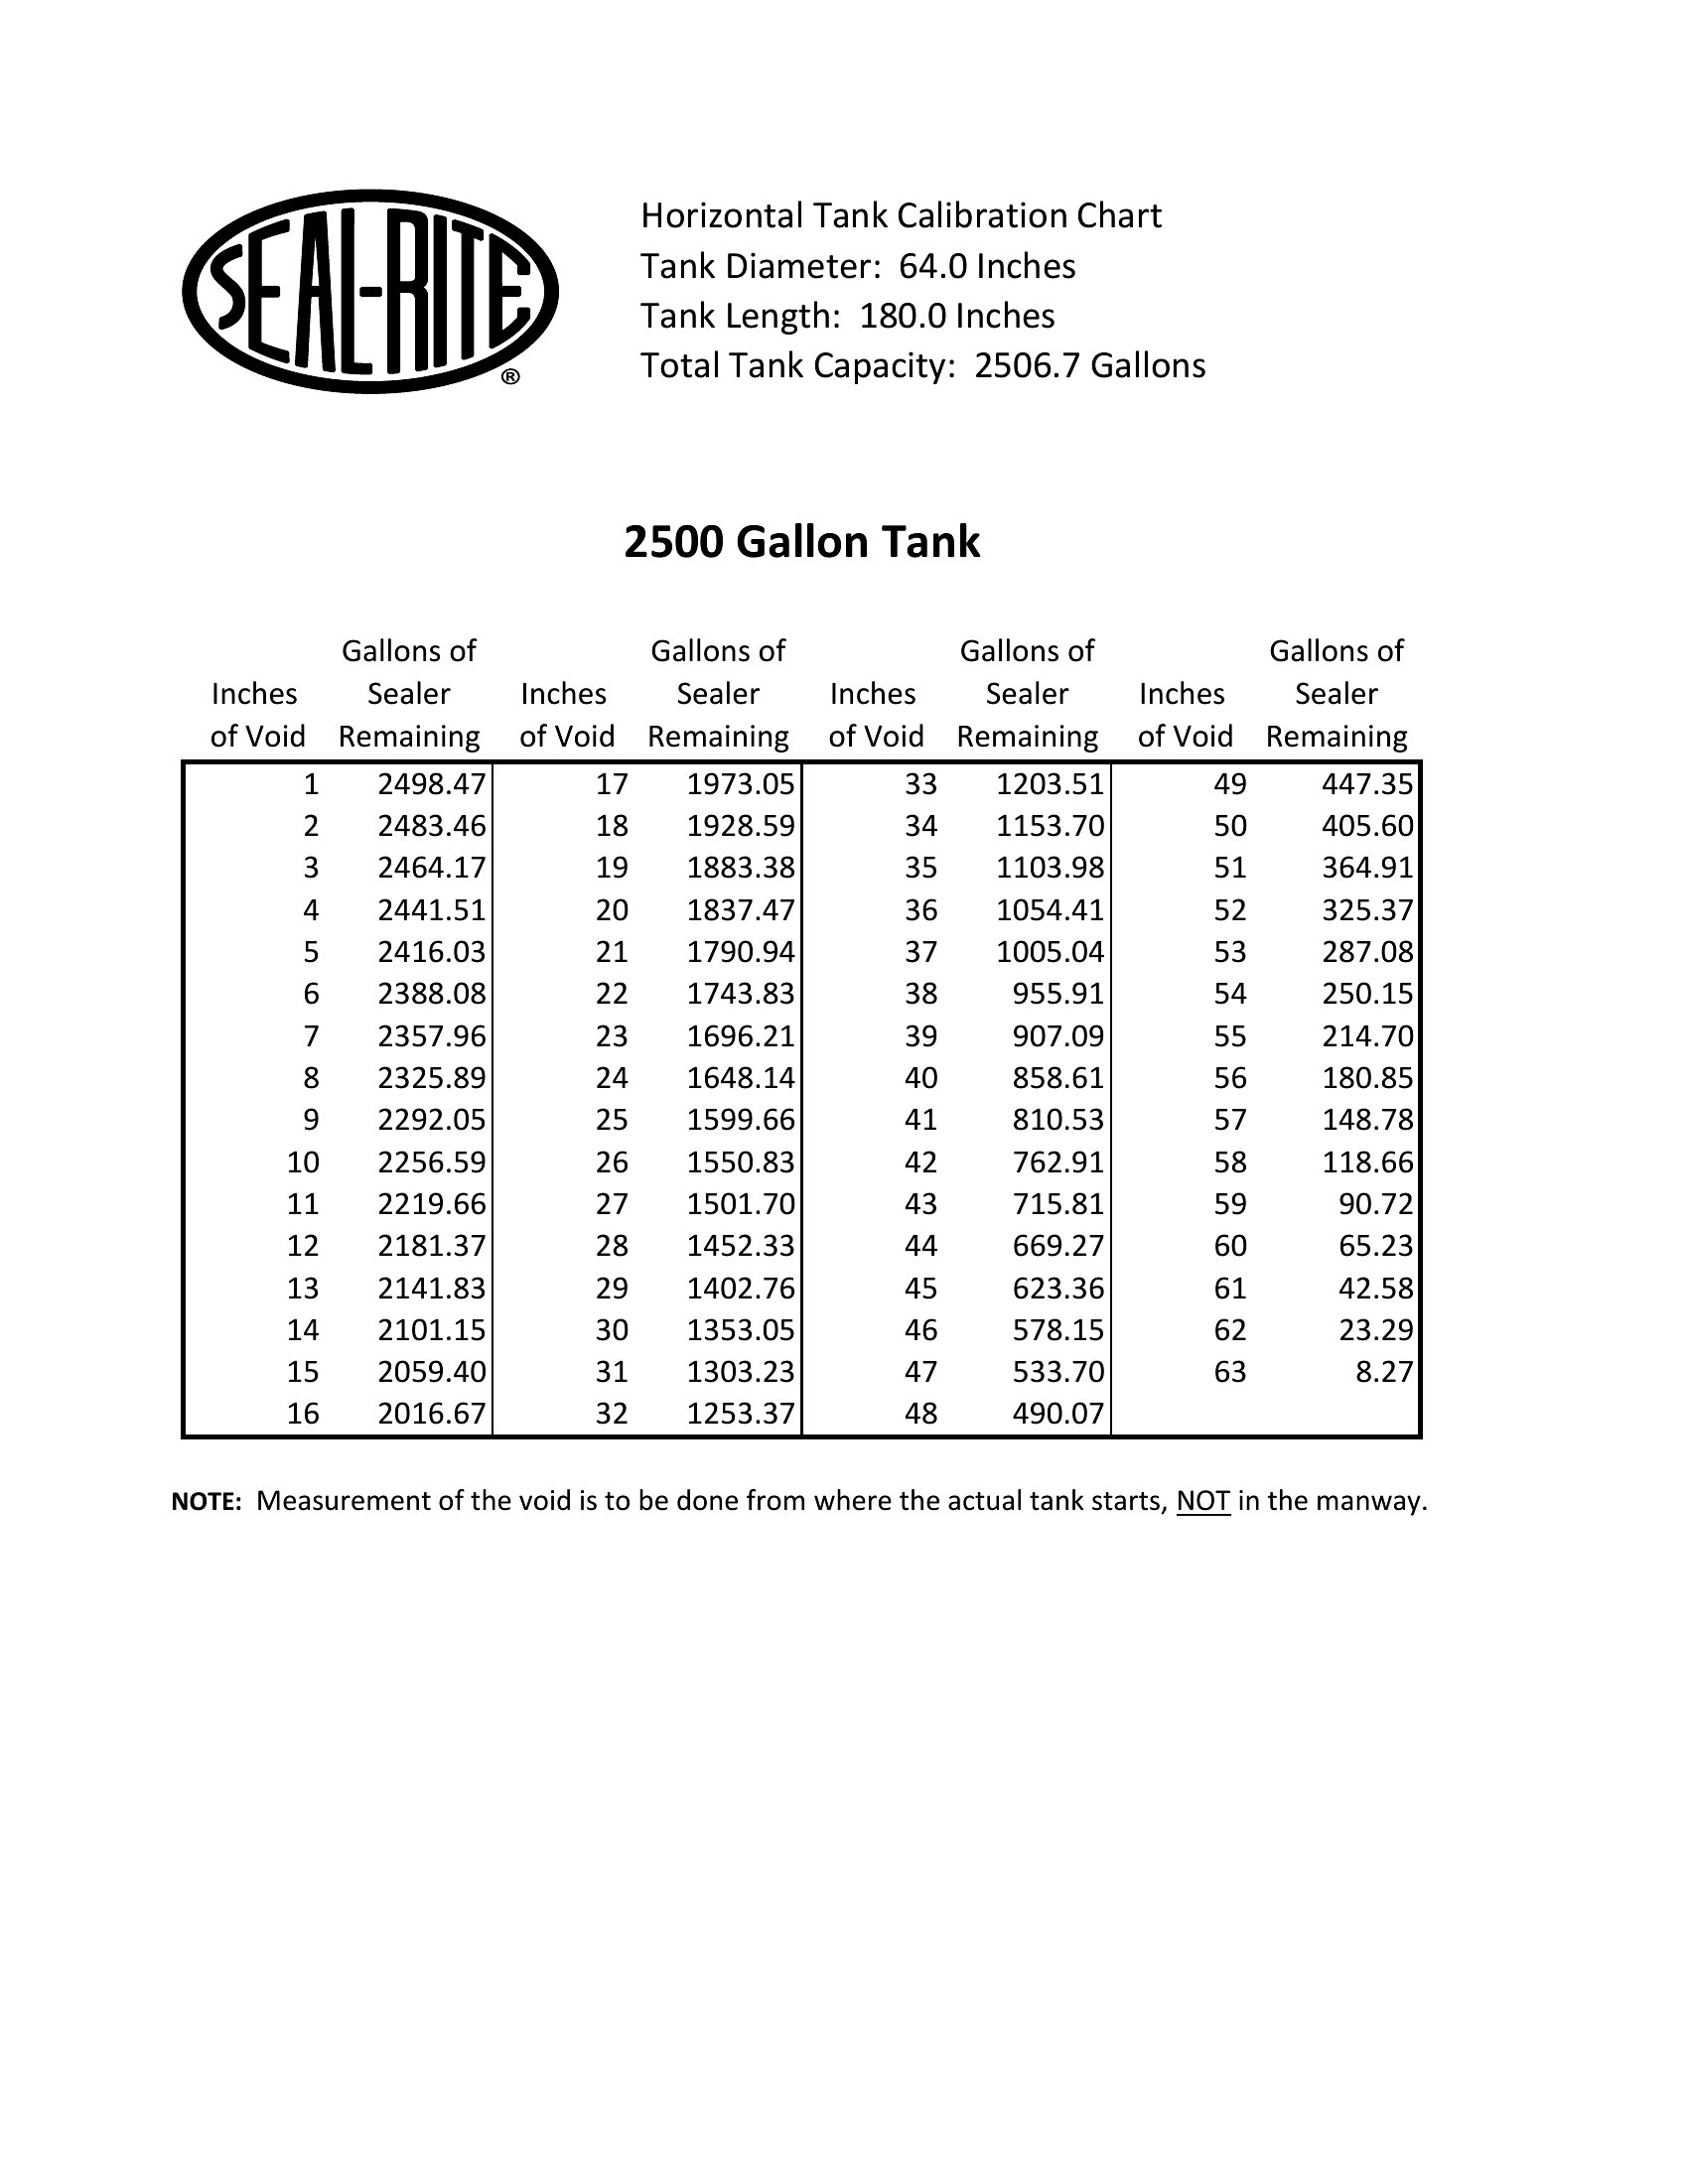
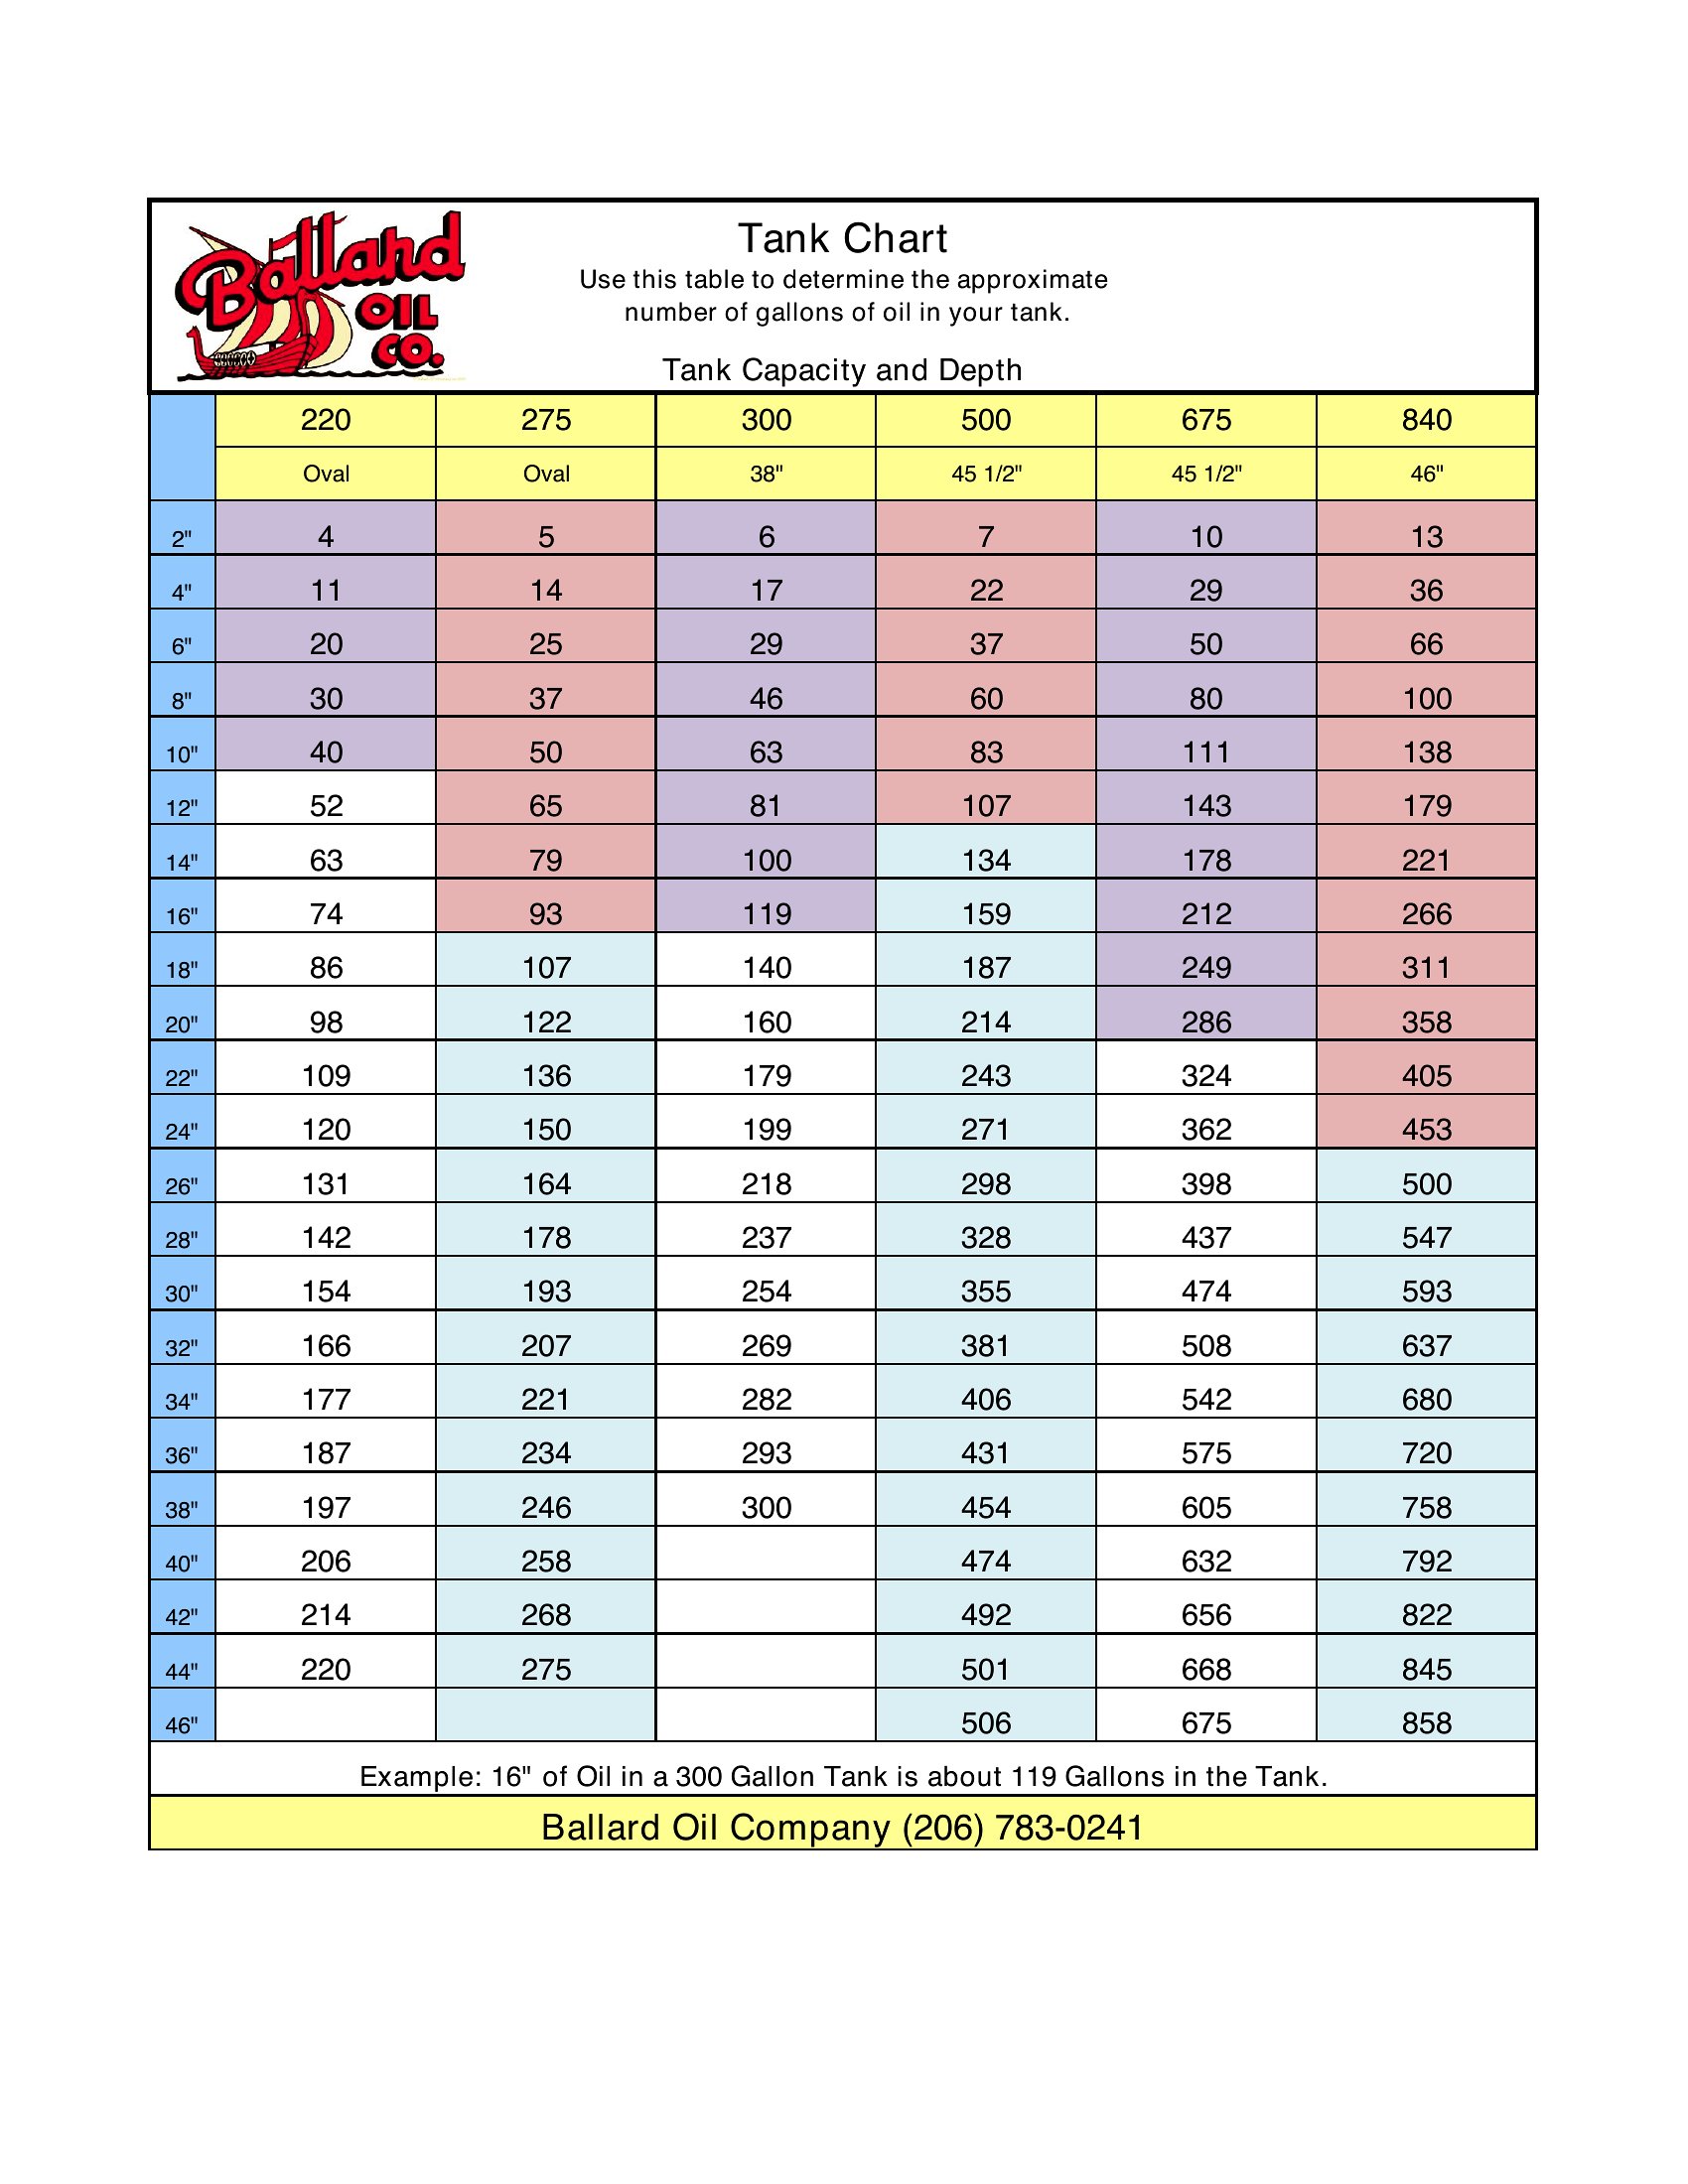
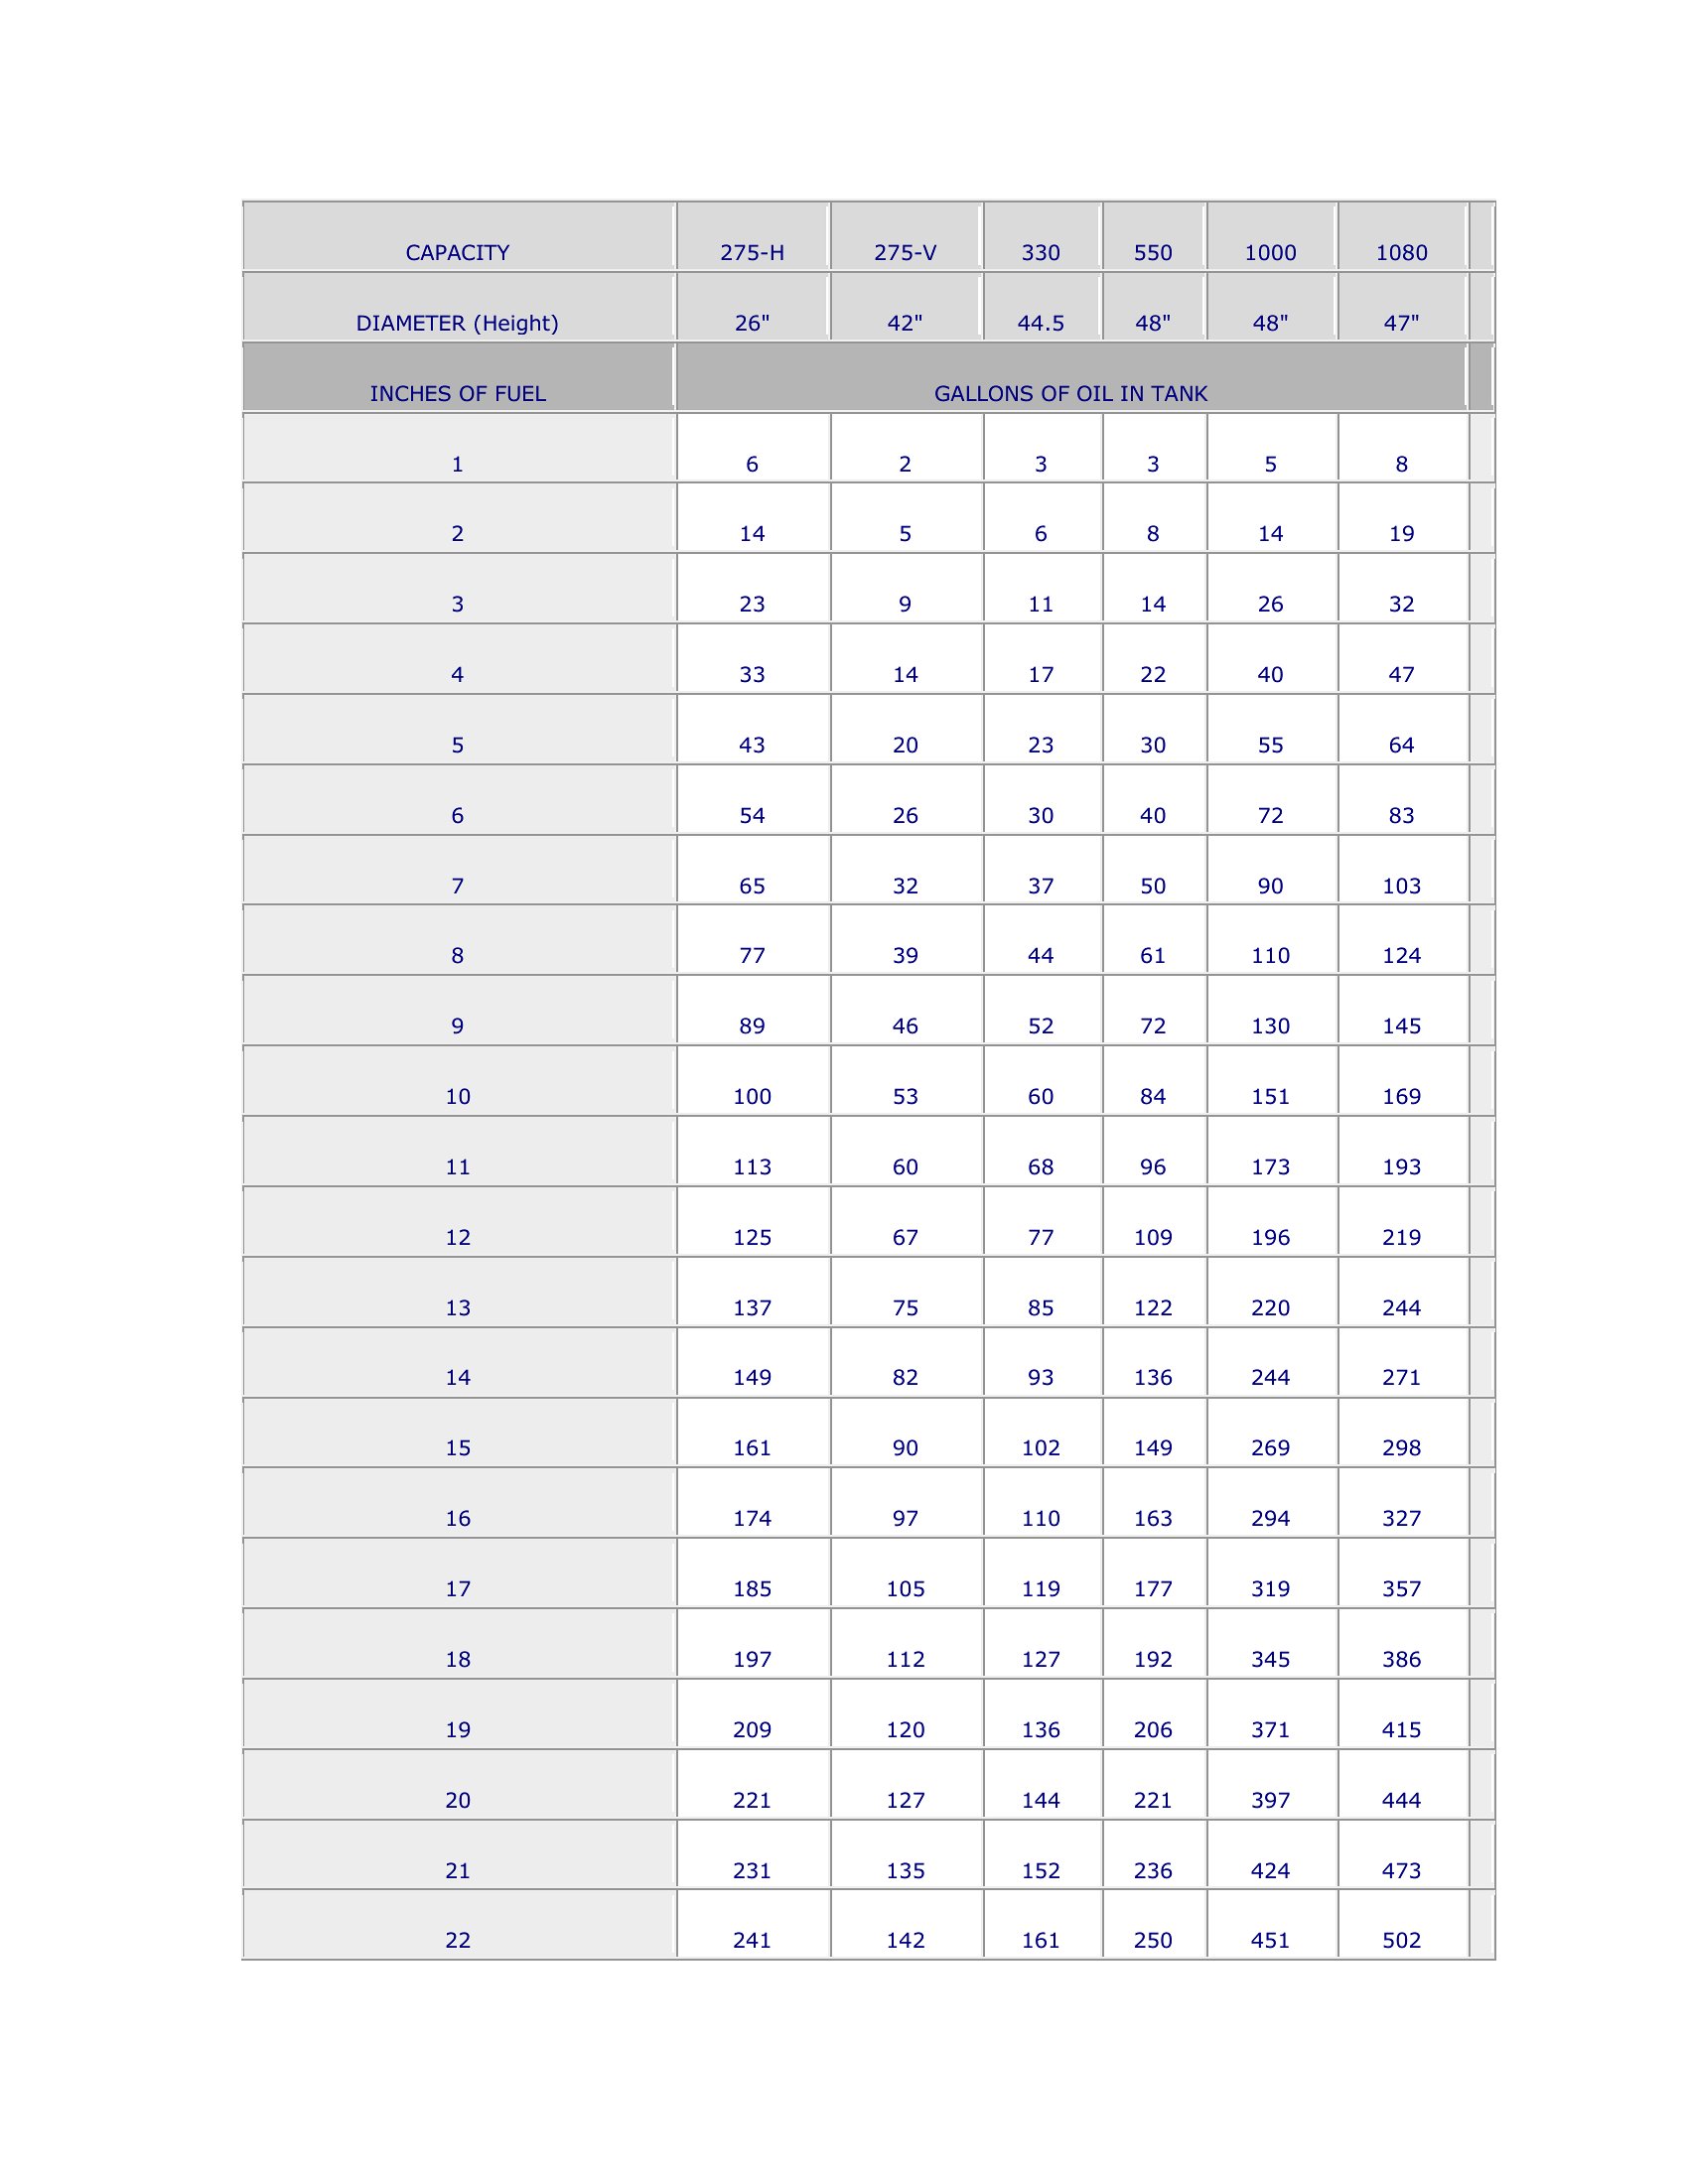
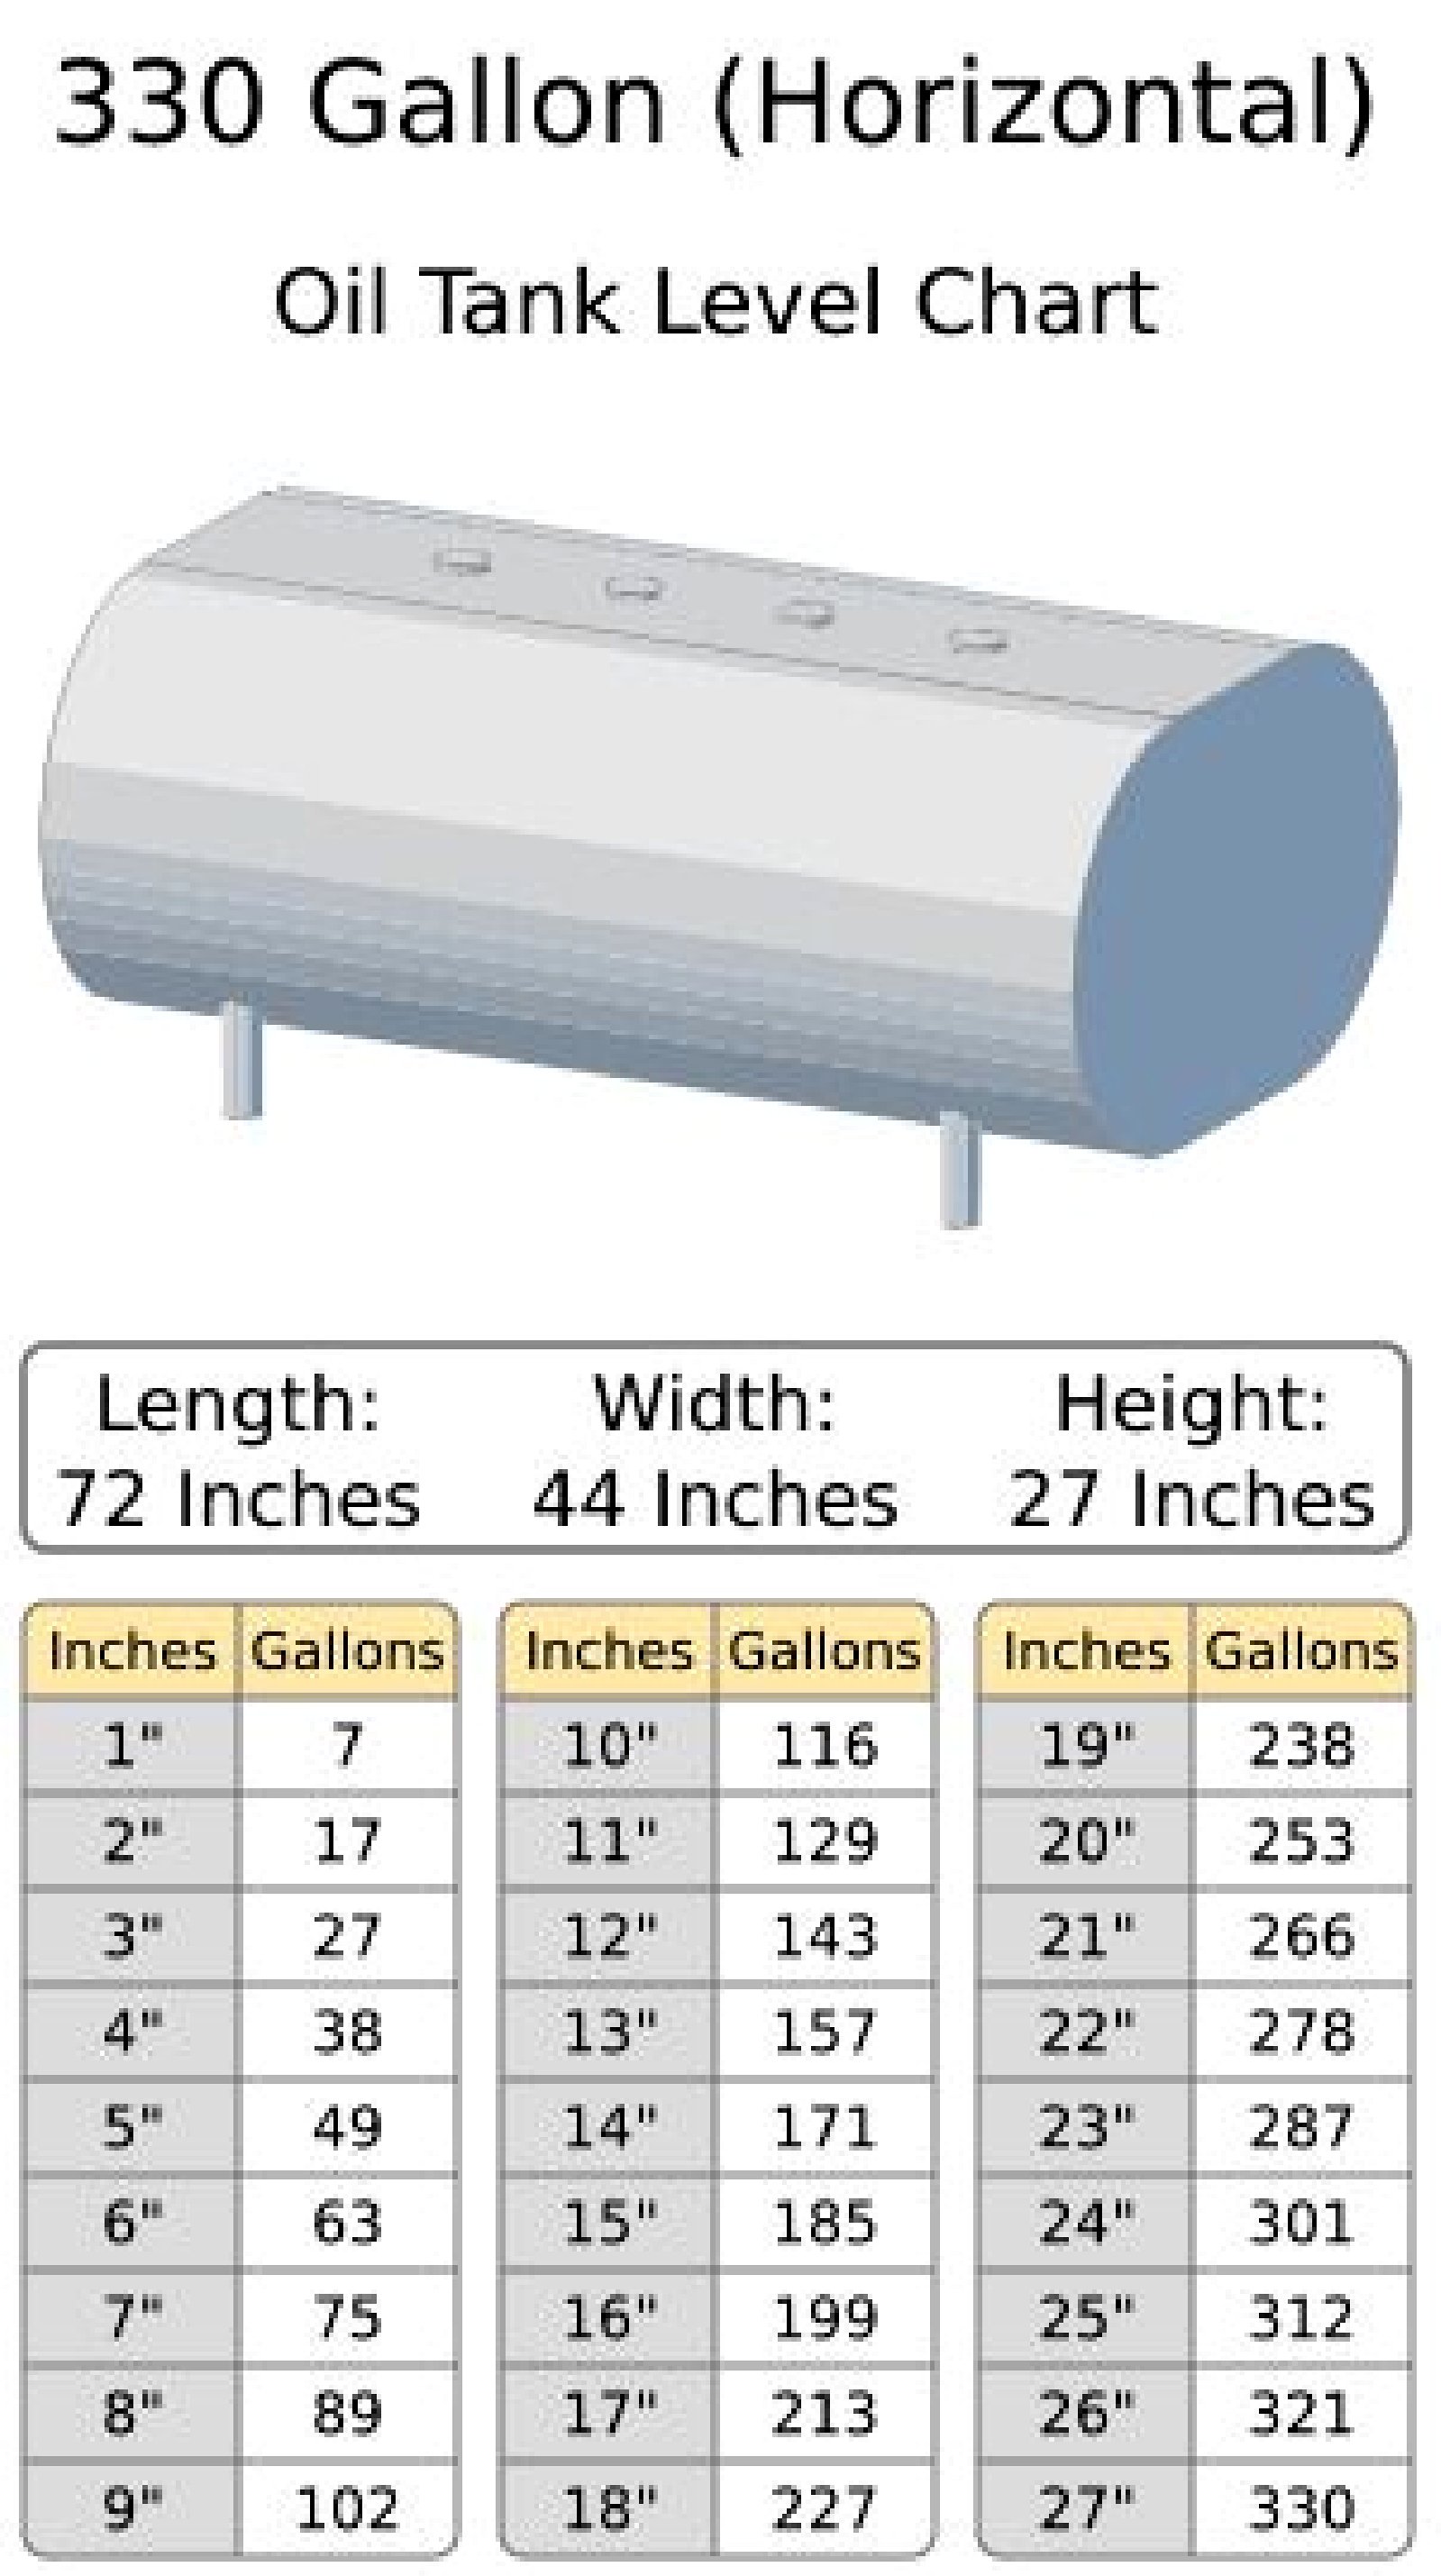
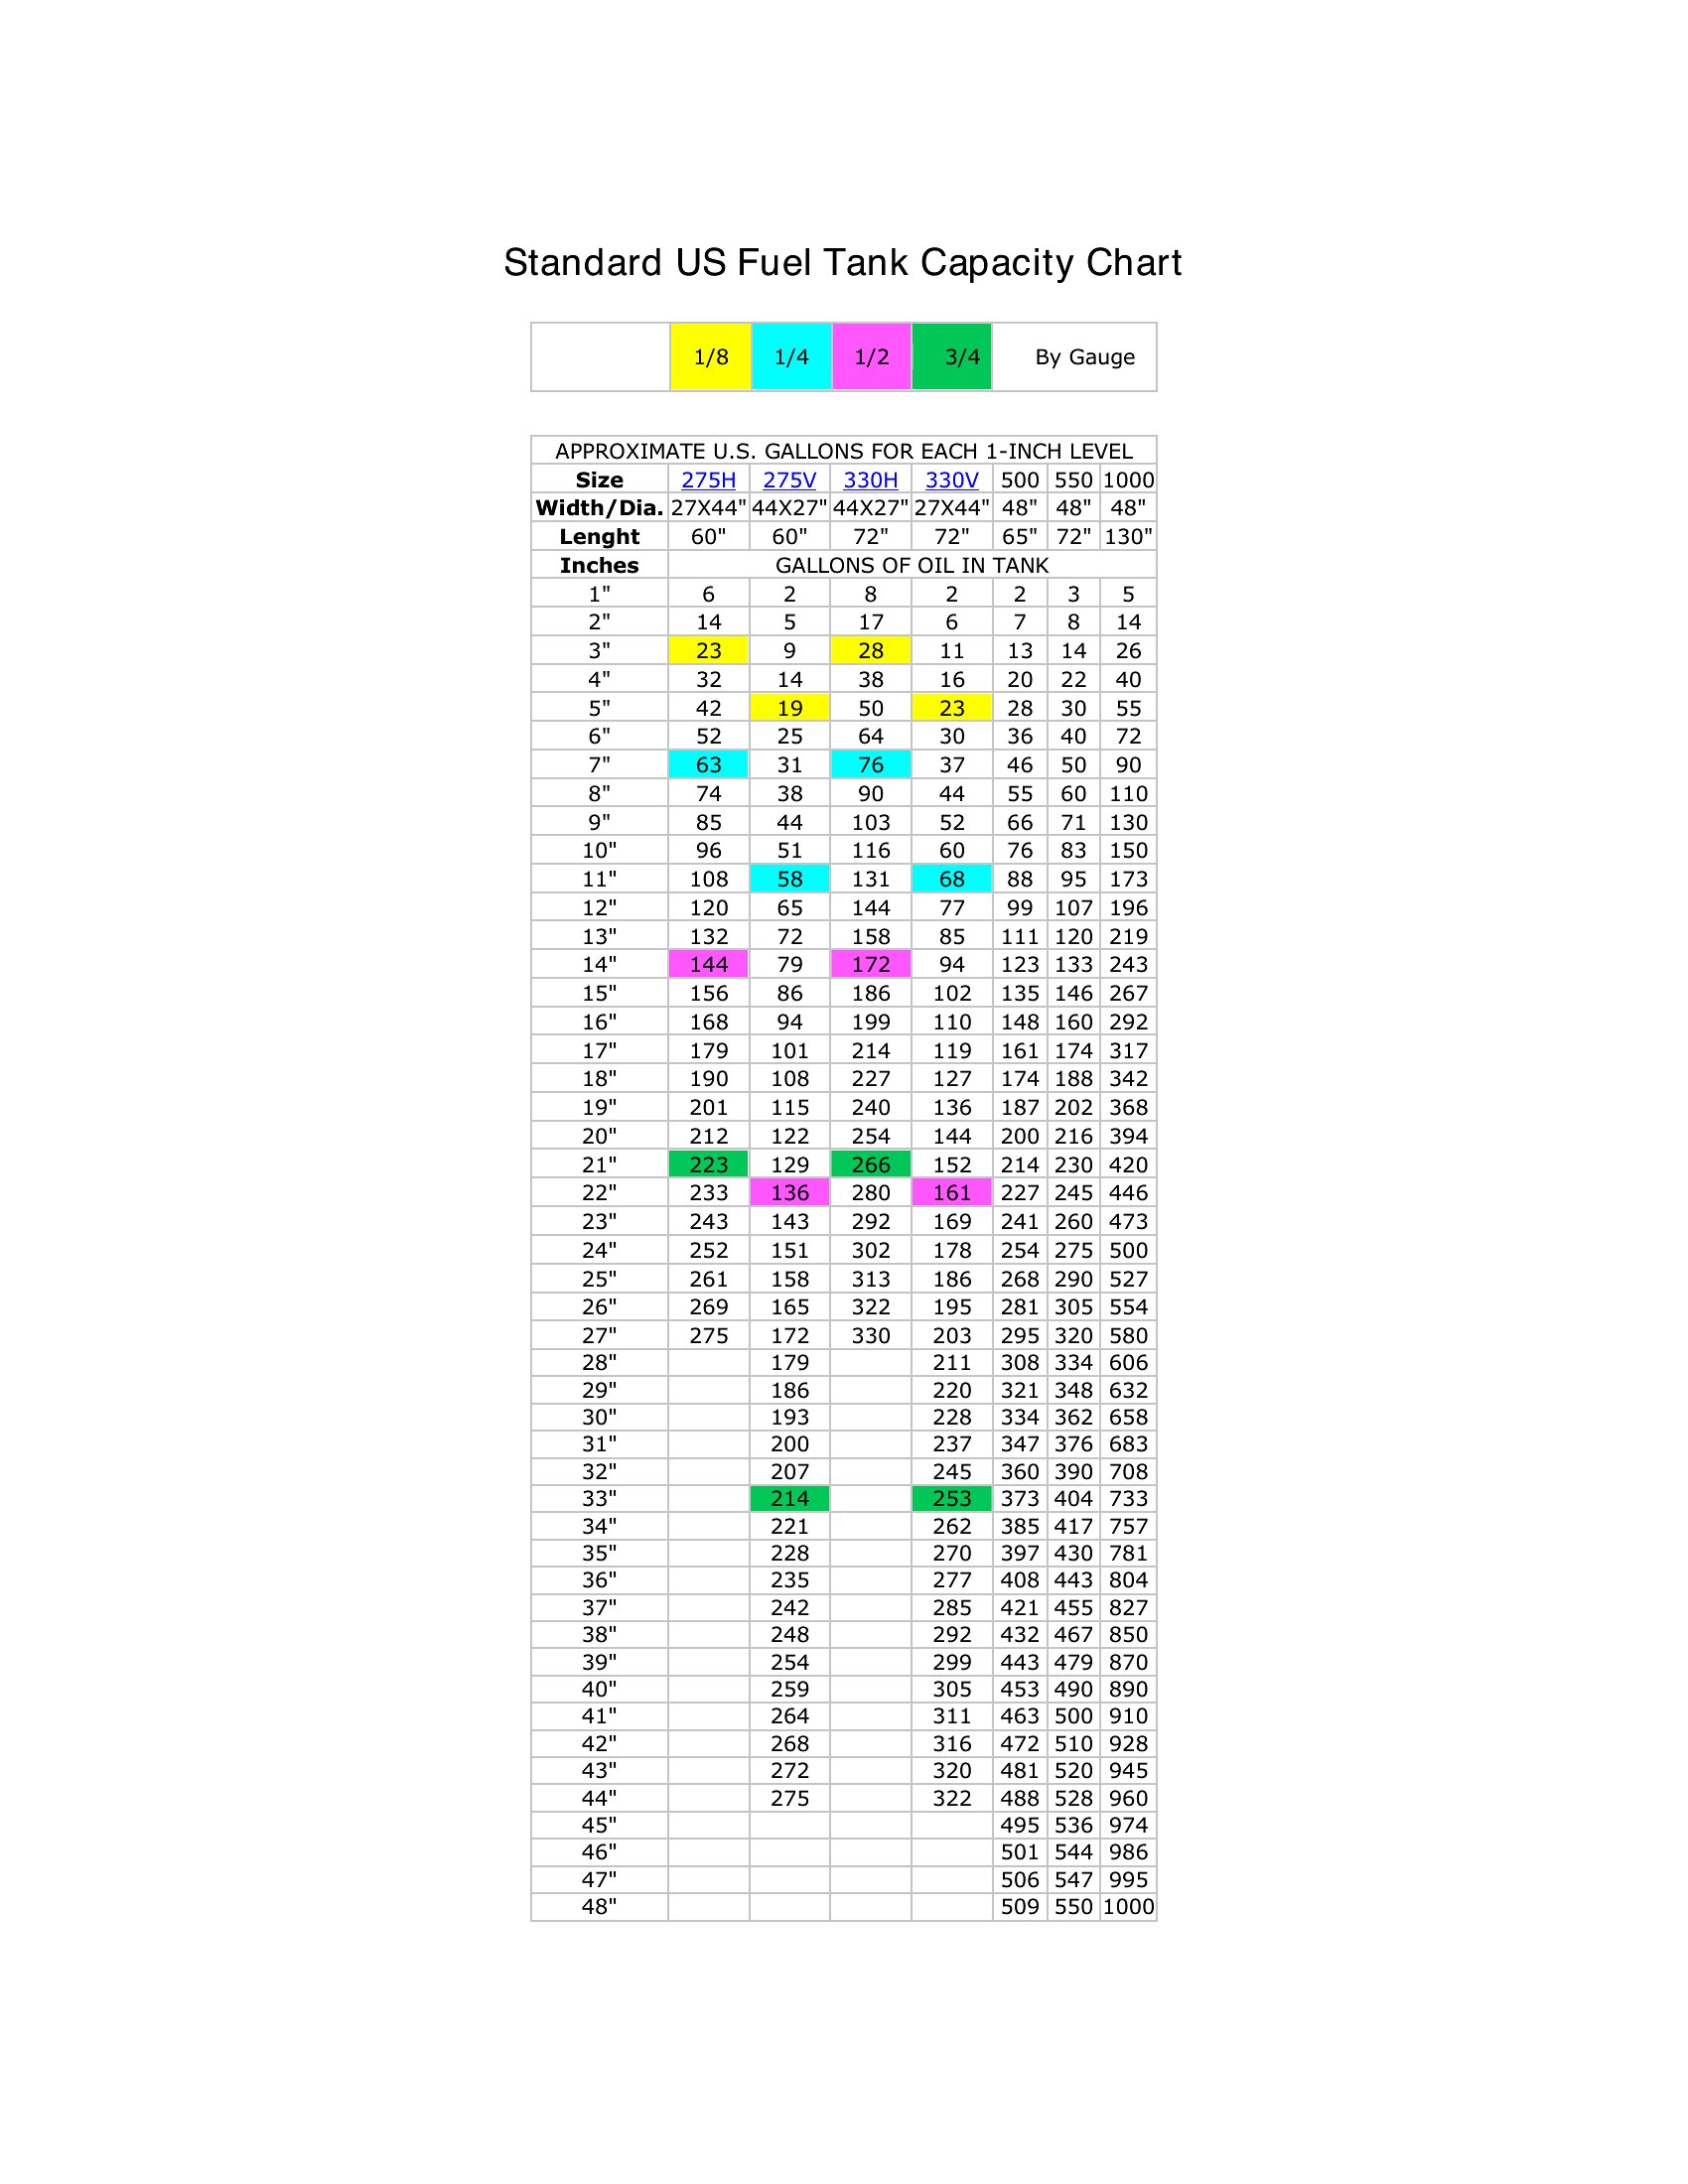
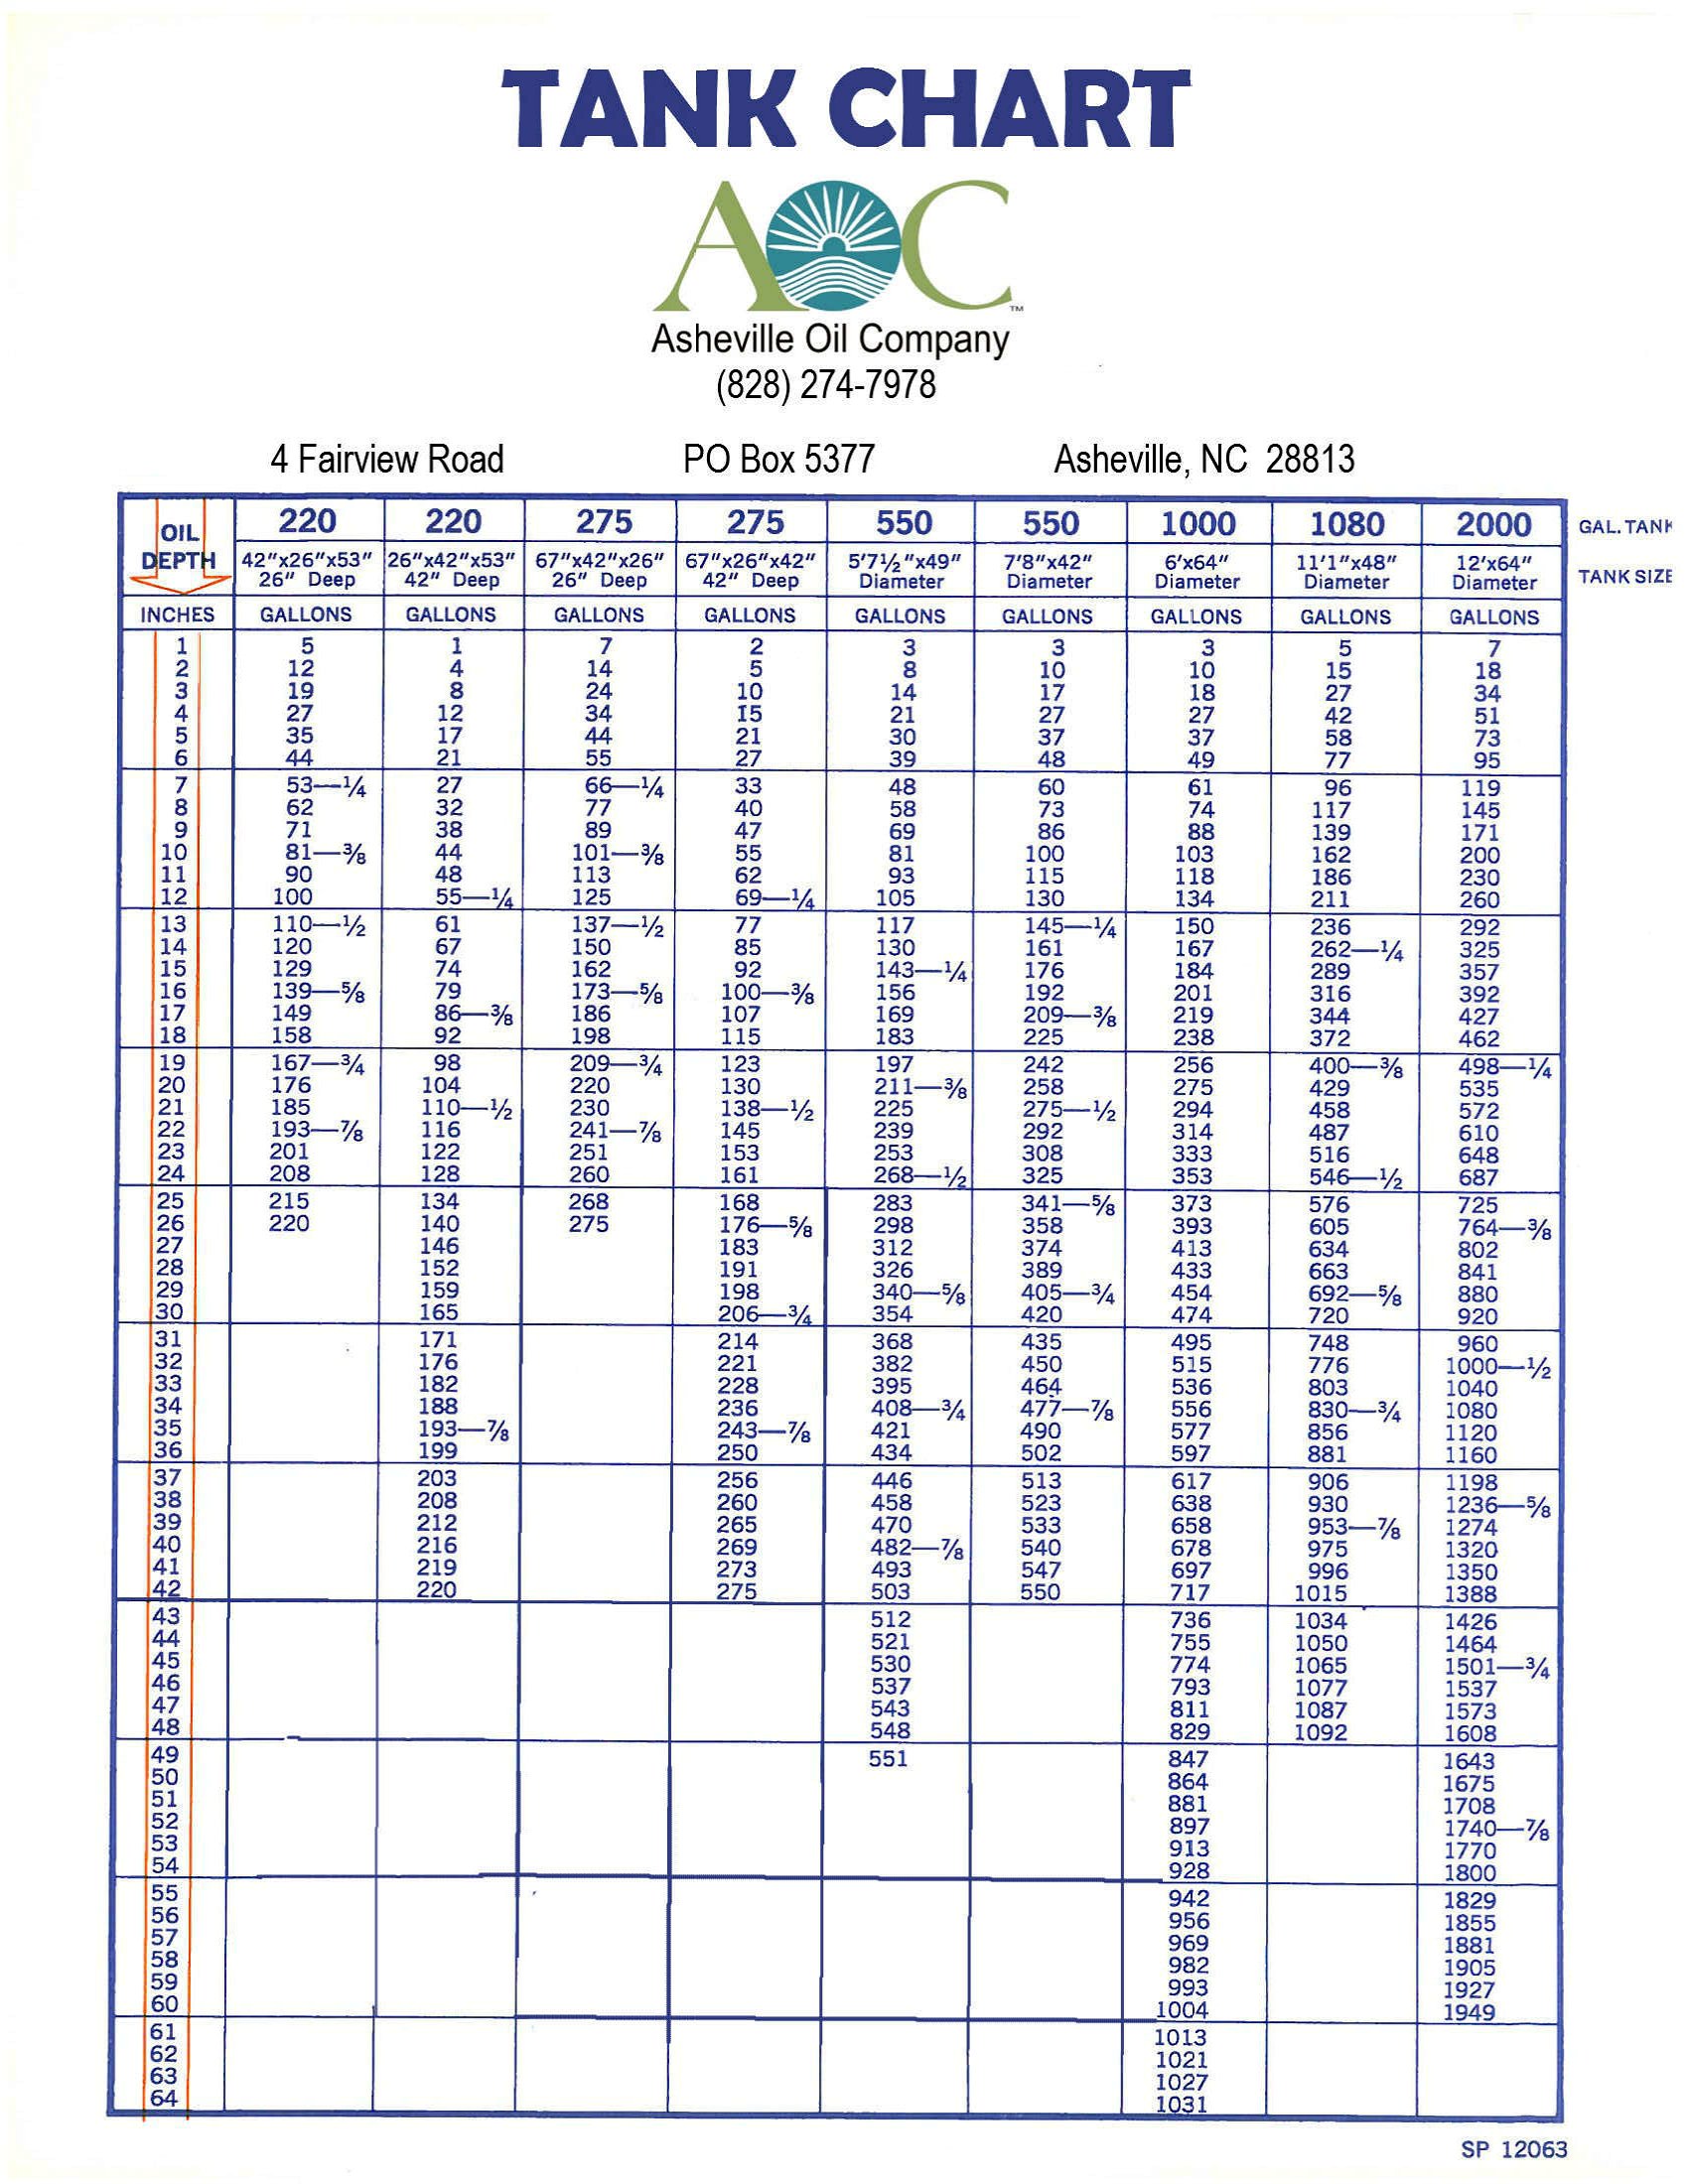
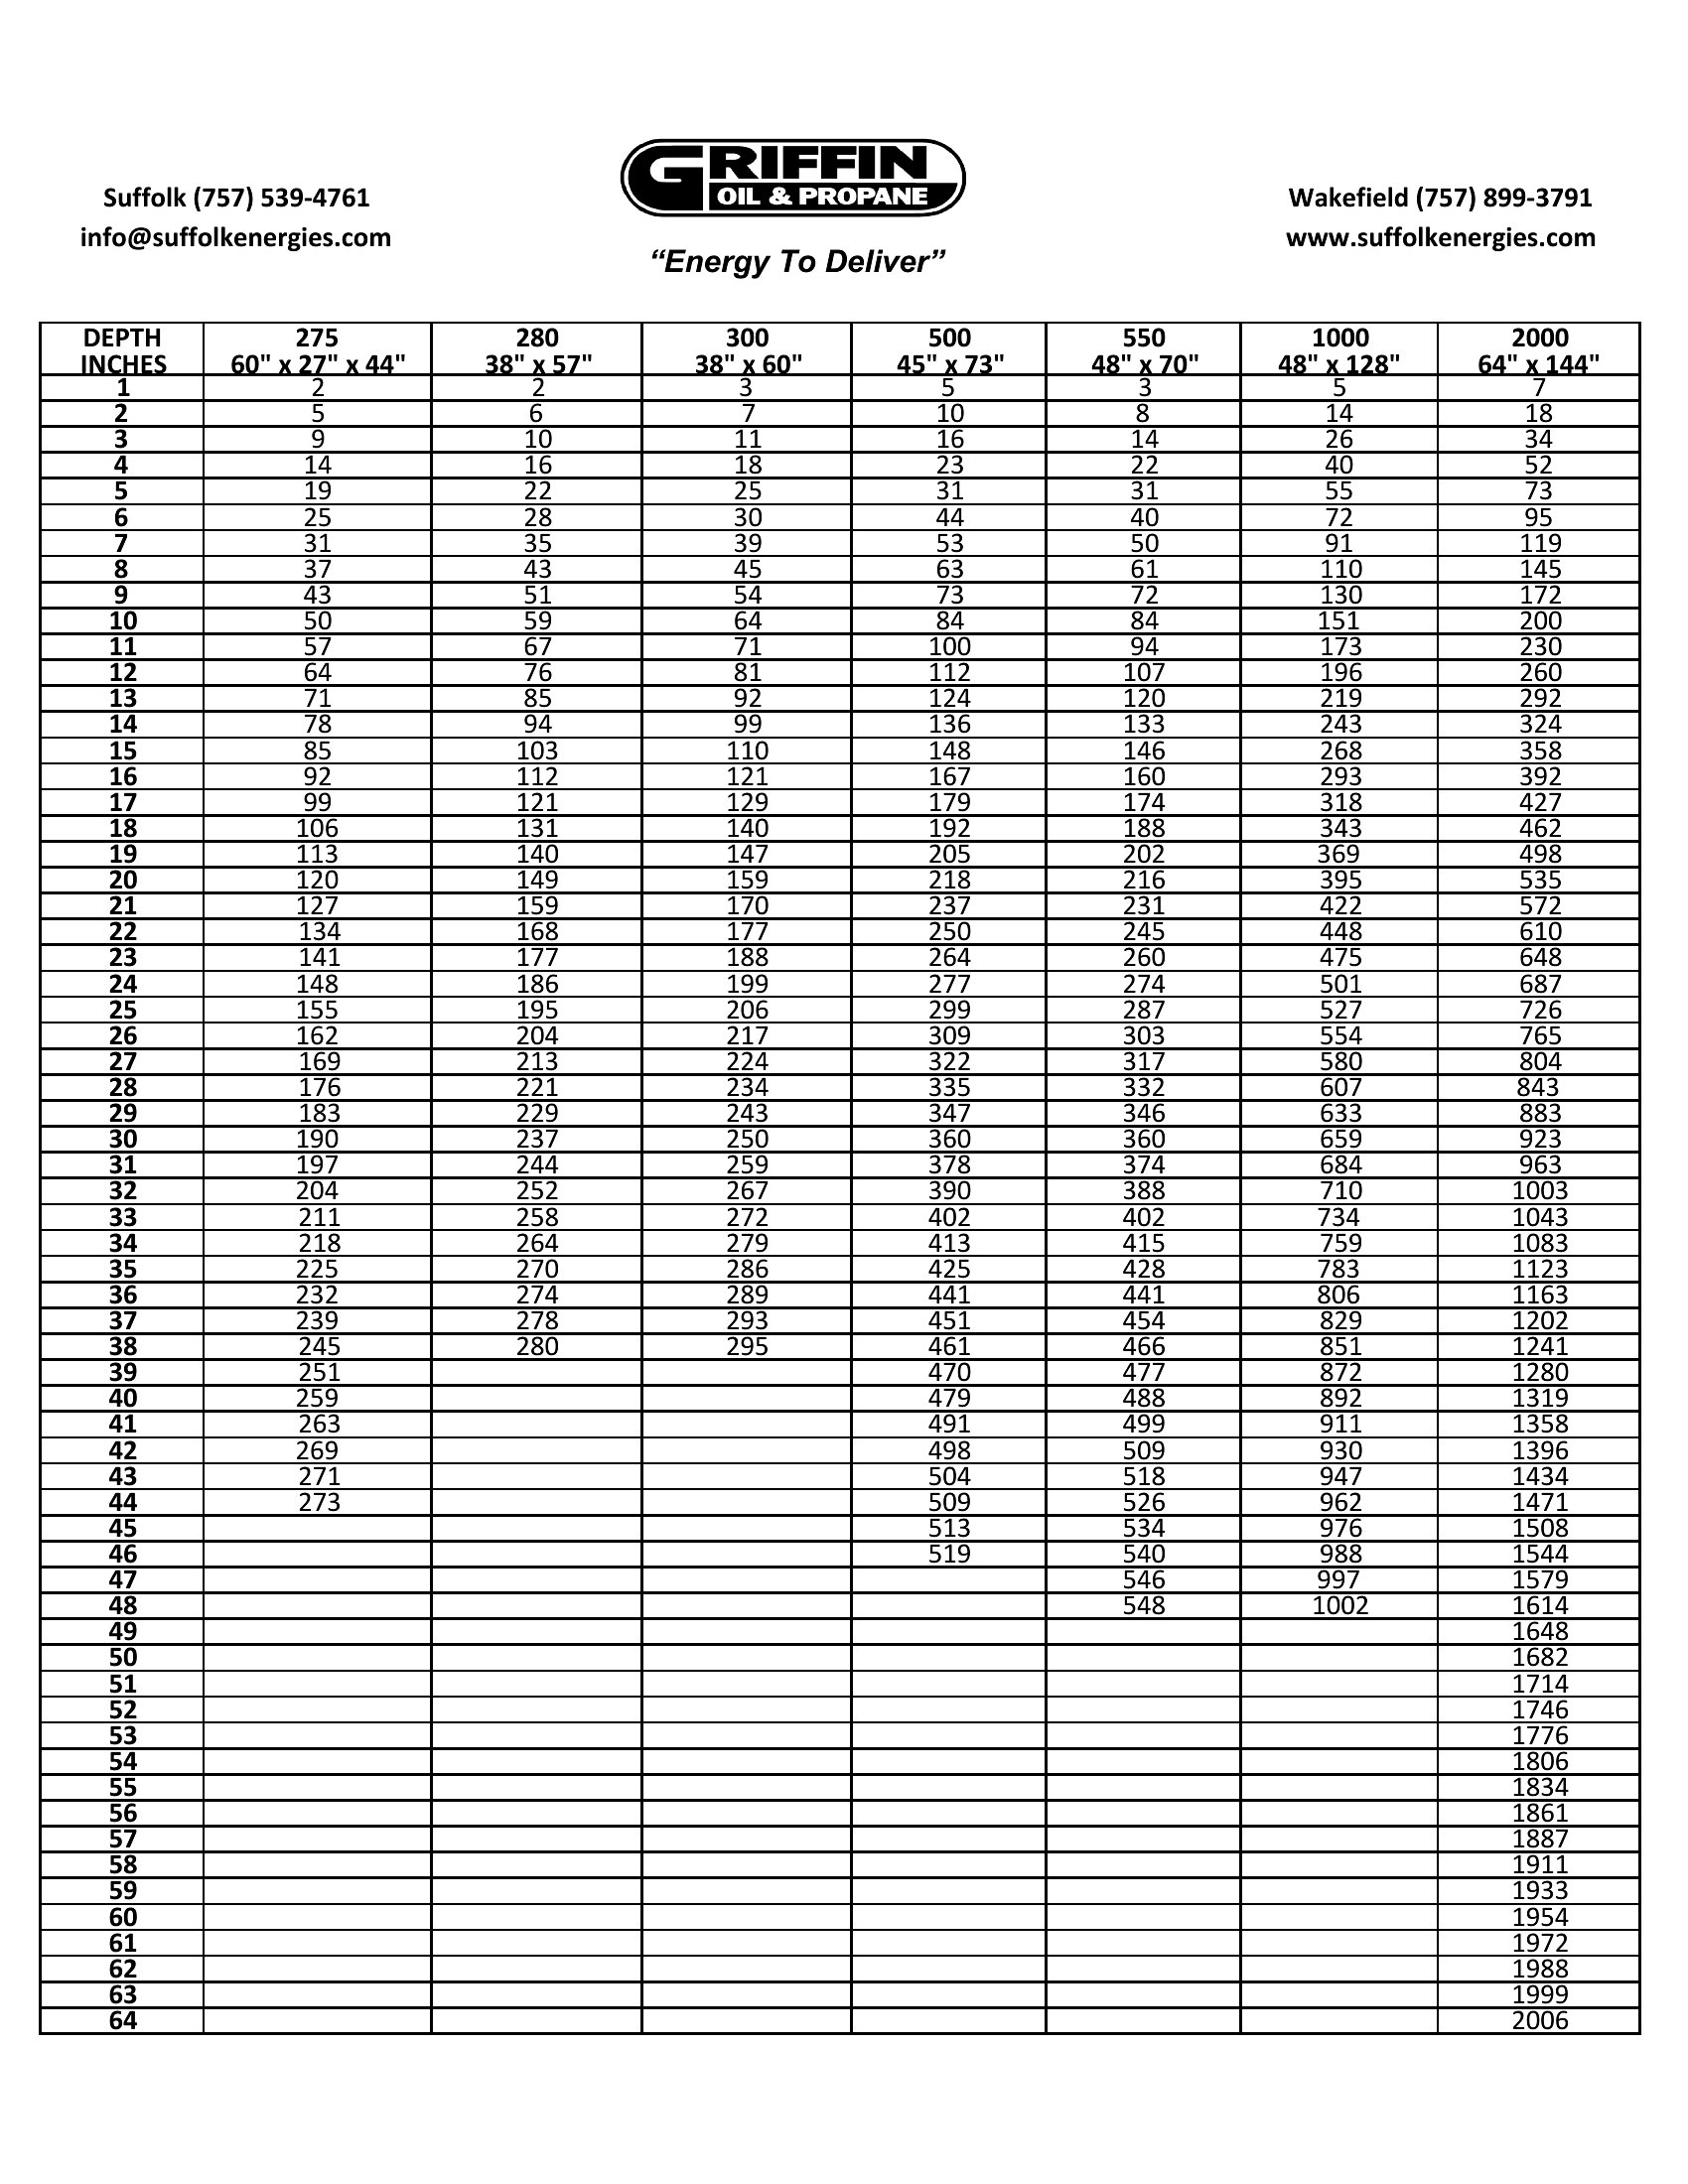
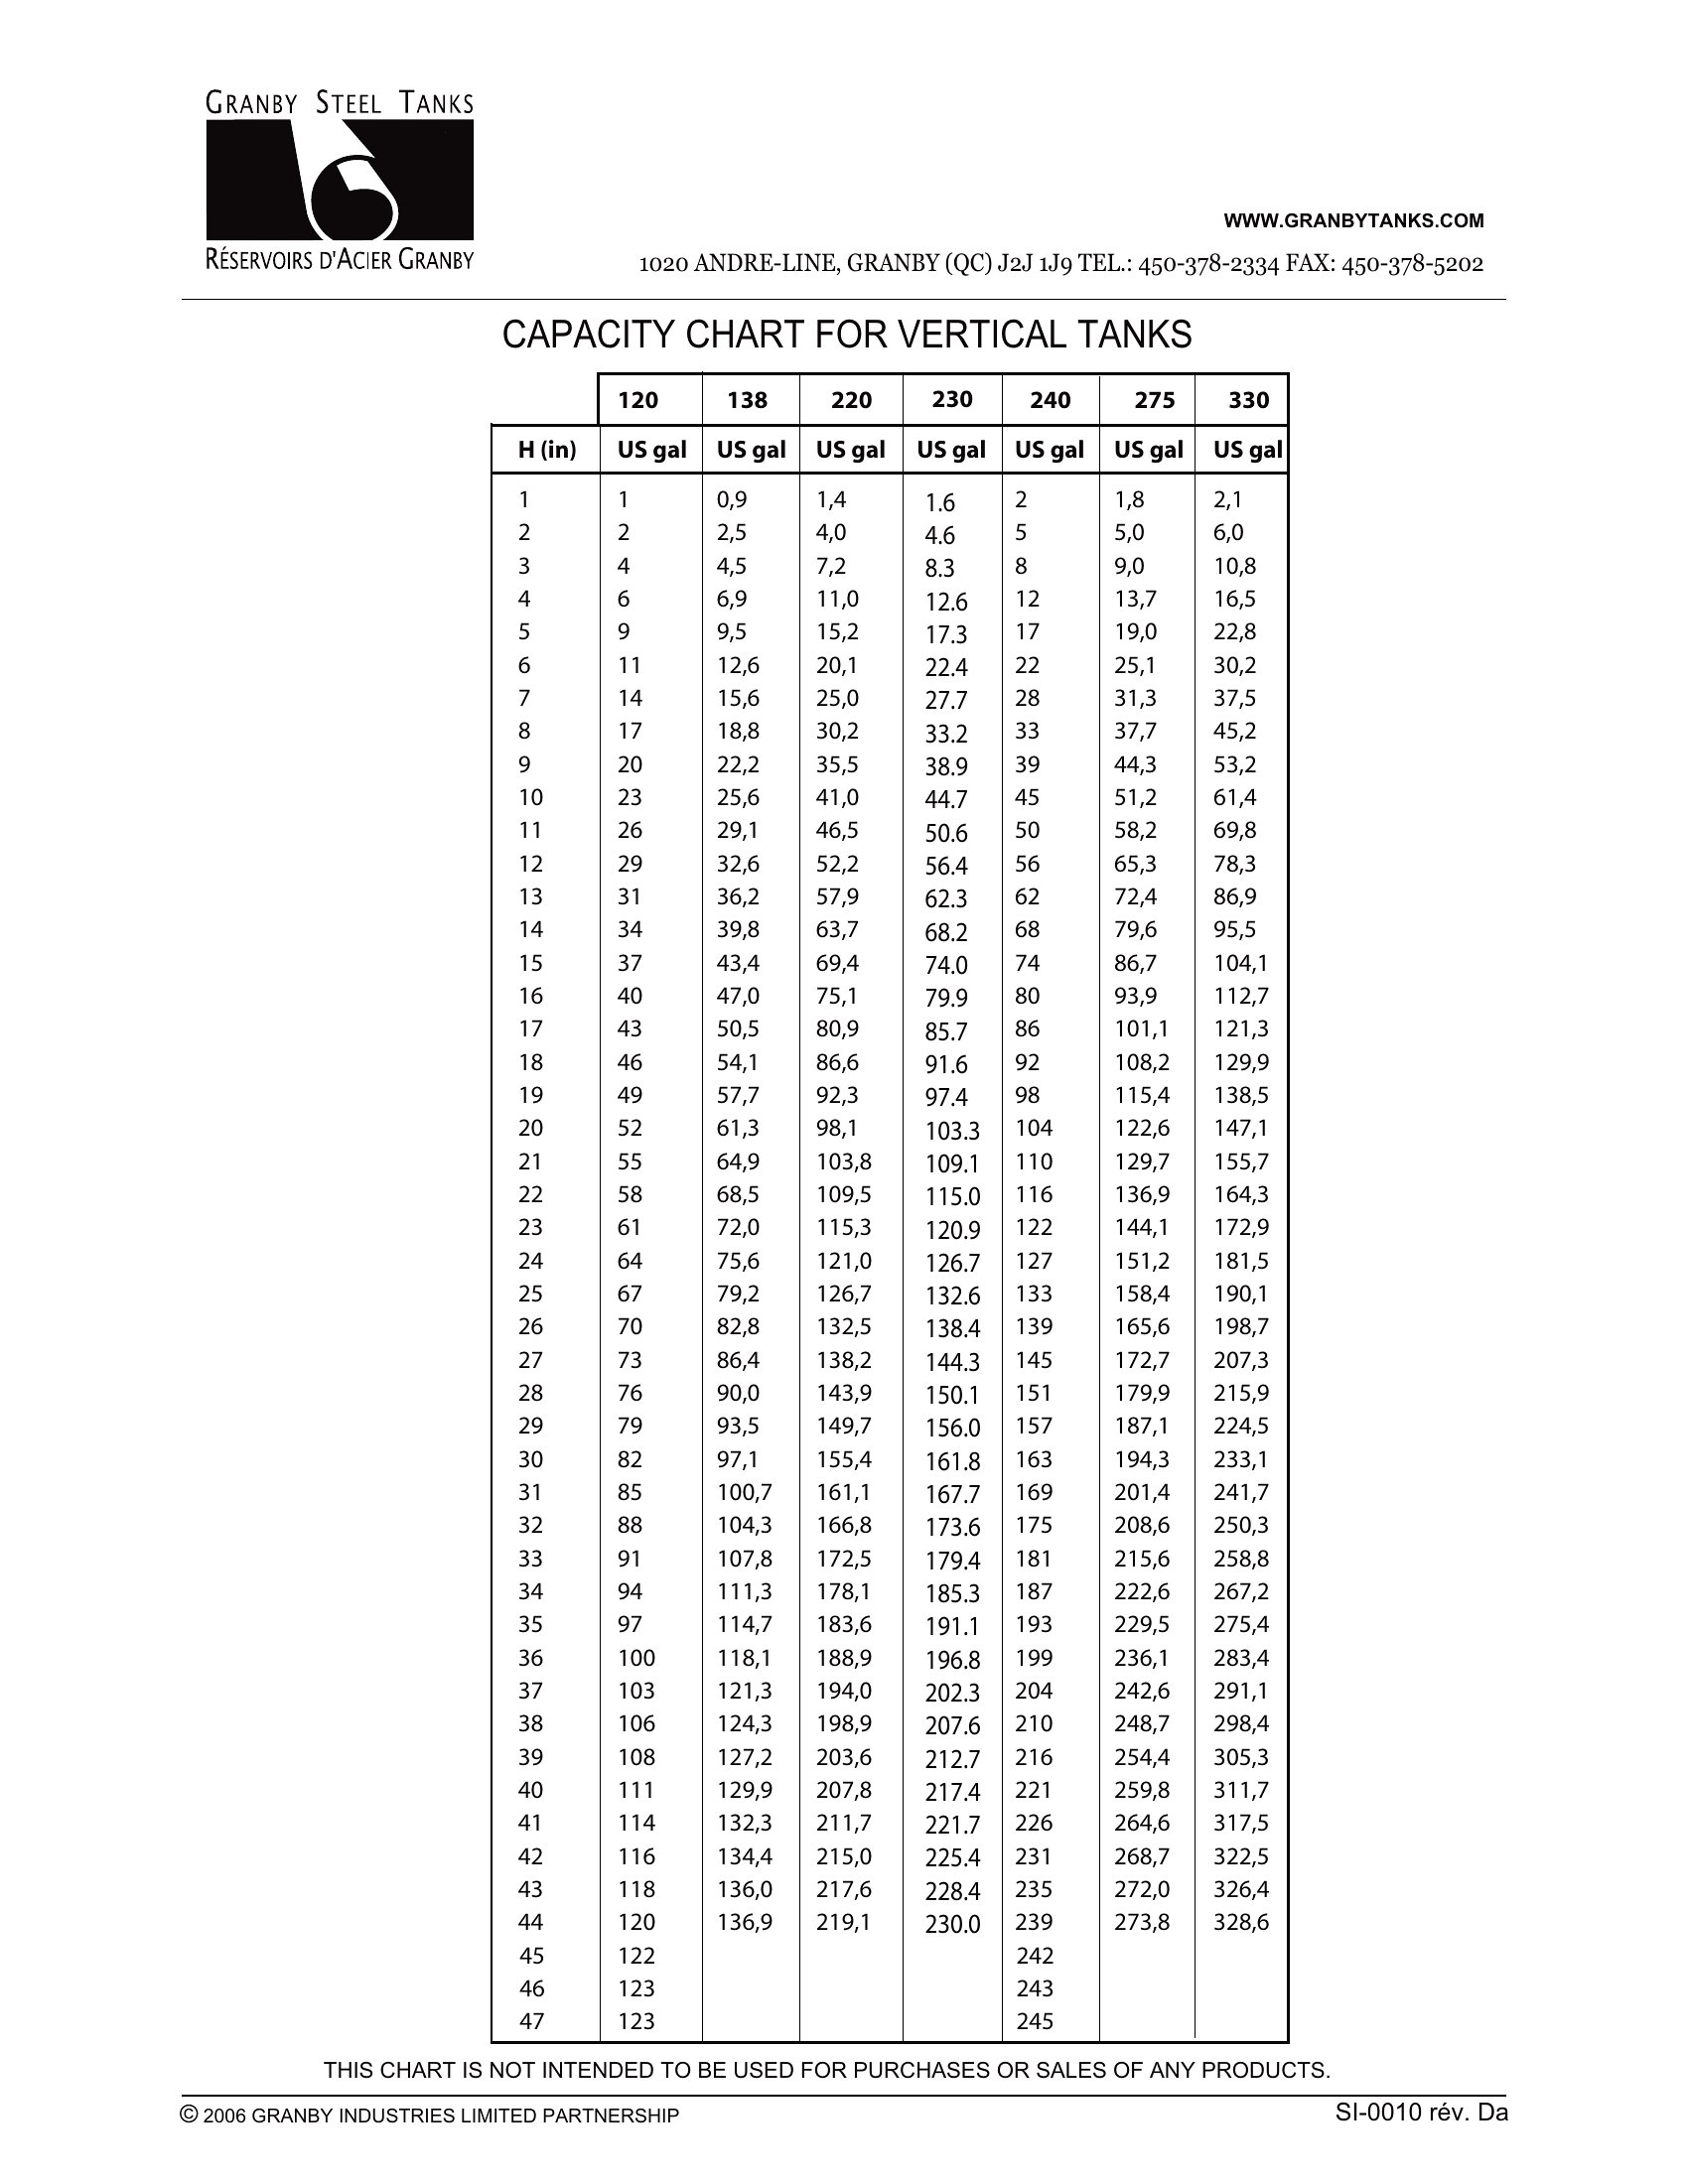
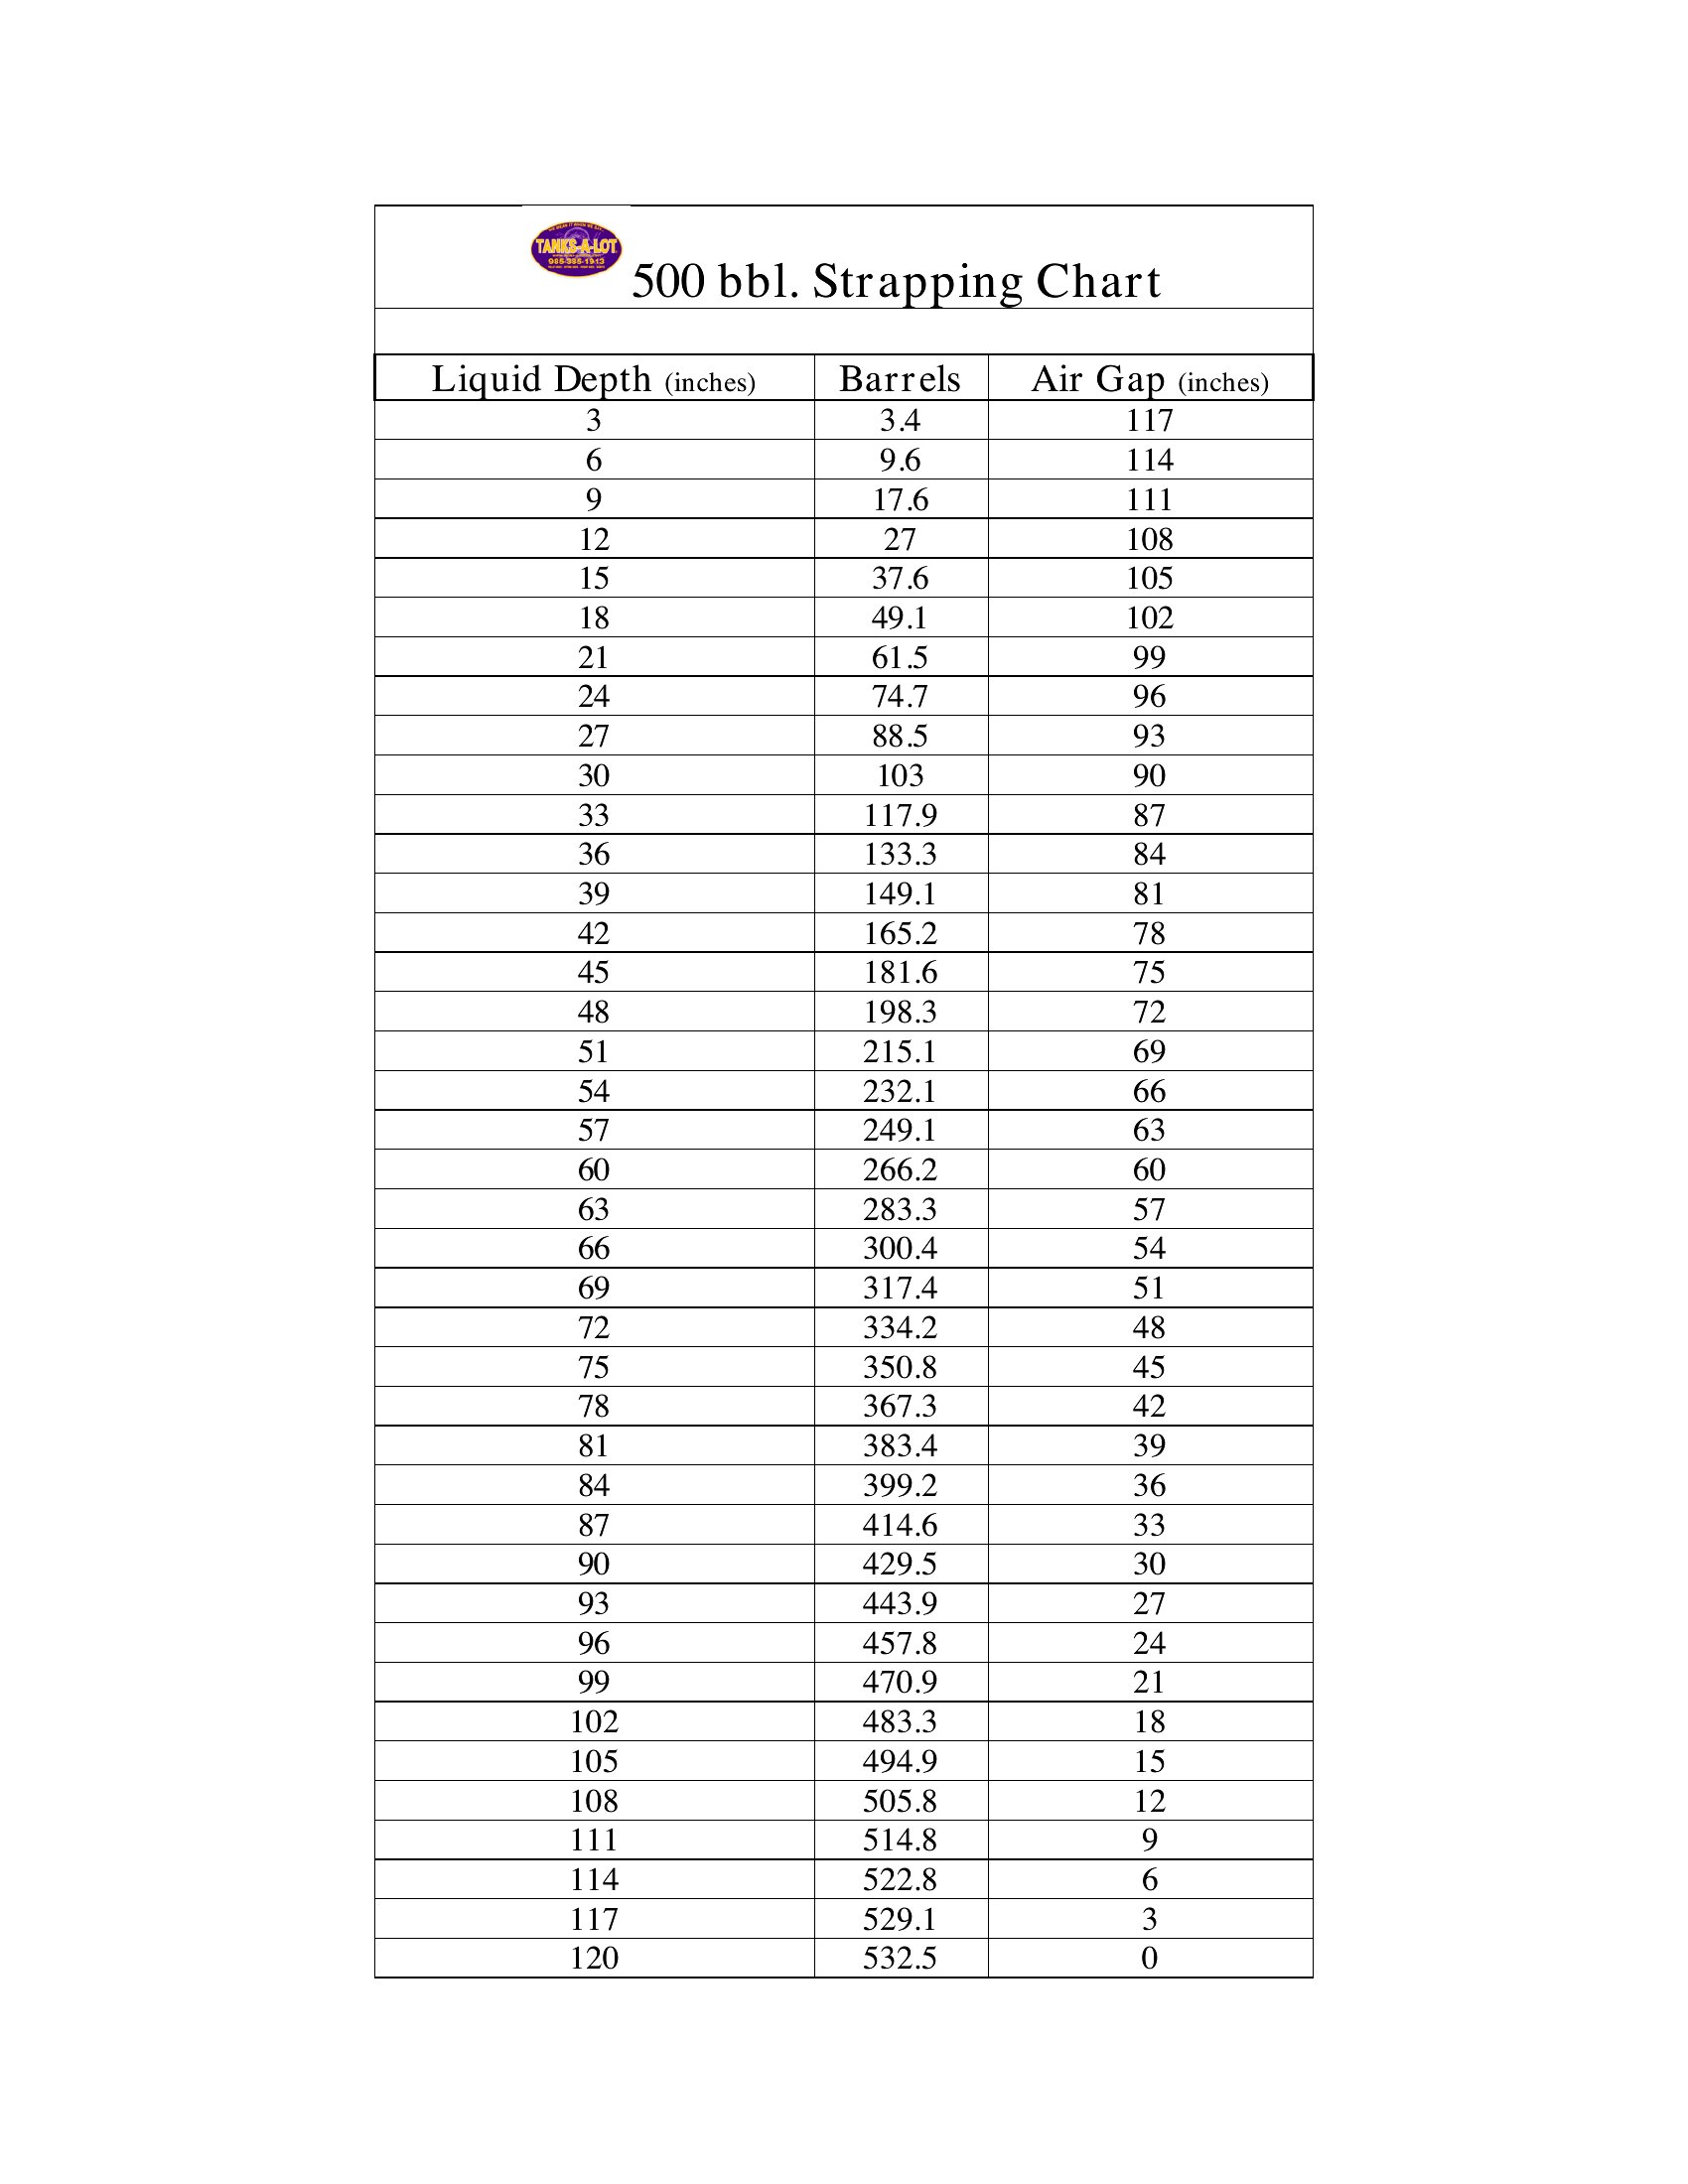
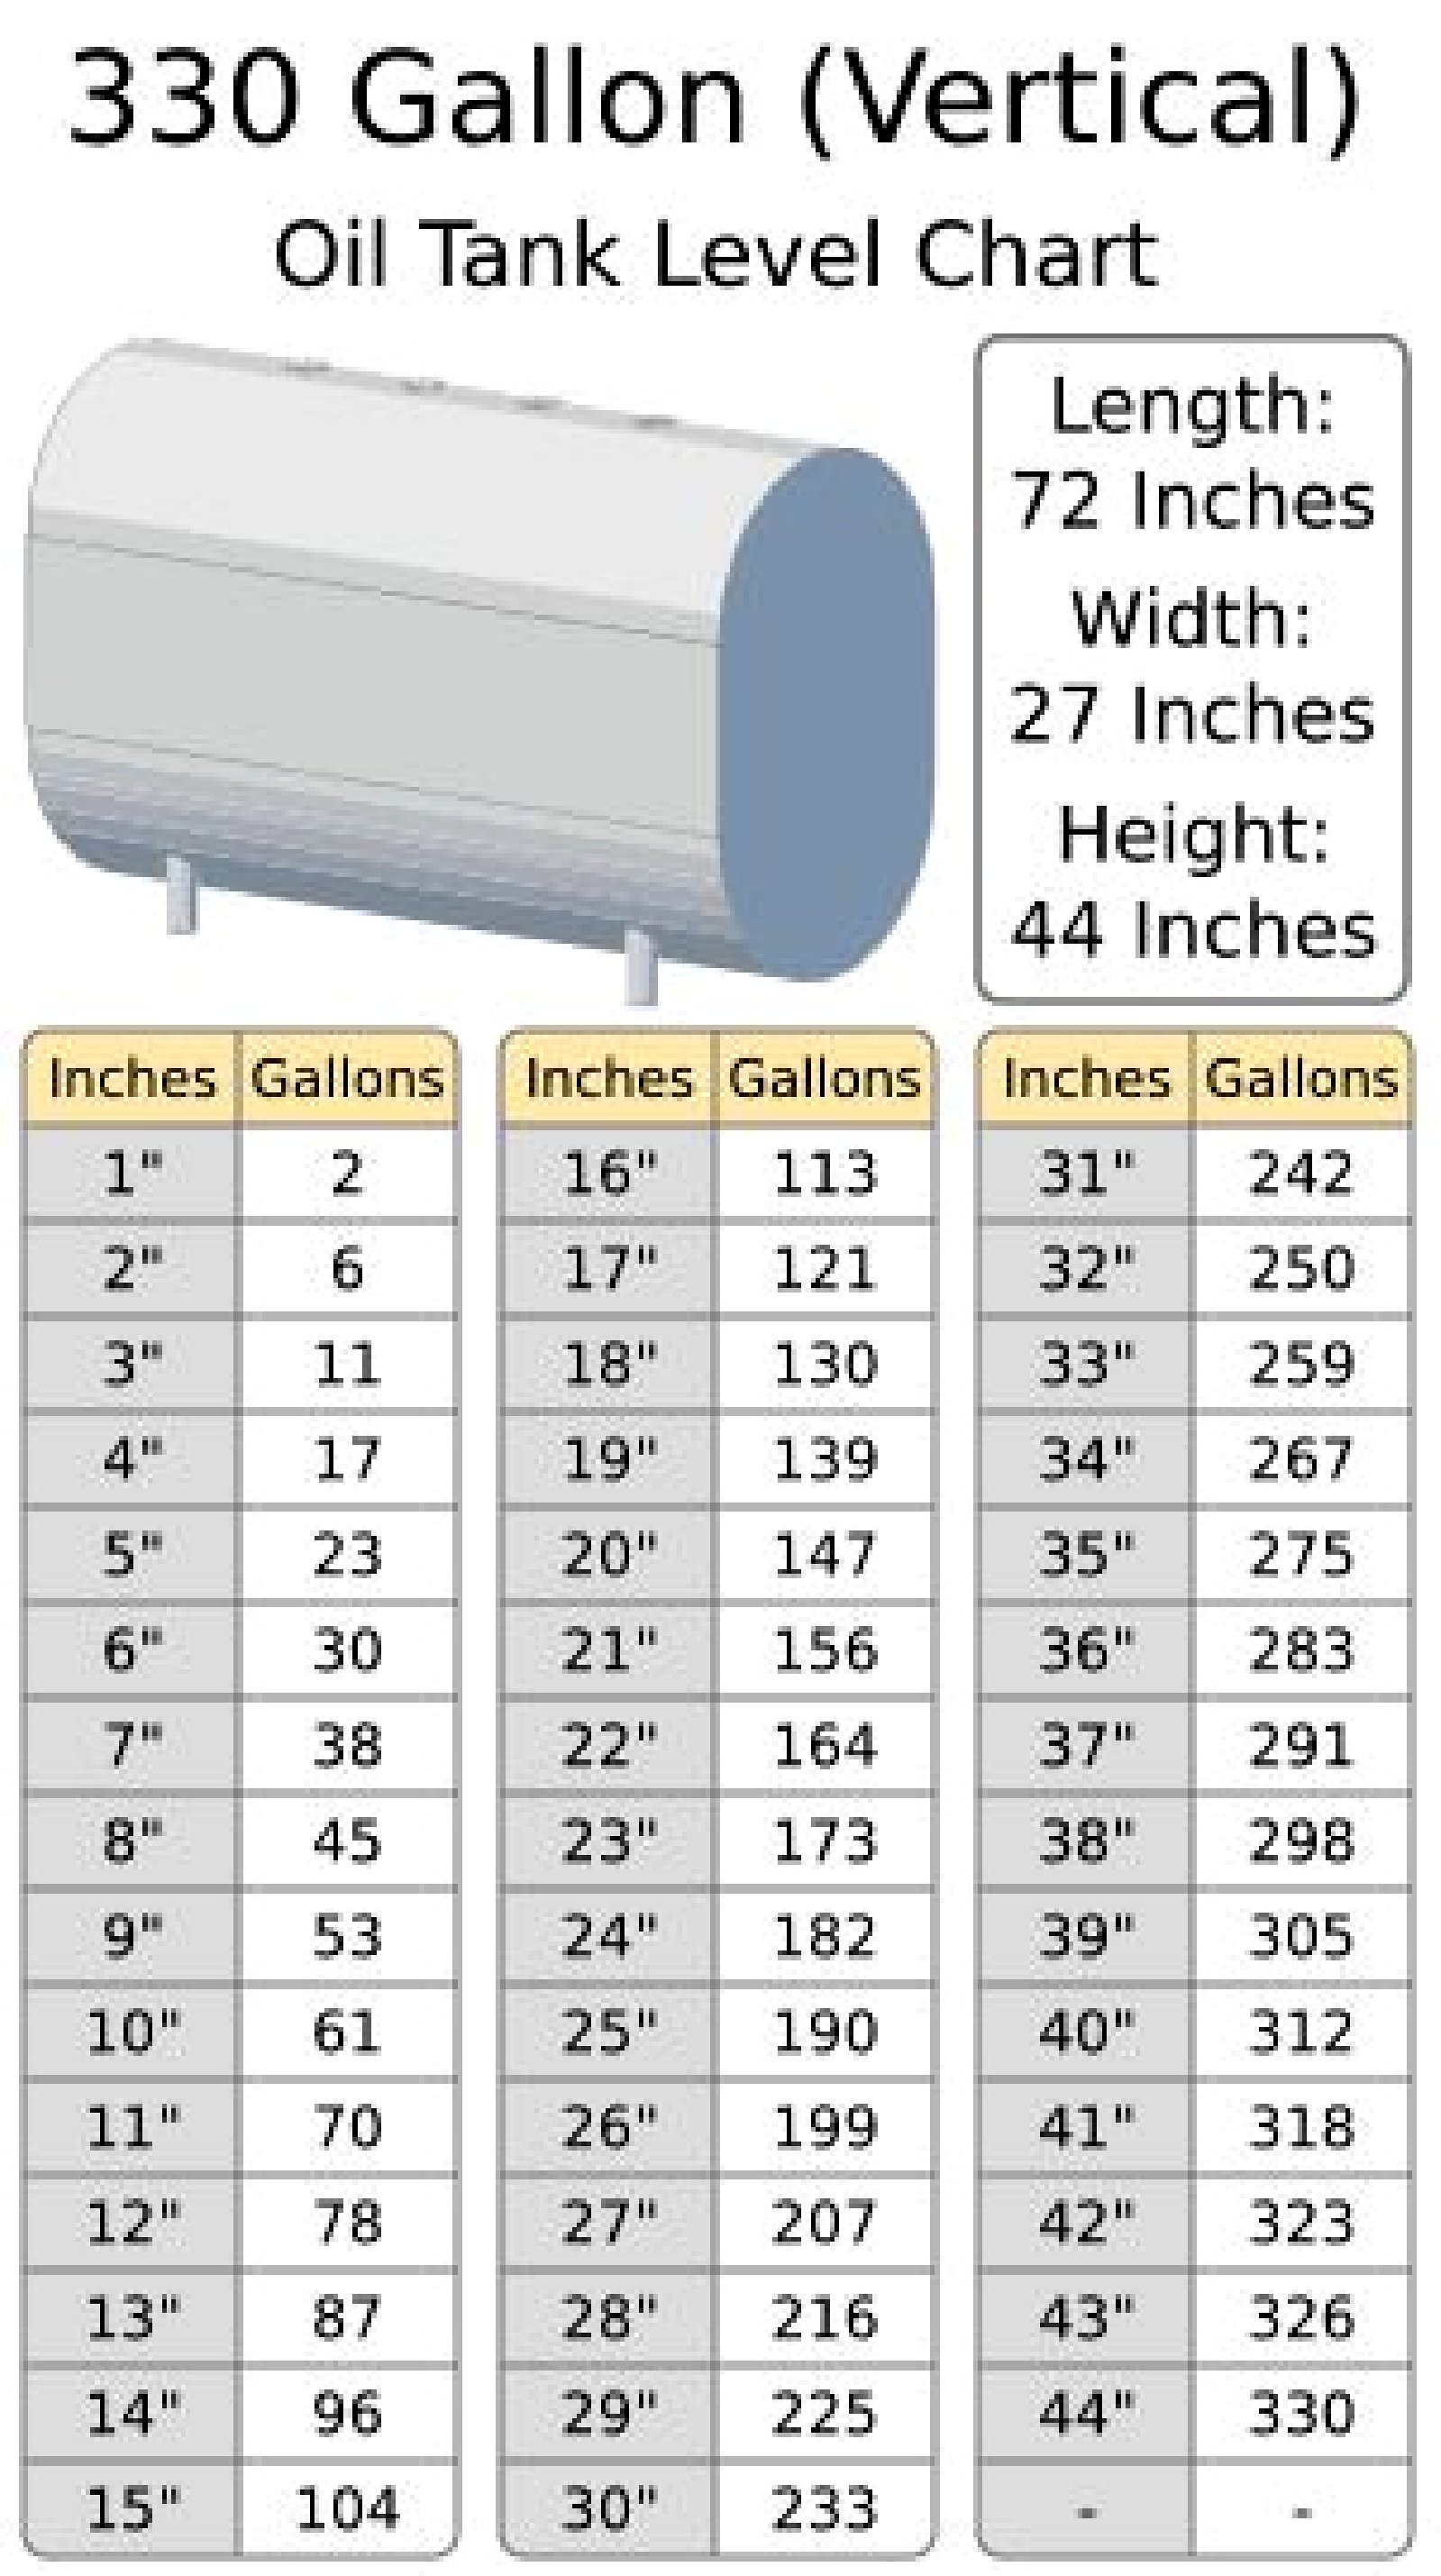
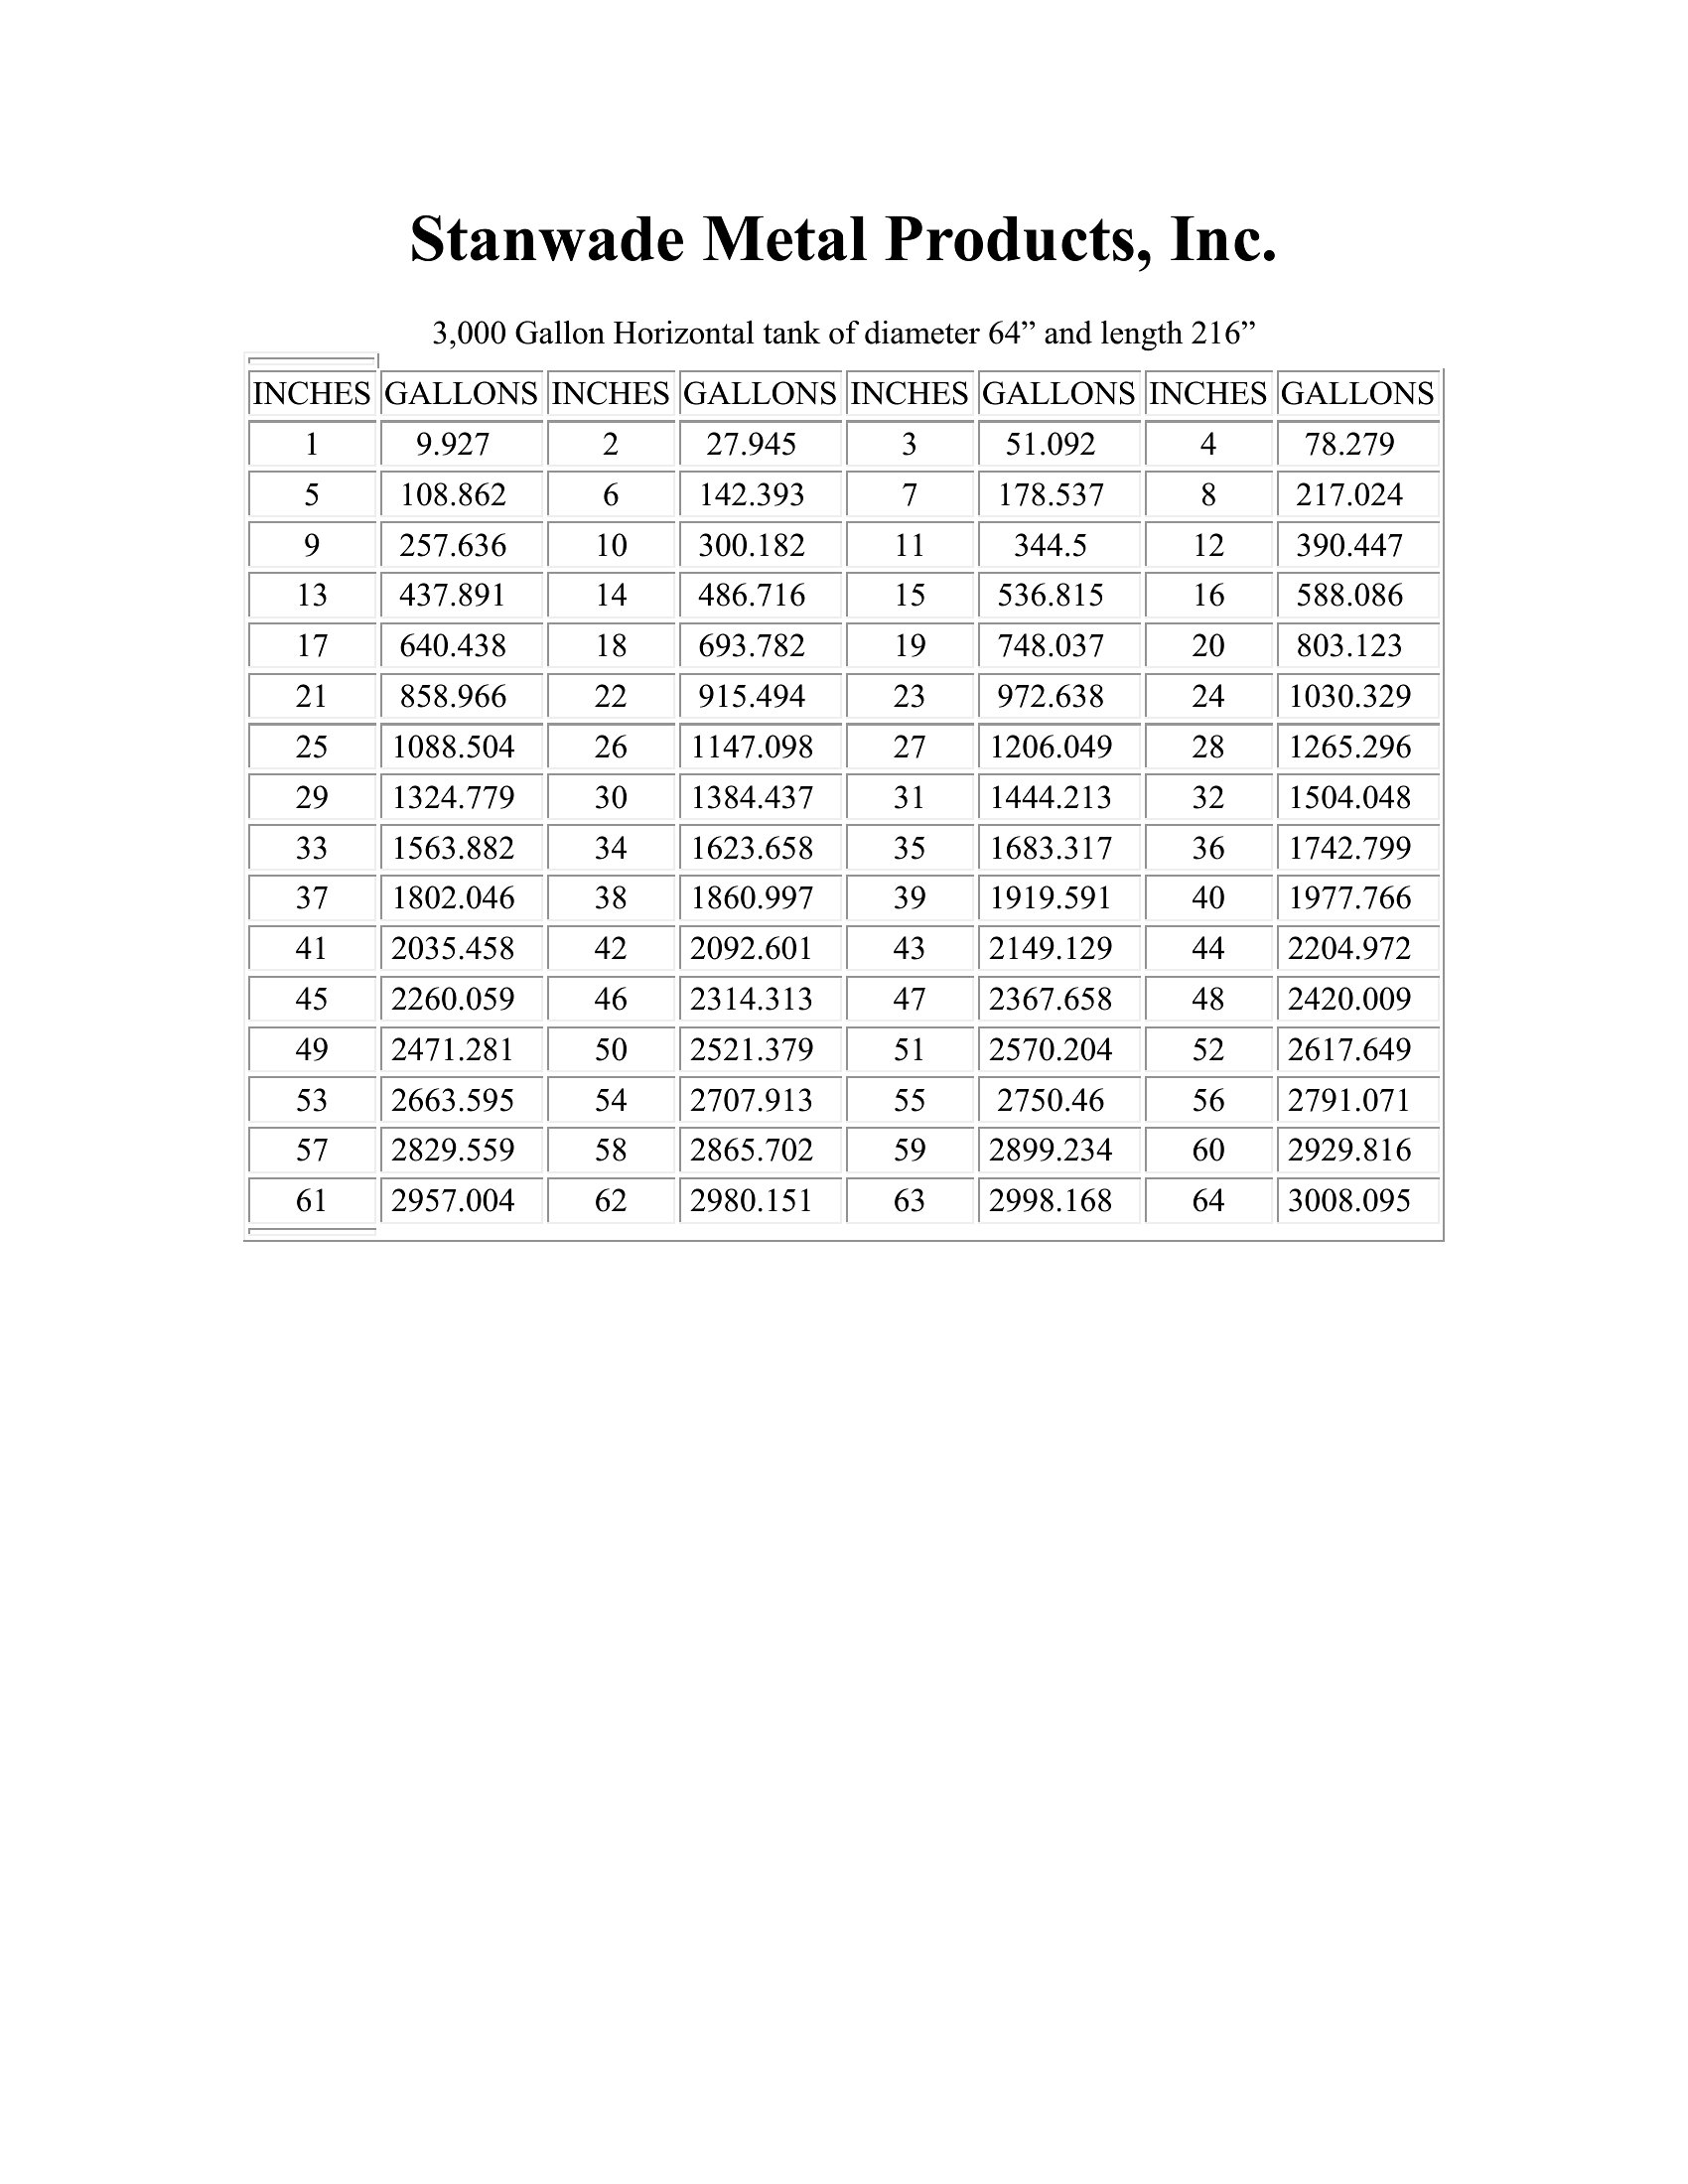
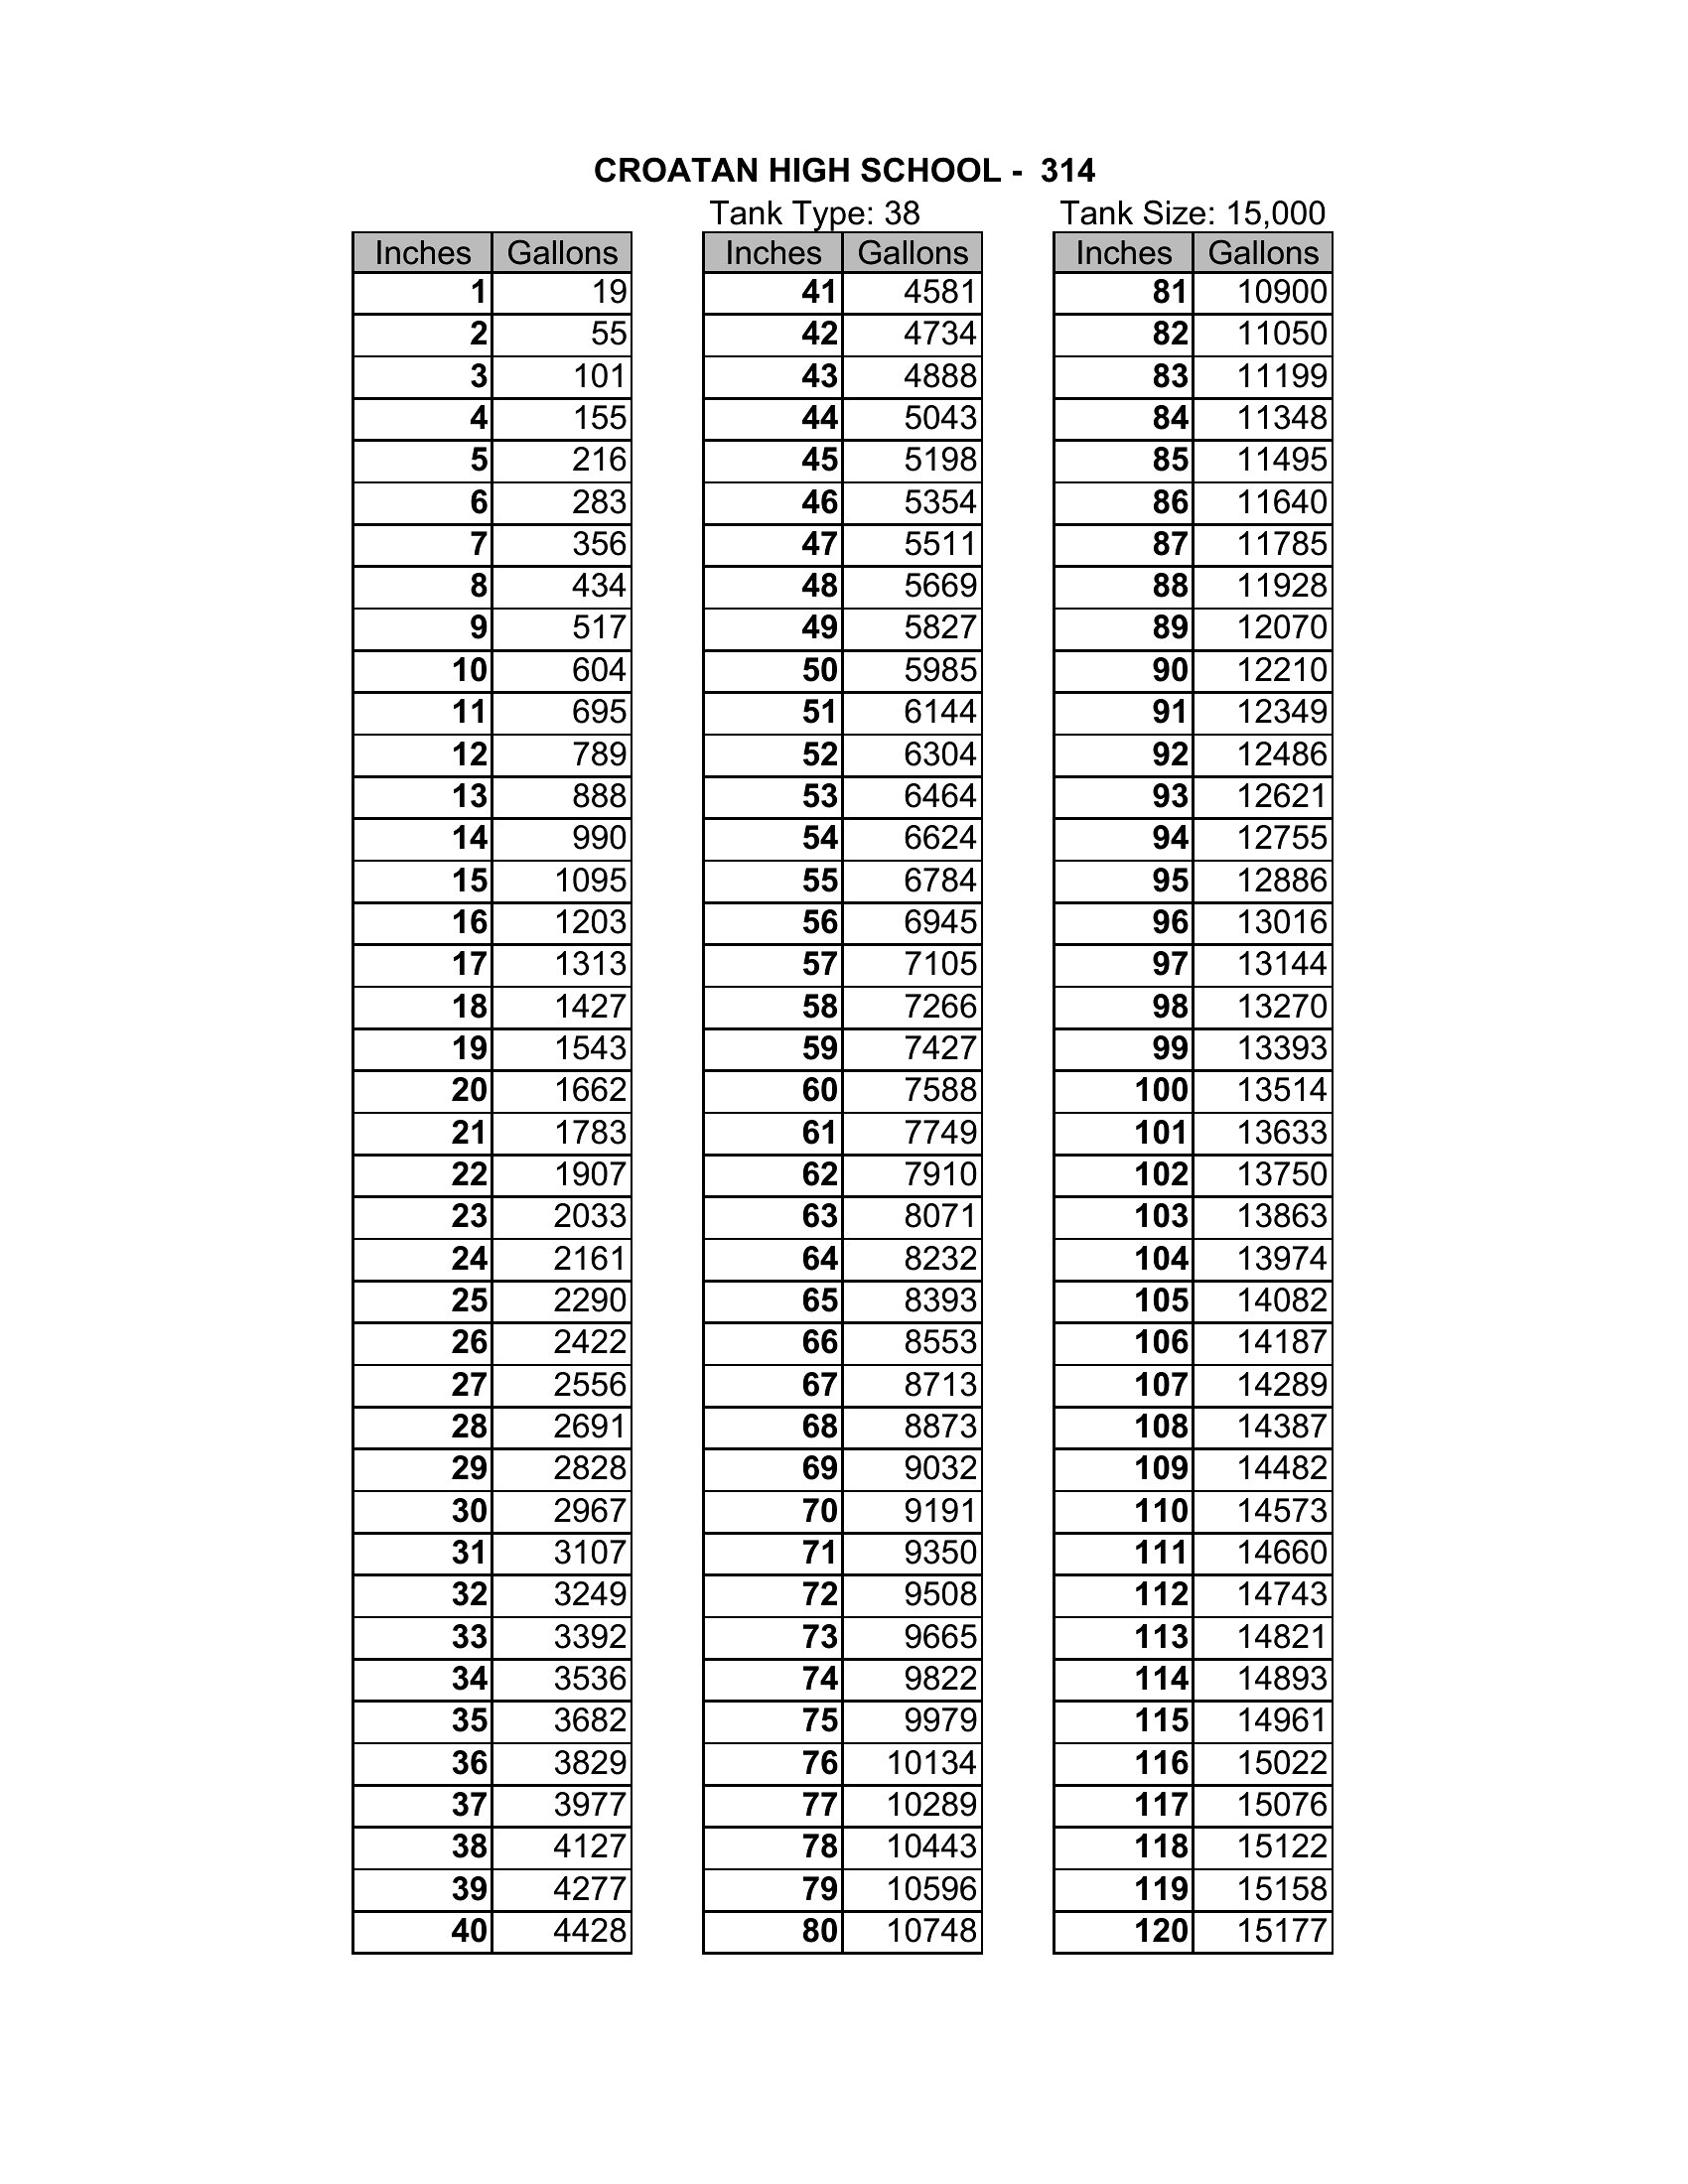
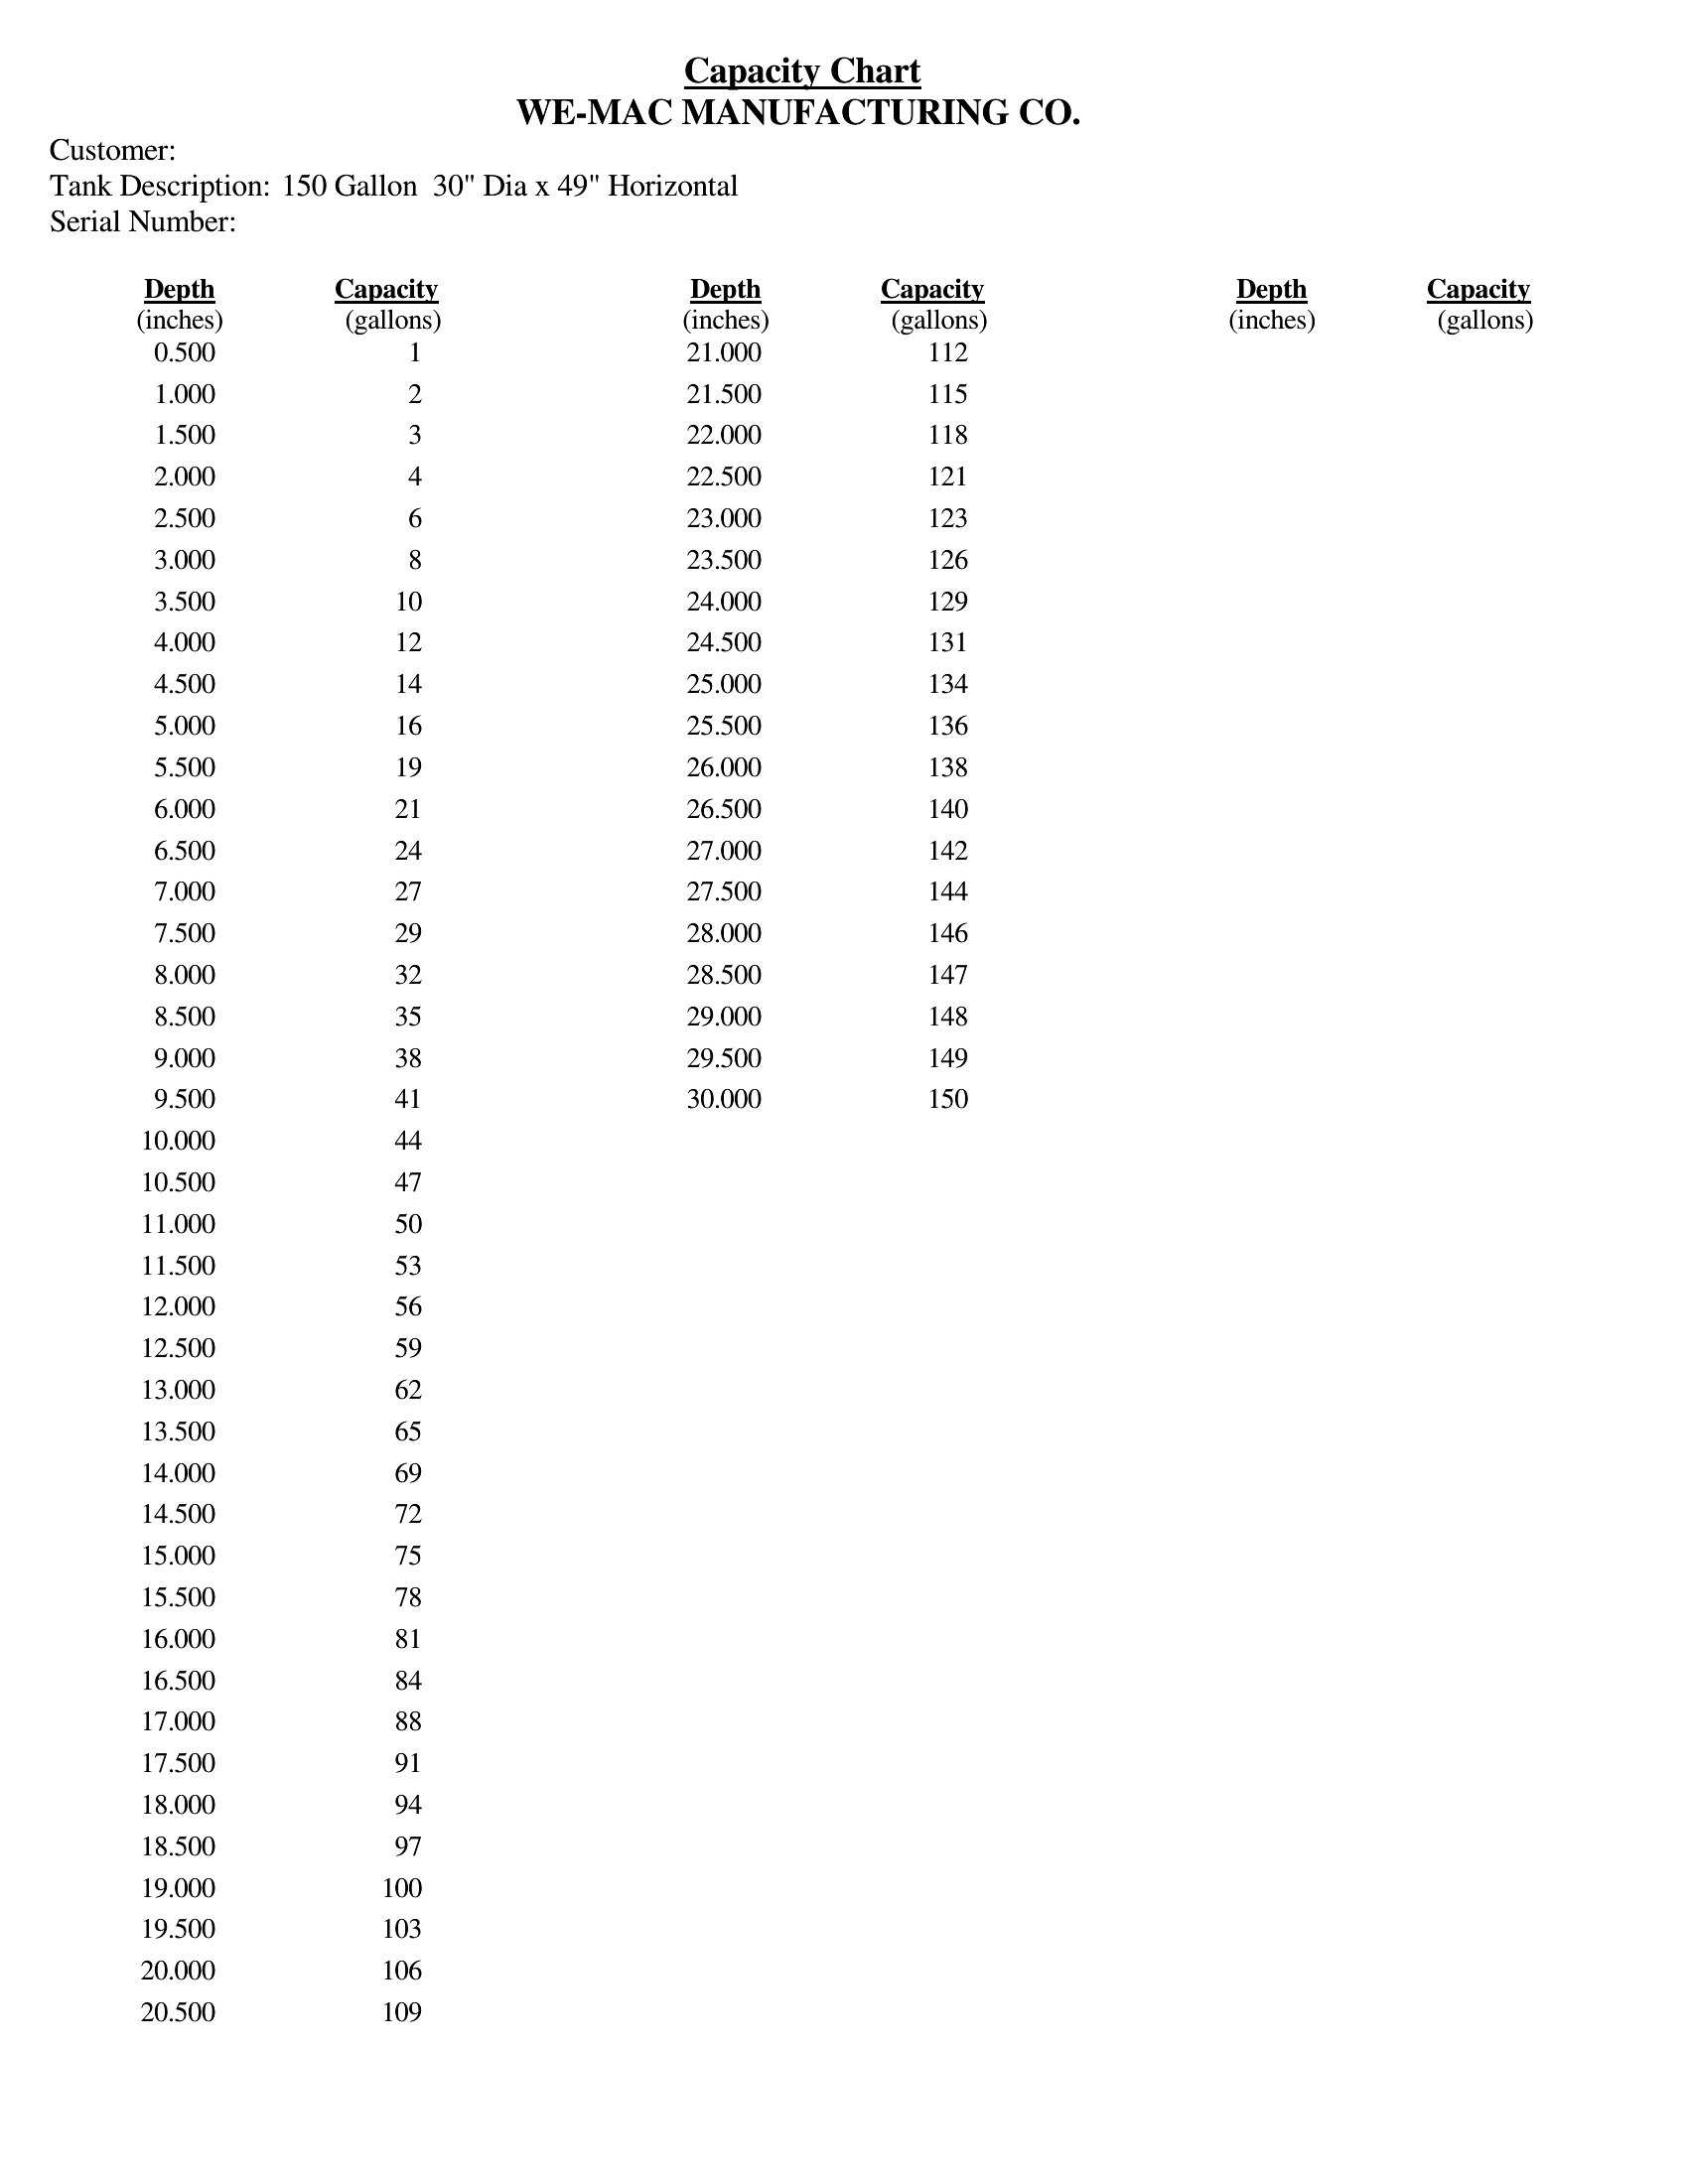
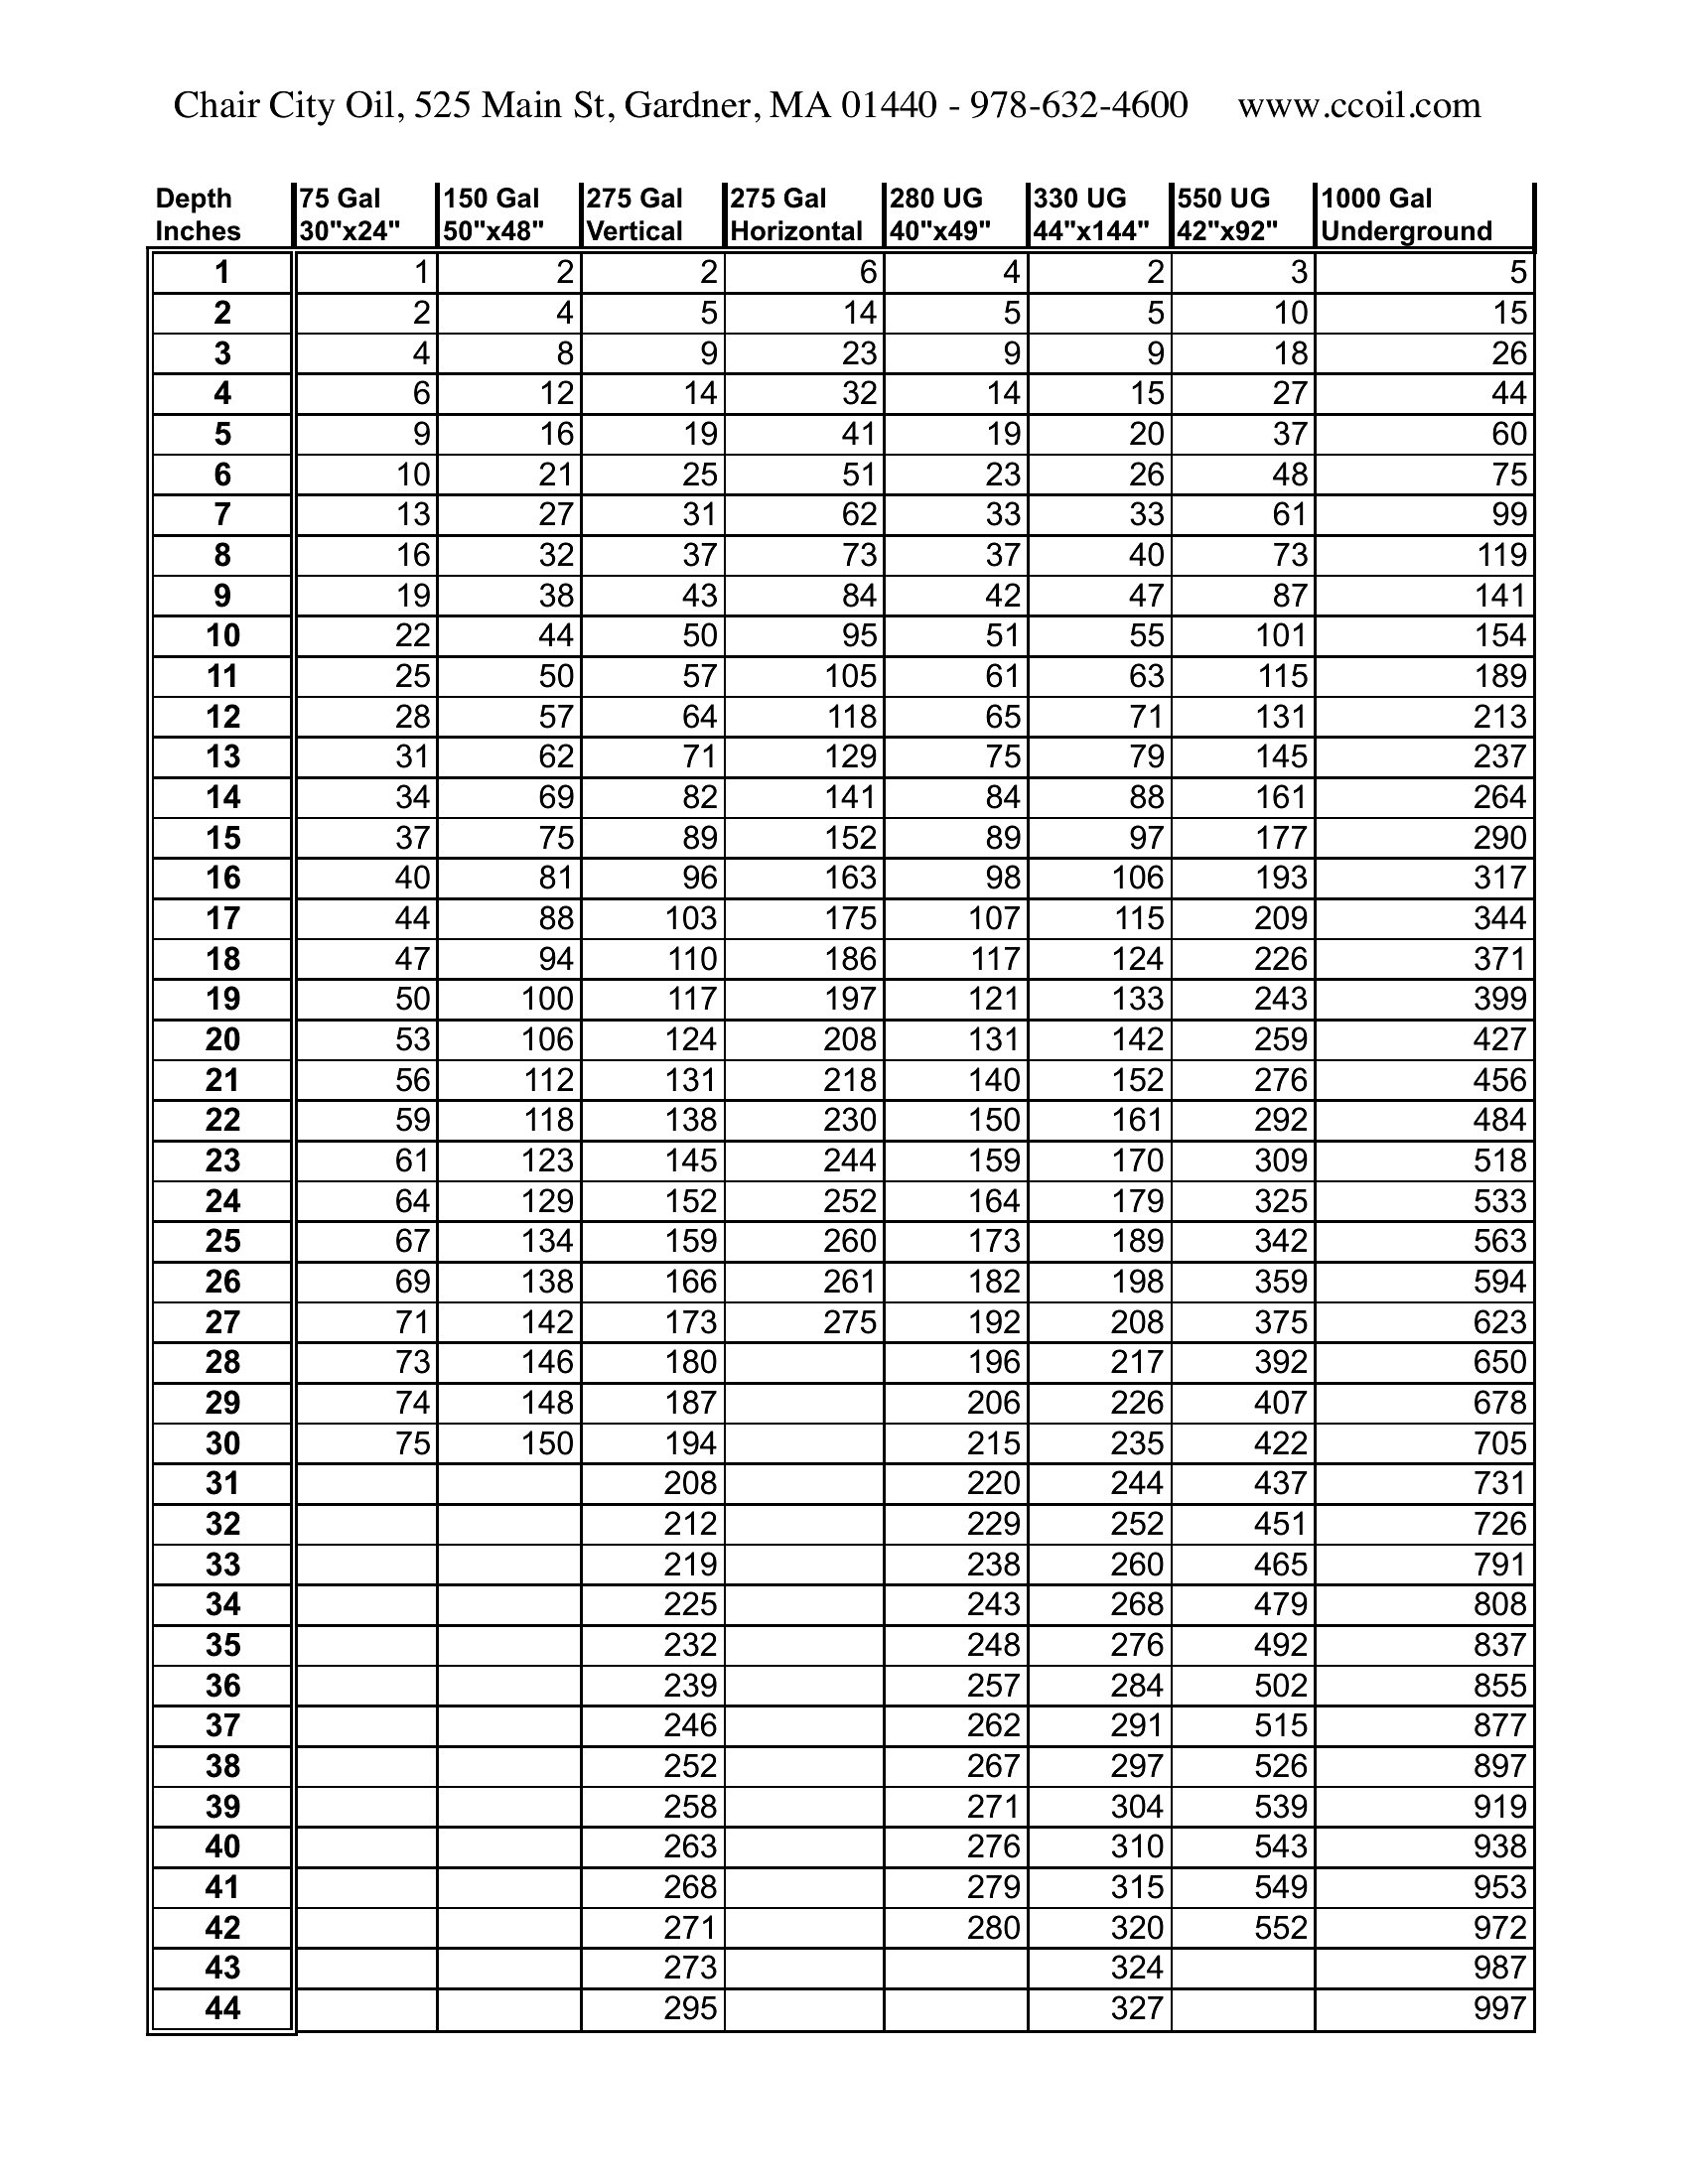
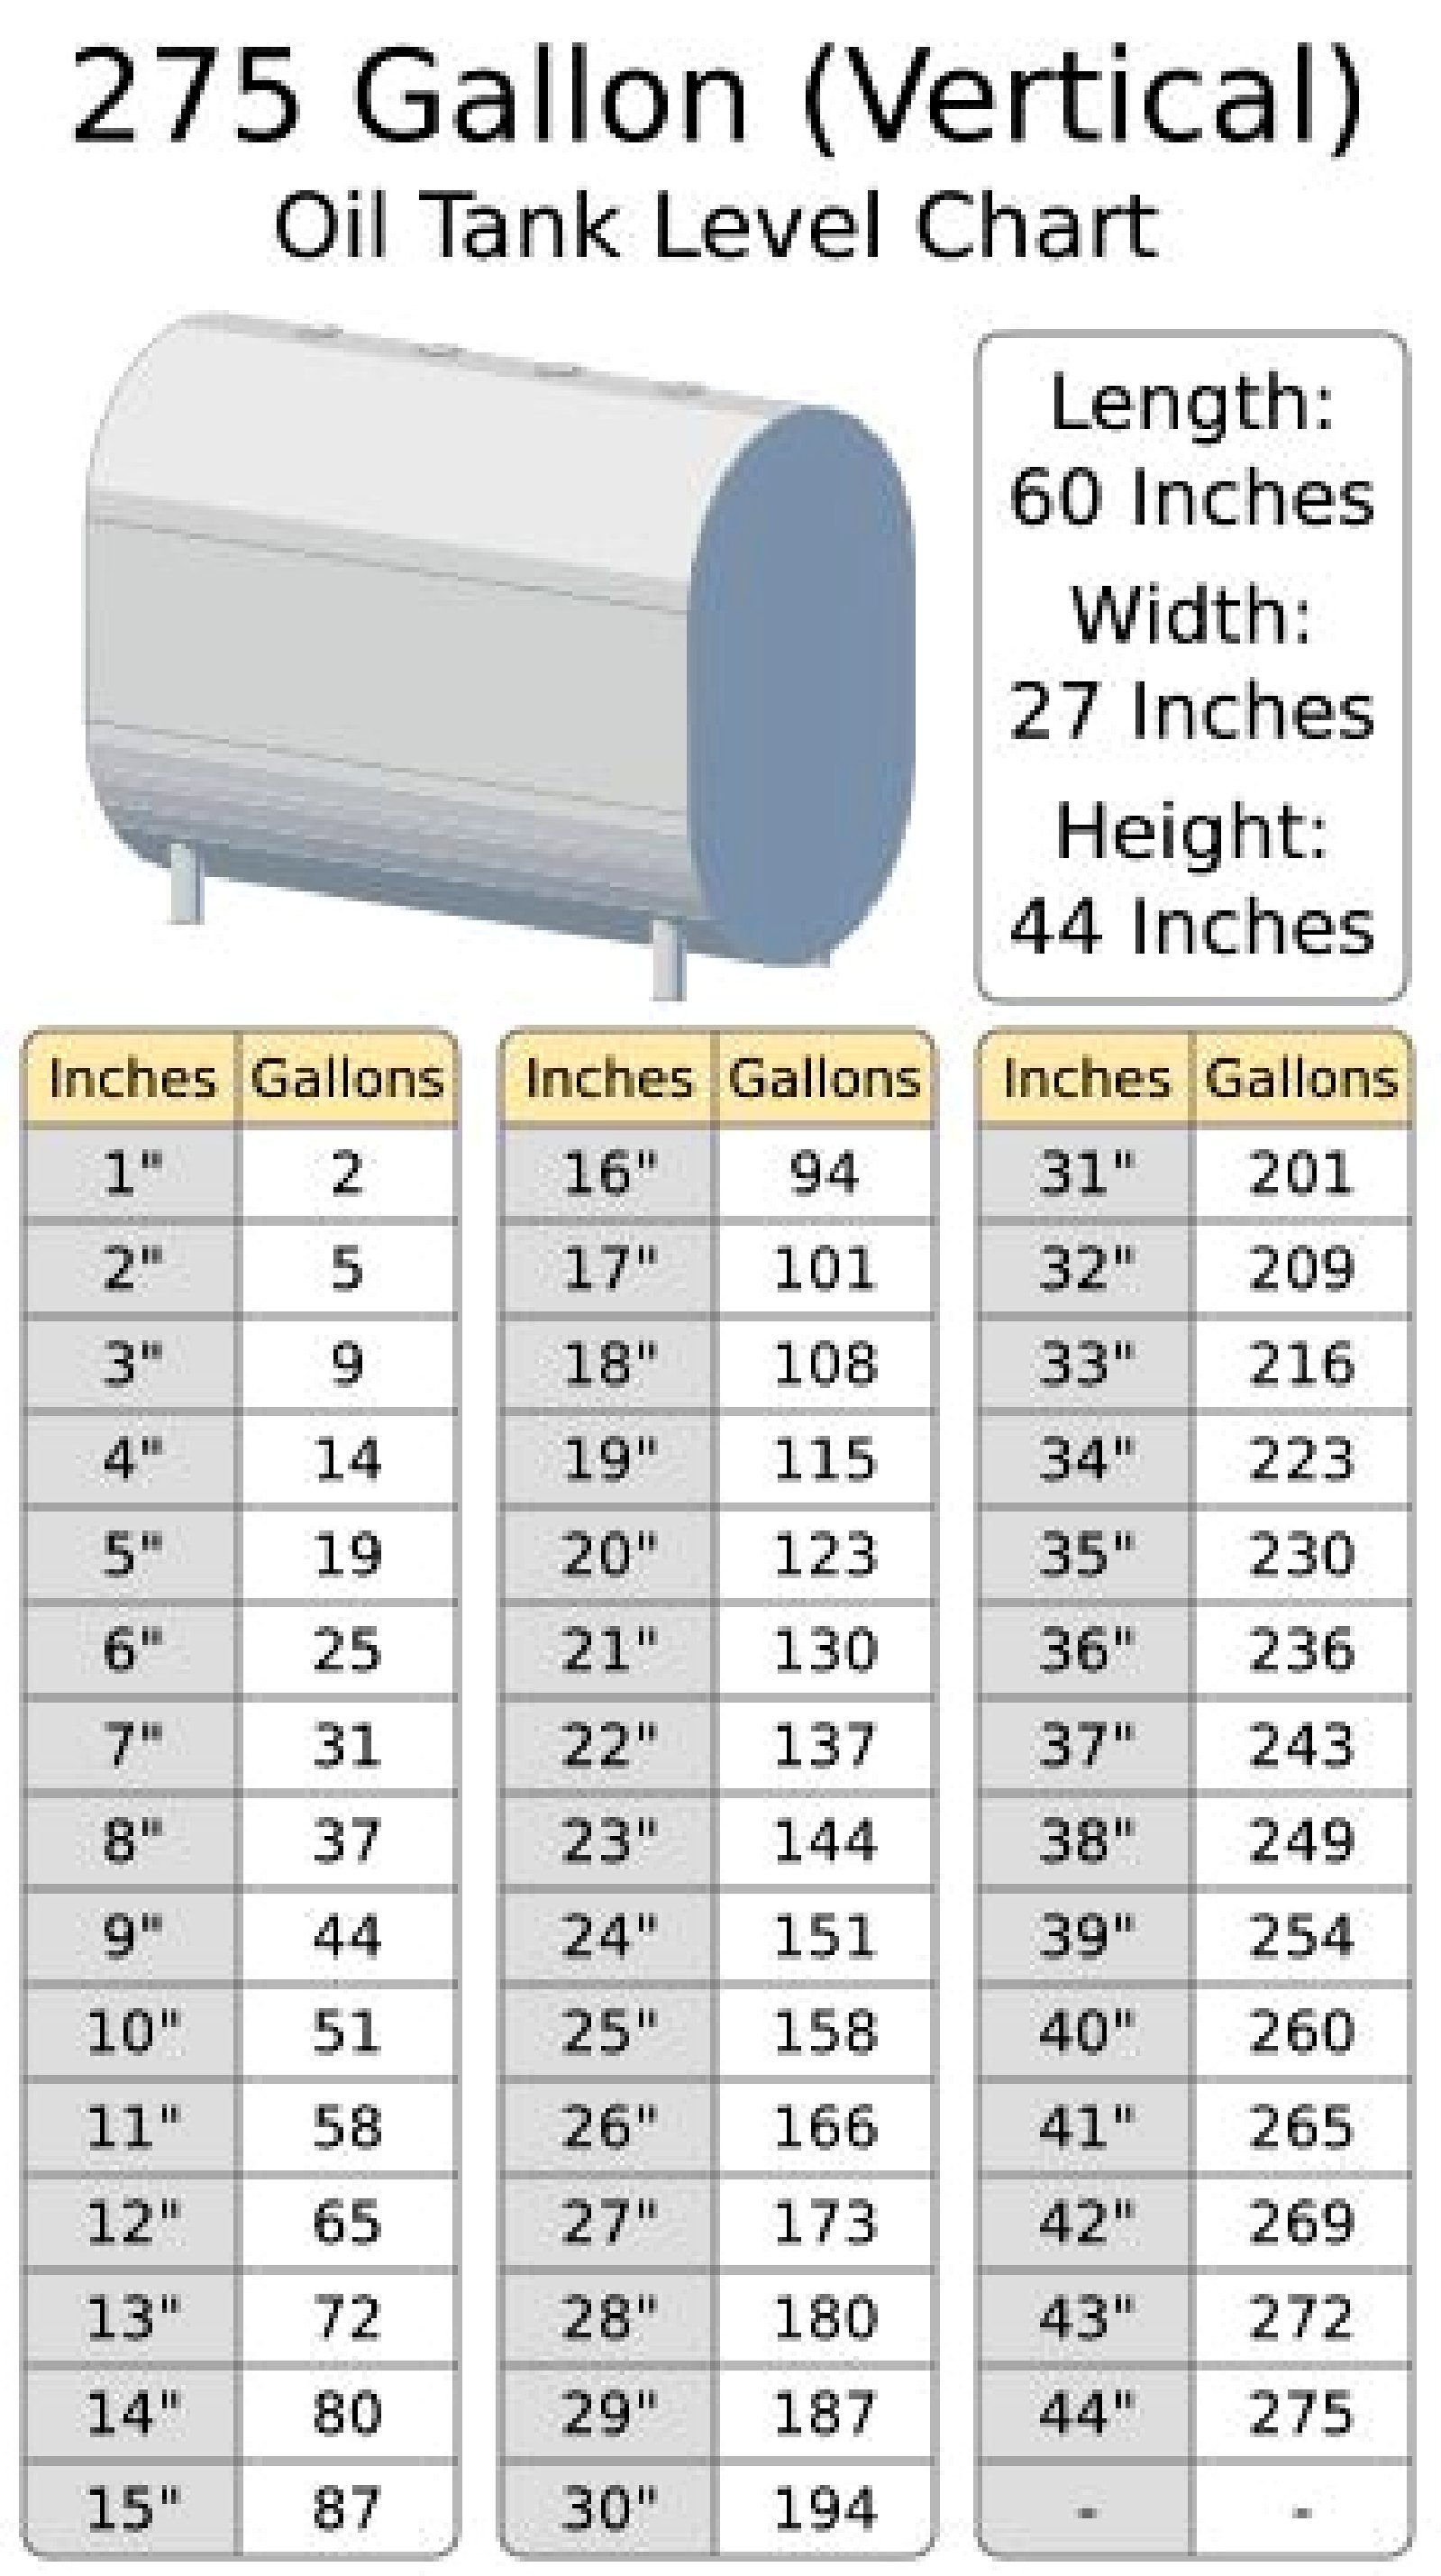
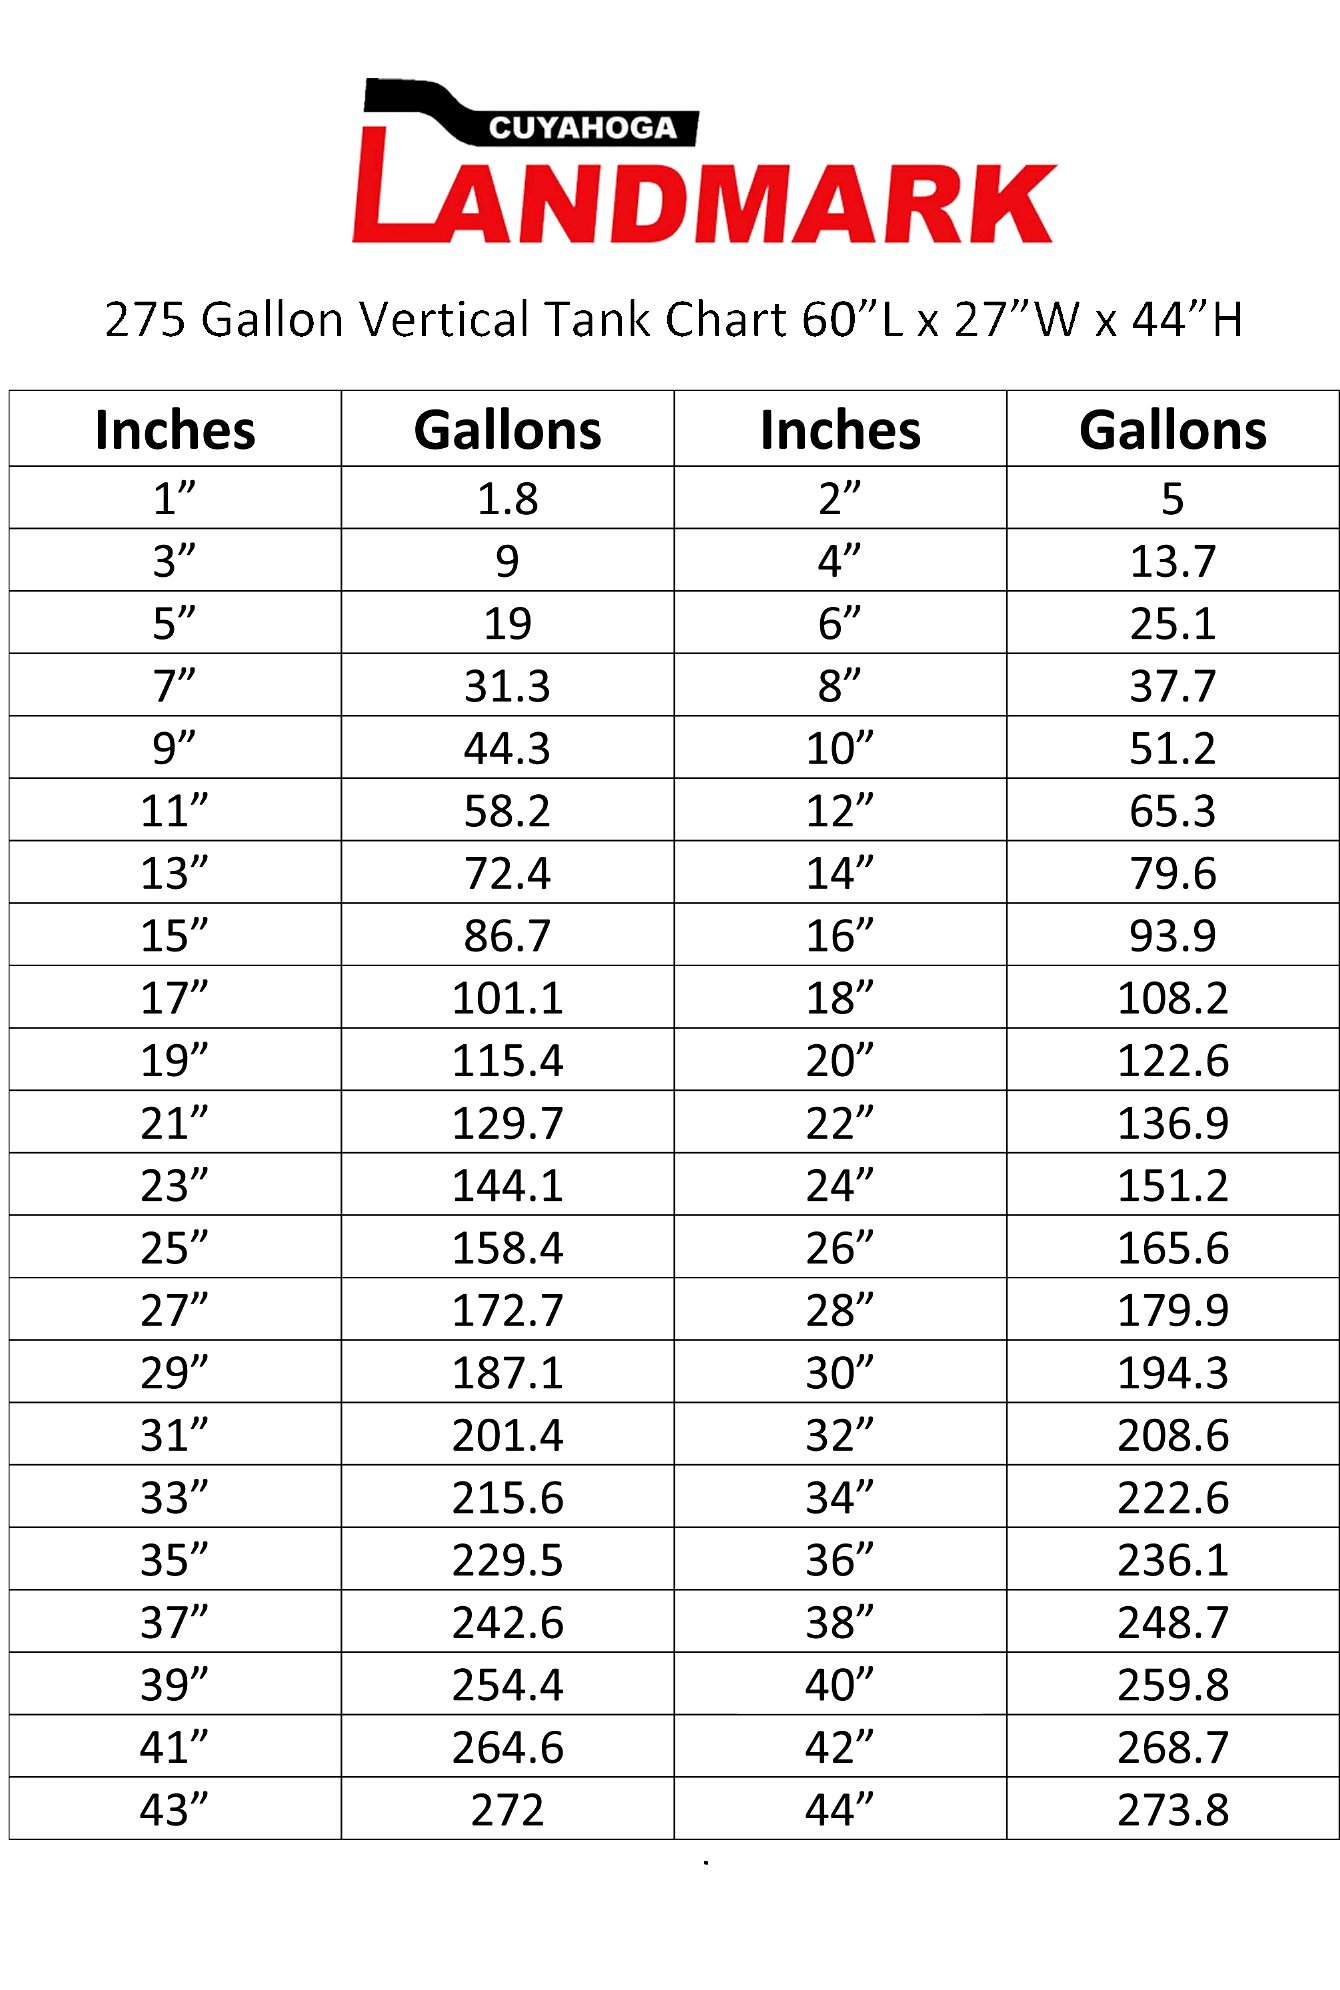
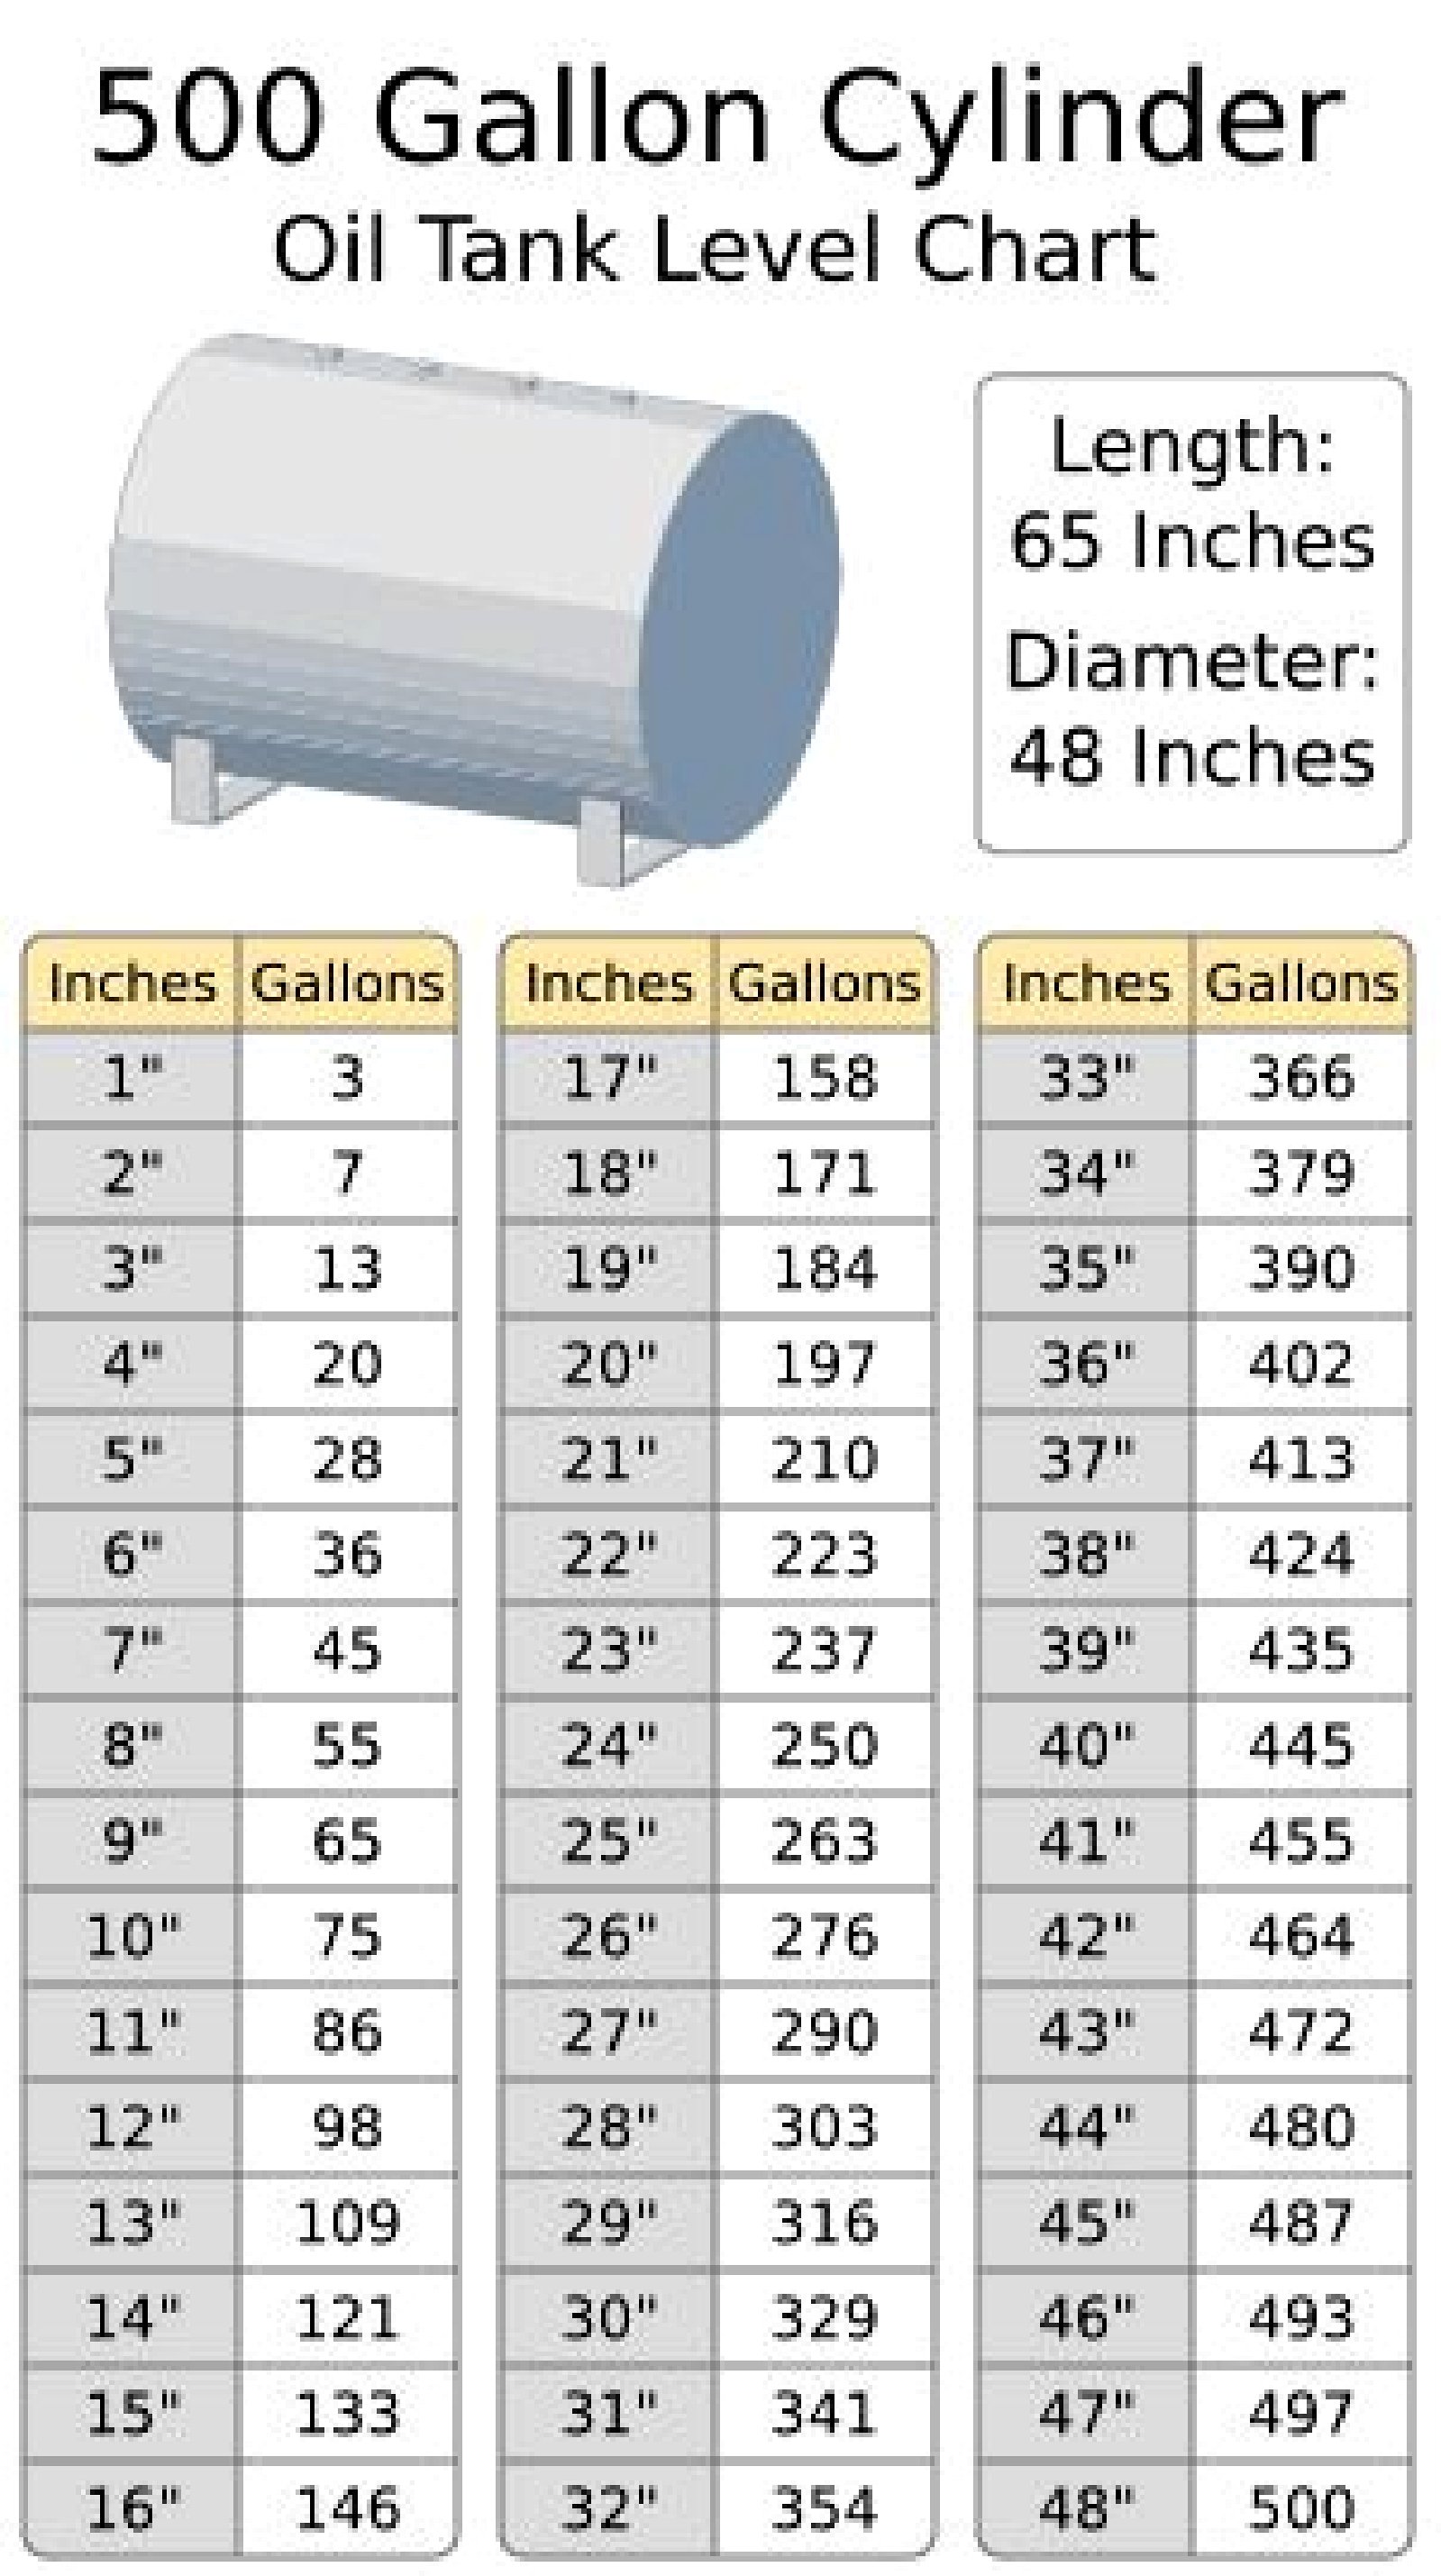
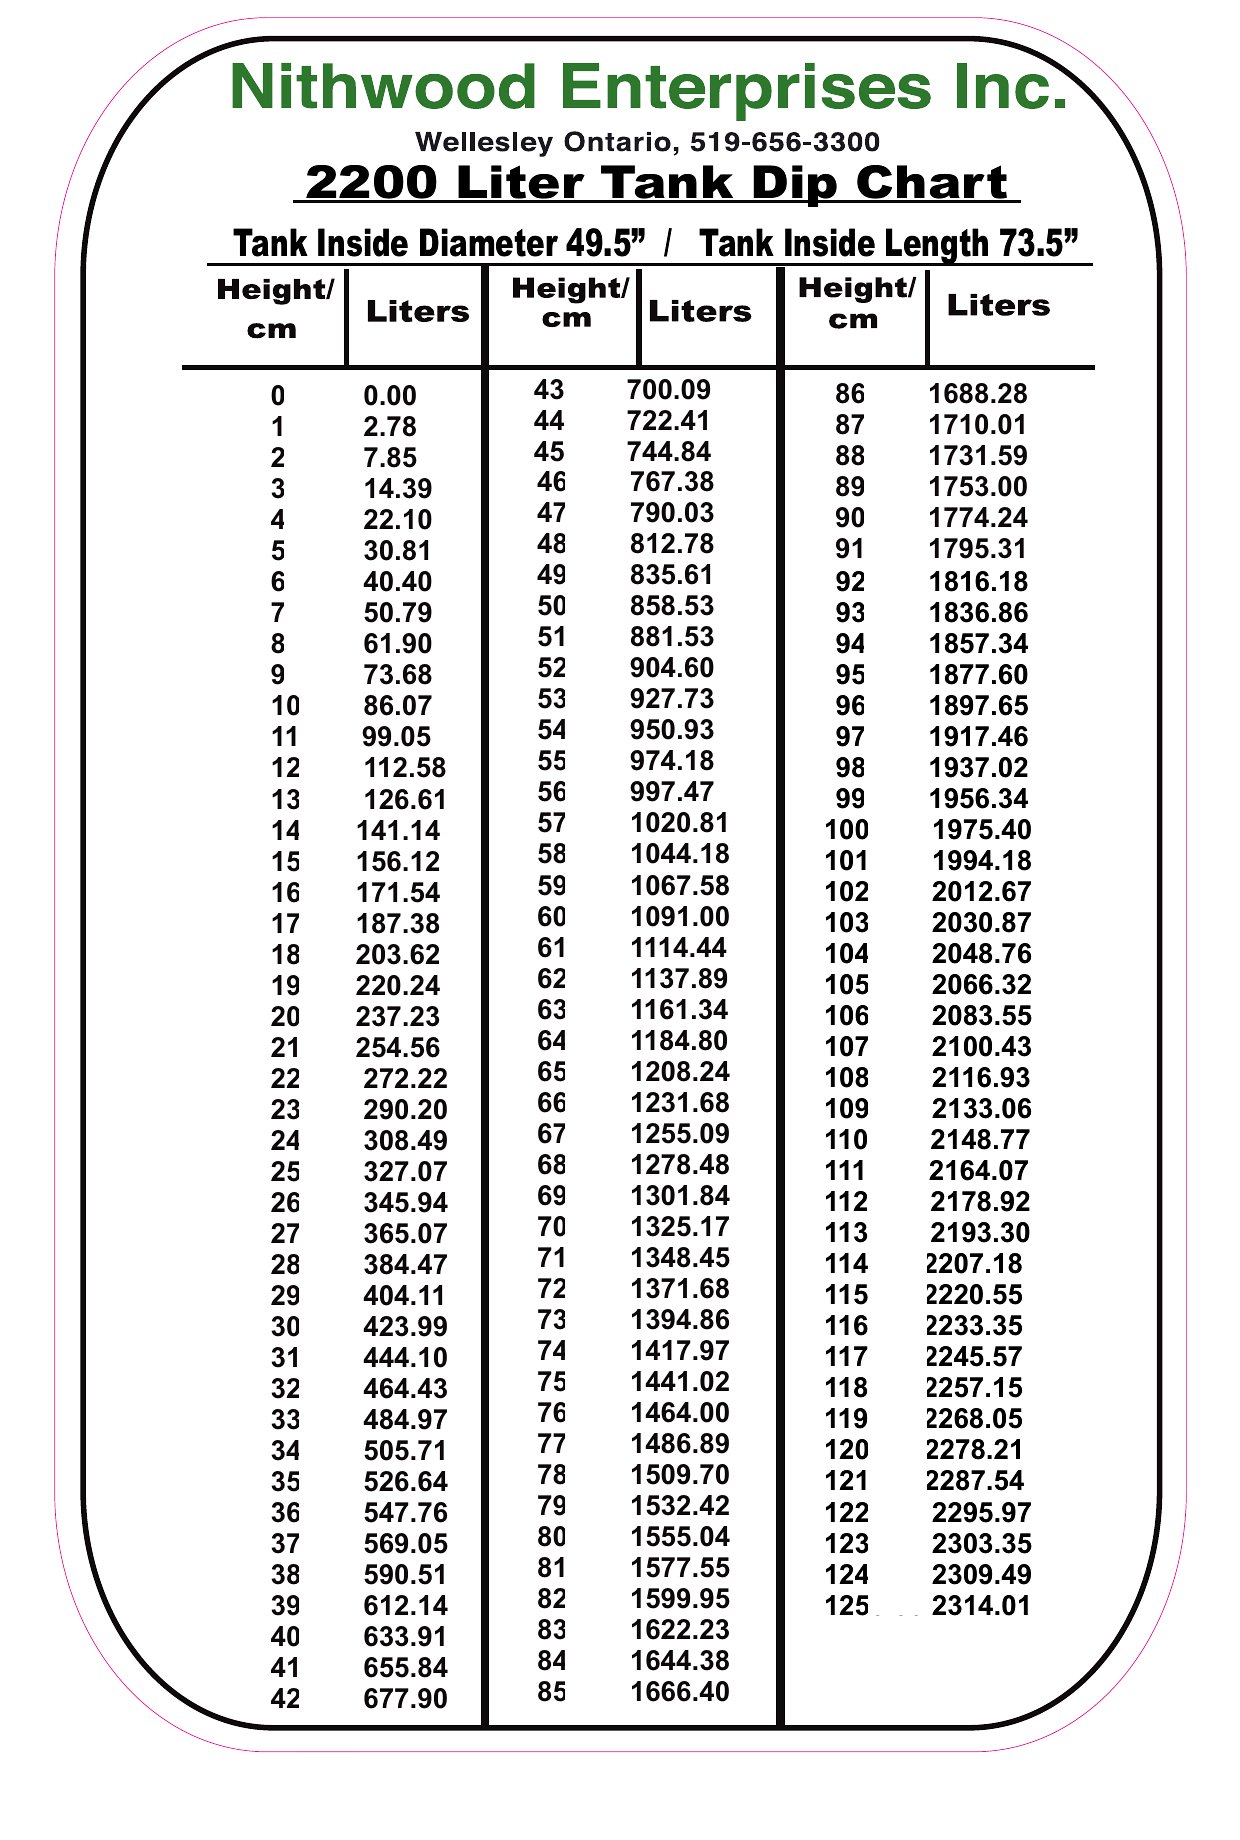
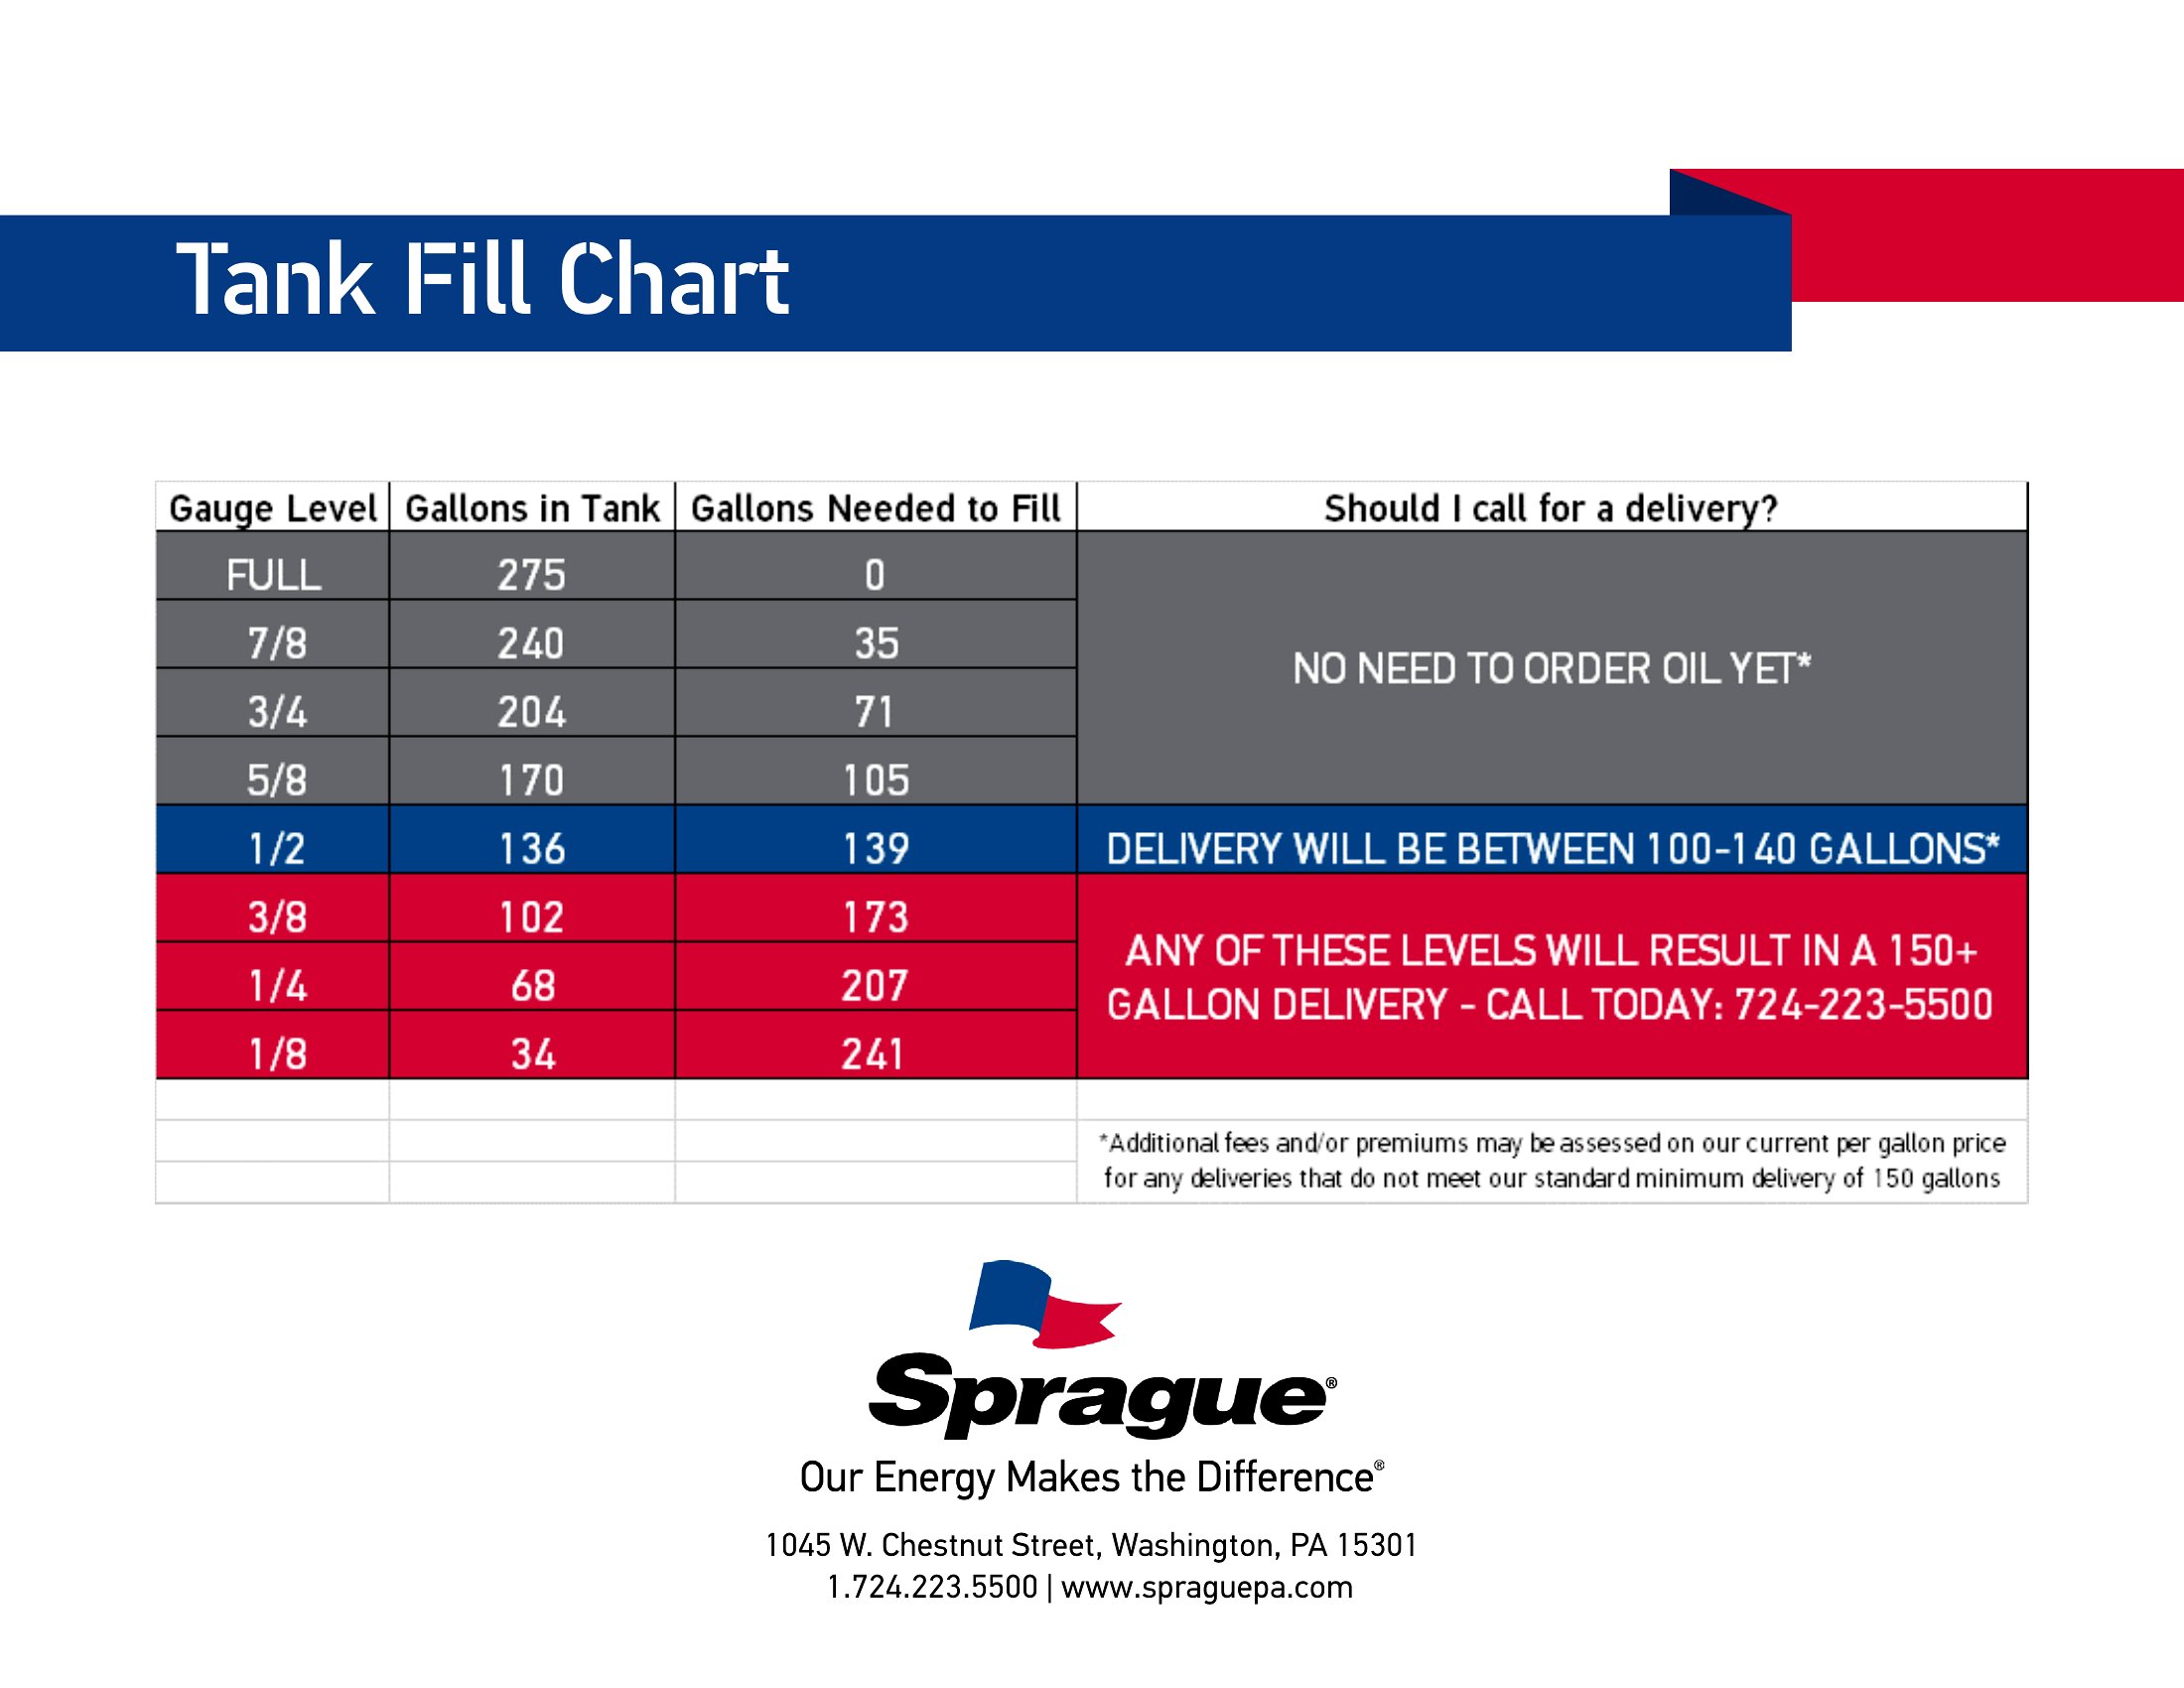
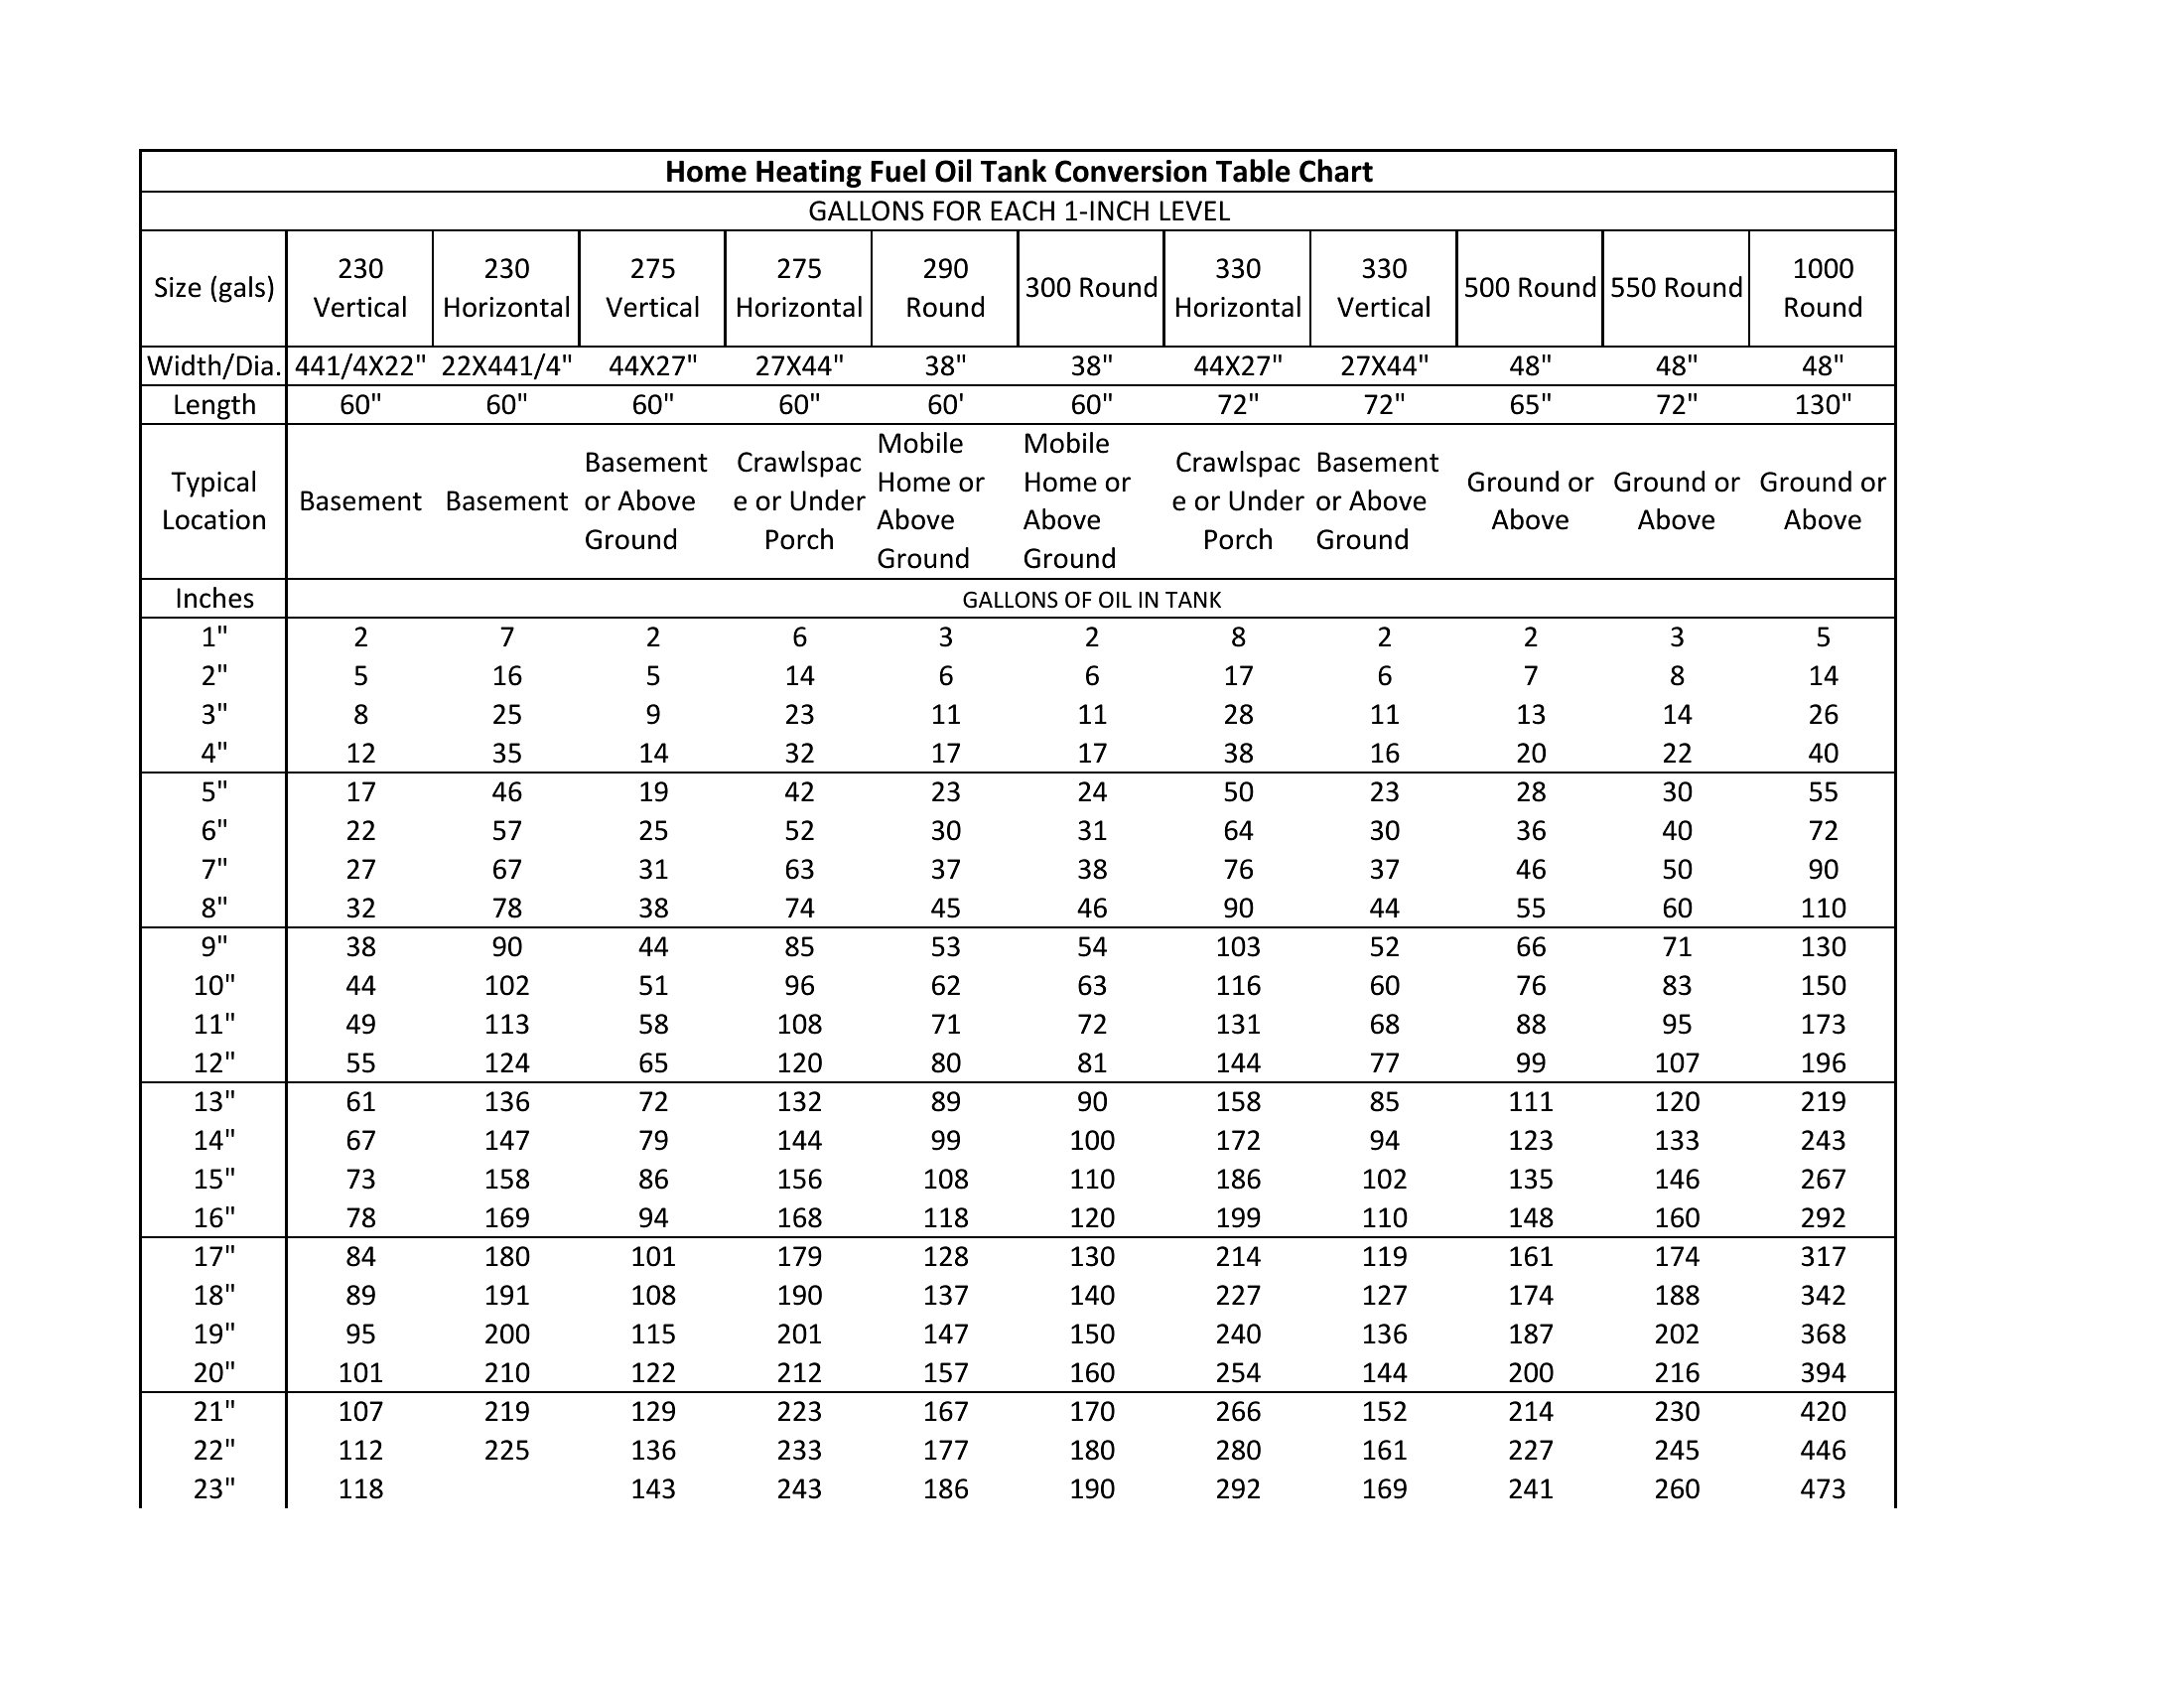
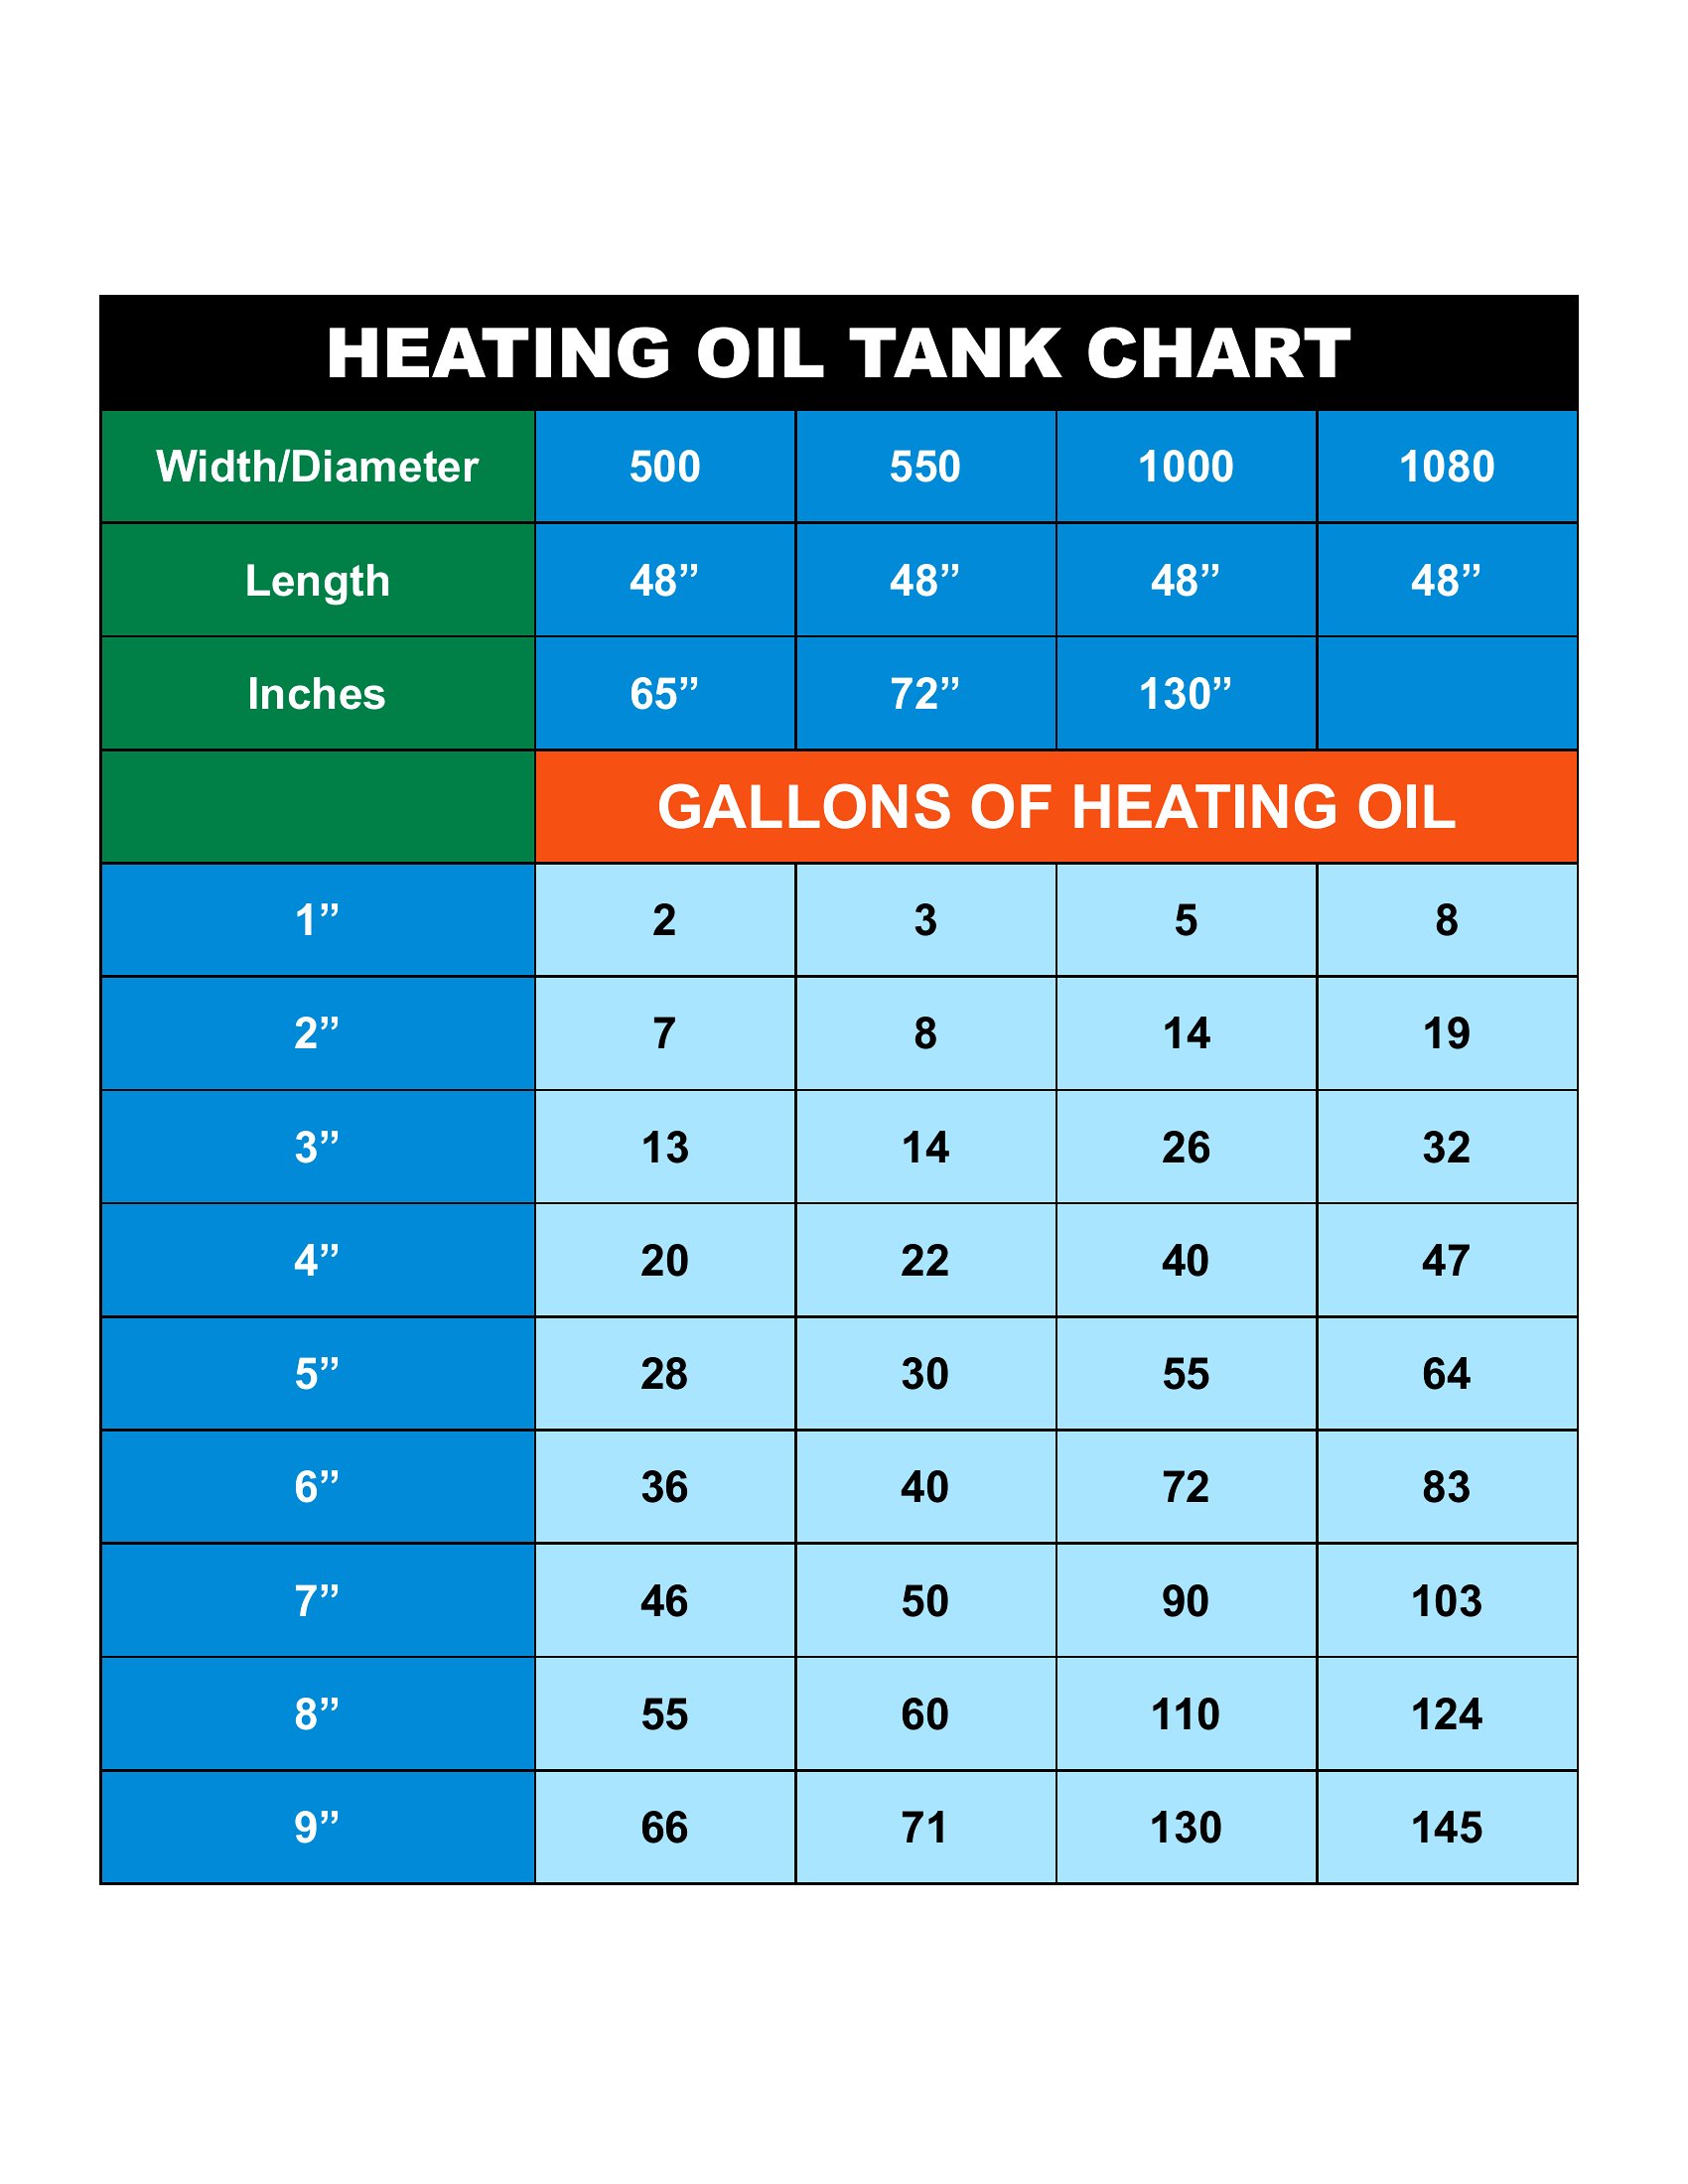
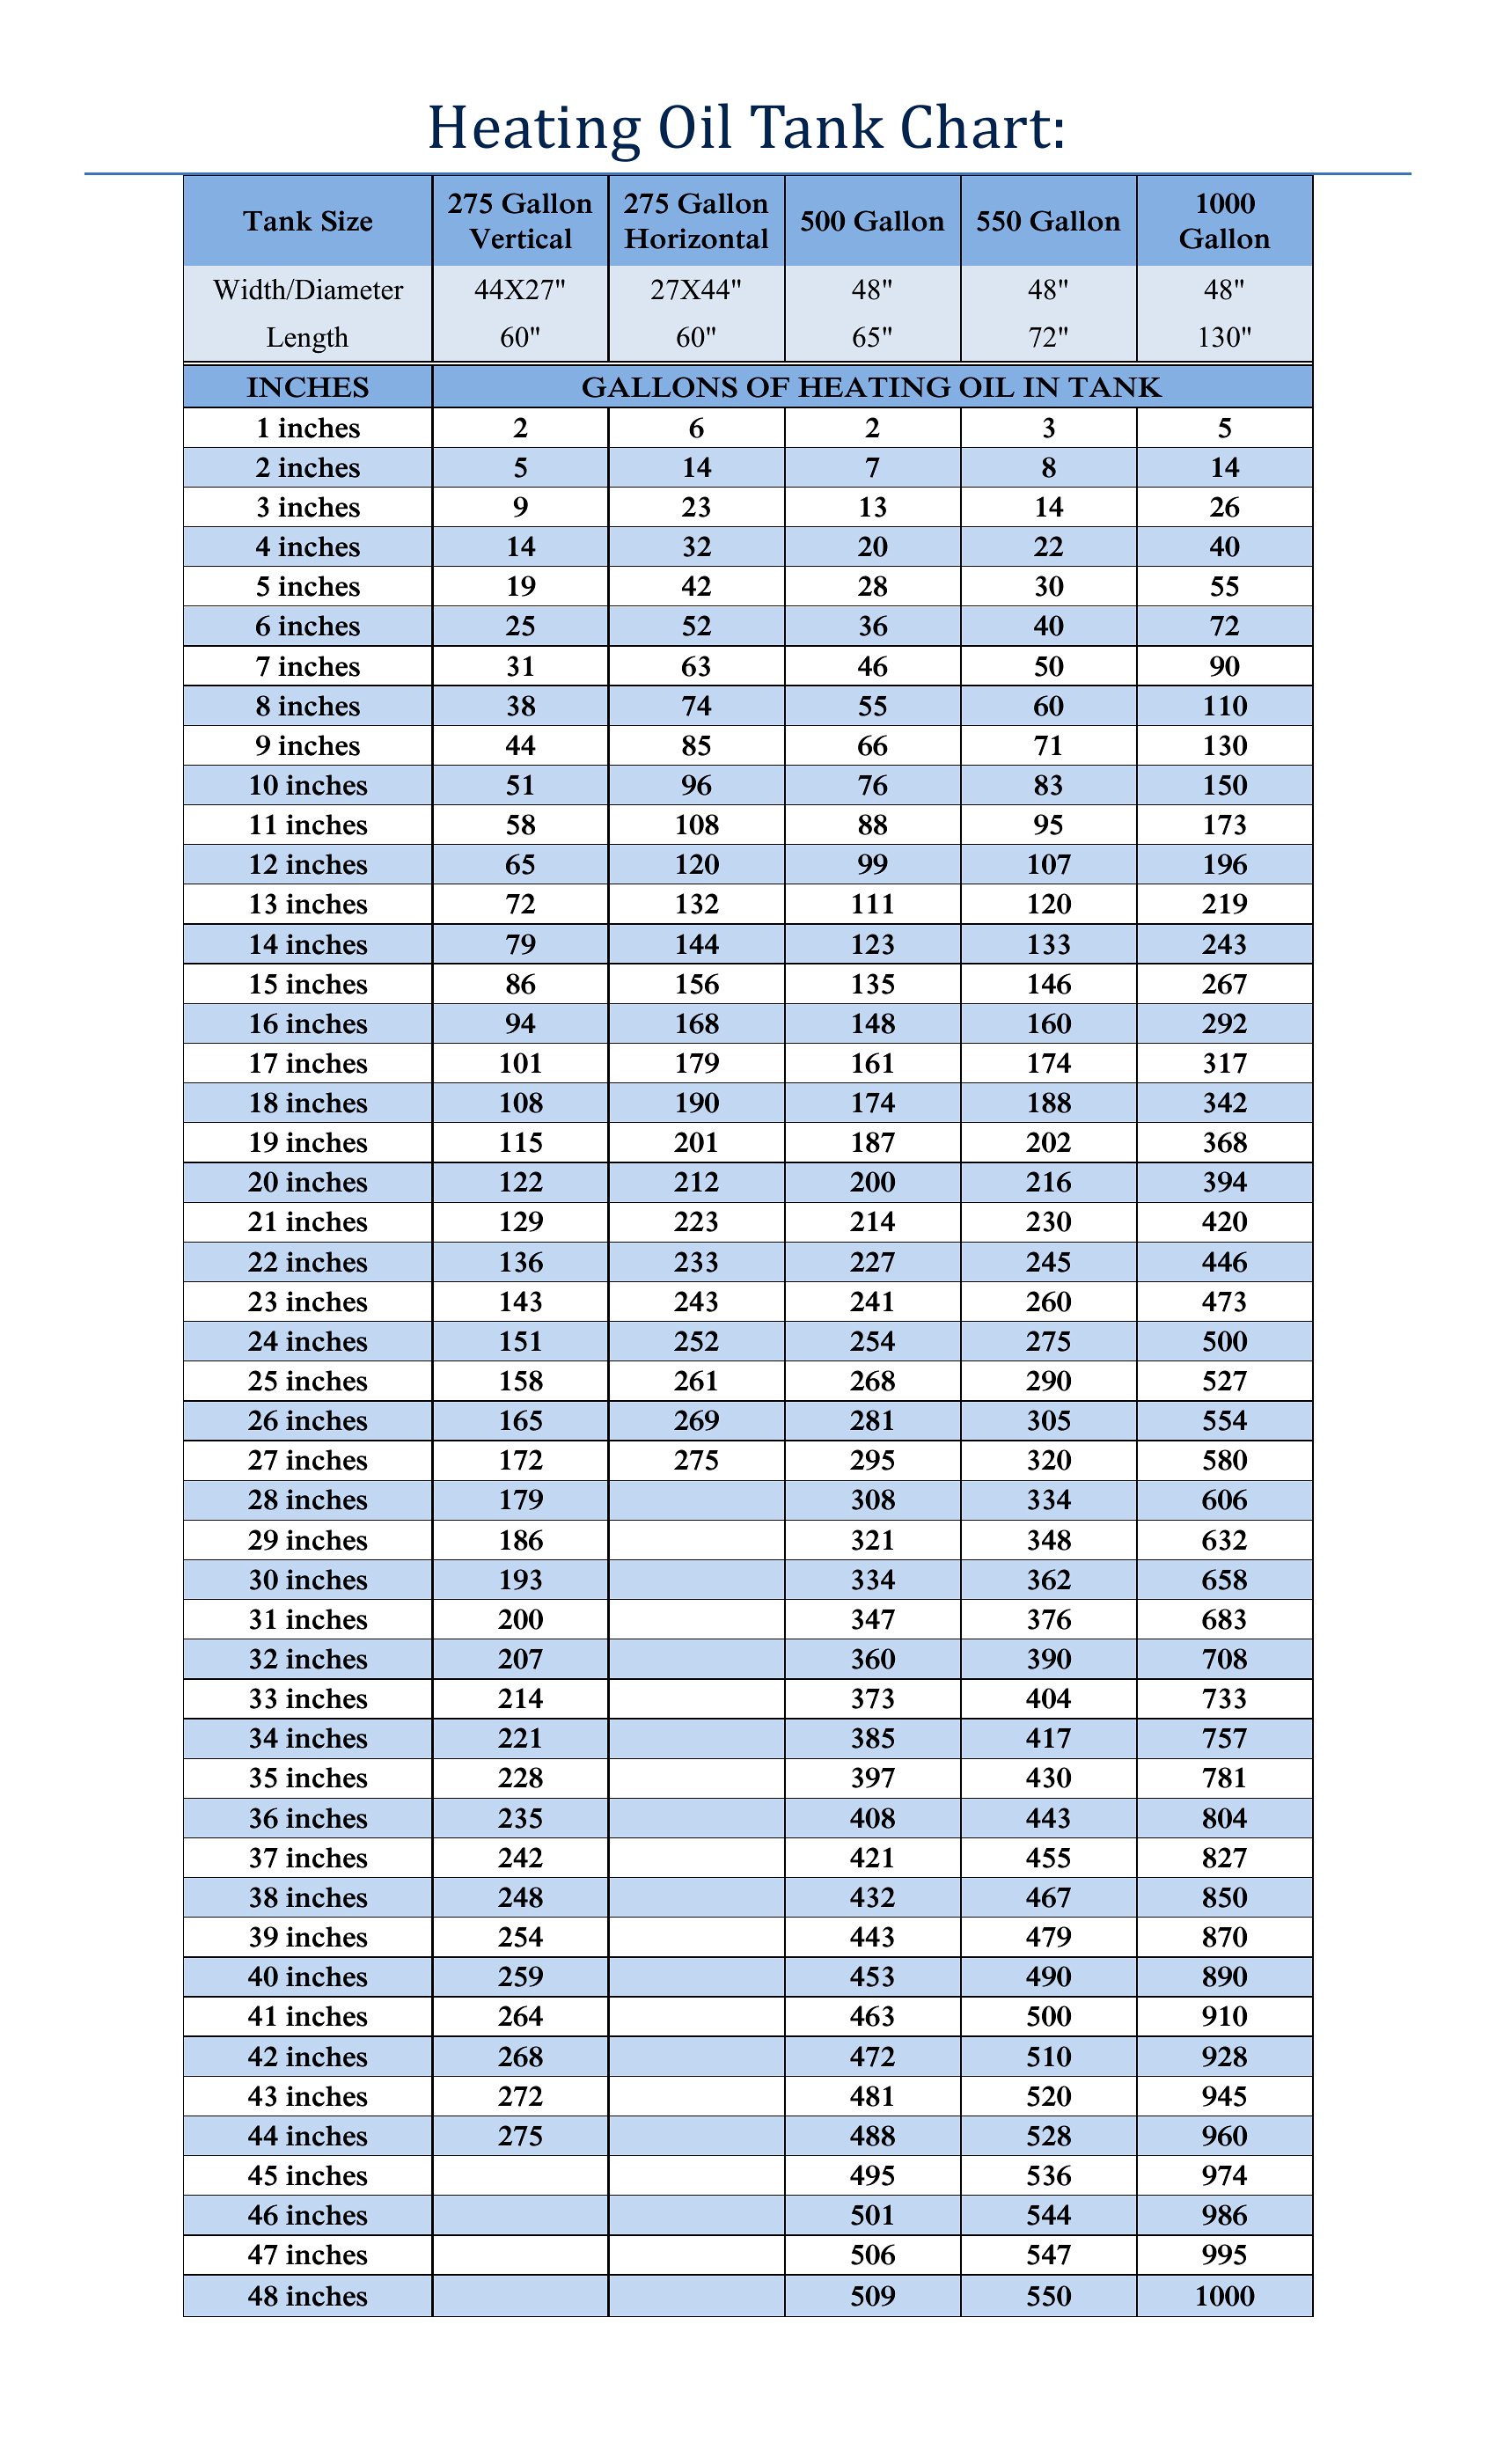
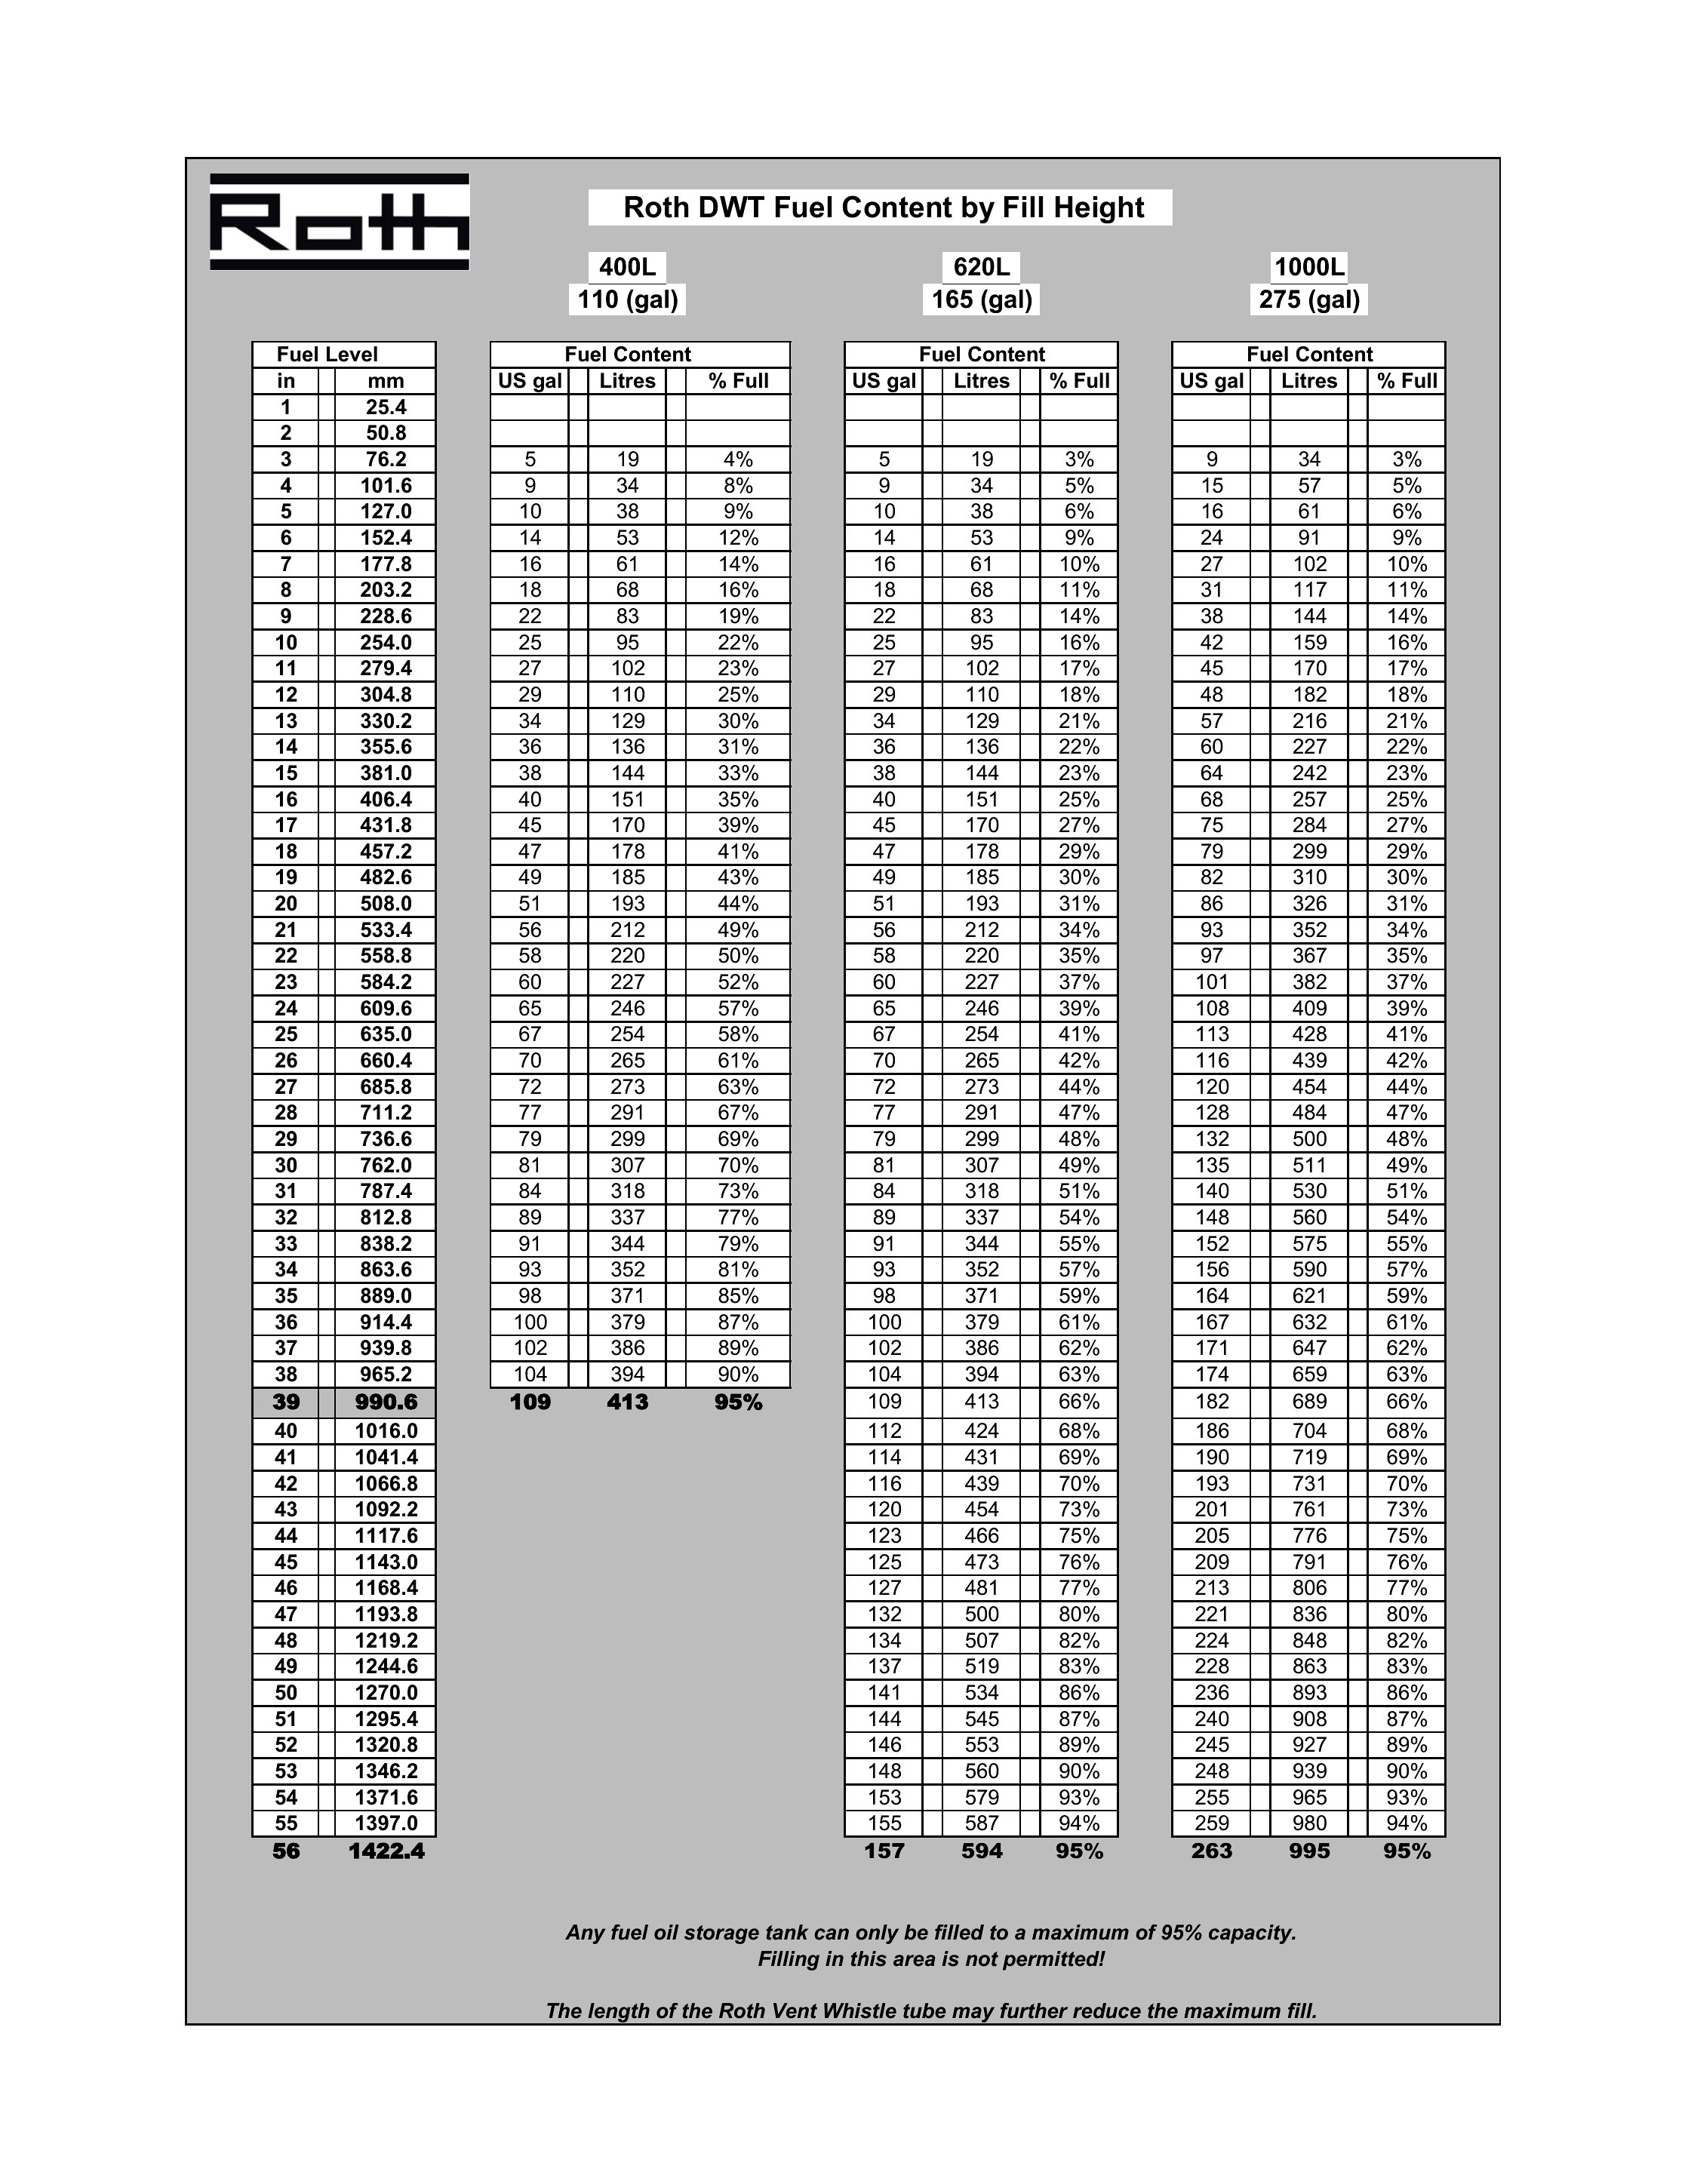
An oil tank chart is a conversion table that translates a measured stick or gauge reading, usually in inches of depth, into an approximate number of gallons remaining. Because tanks vary in size and shape, each chart matches a specific tank so the depth reading reflects the correct volume of fuel left.
How do you take a stick reading to use with an oil tank chart?
Remove the fill or gauge cap, lower a clean measuring stick straight down until it touches the tank bottom, then withdraw it and read the wet line in inches. Match that depth to your tank size and shape on the chart to find the approximate gallons, taking the reading on level ground.
Why do oil tank charts differ by tank size and shape?
Tank geometry determines how depth relates to volume. A 275 gallon vertical tank holds different gallons per inch than a horizontal or oval tank of the same capacity, and rounded ends curve the relationship. Separate charts for each size and shape keep gallon estimates accurate rather than using one generic table.
Comments
Join the conversation
Sign in to share your thoughts and leave a comment on this resource.