Free Risk Matrix Templates (Excel)
DiagramsTemplates
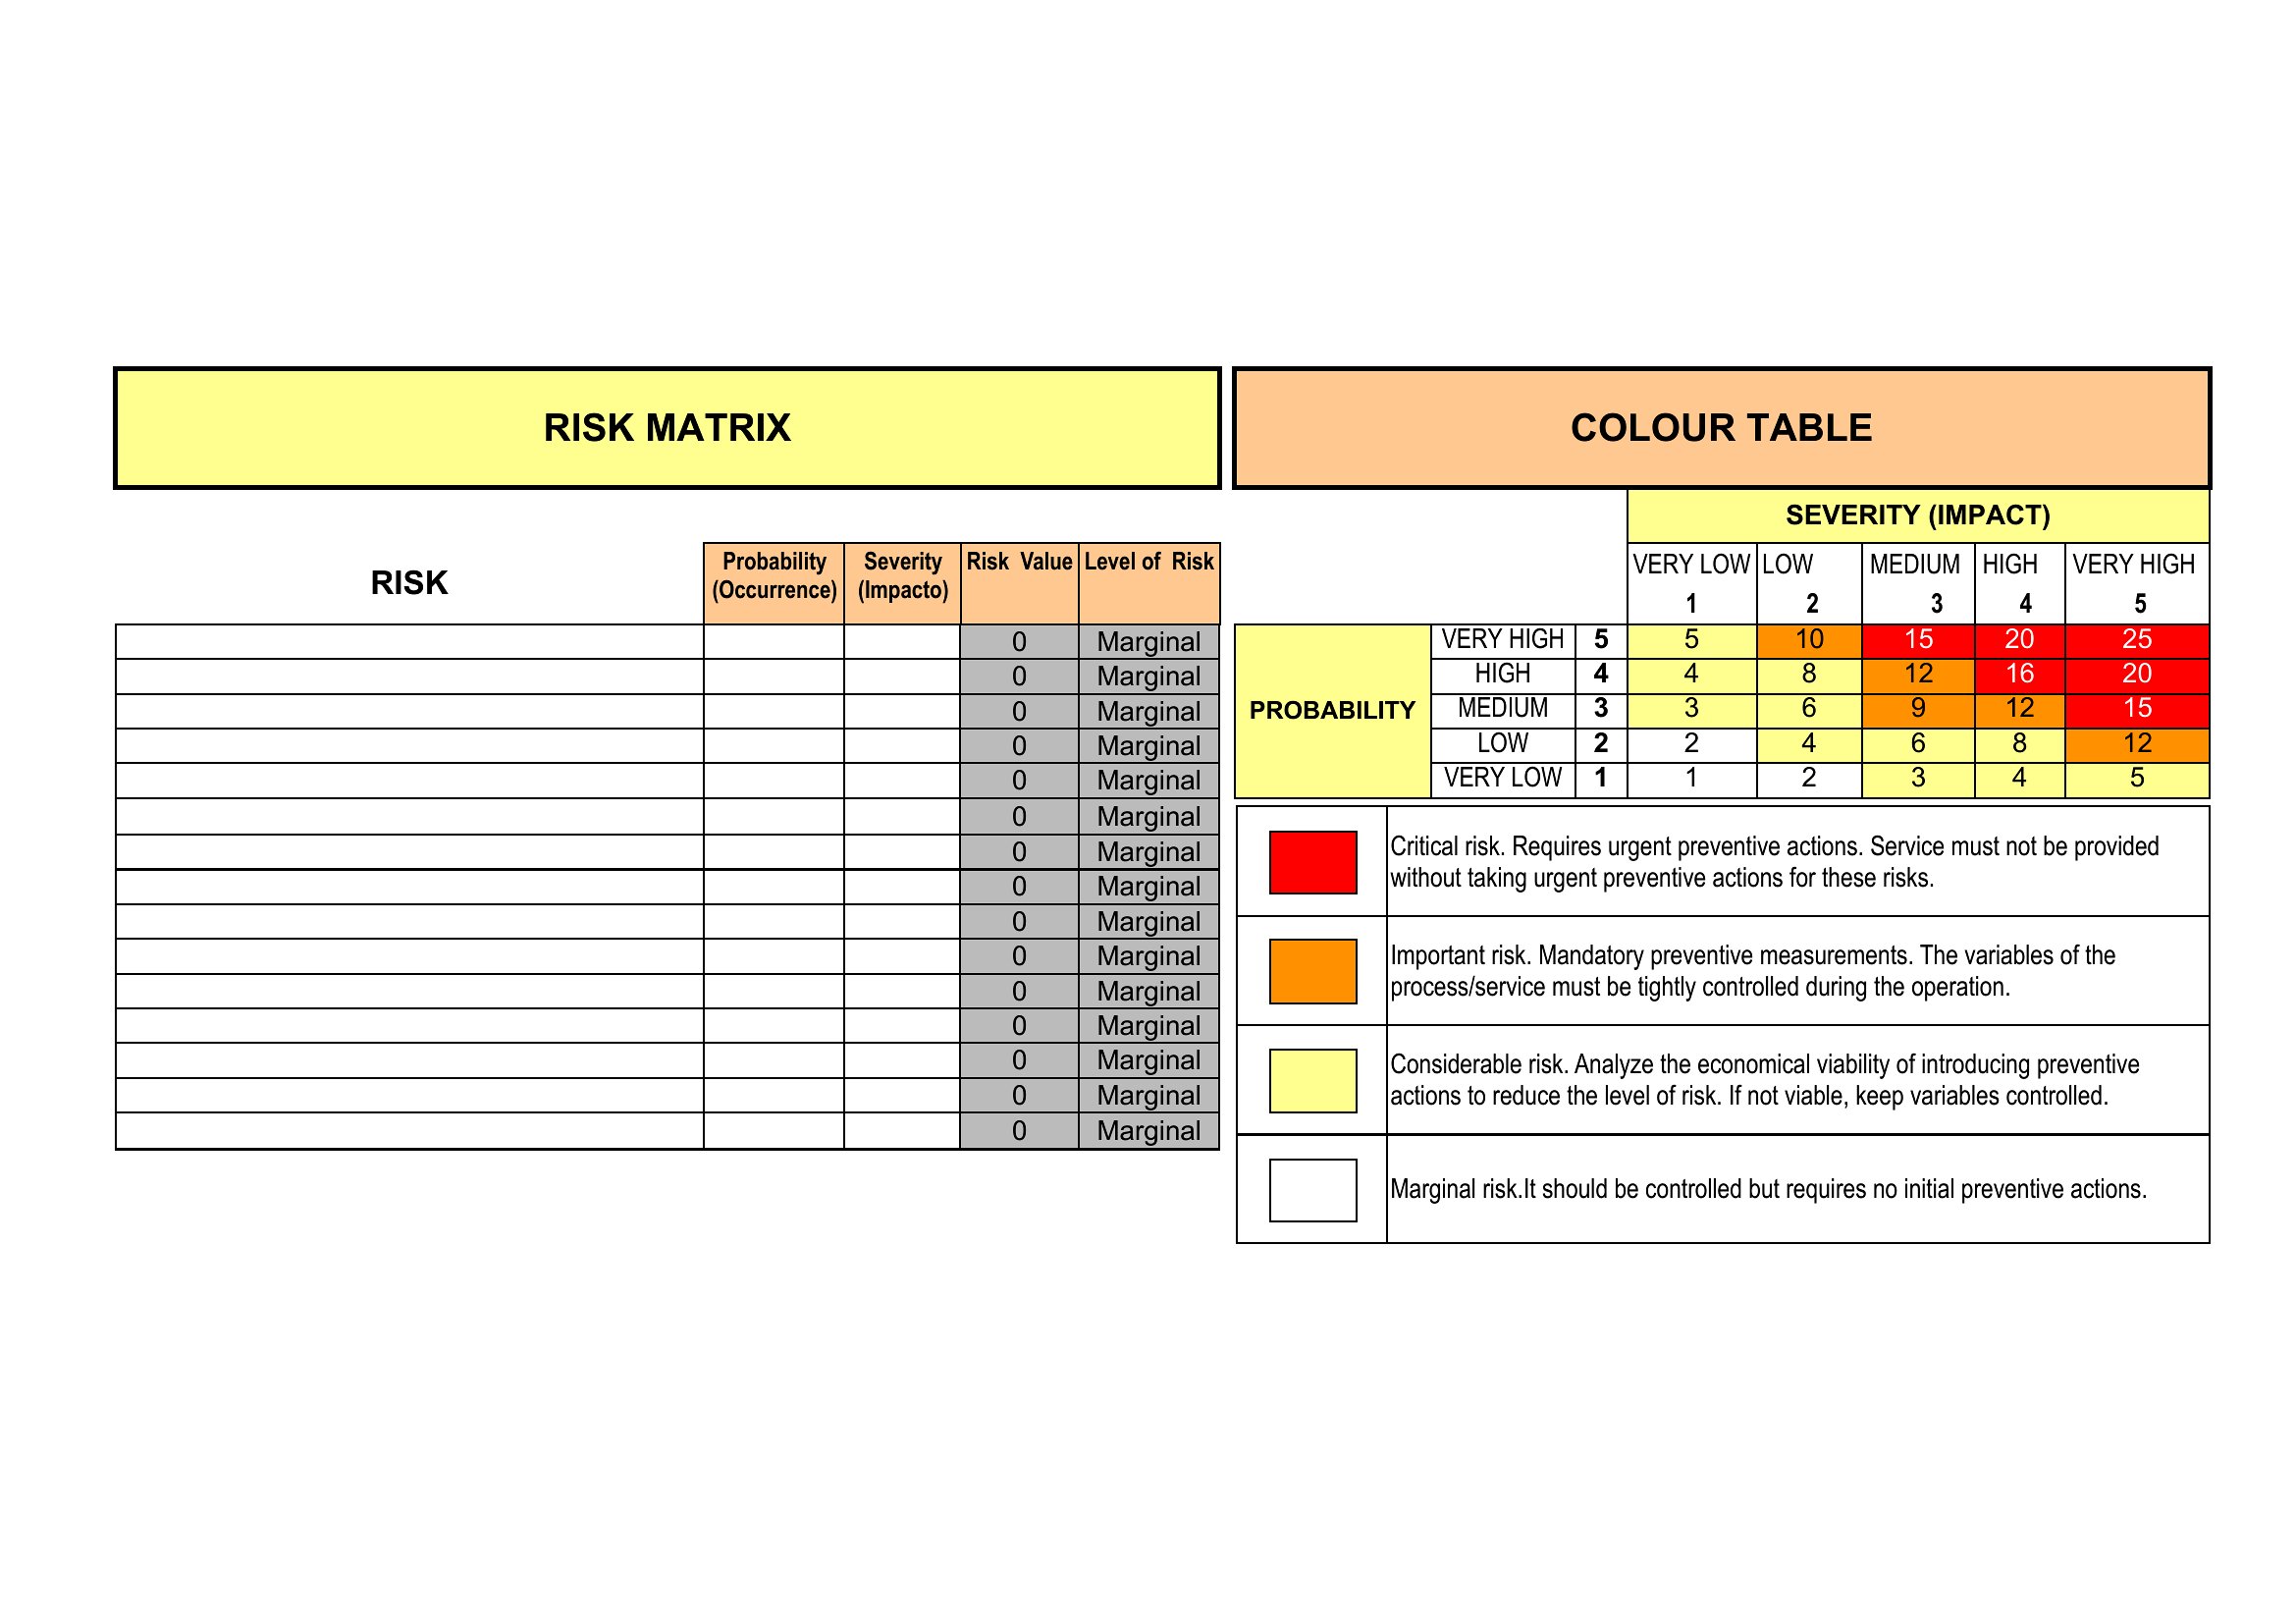
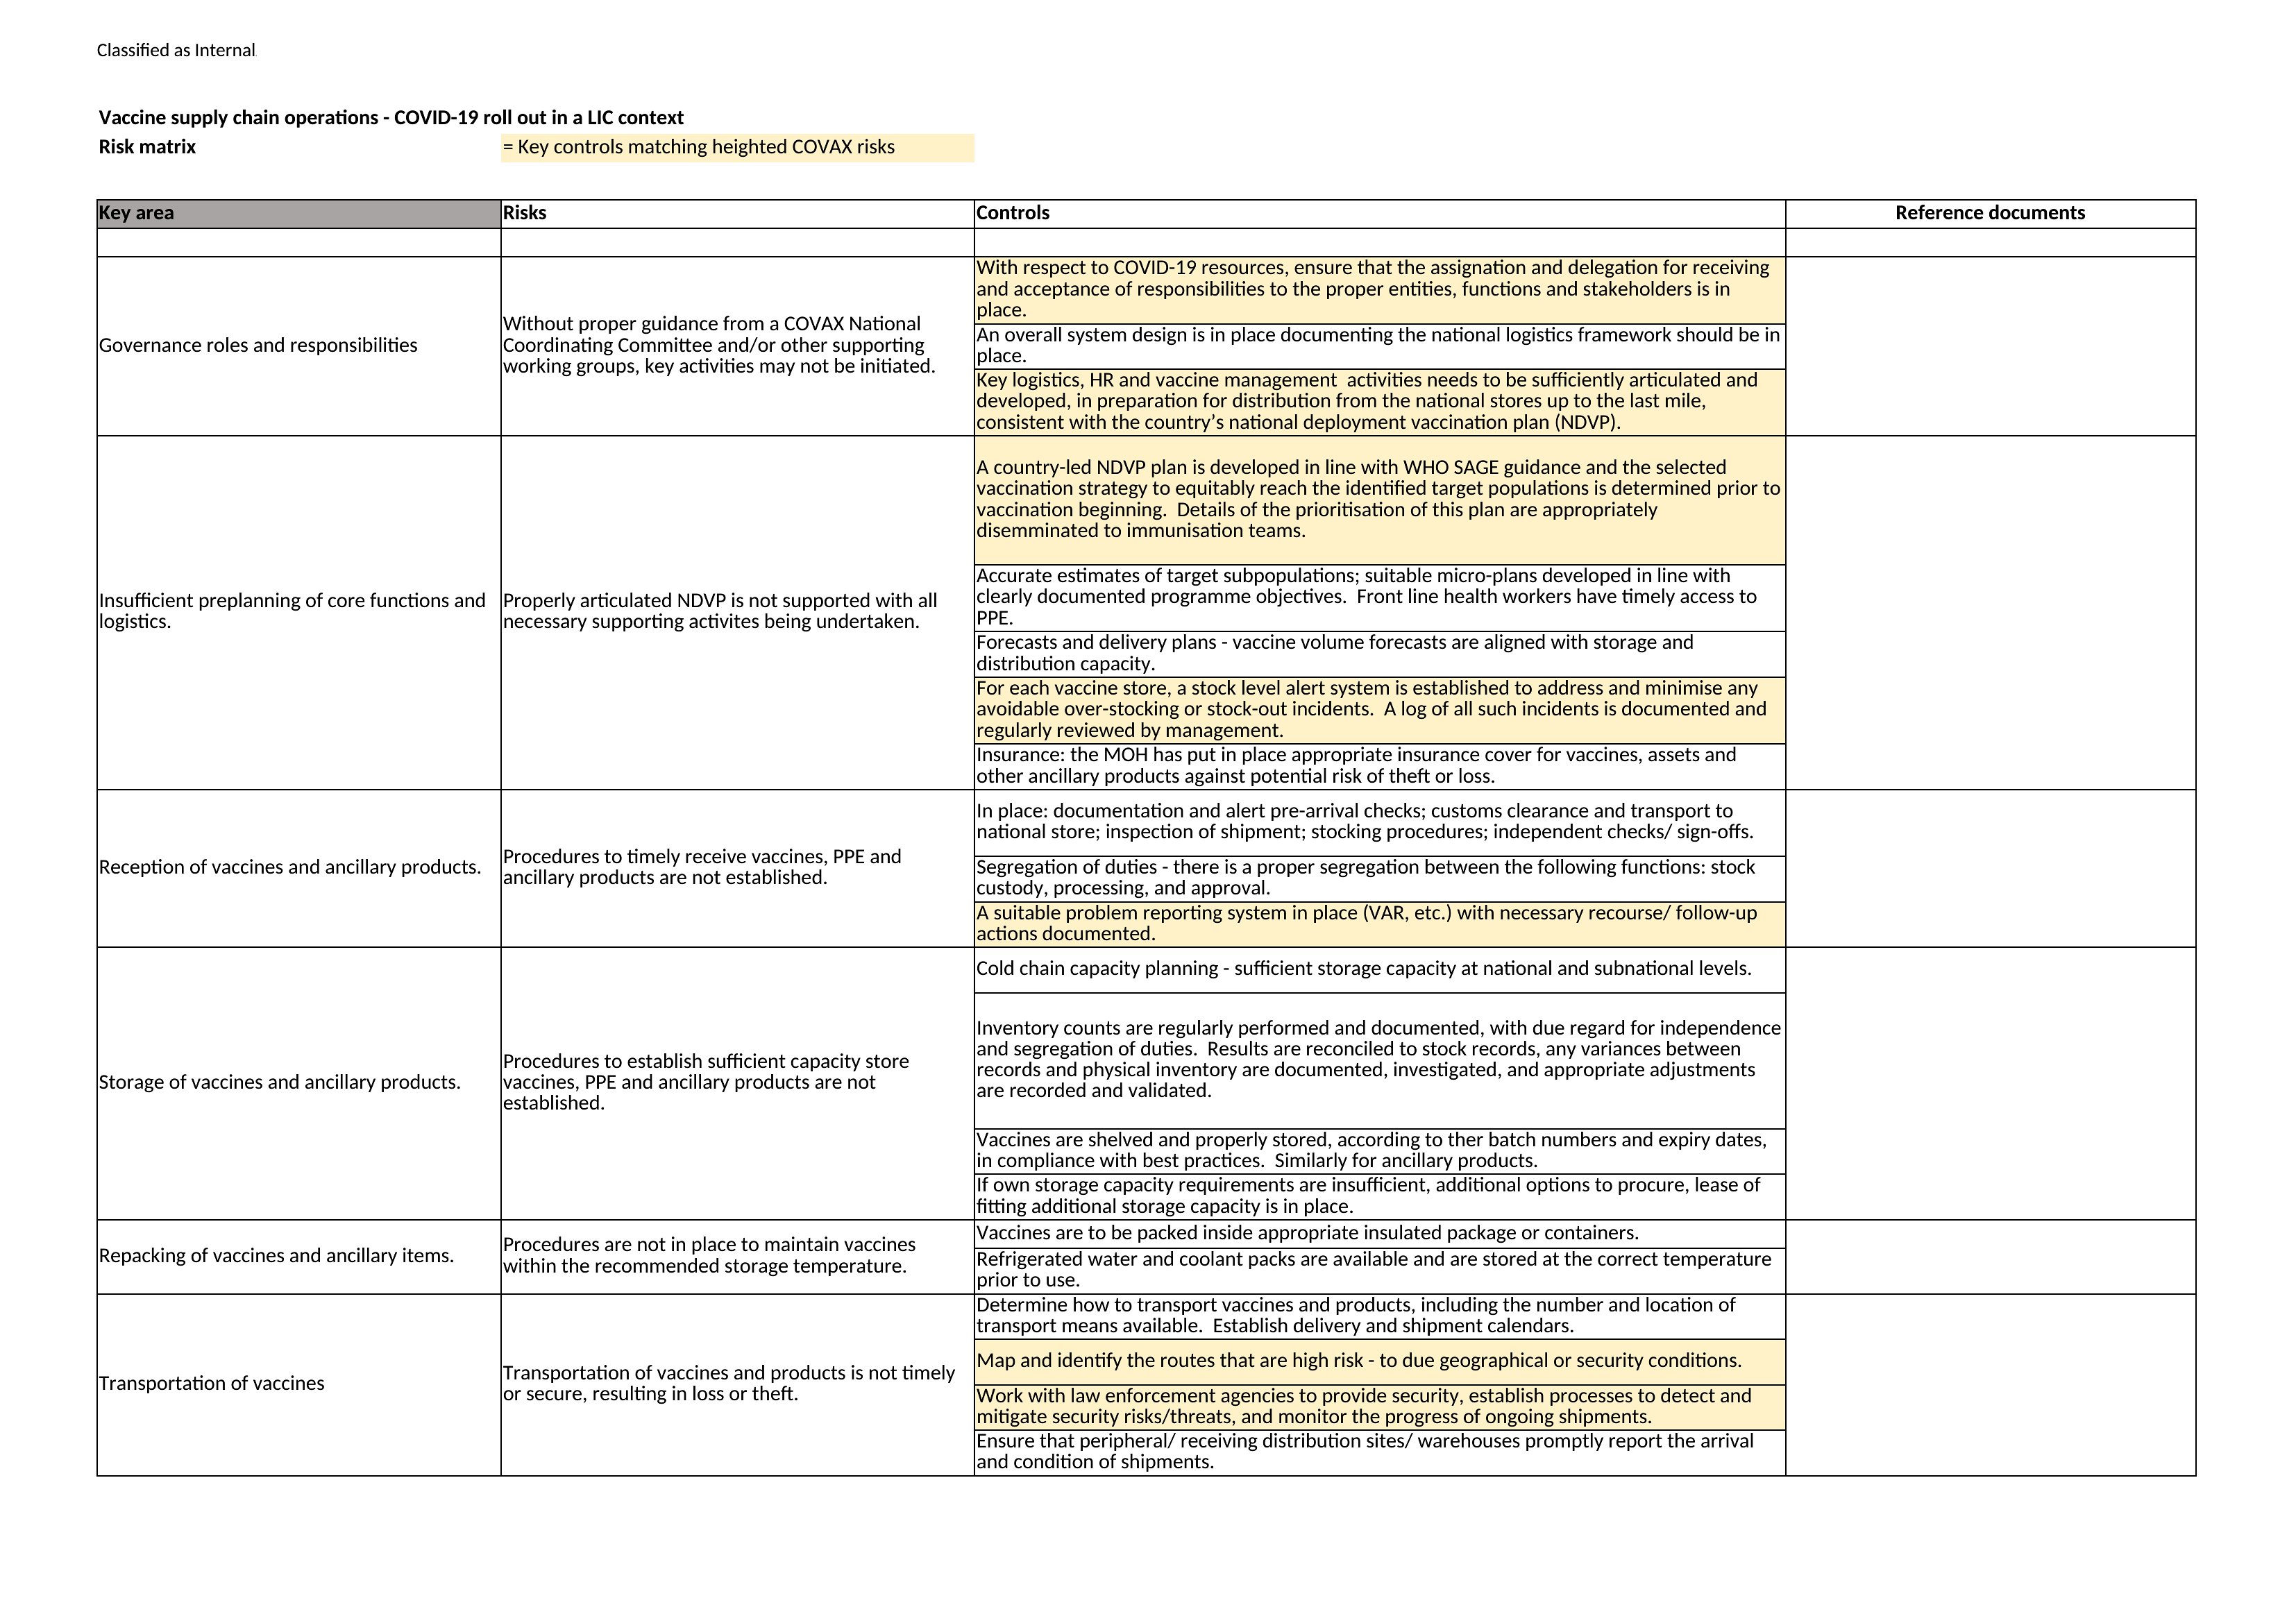
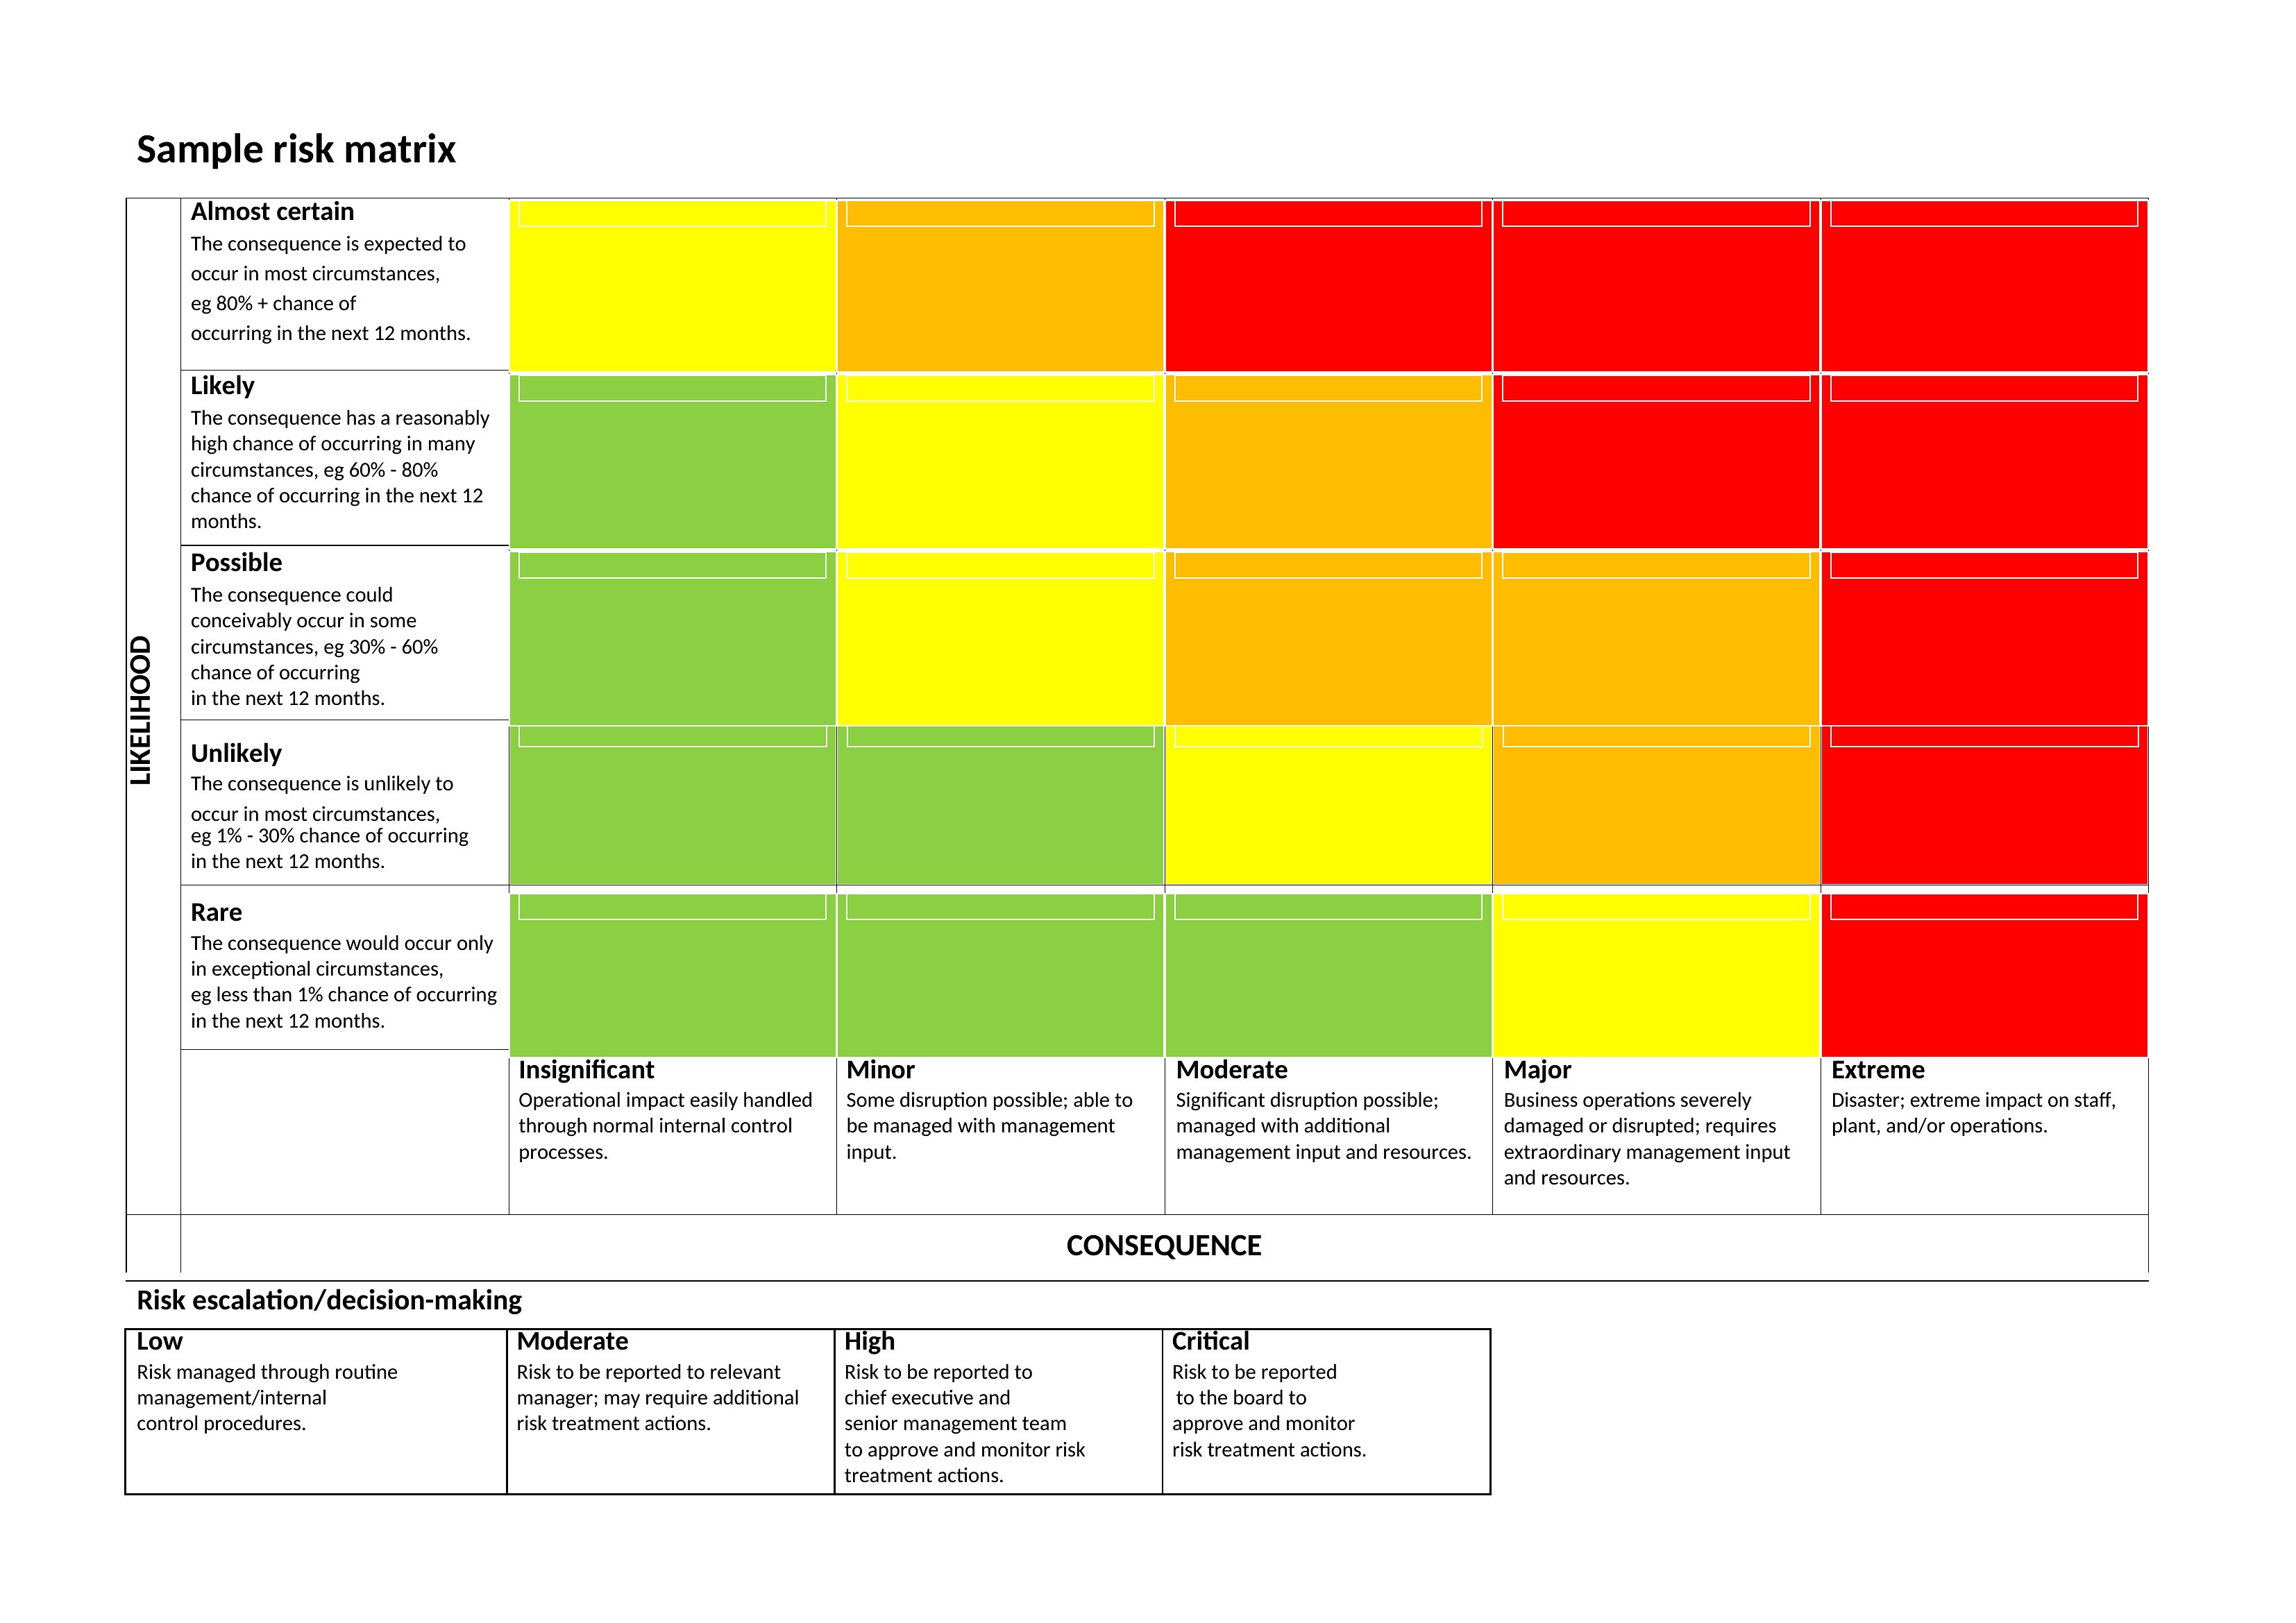
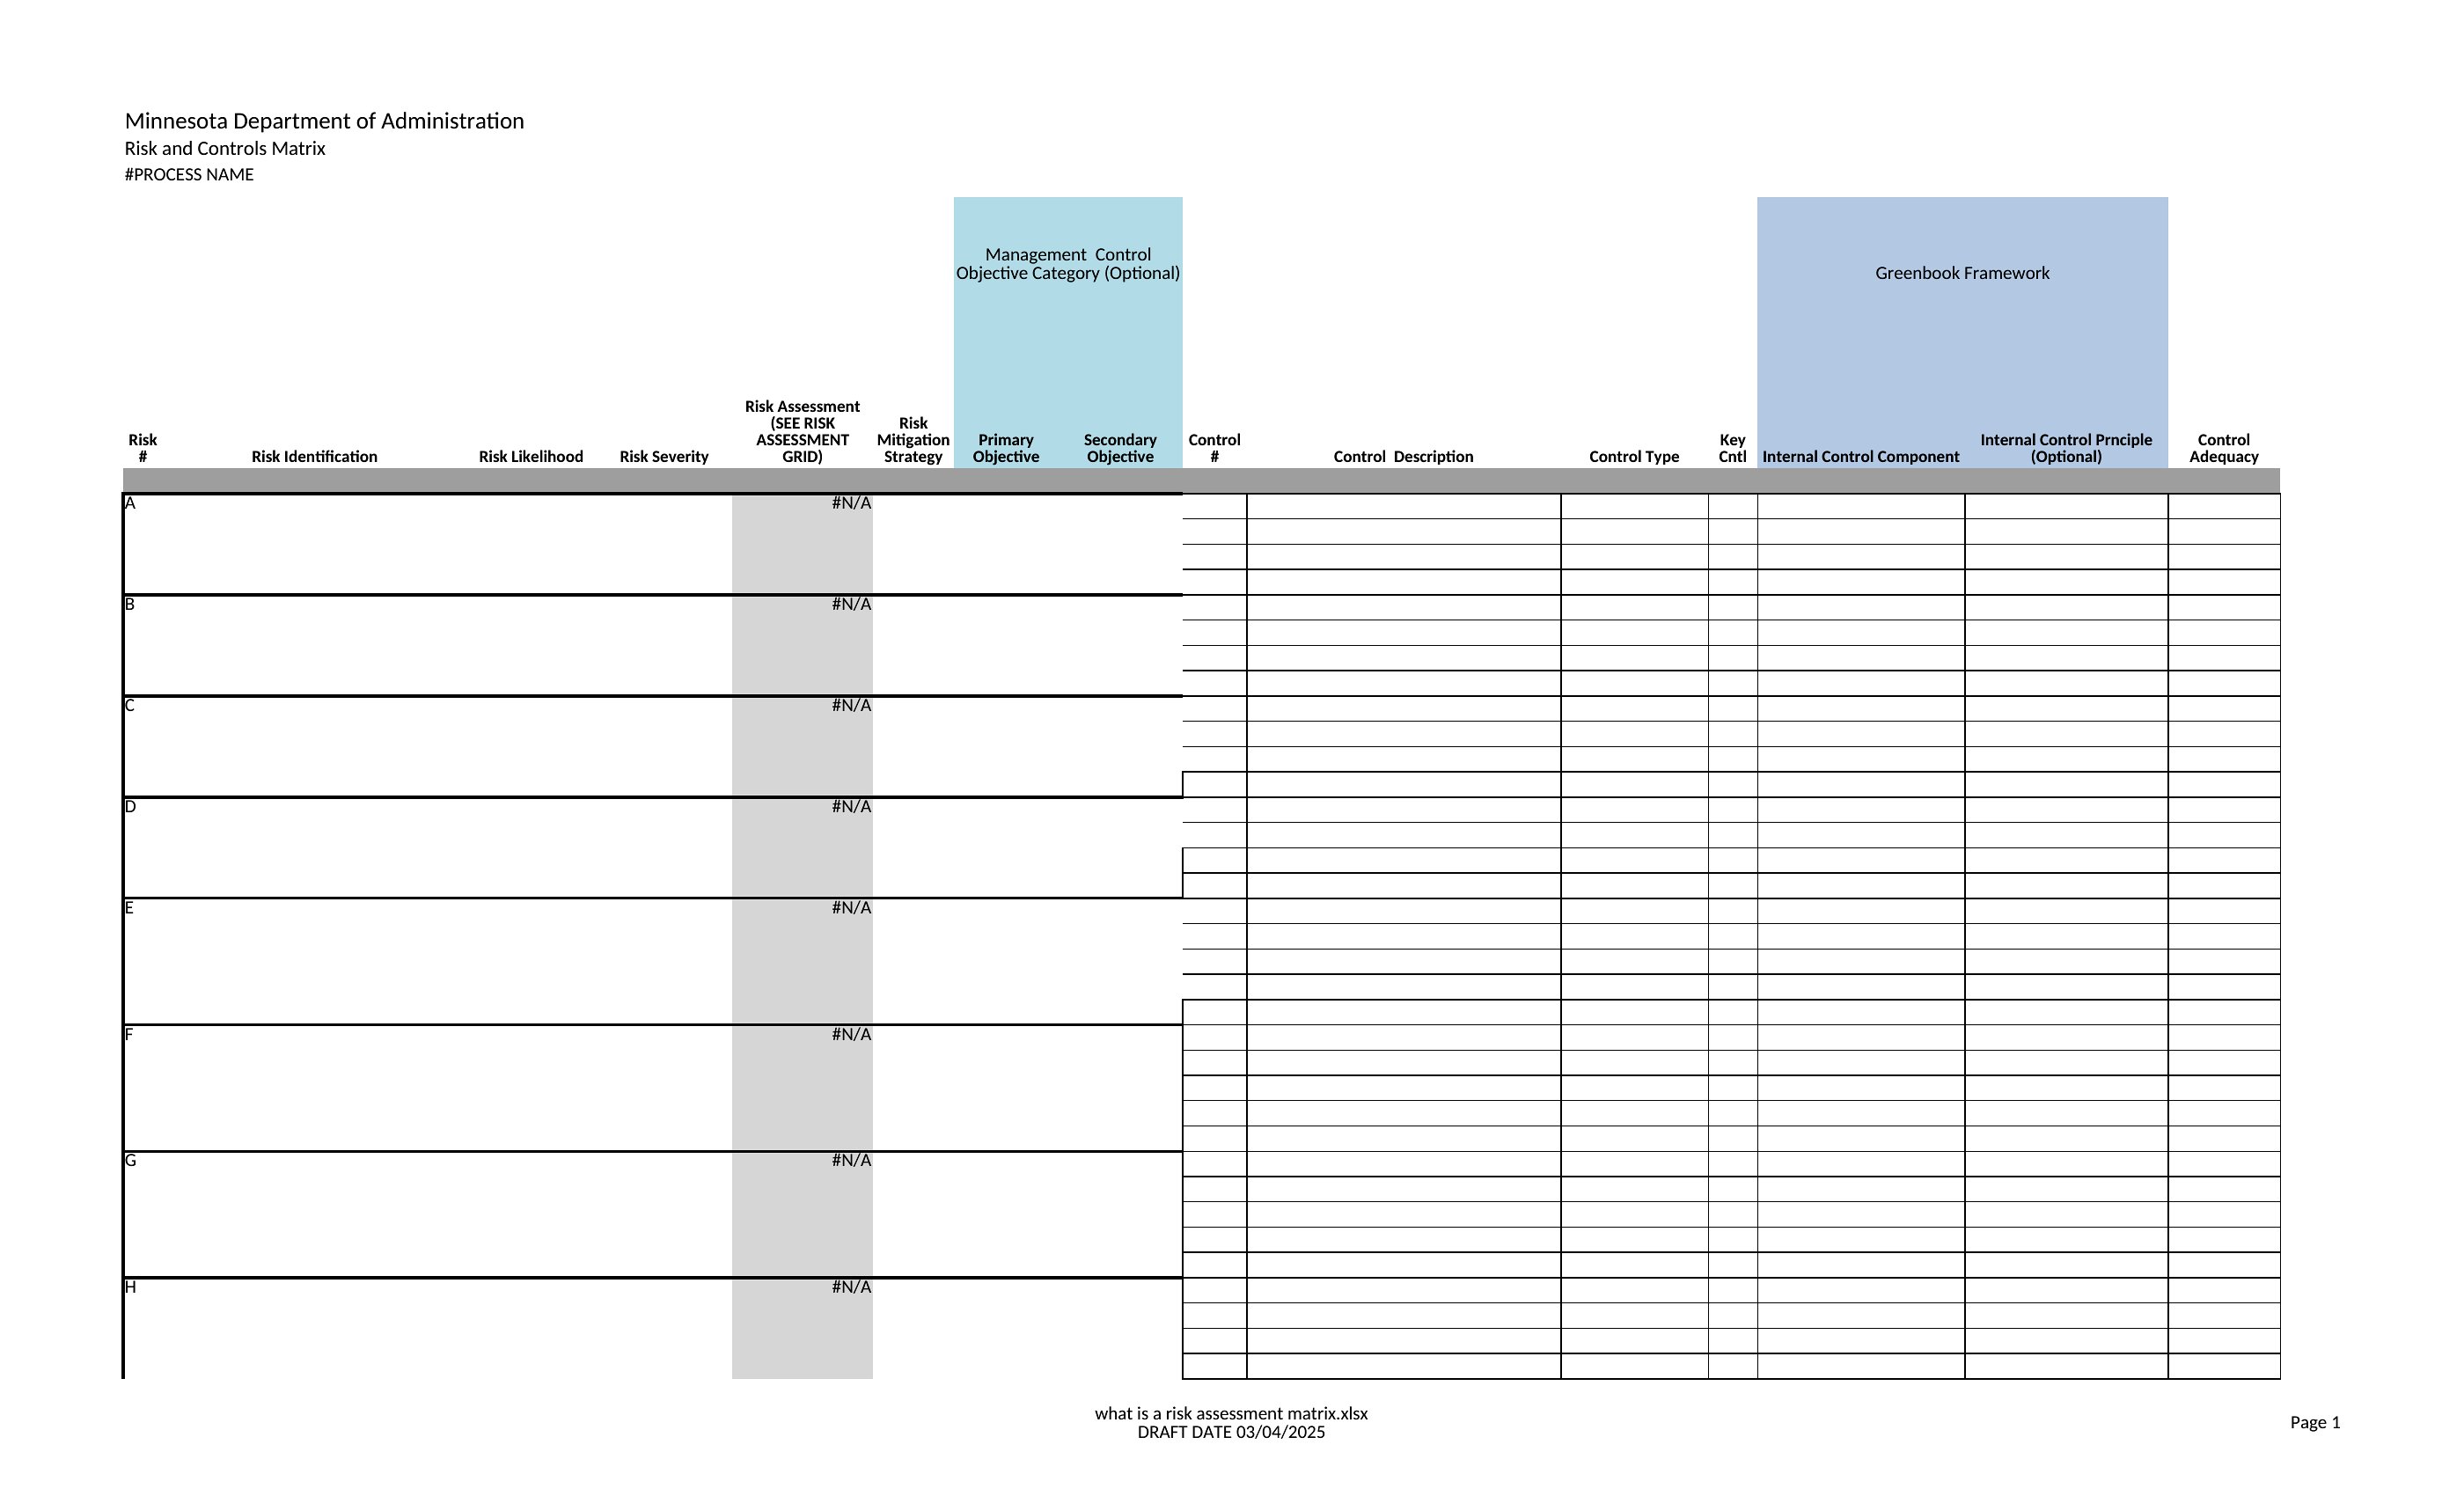
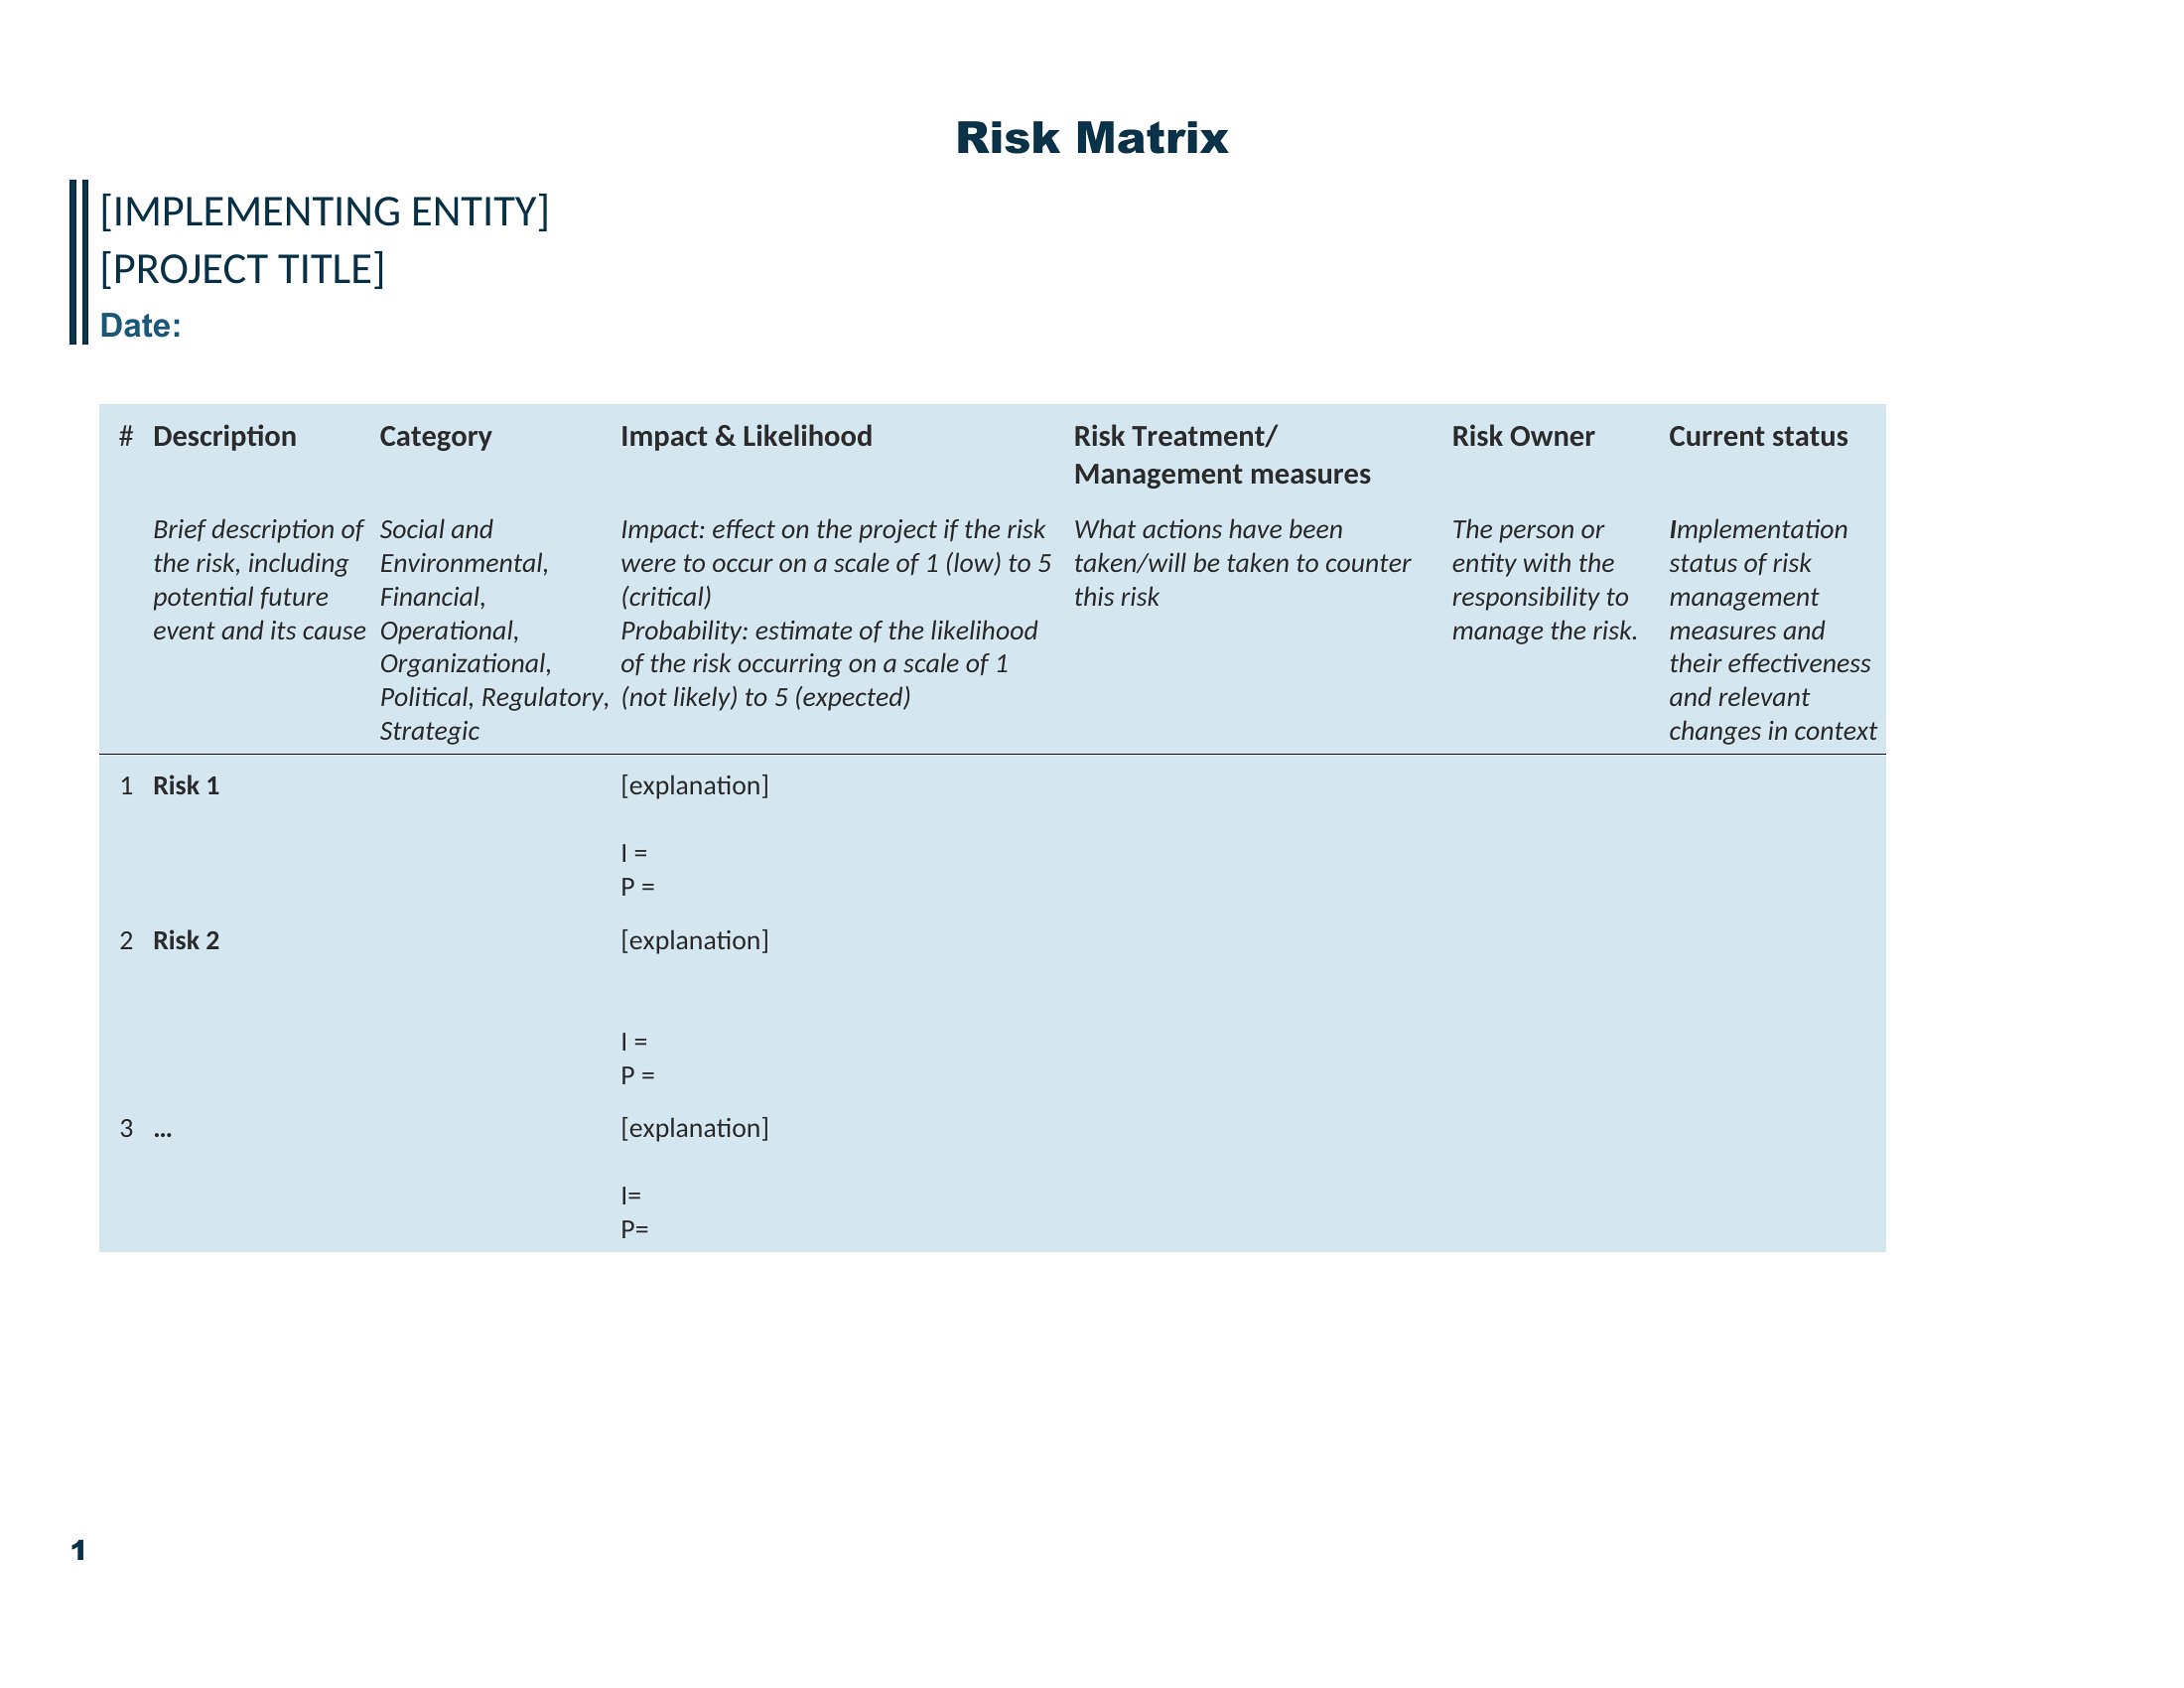
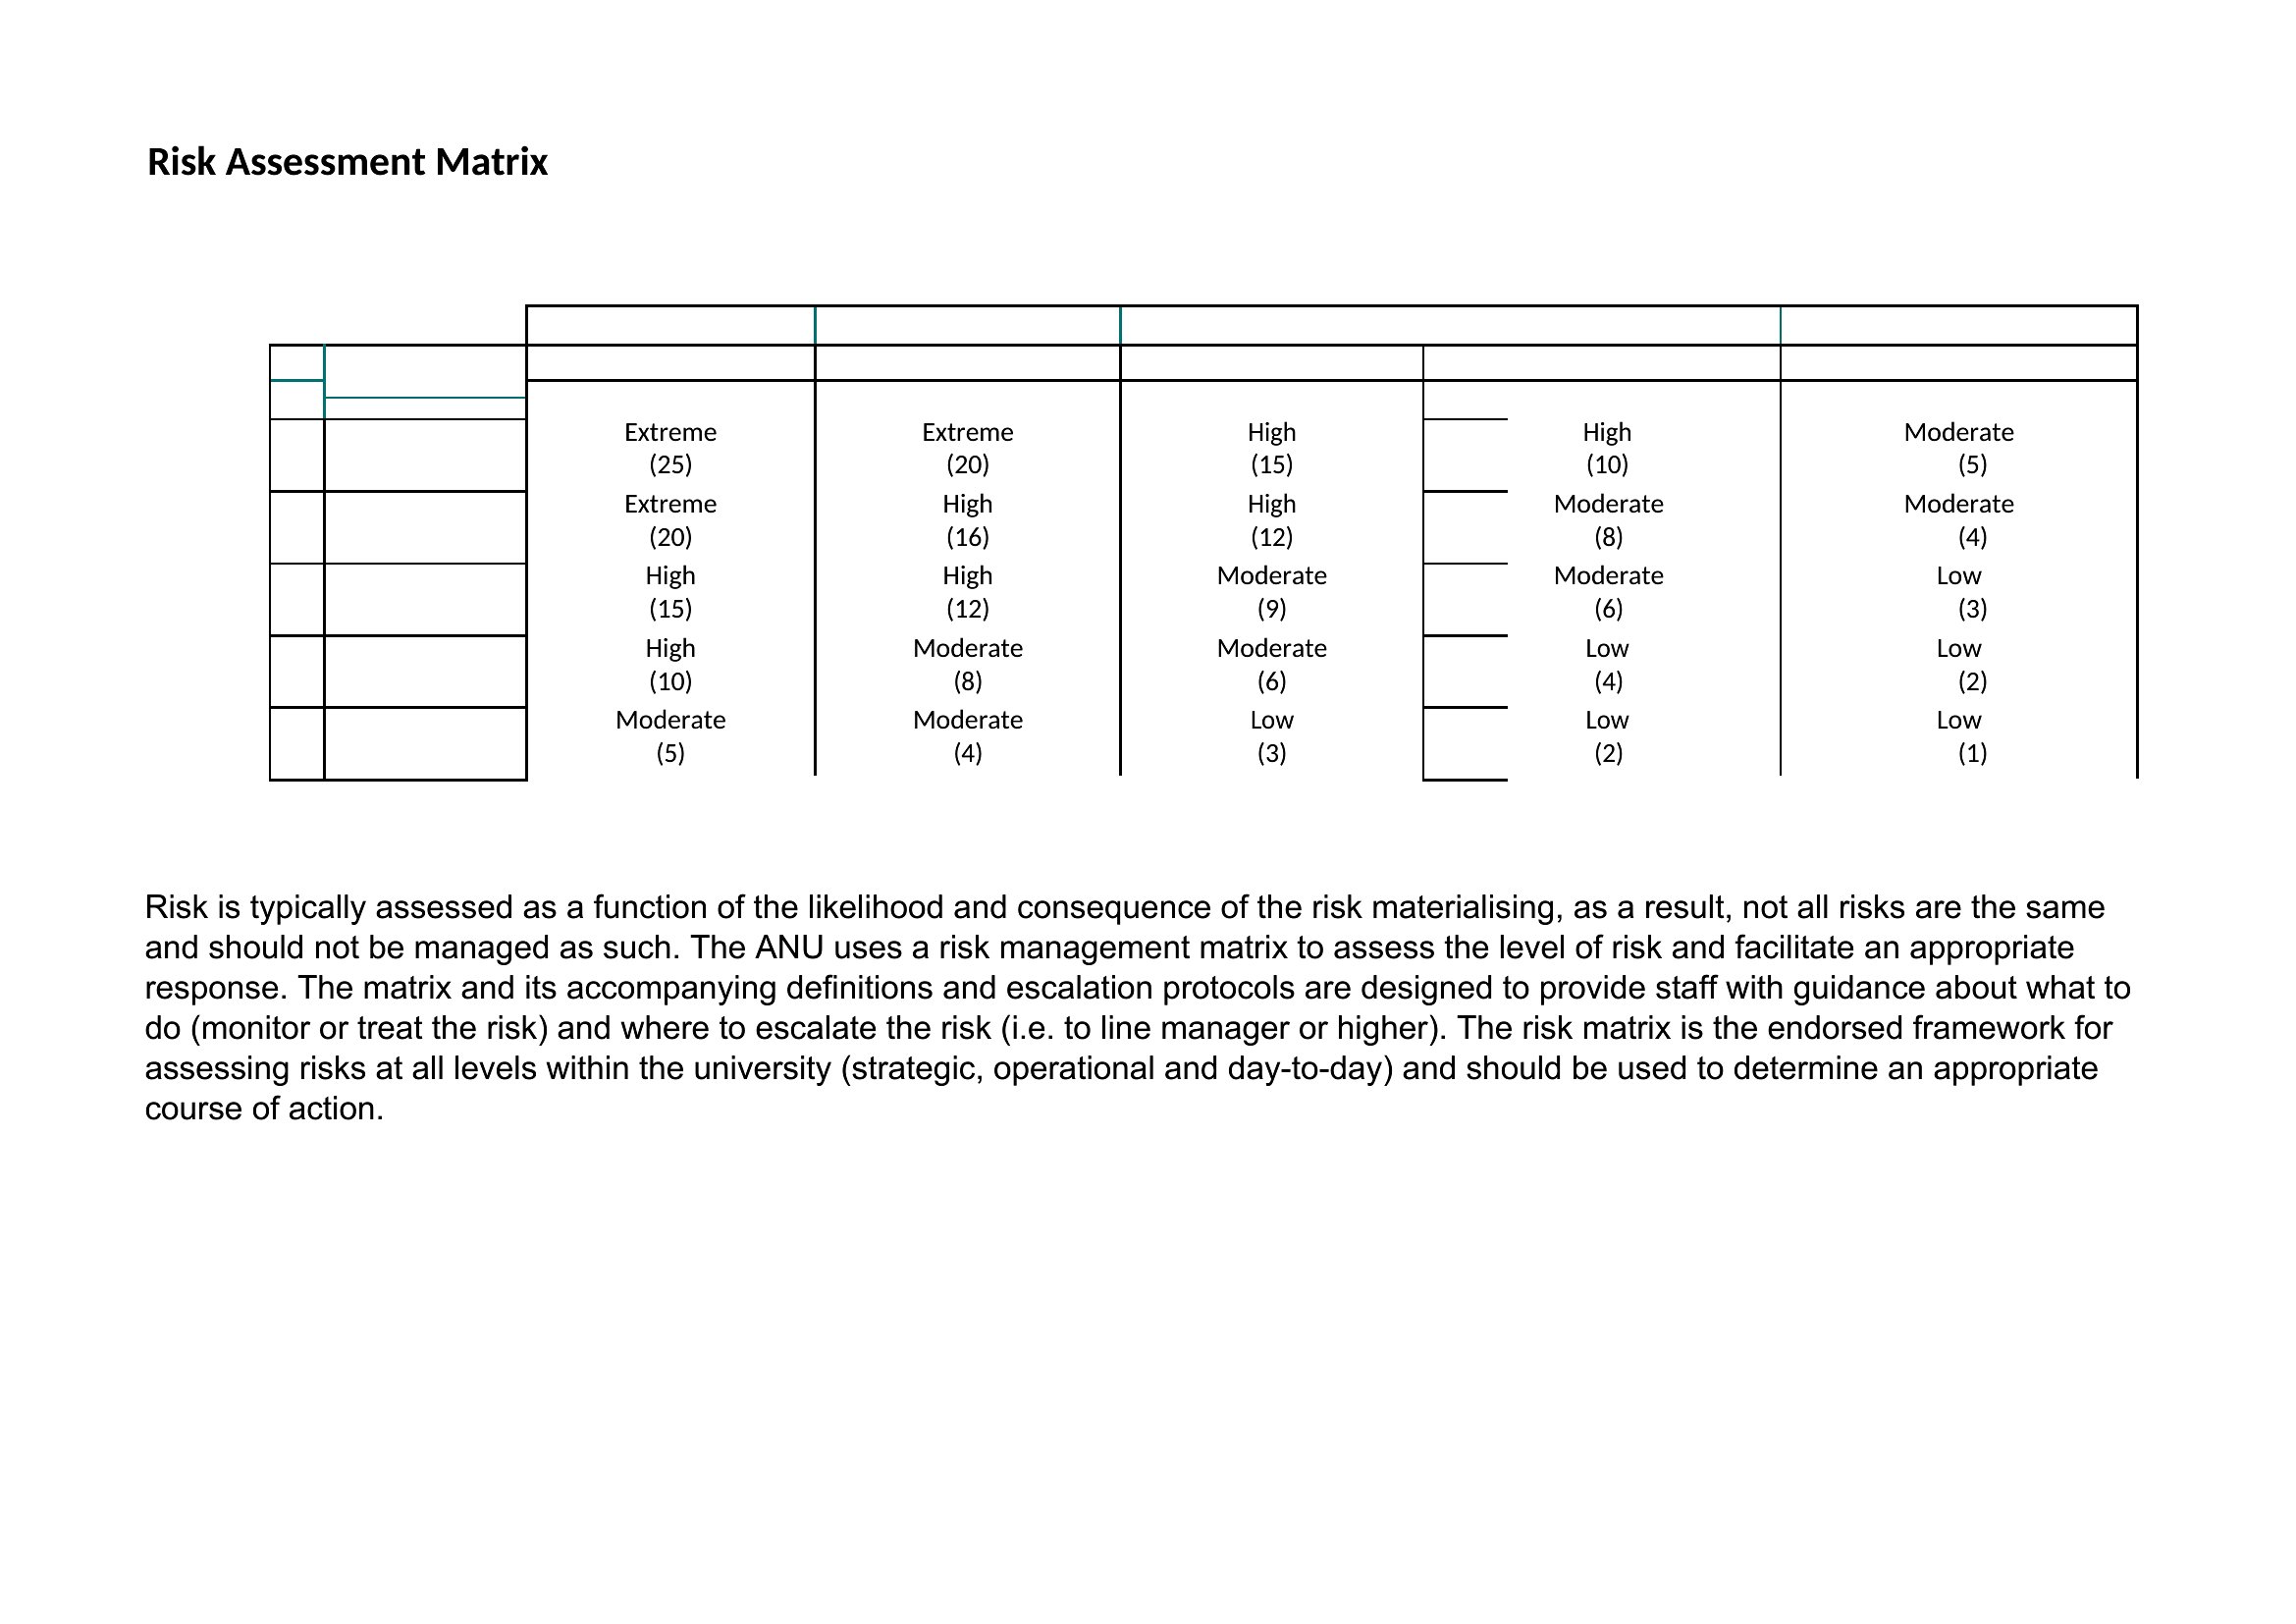
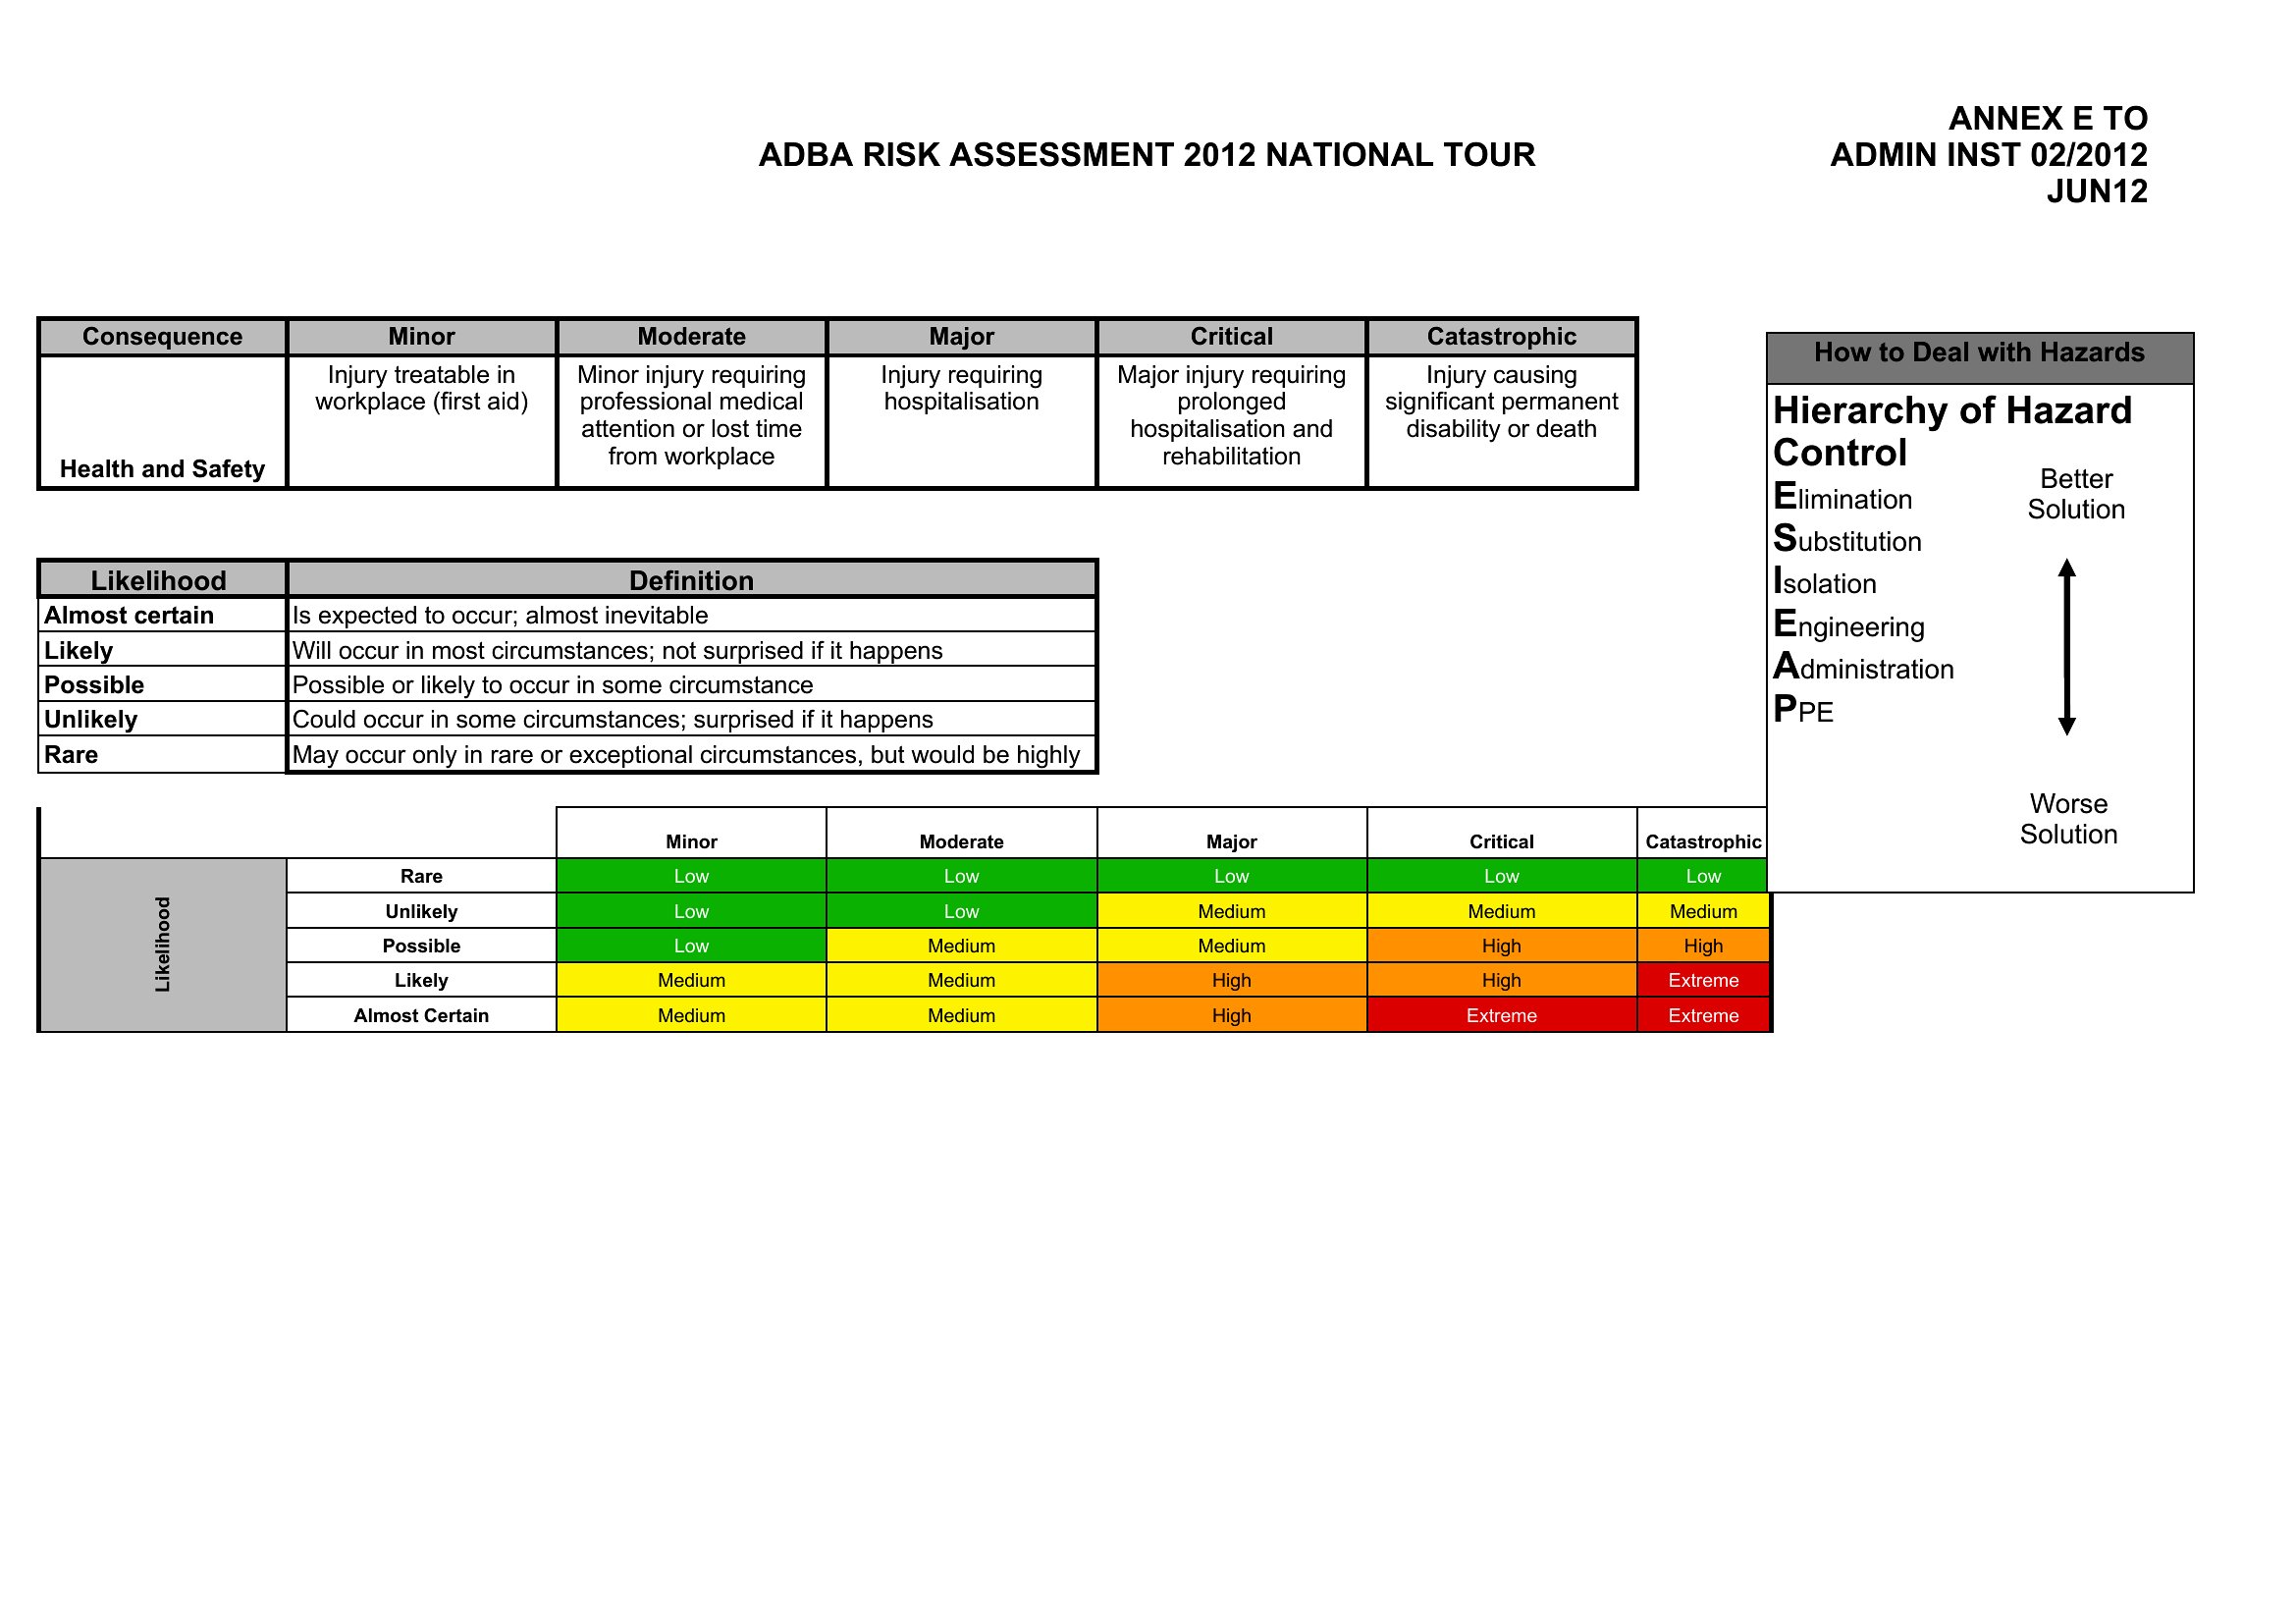
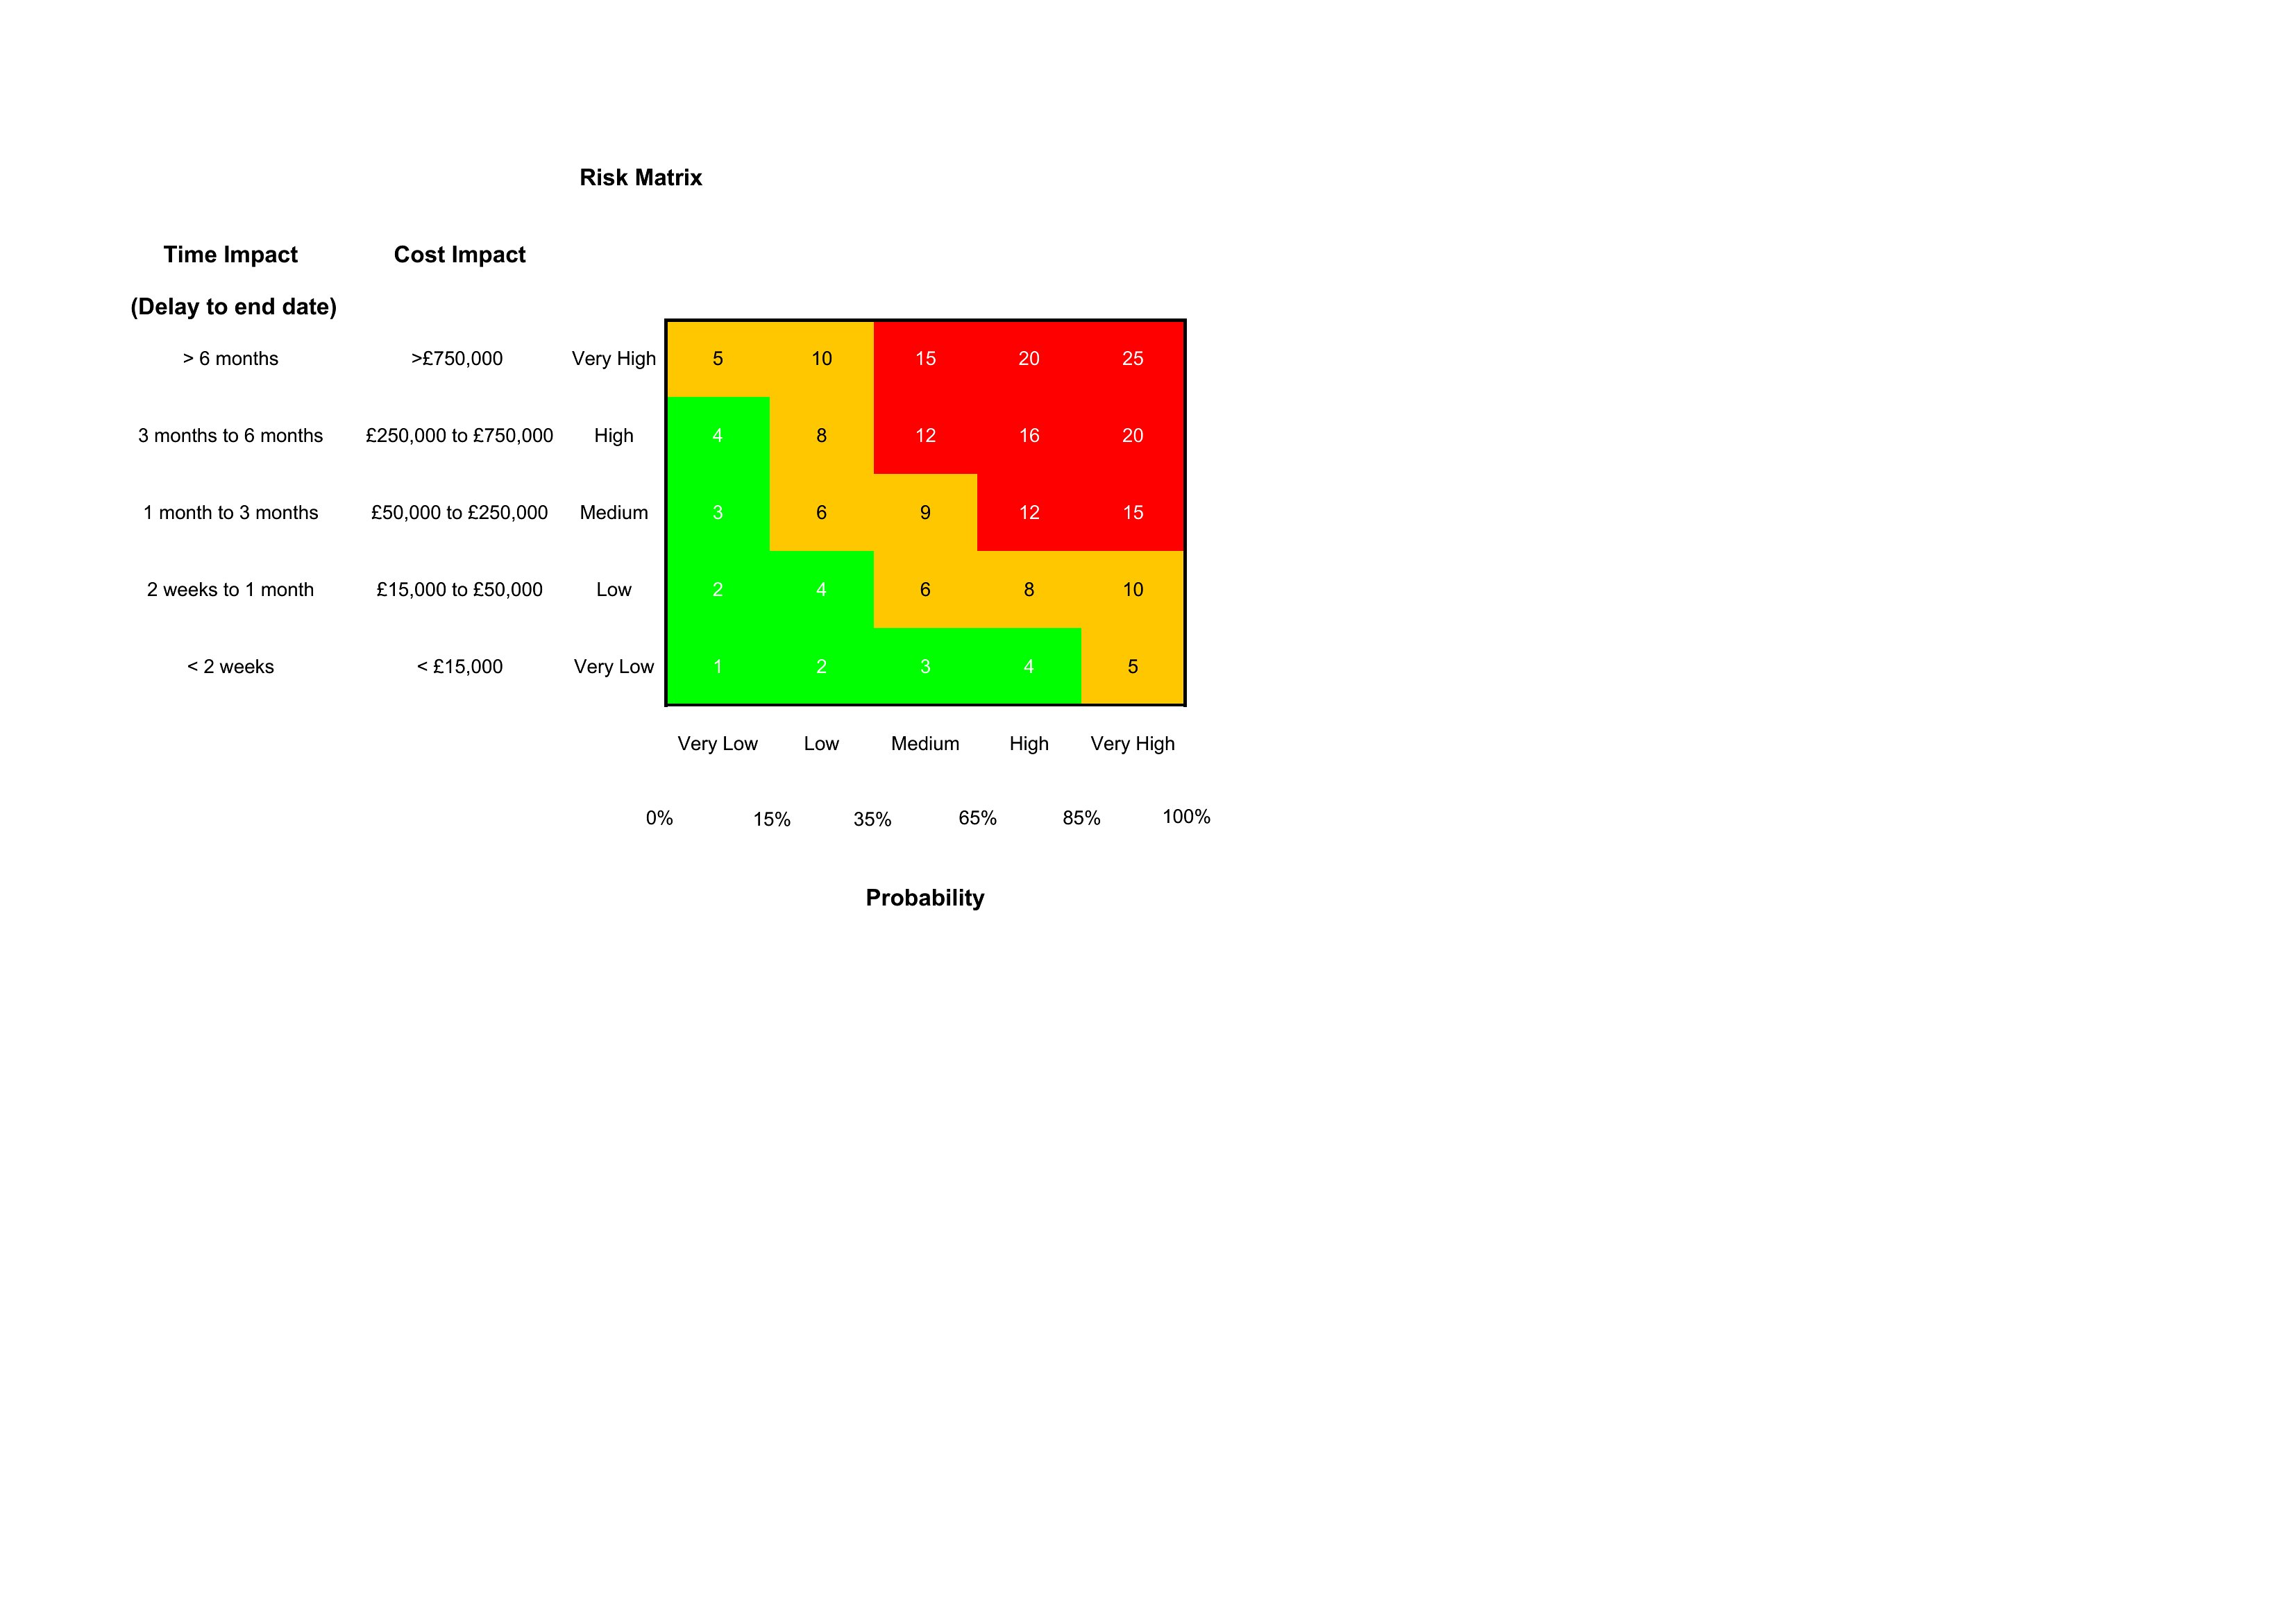
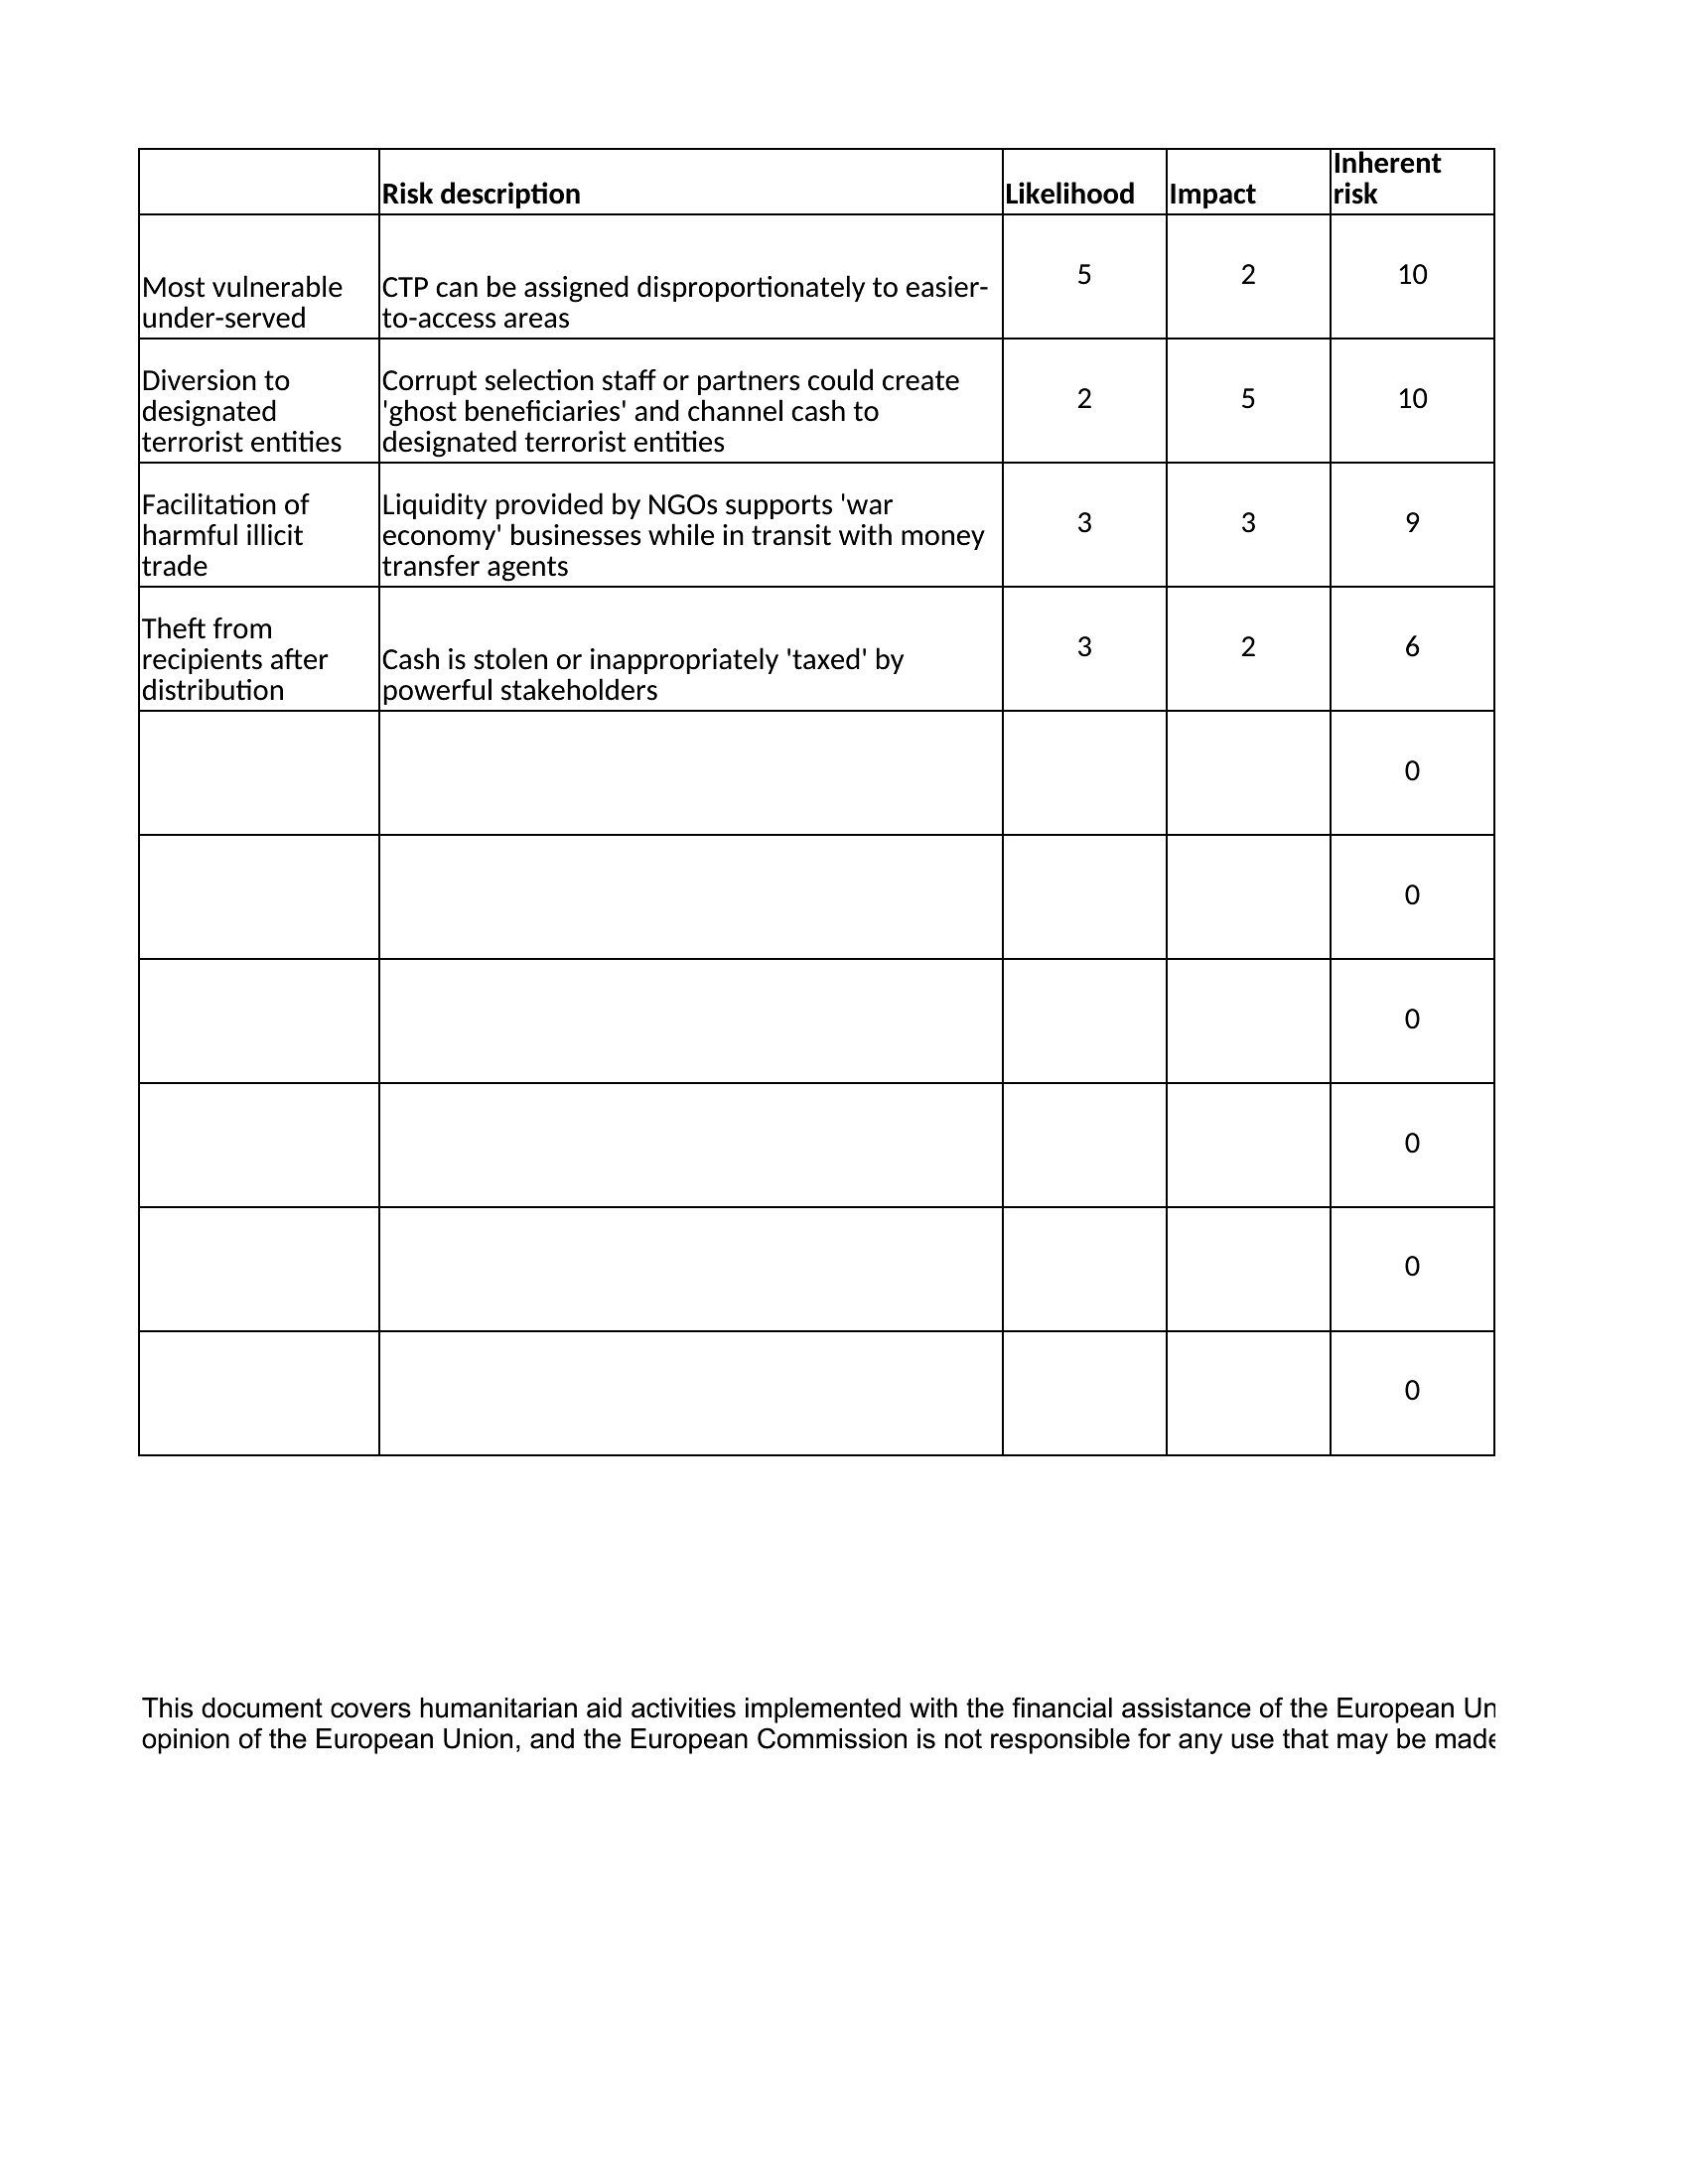
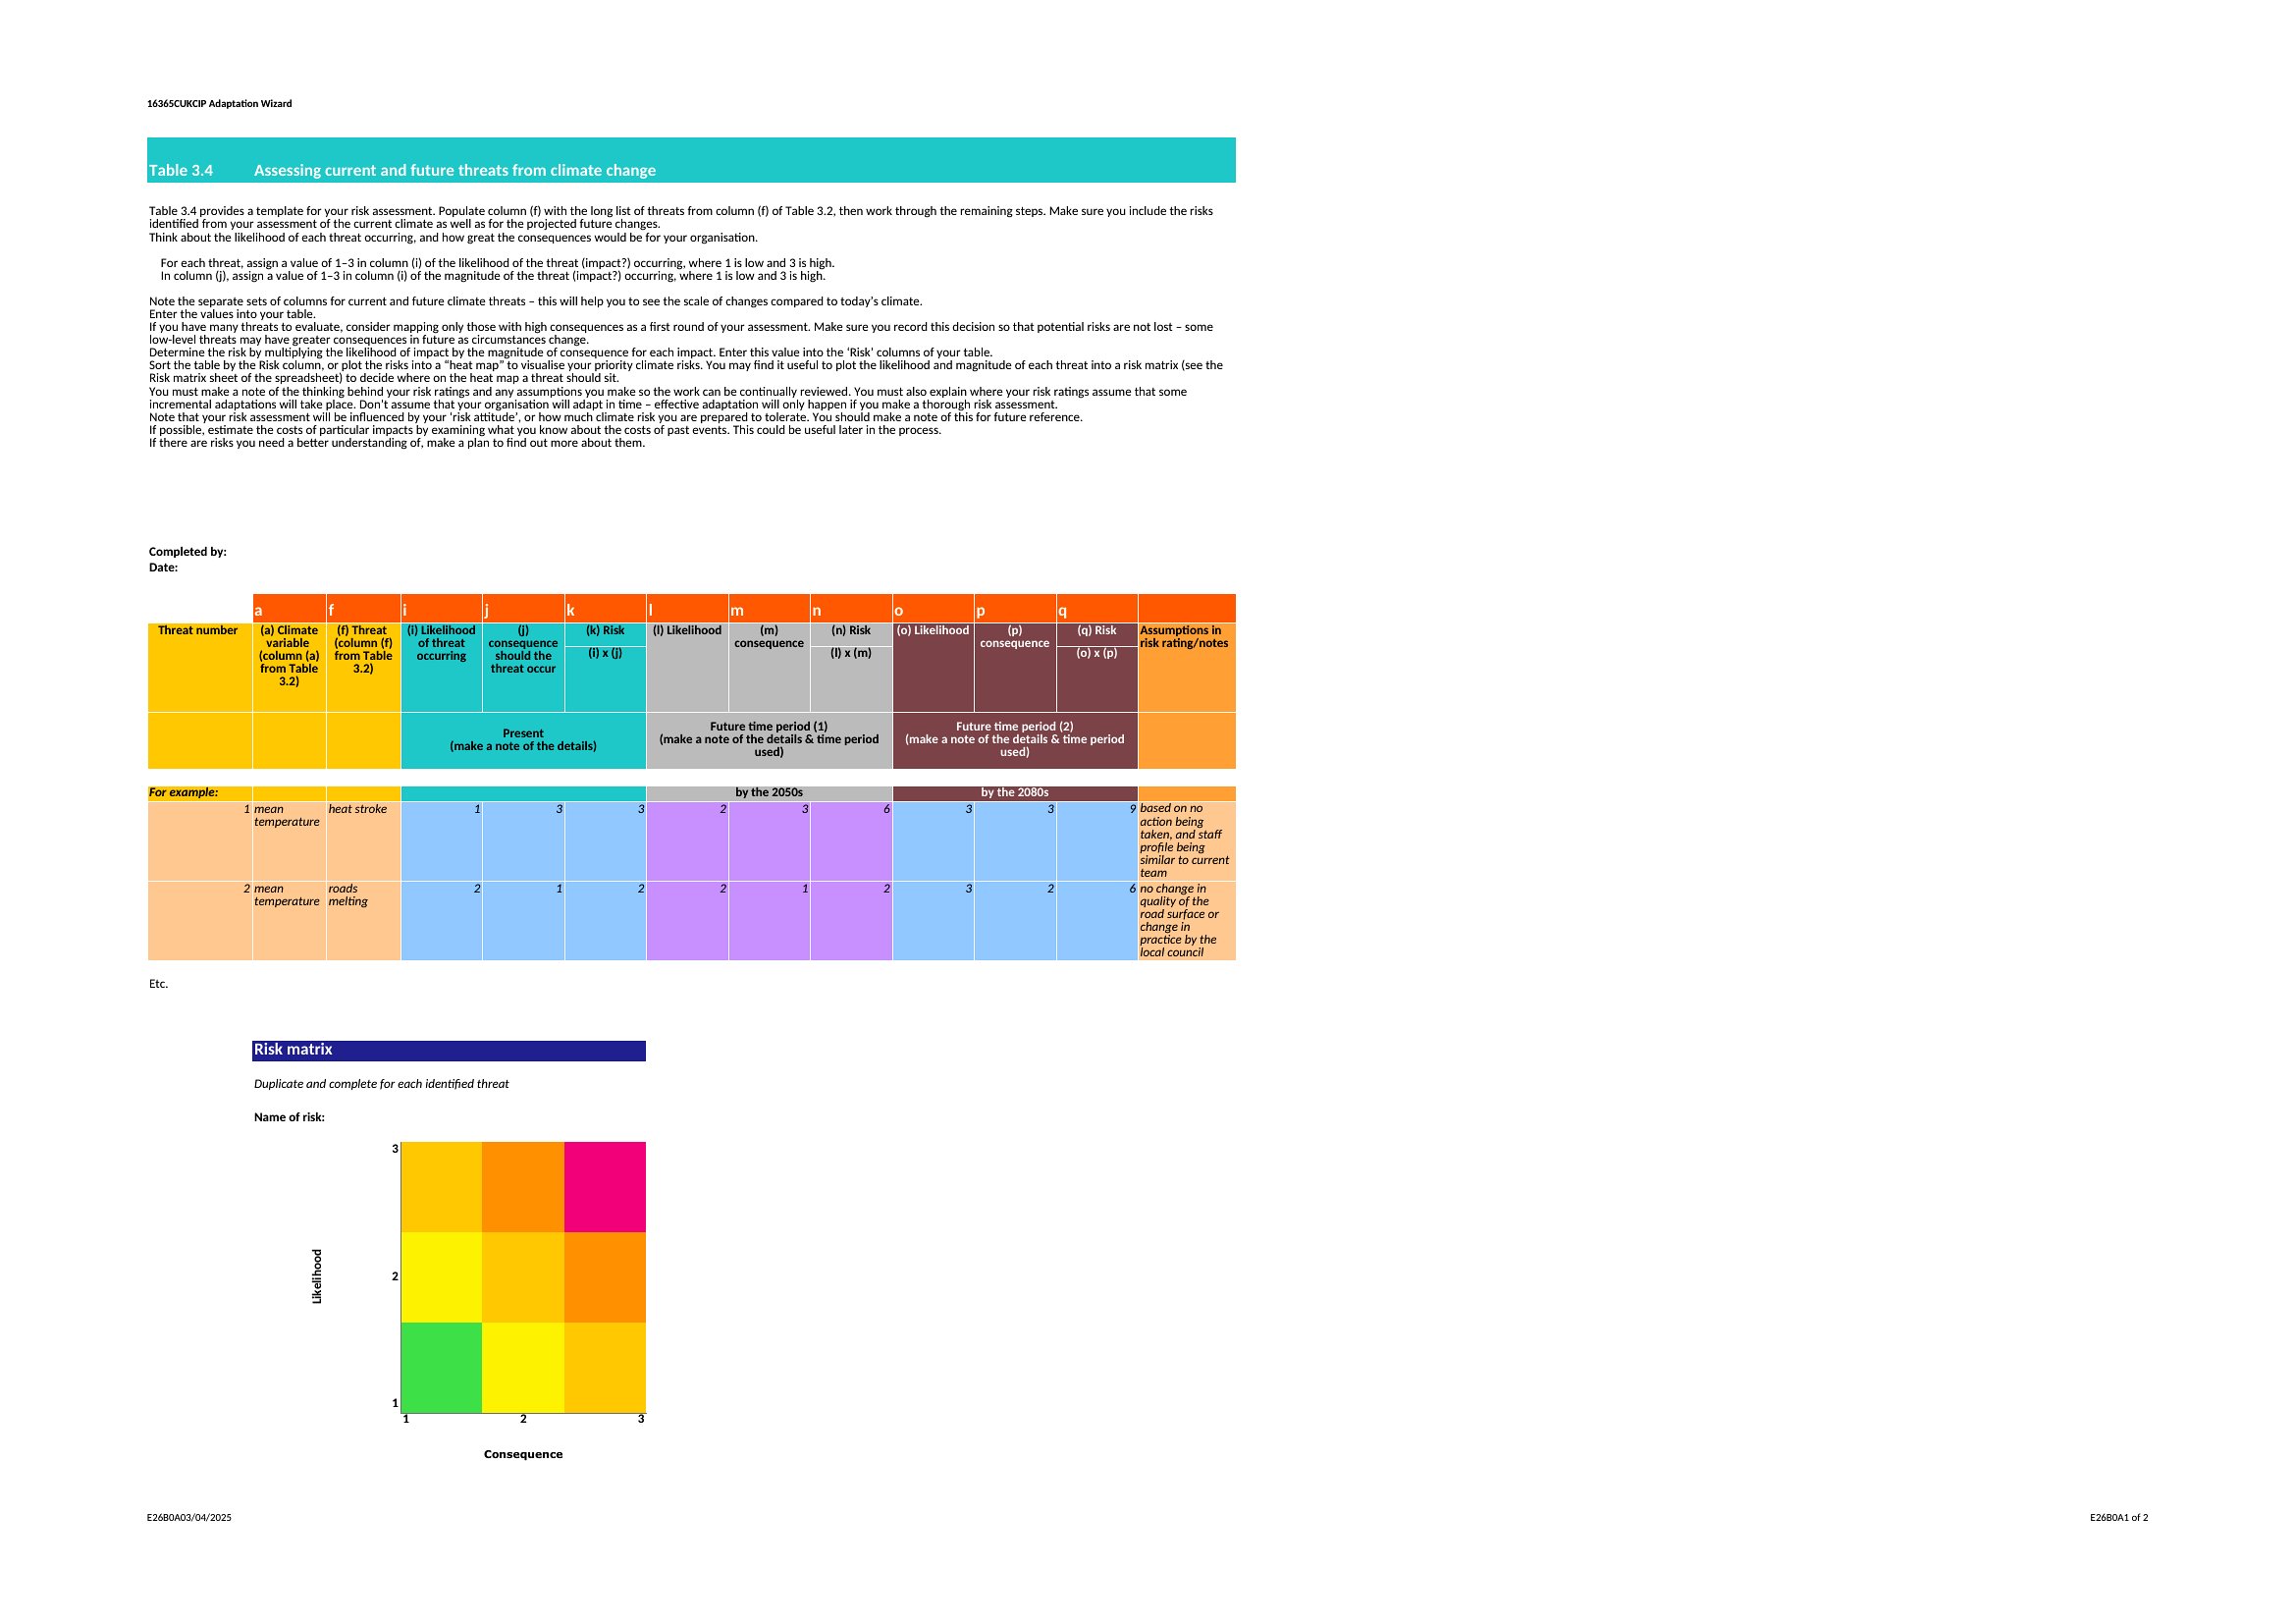
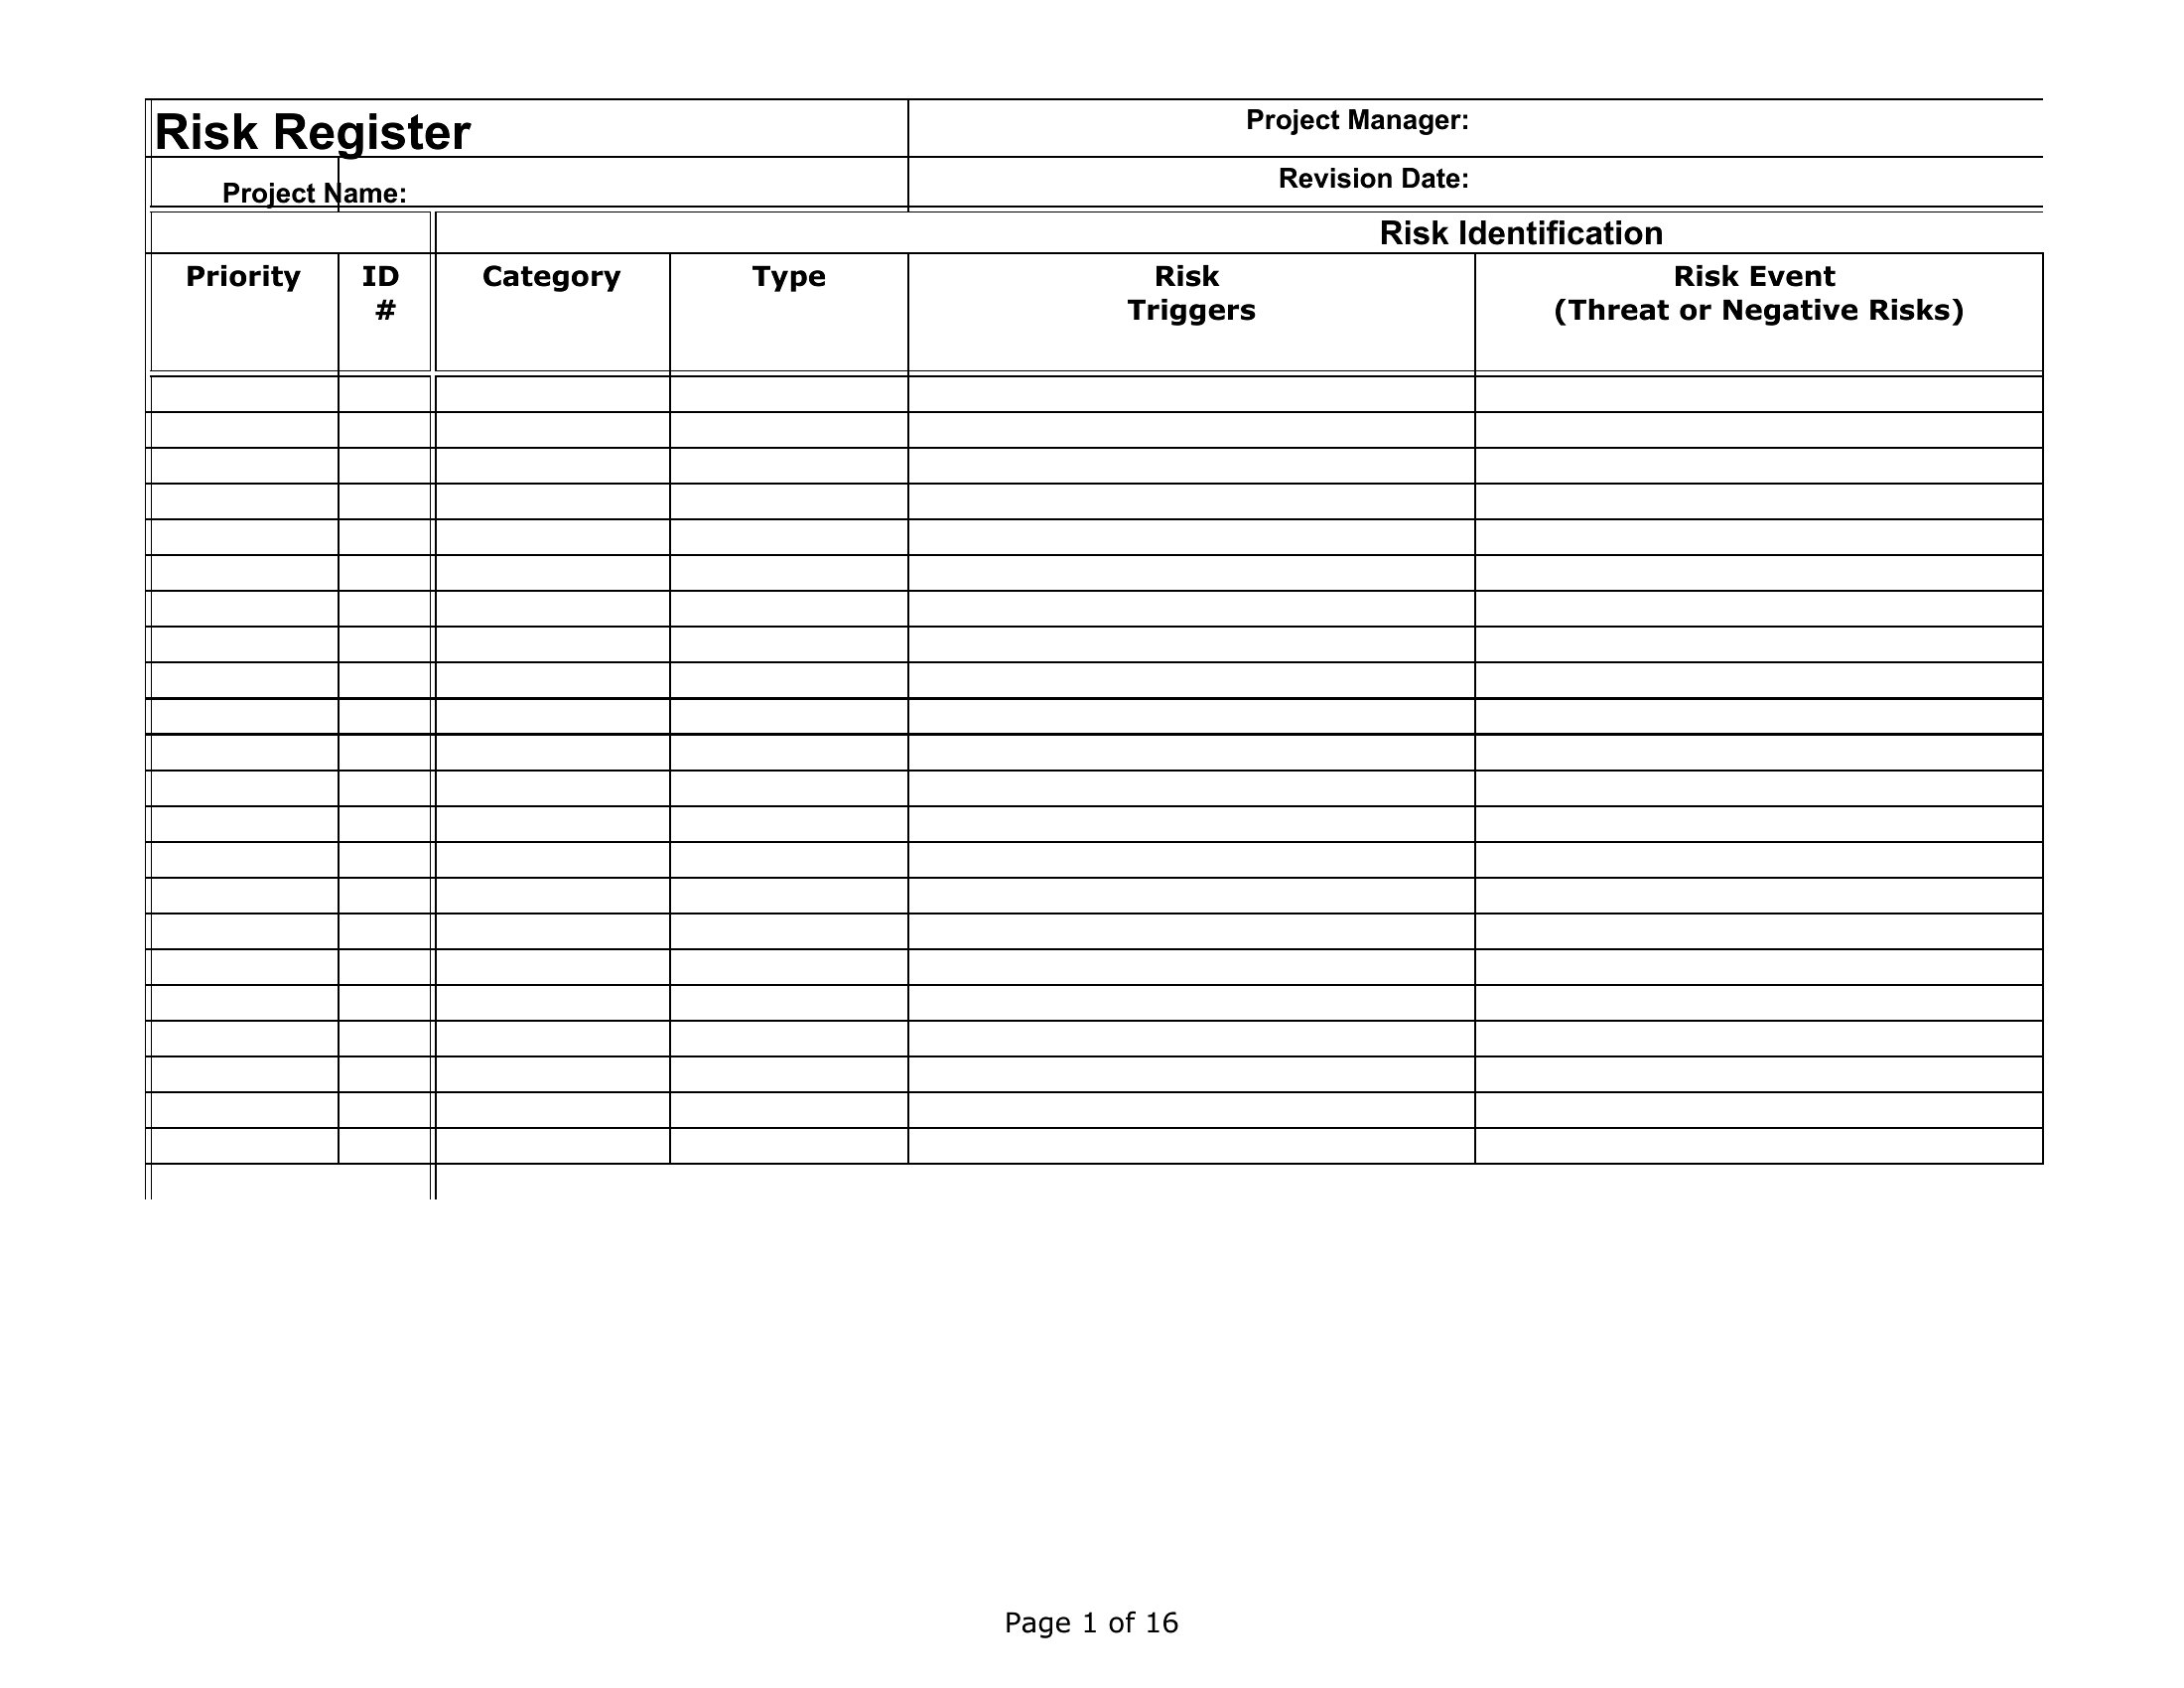
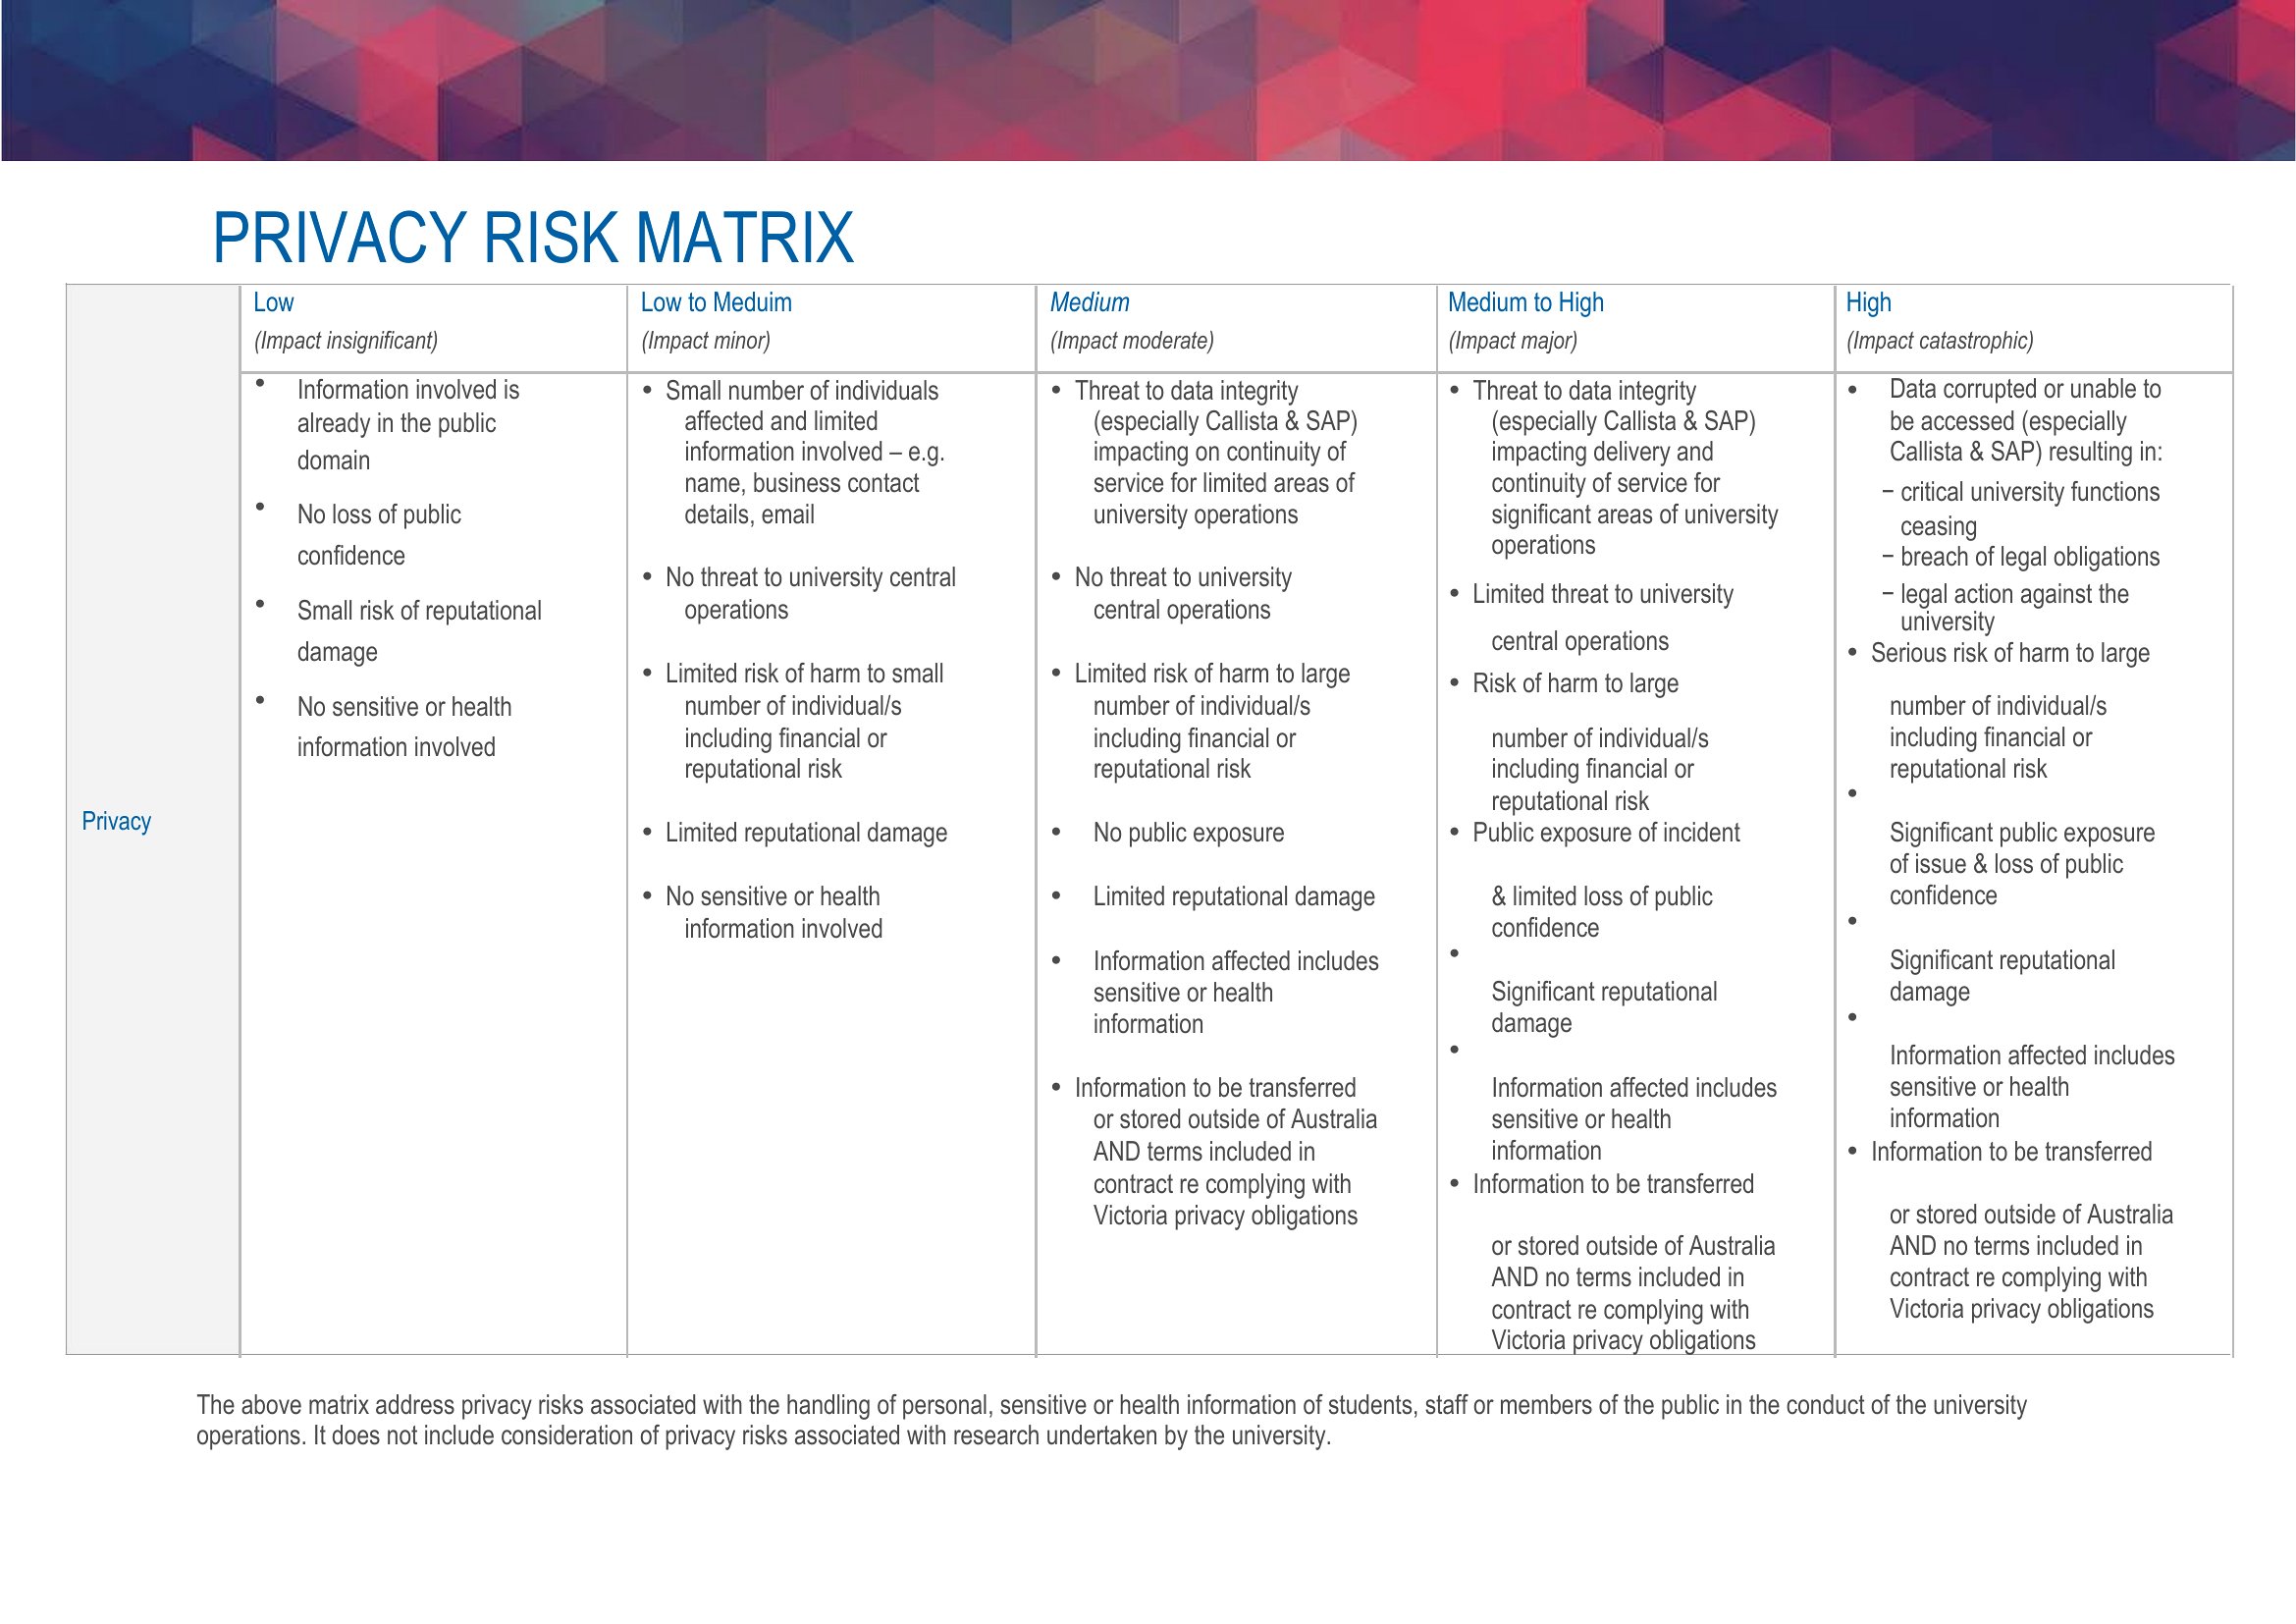
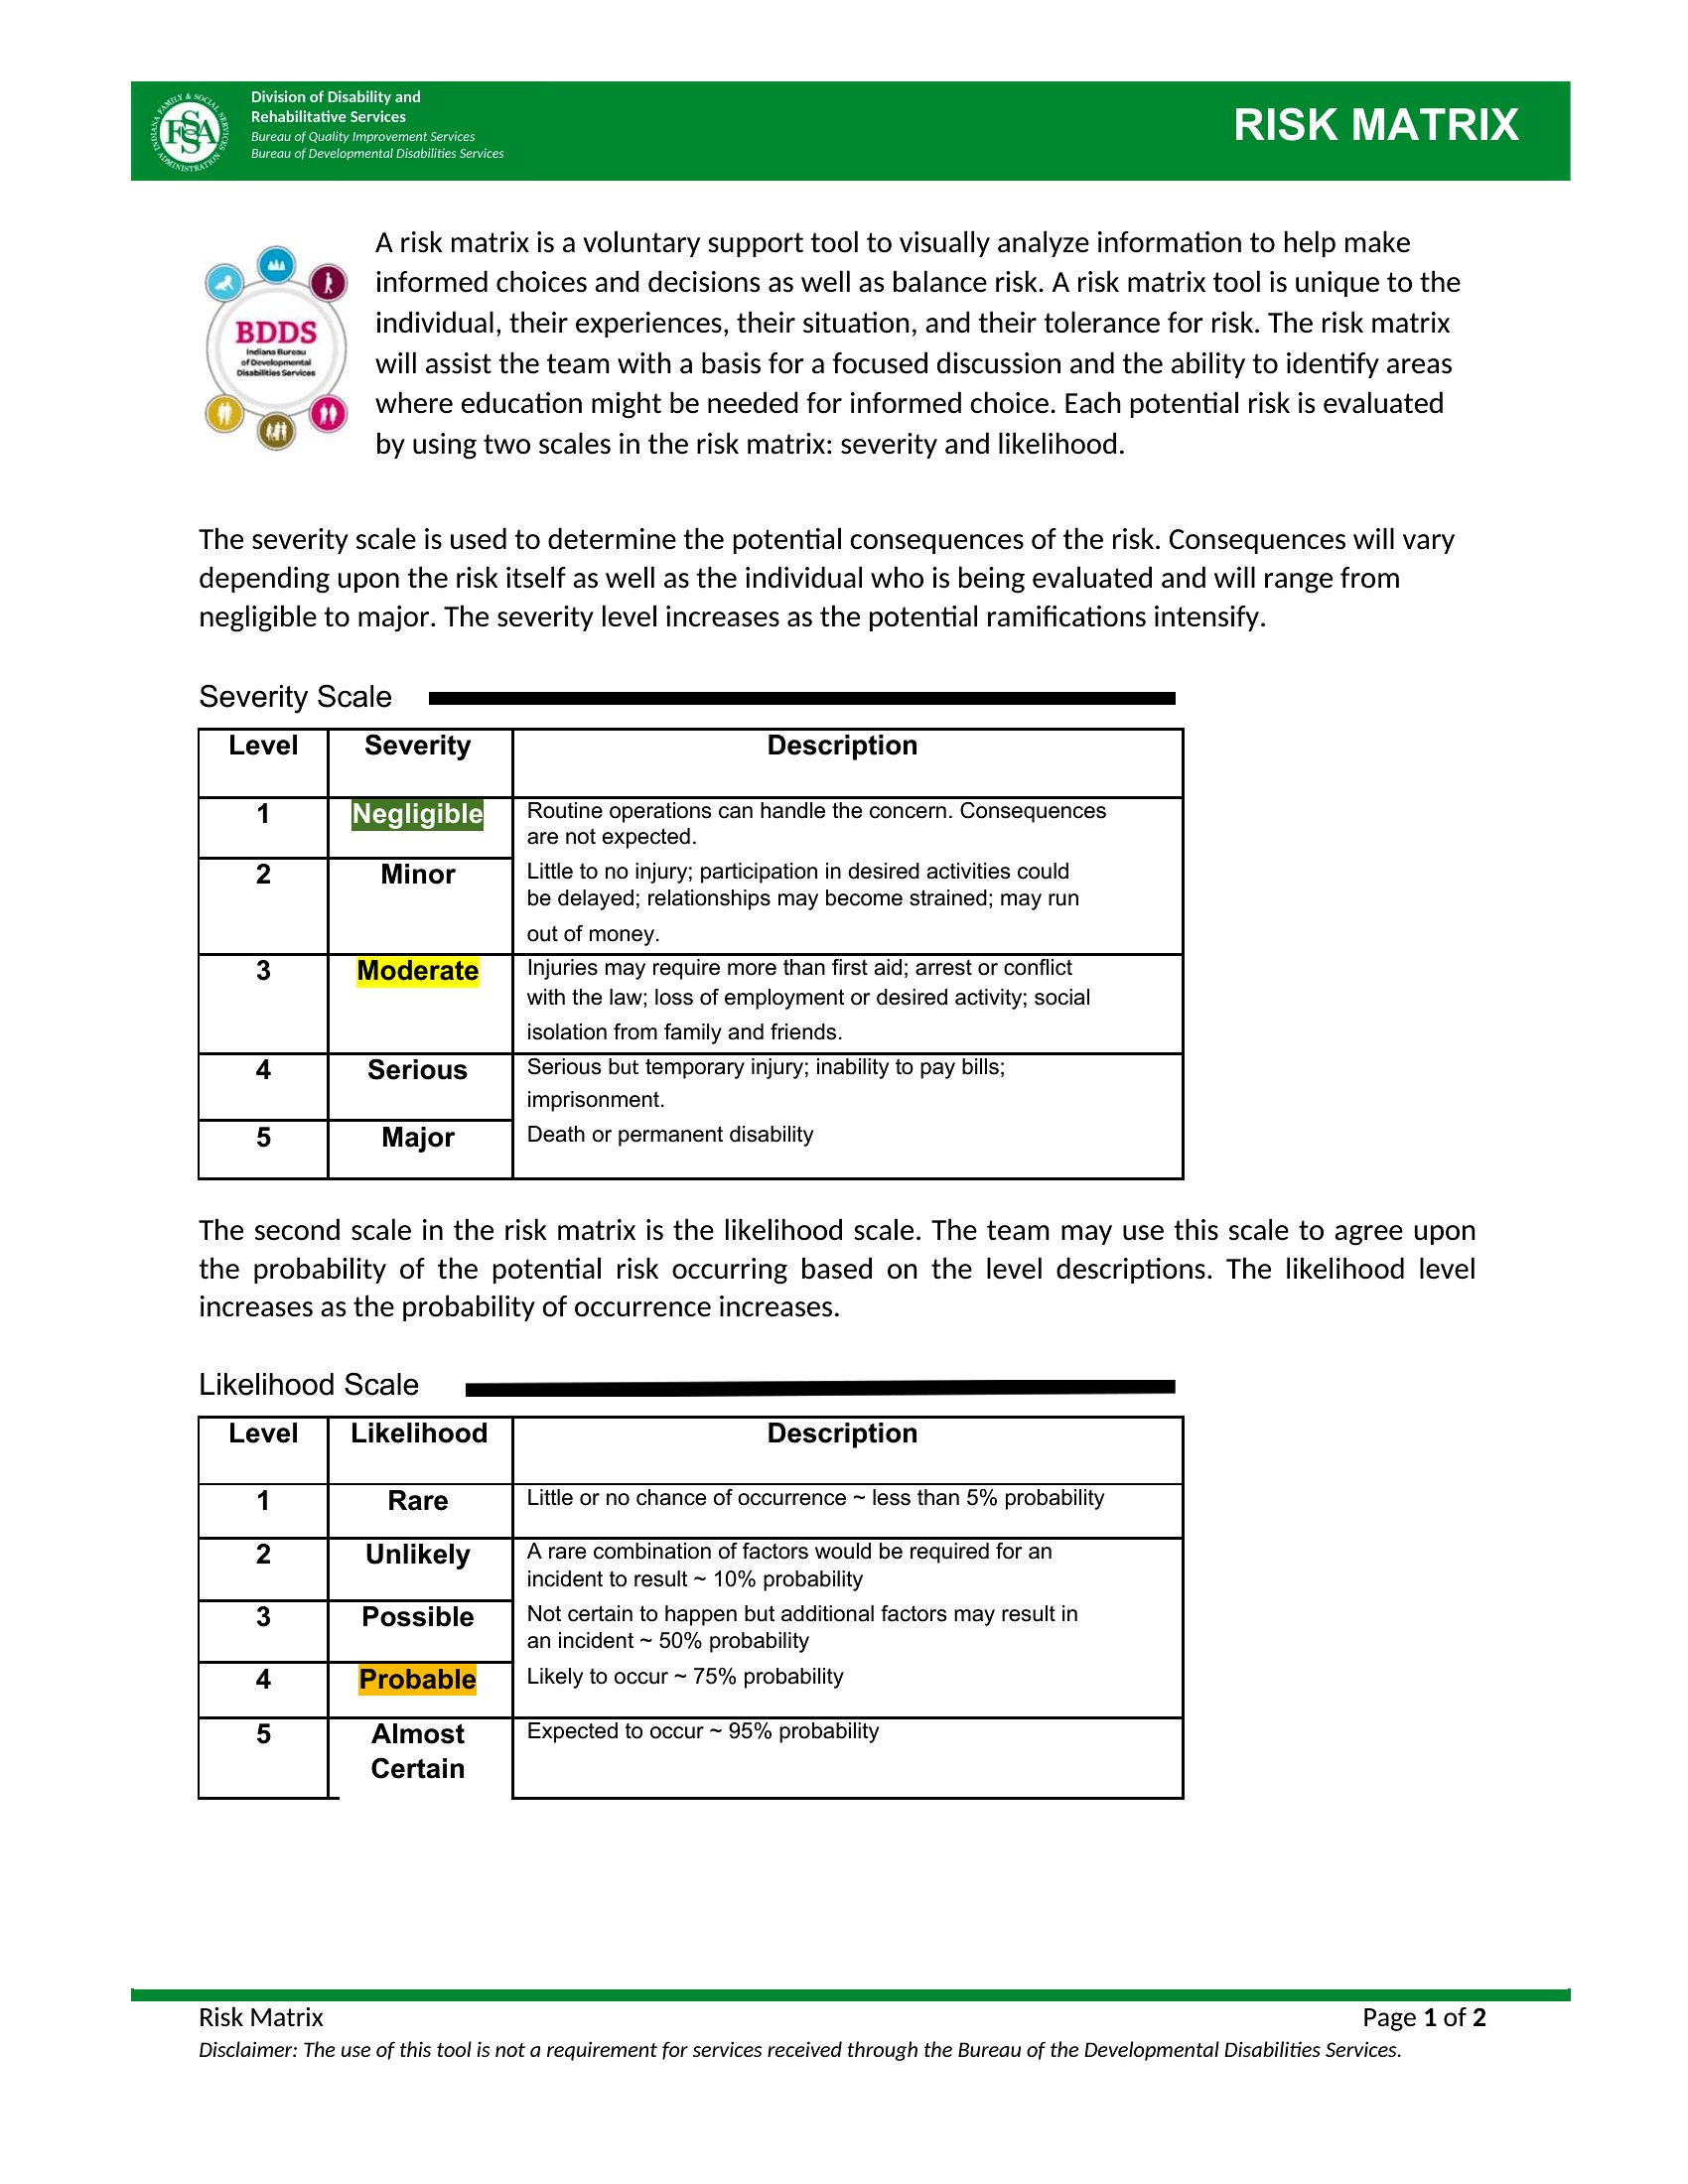
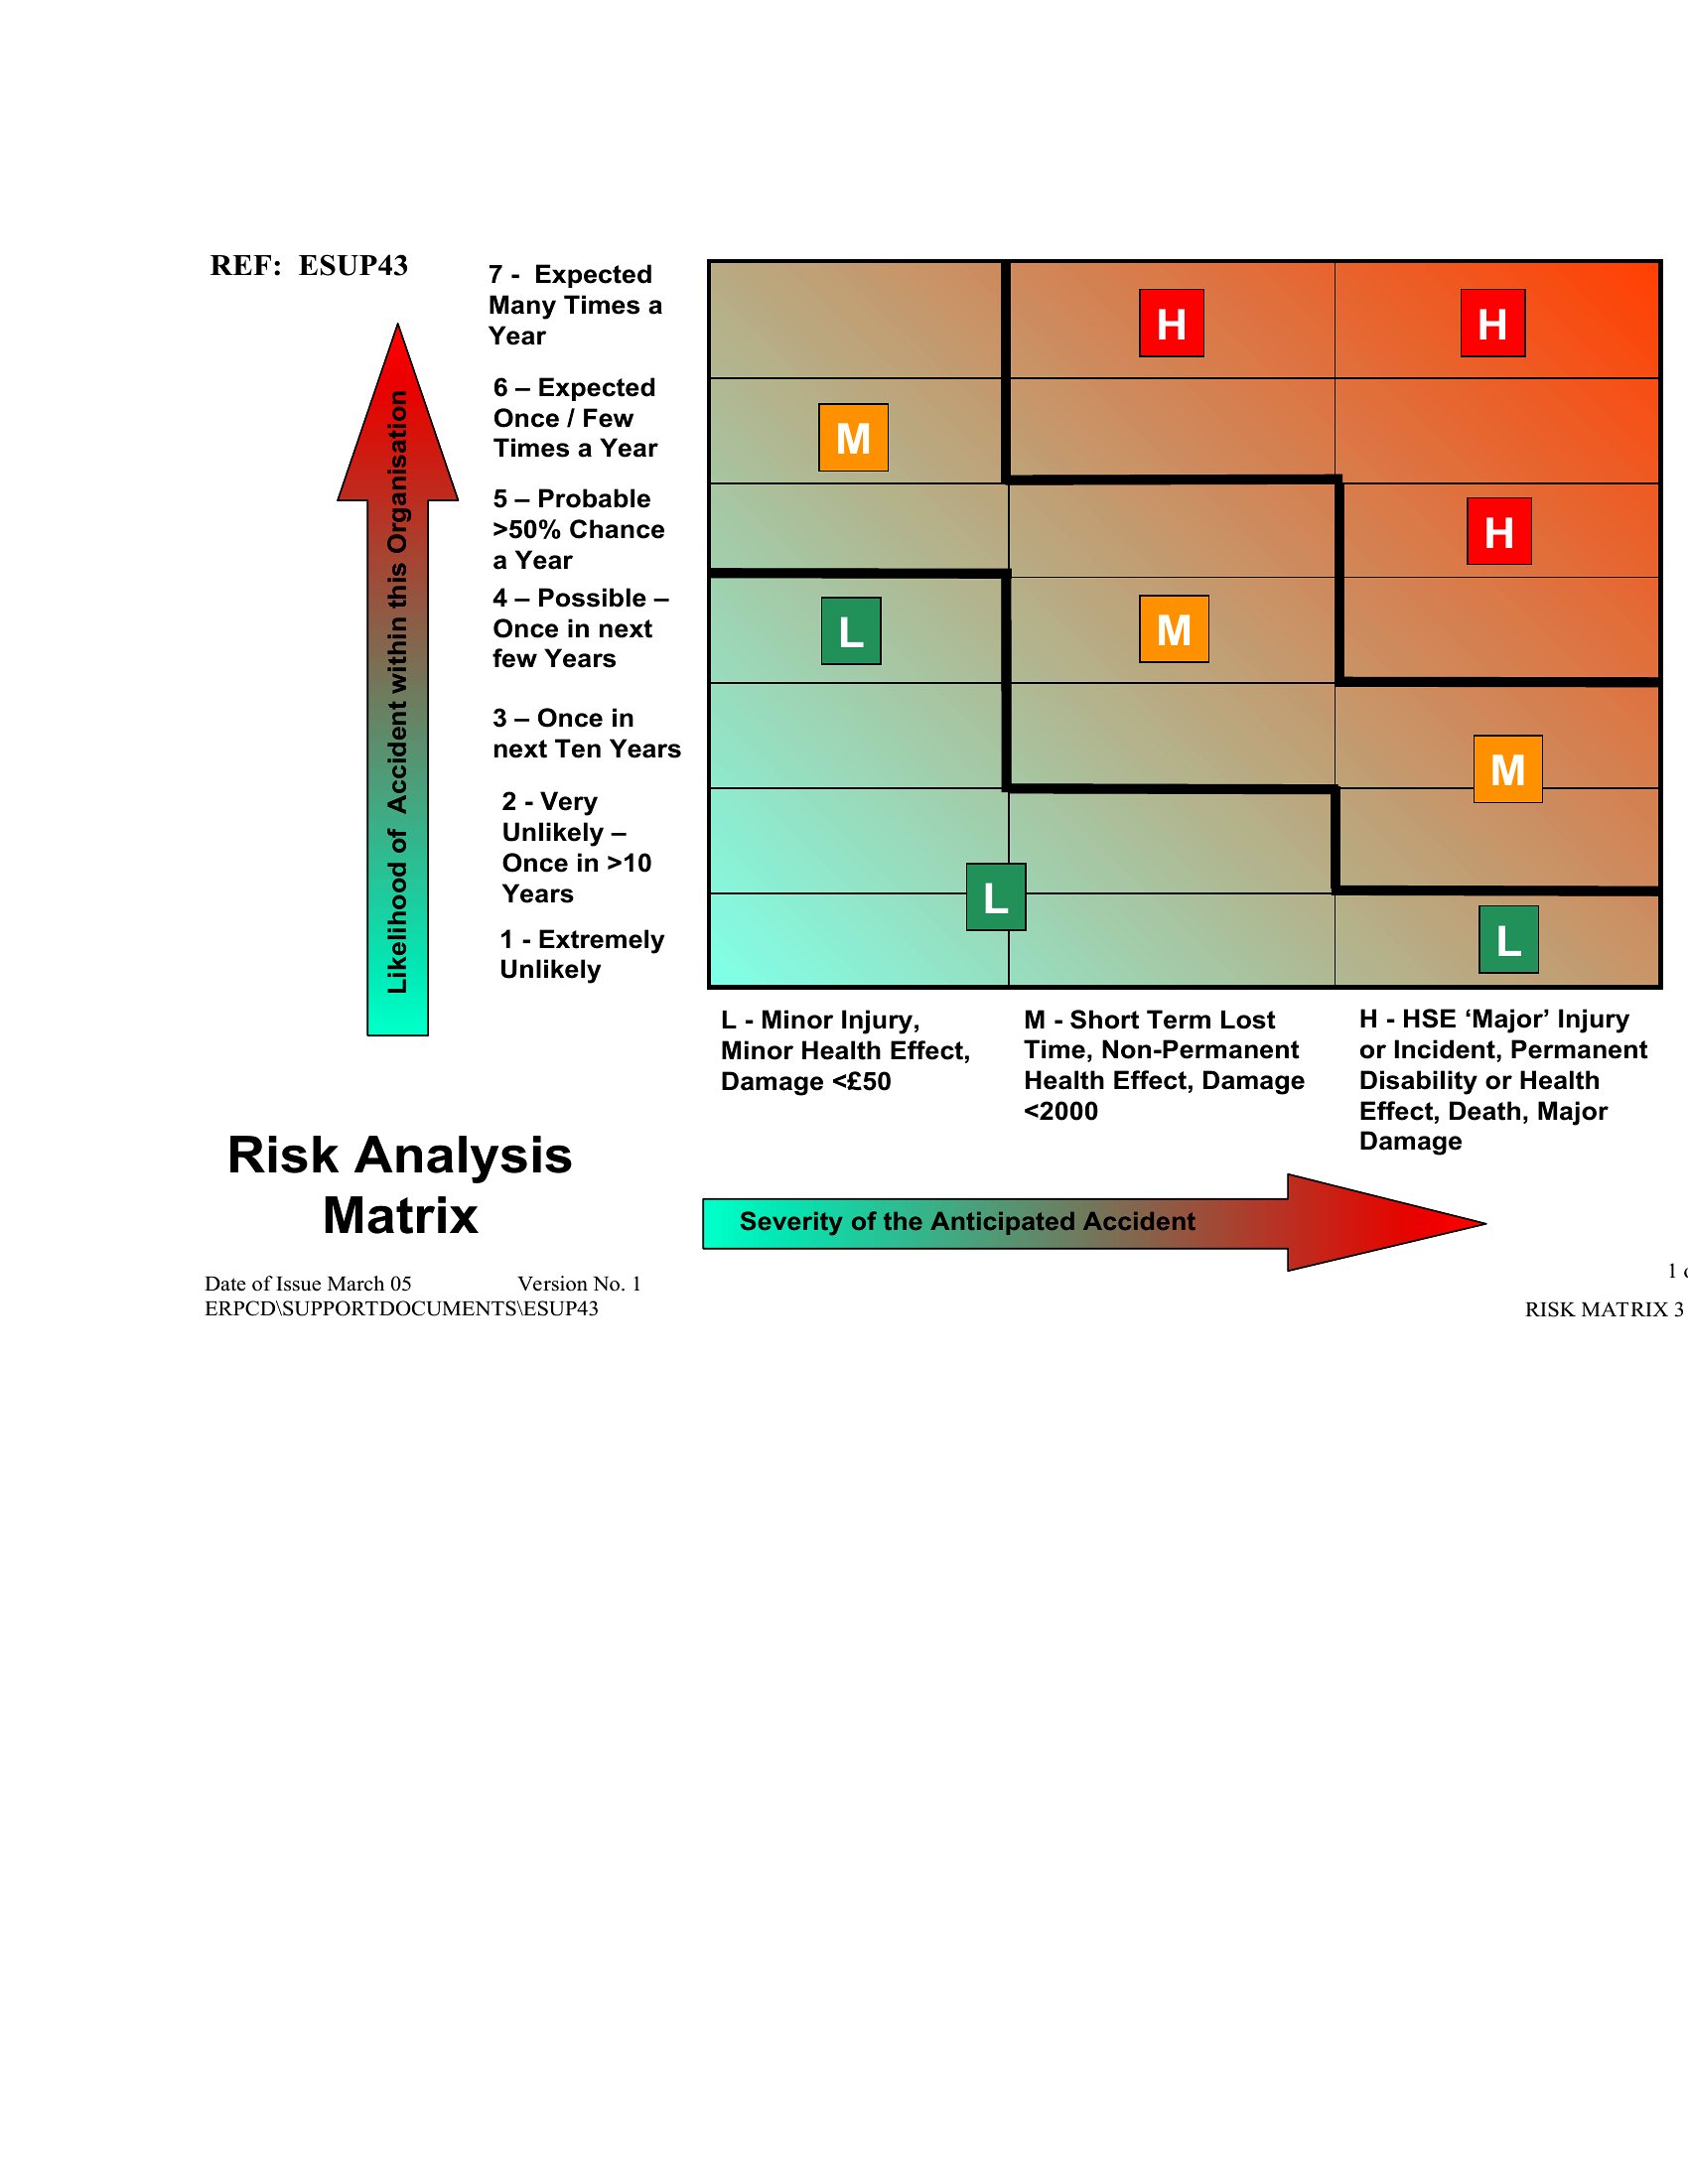
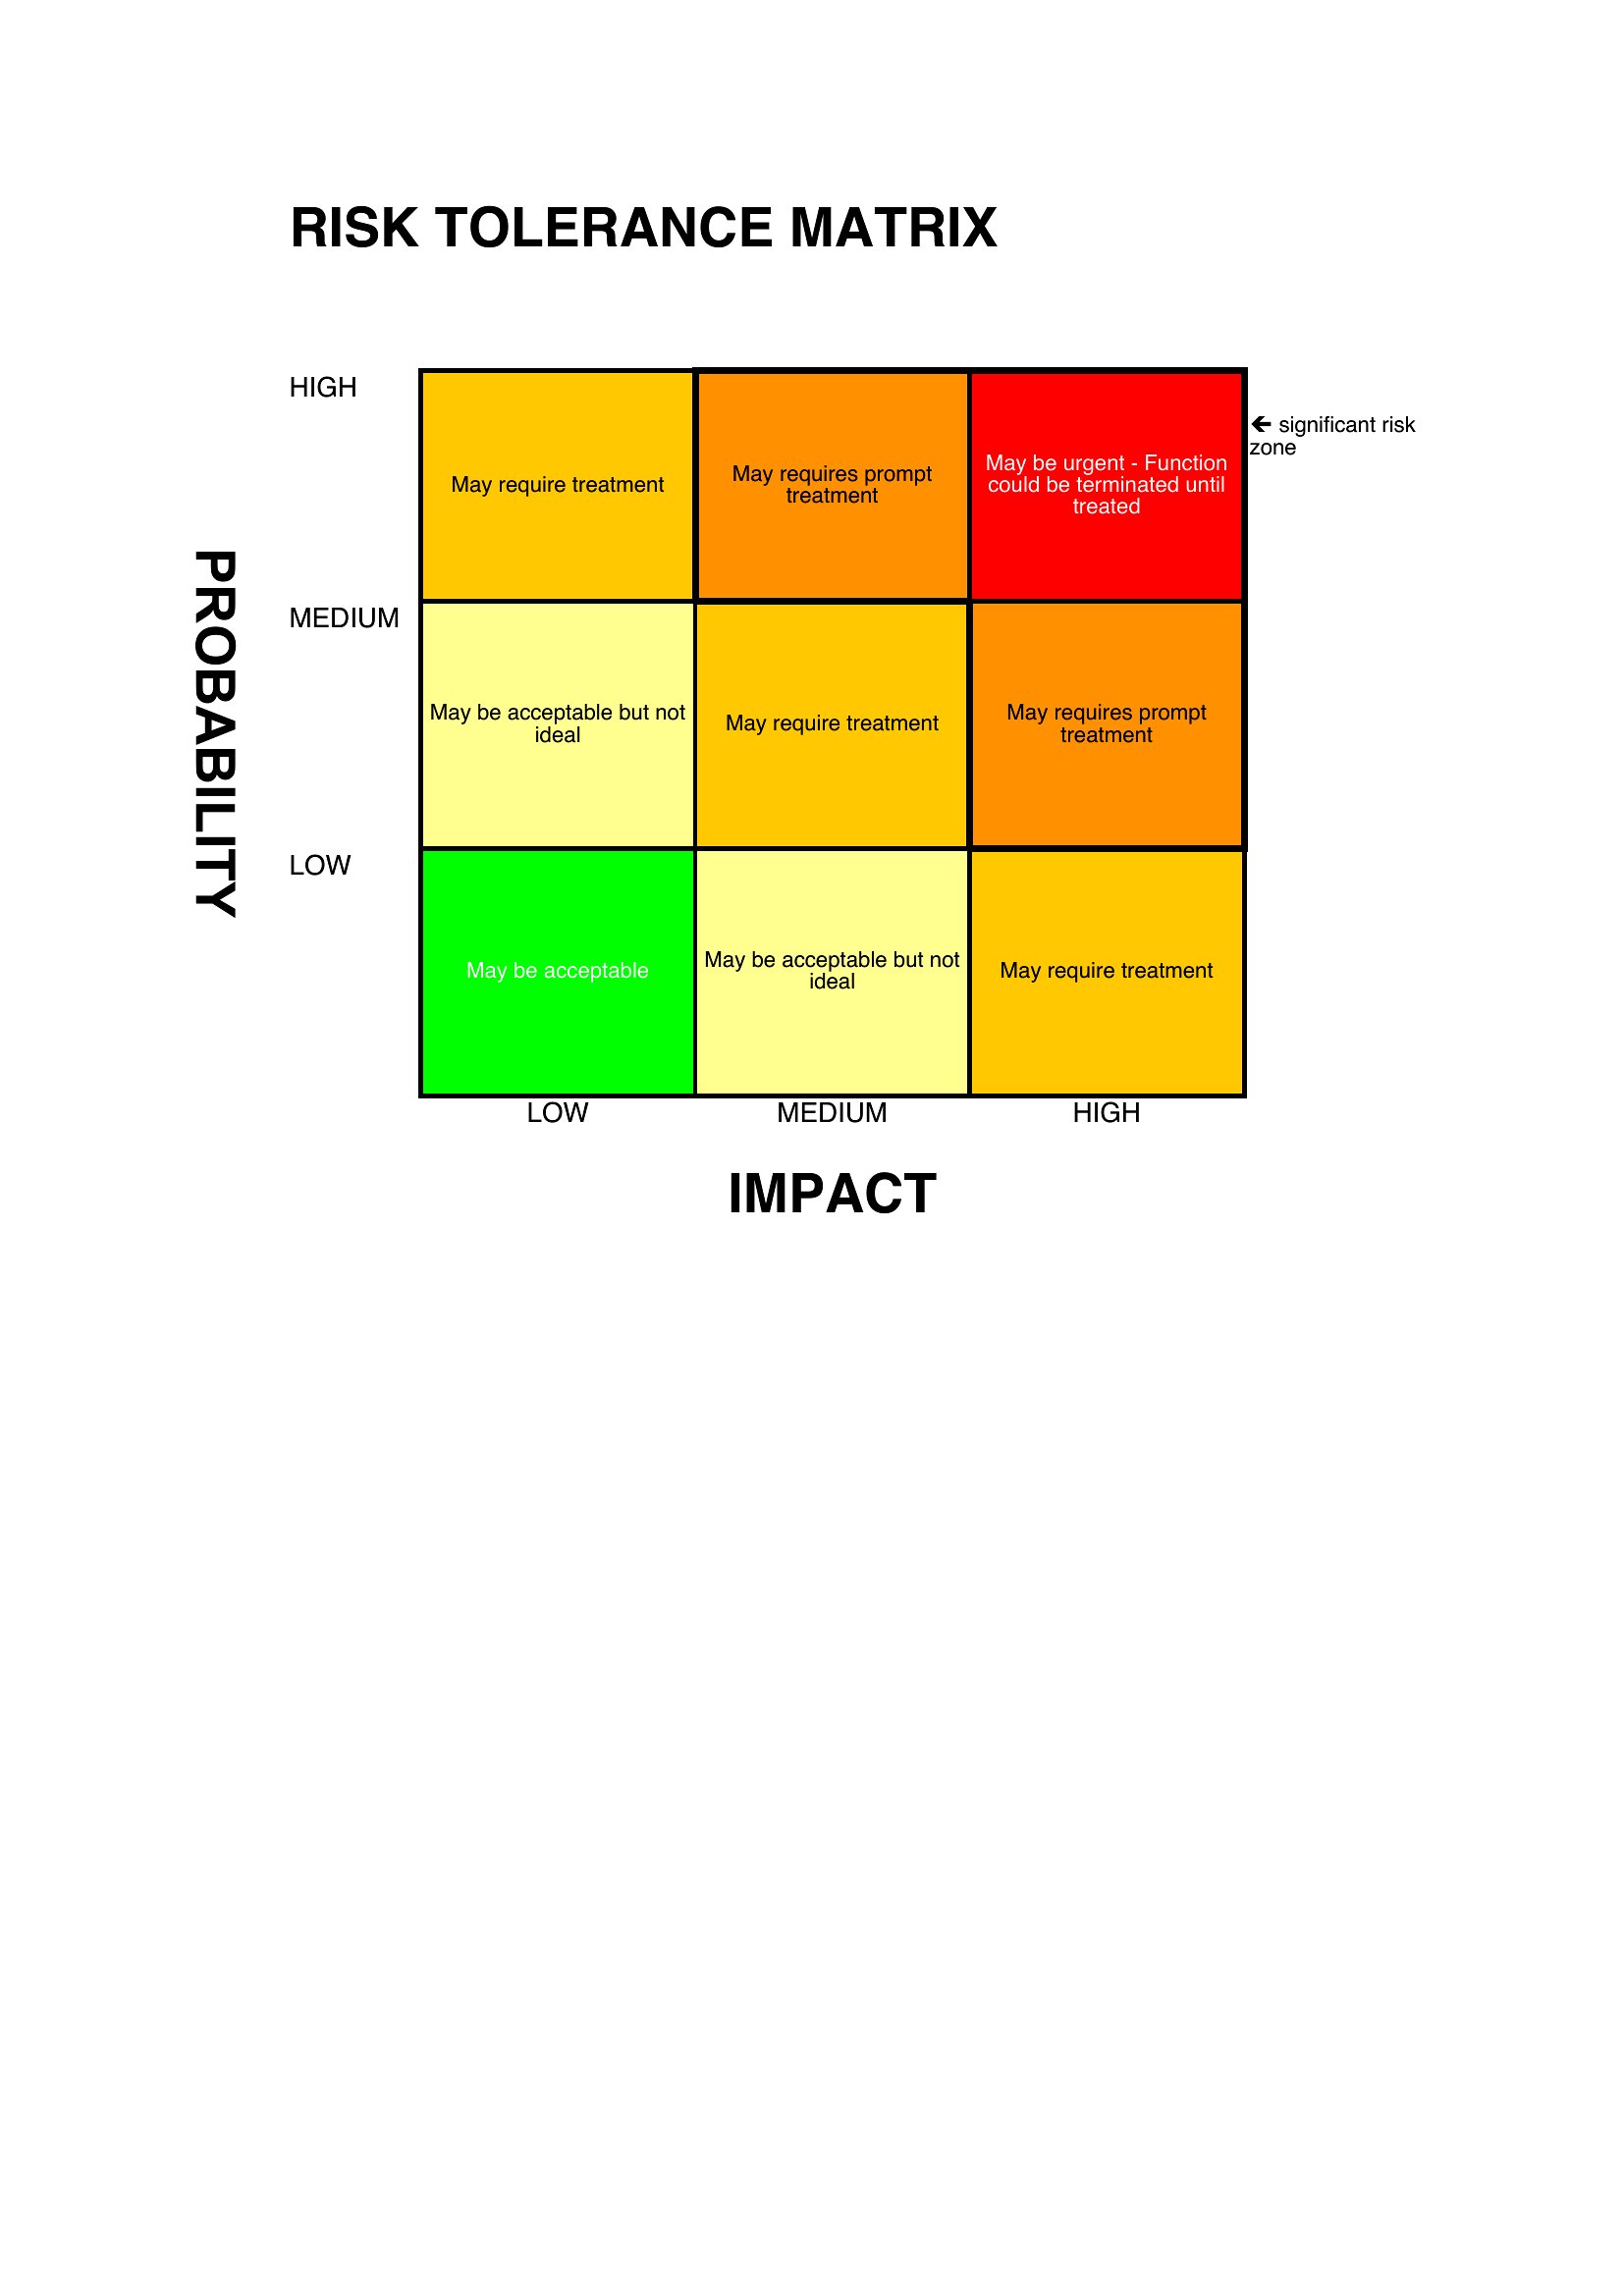
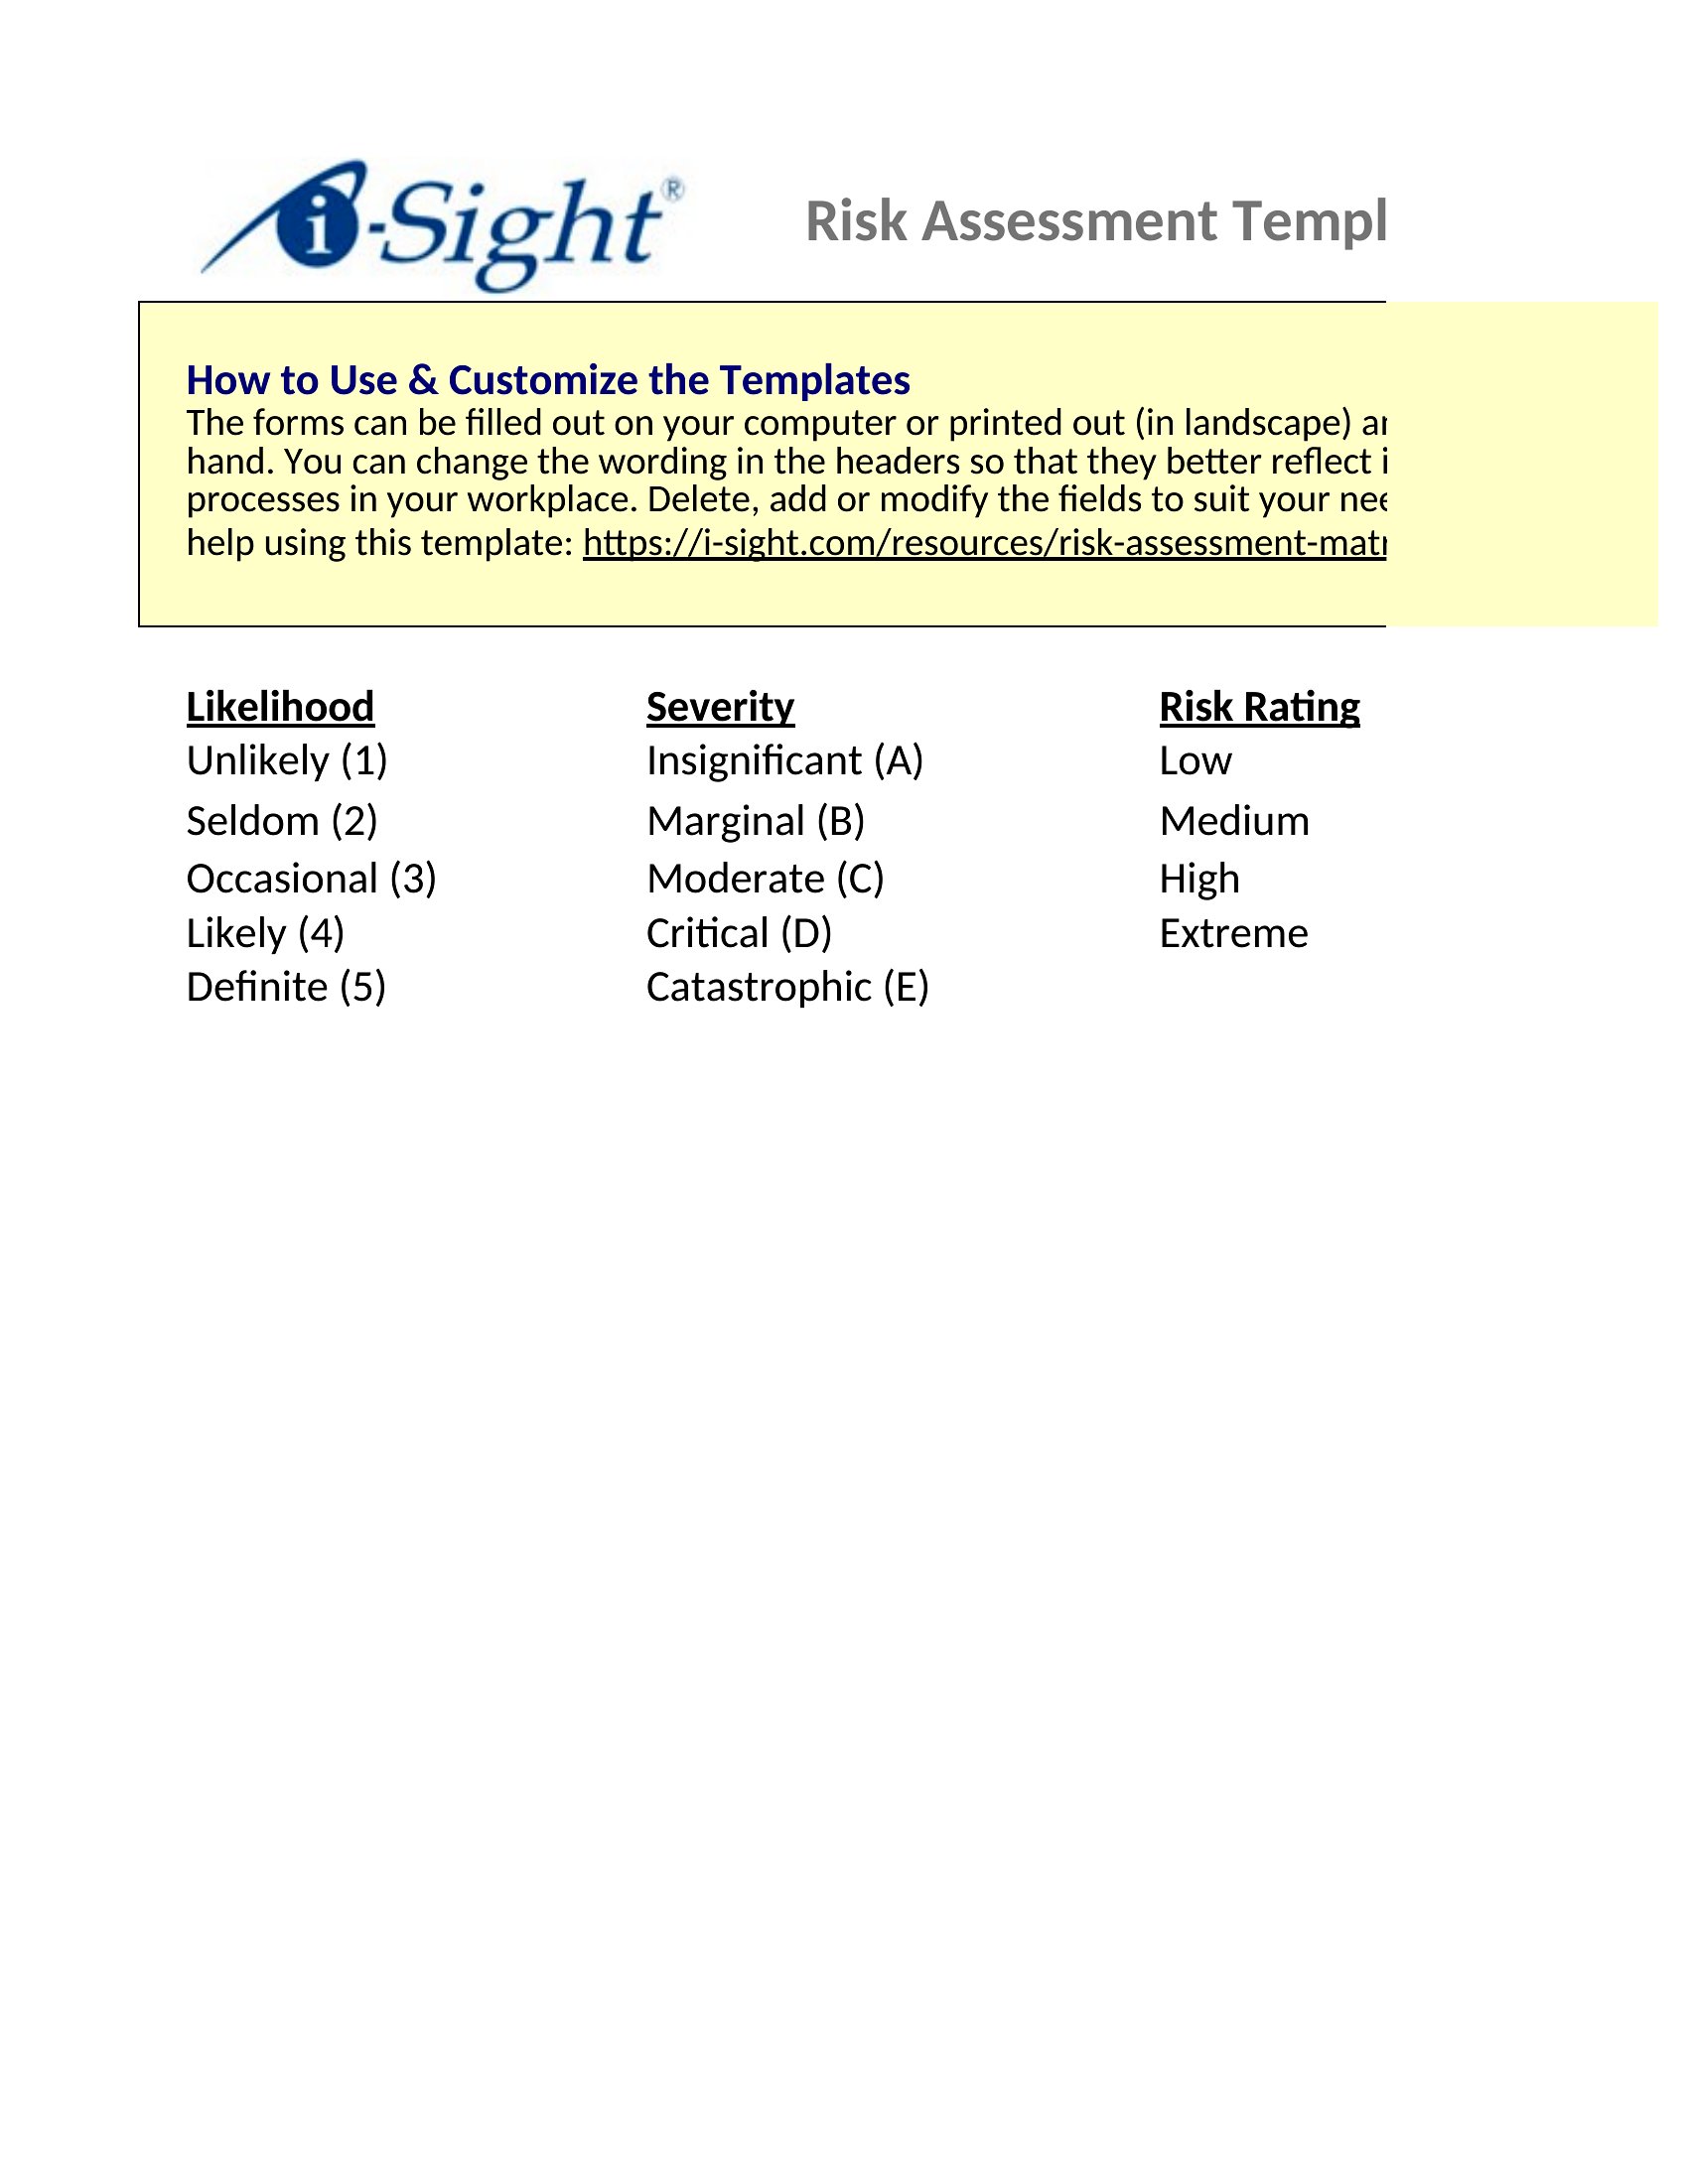
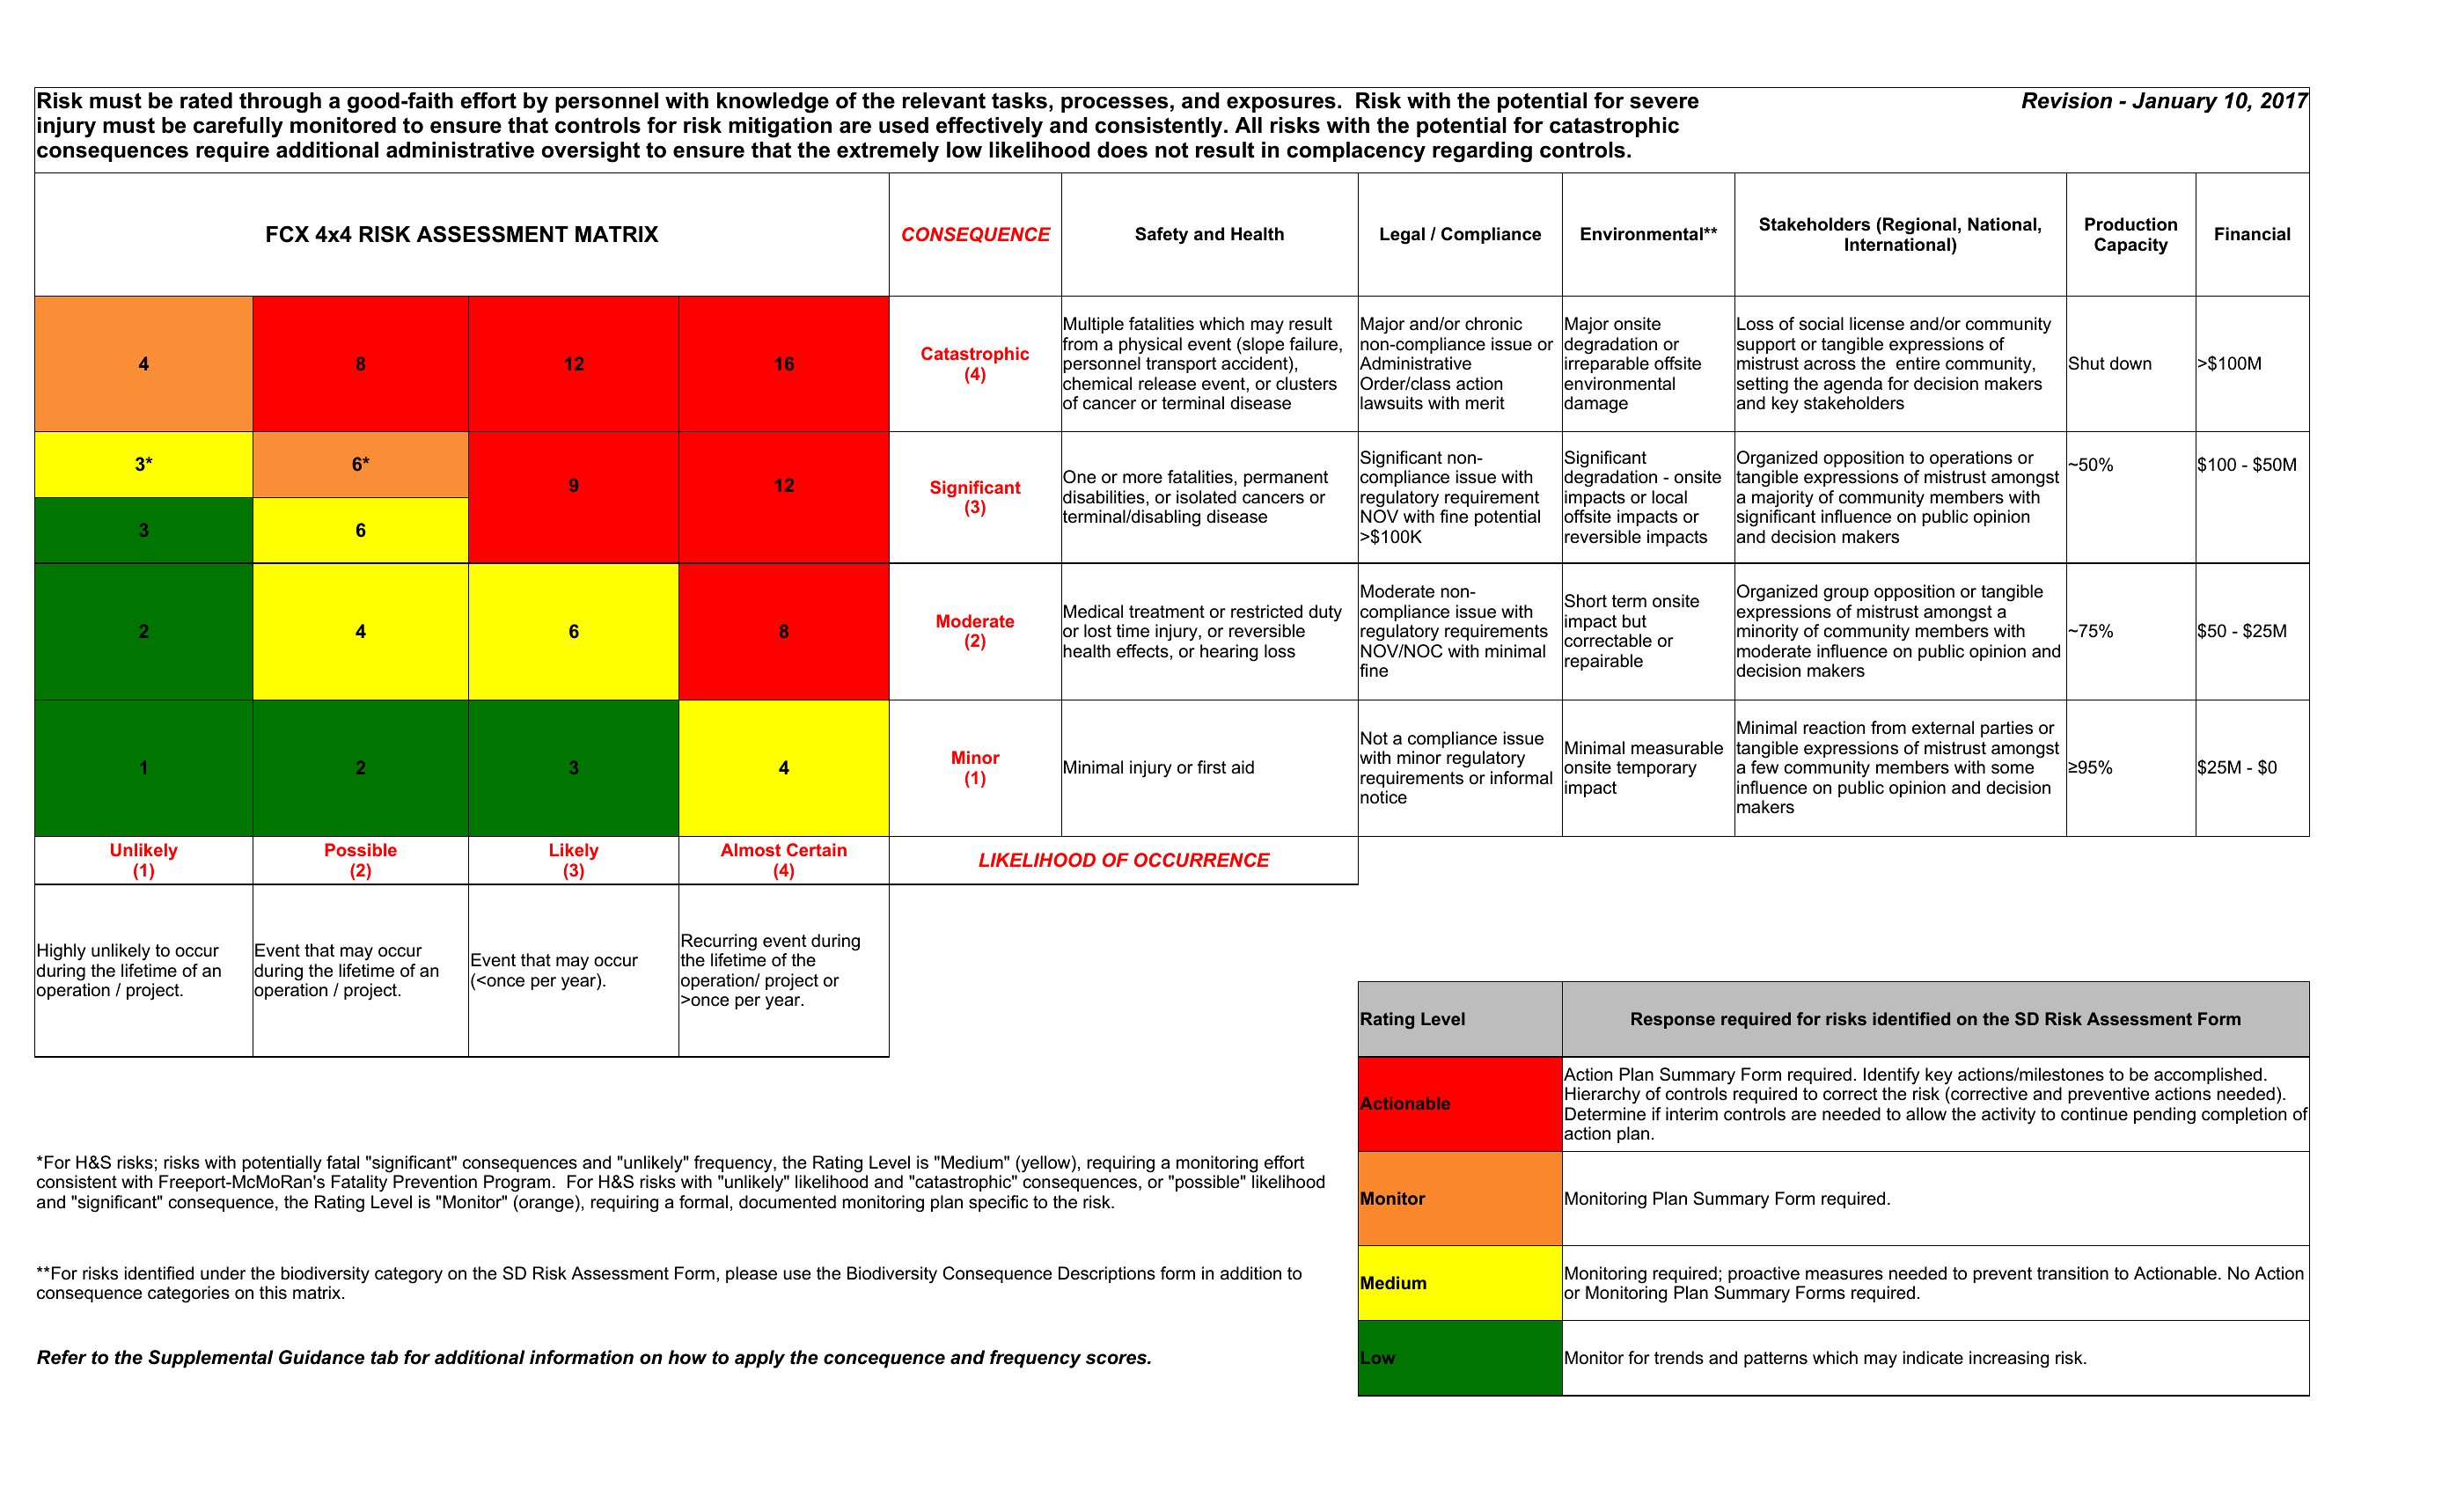
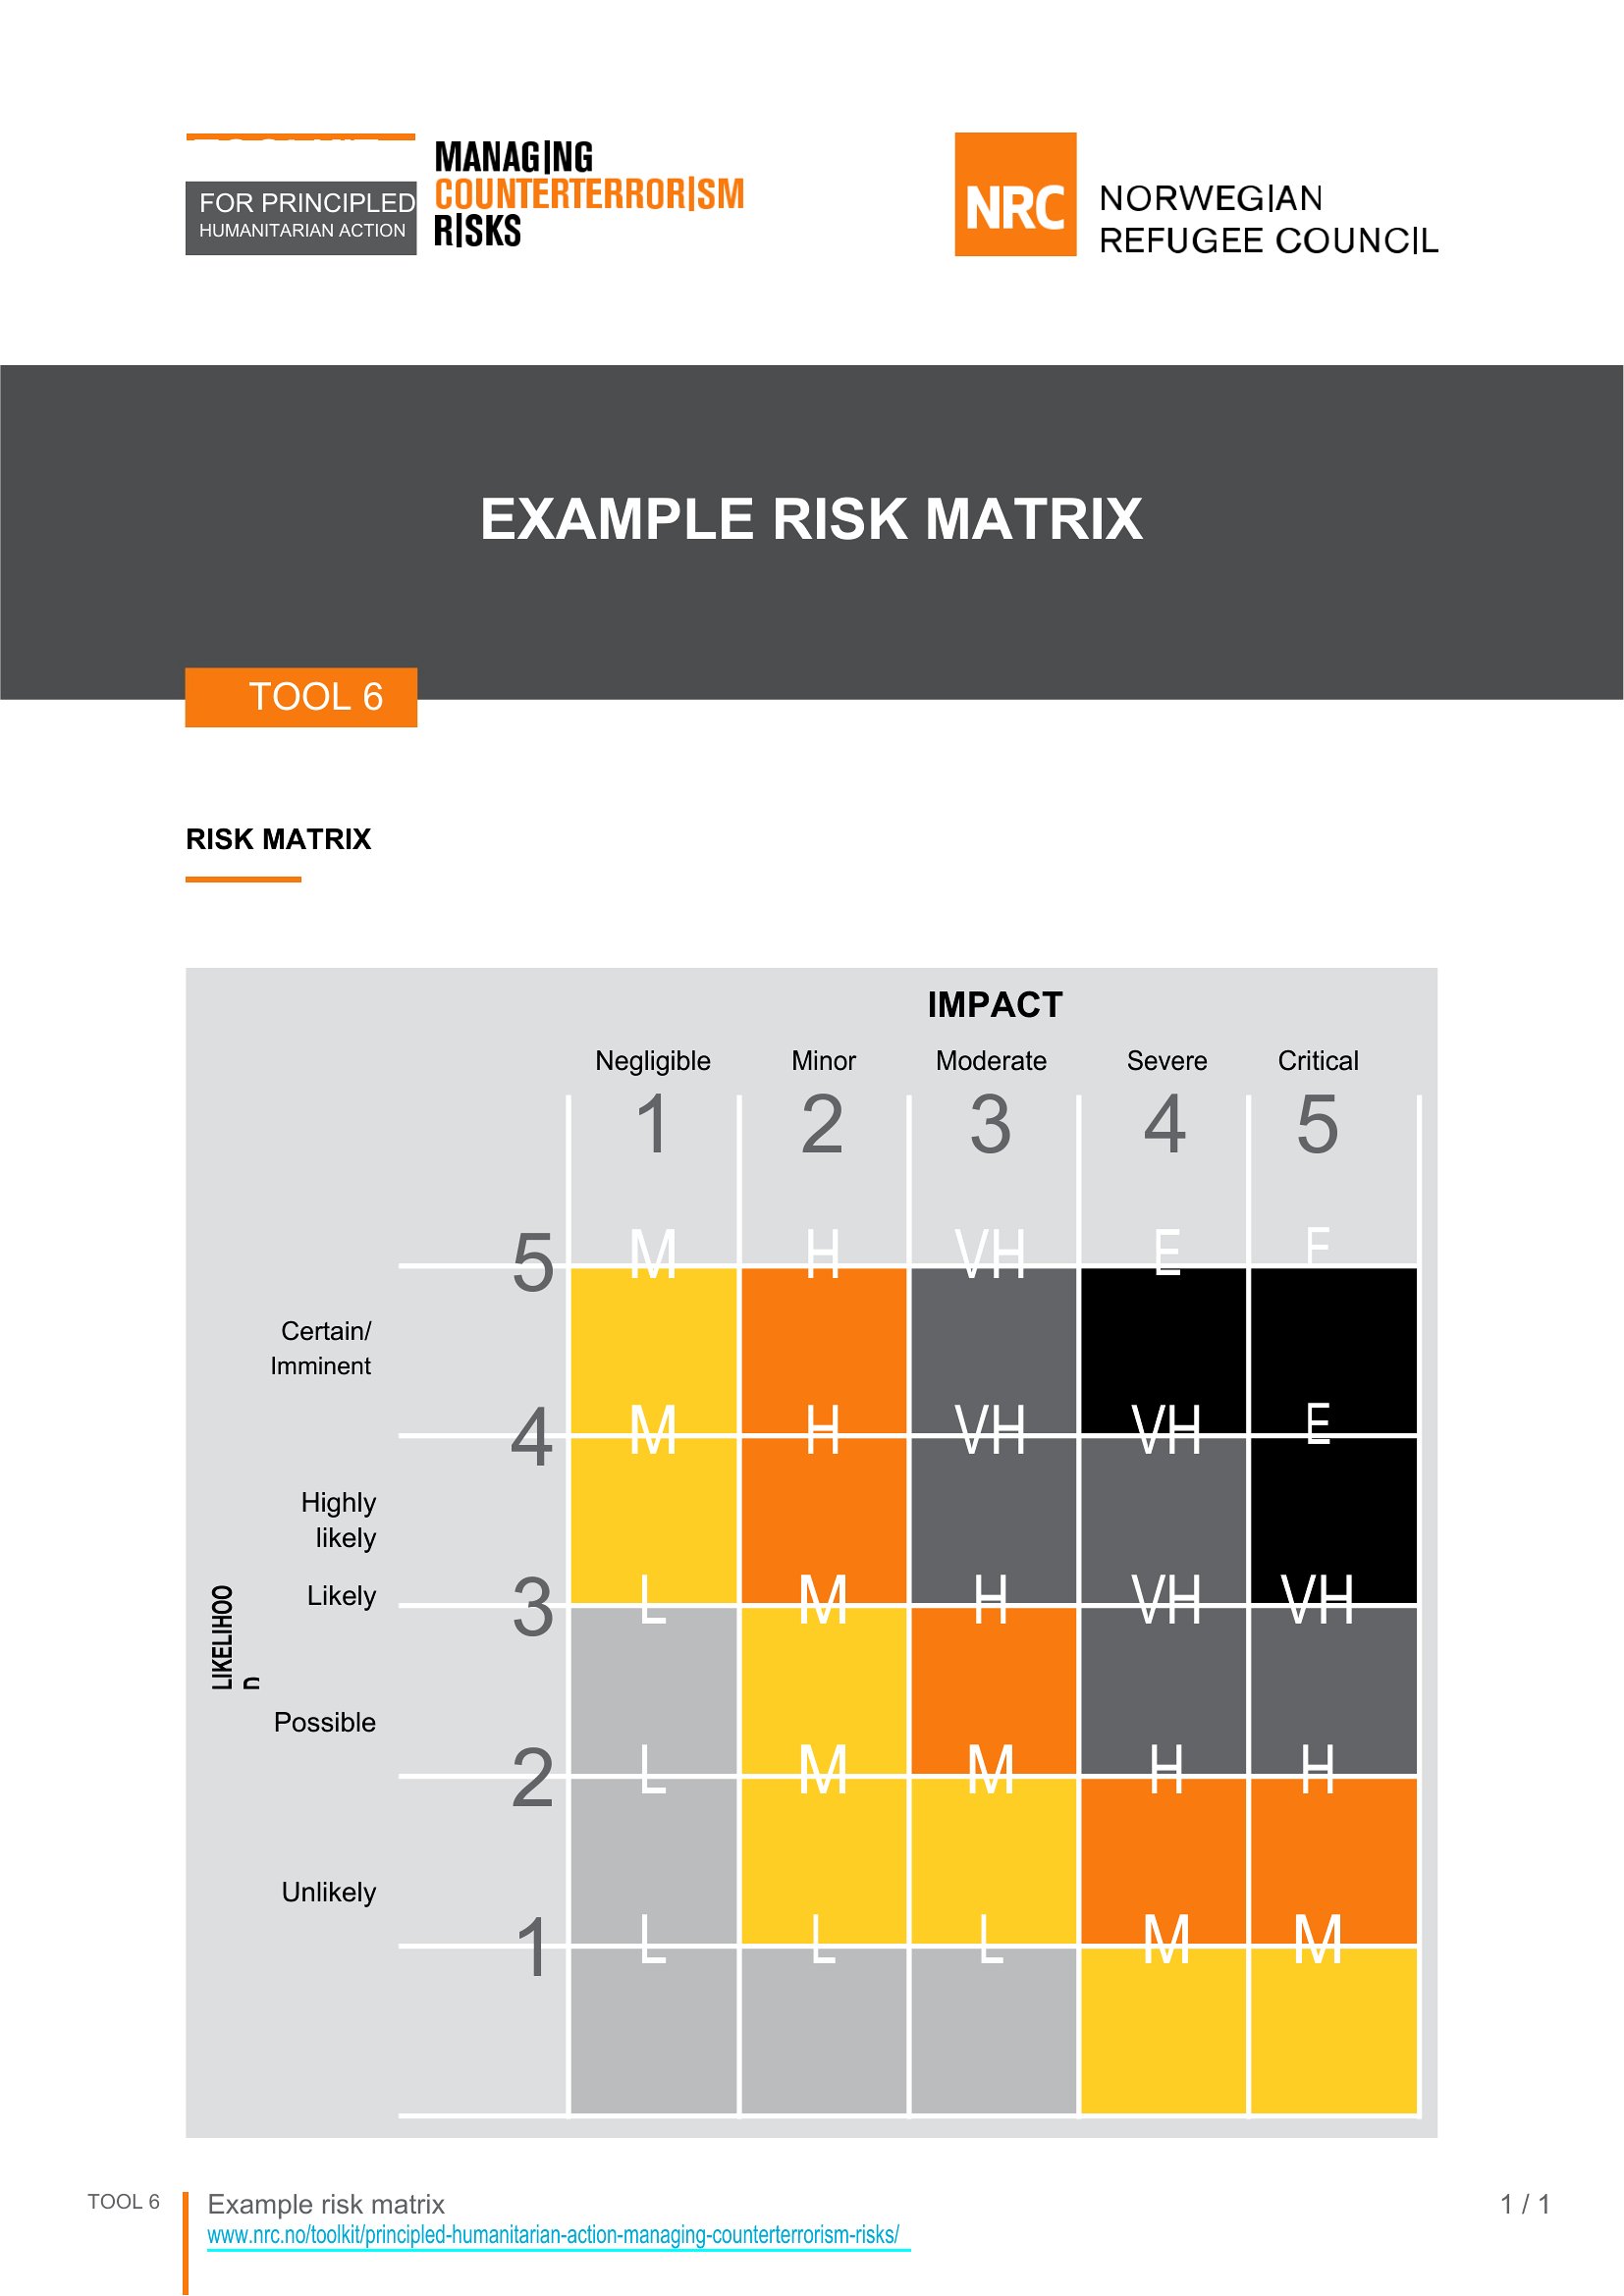
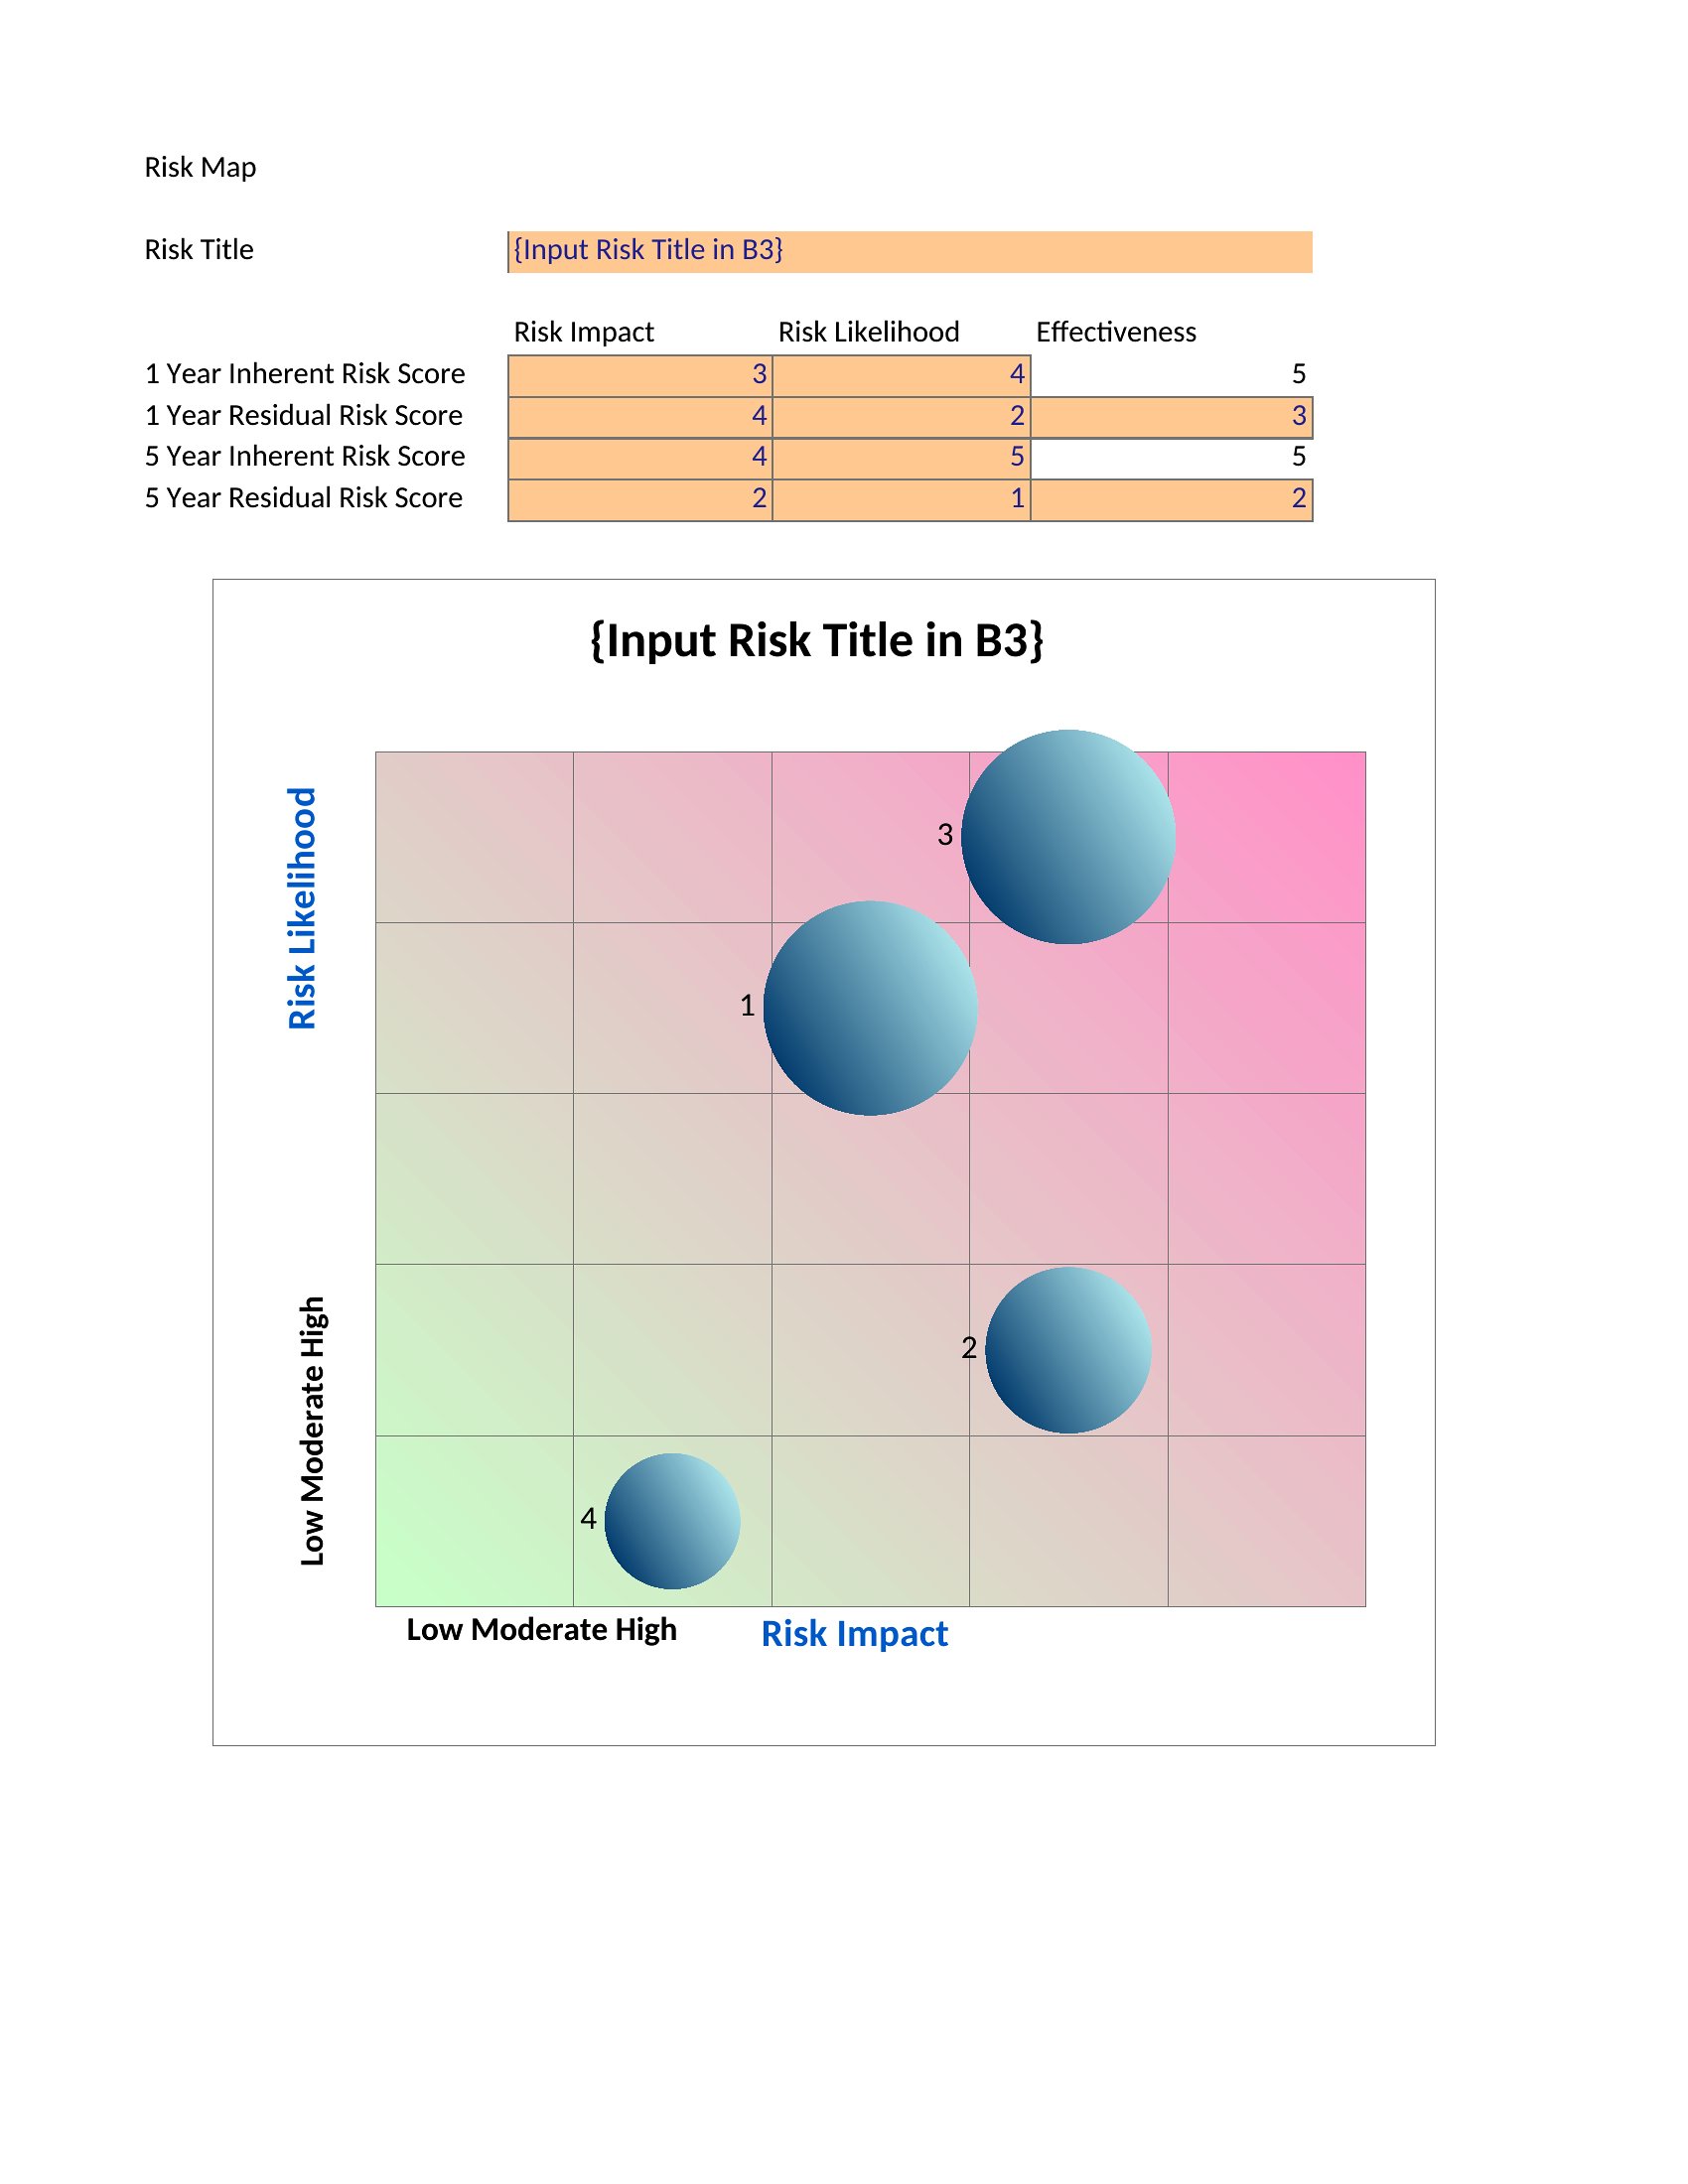
Risk Matrix
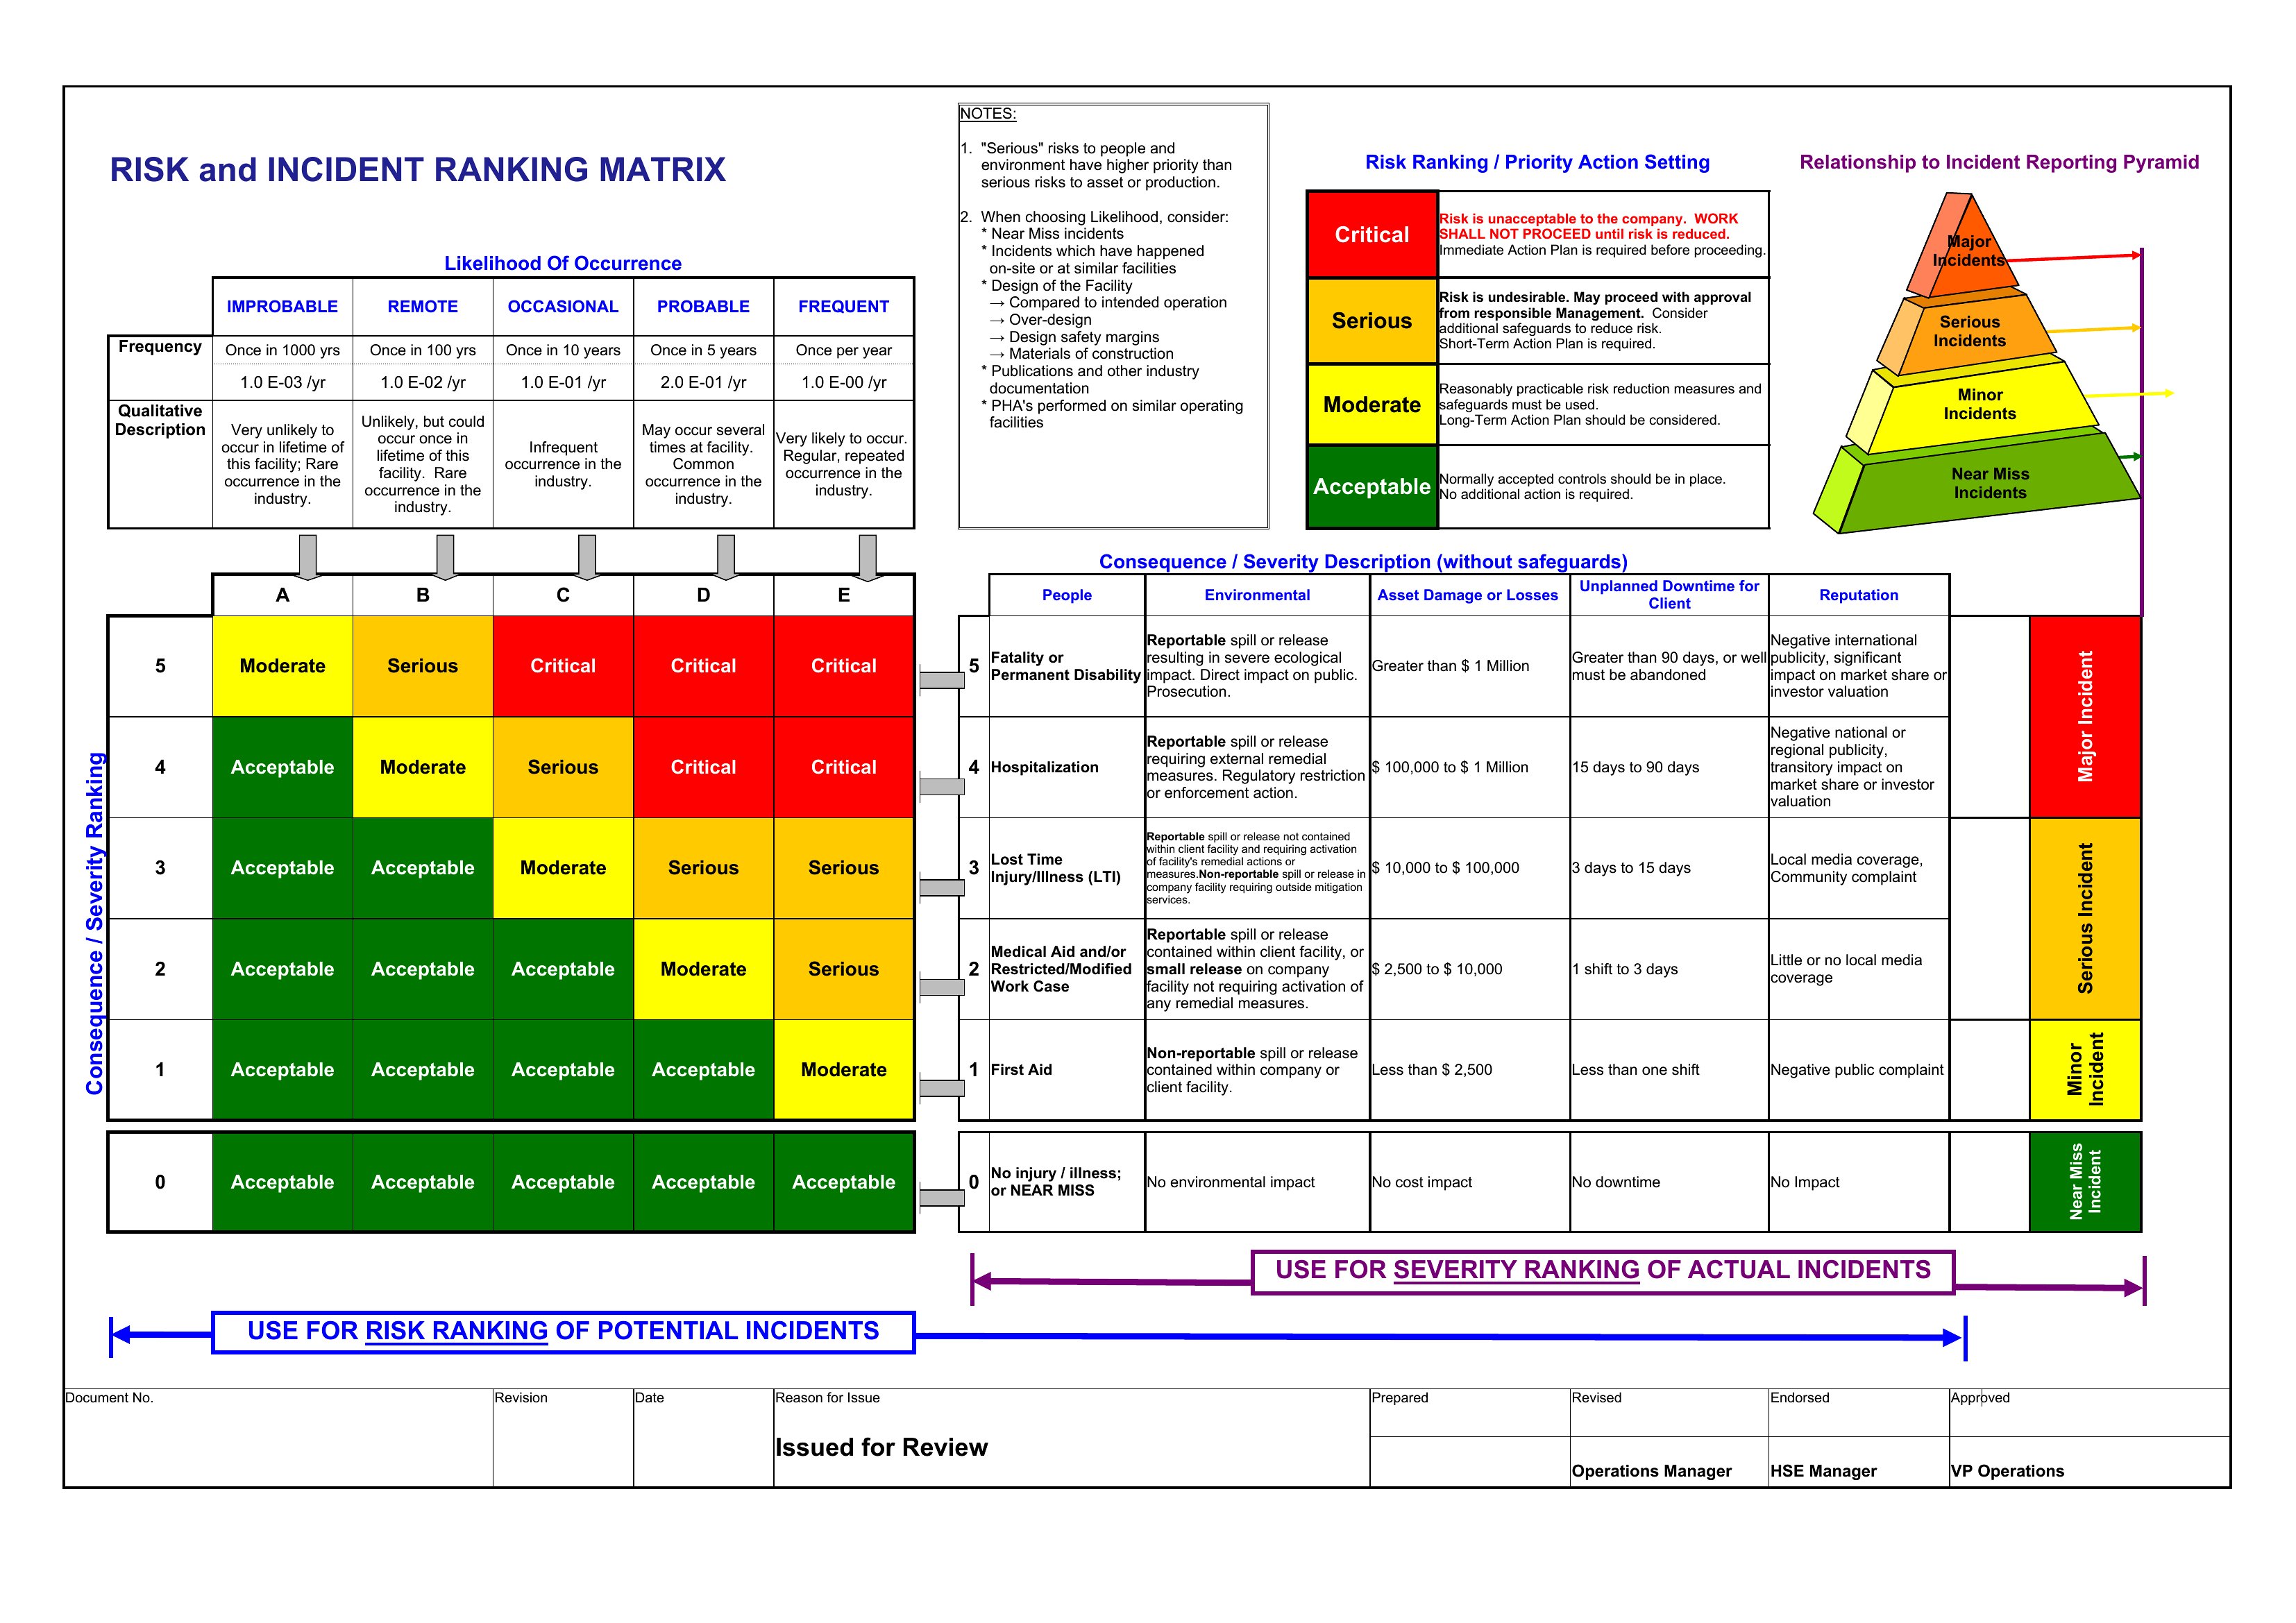
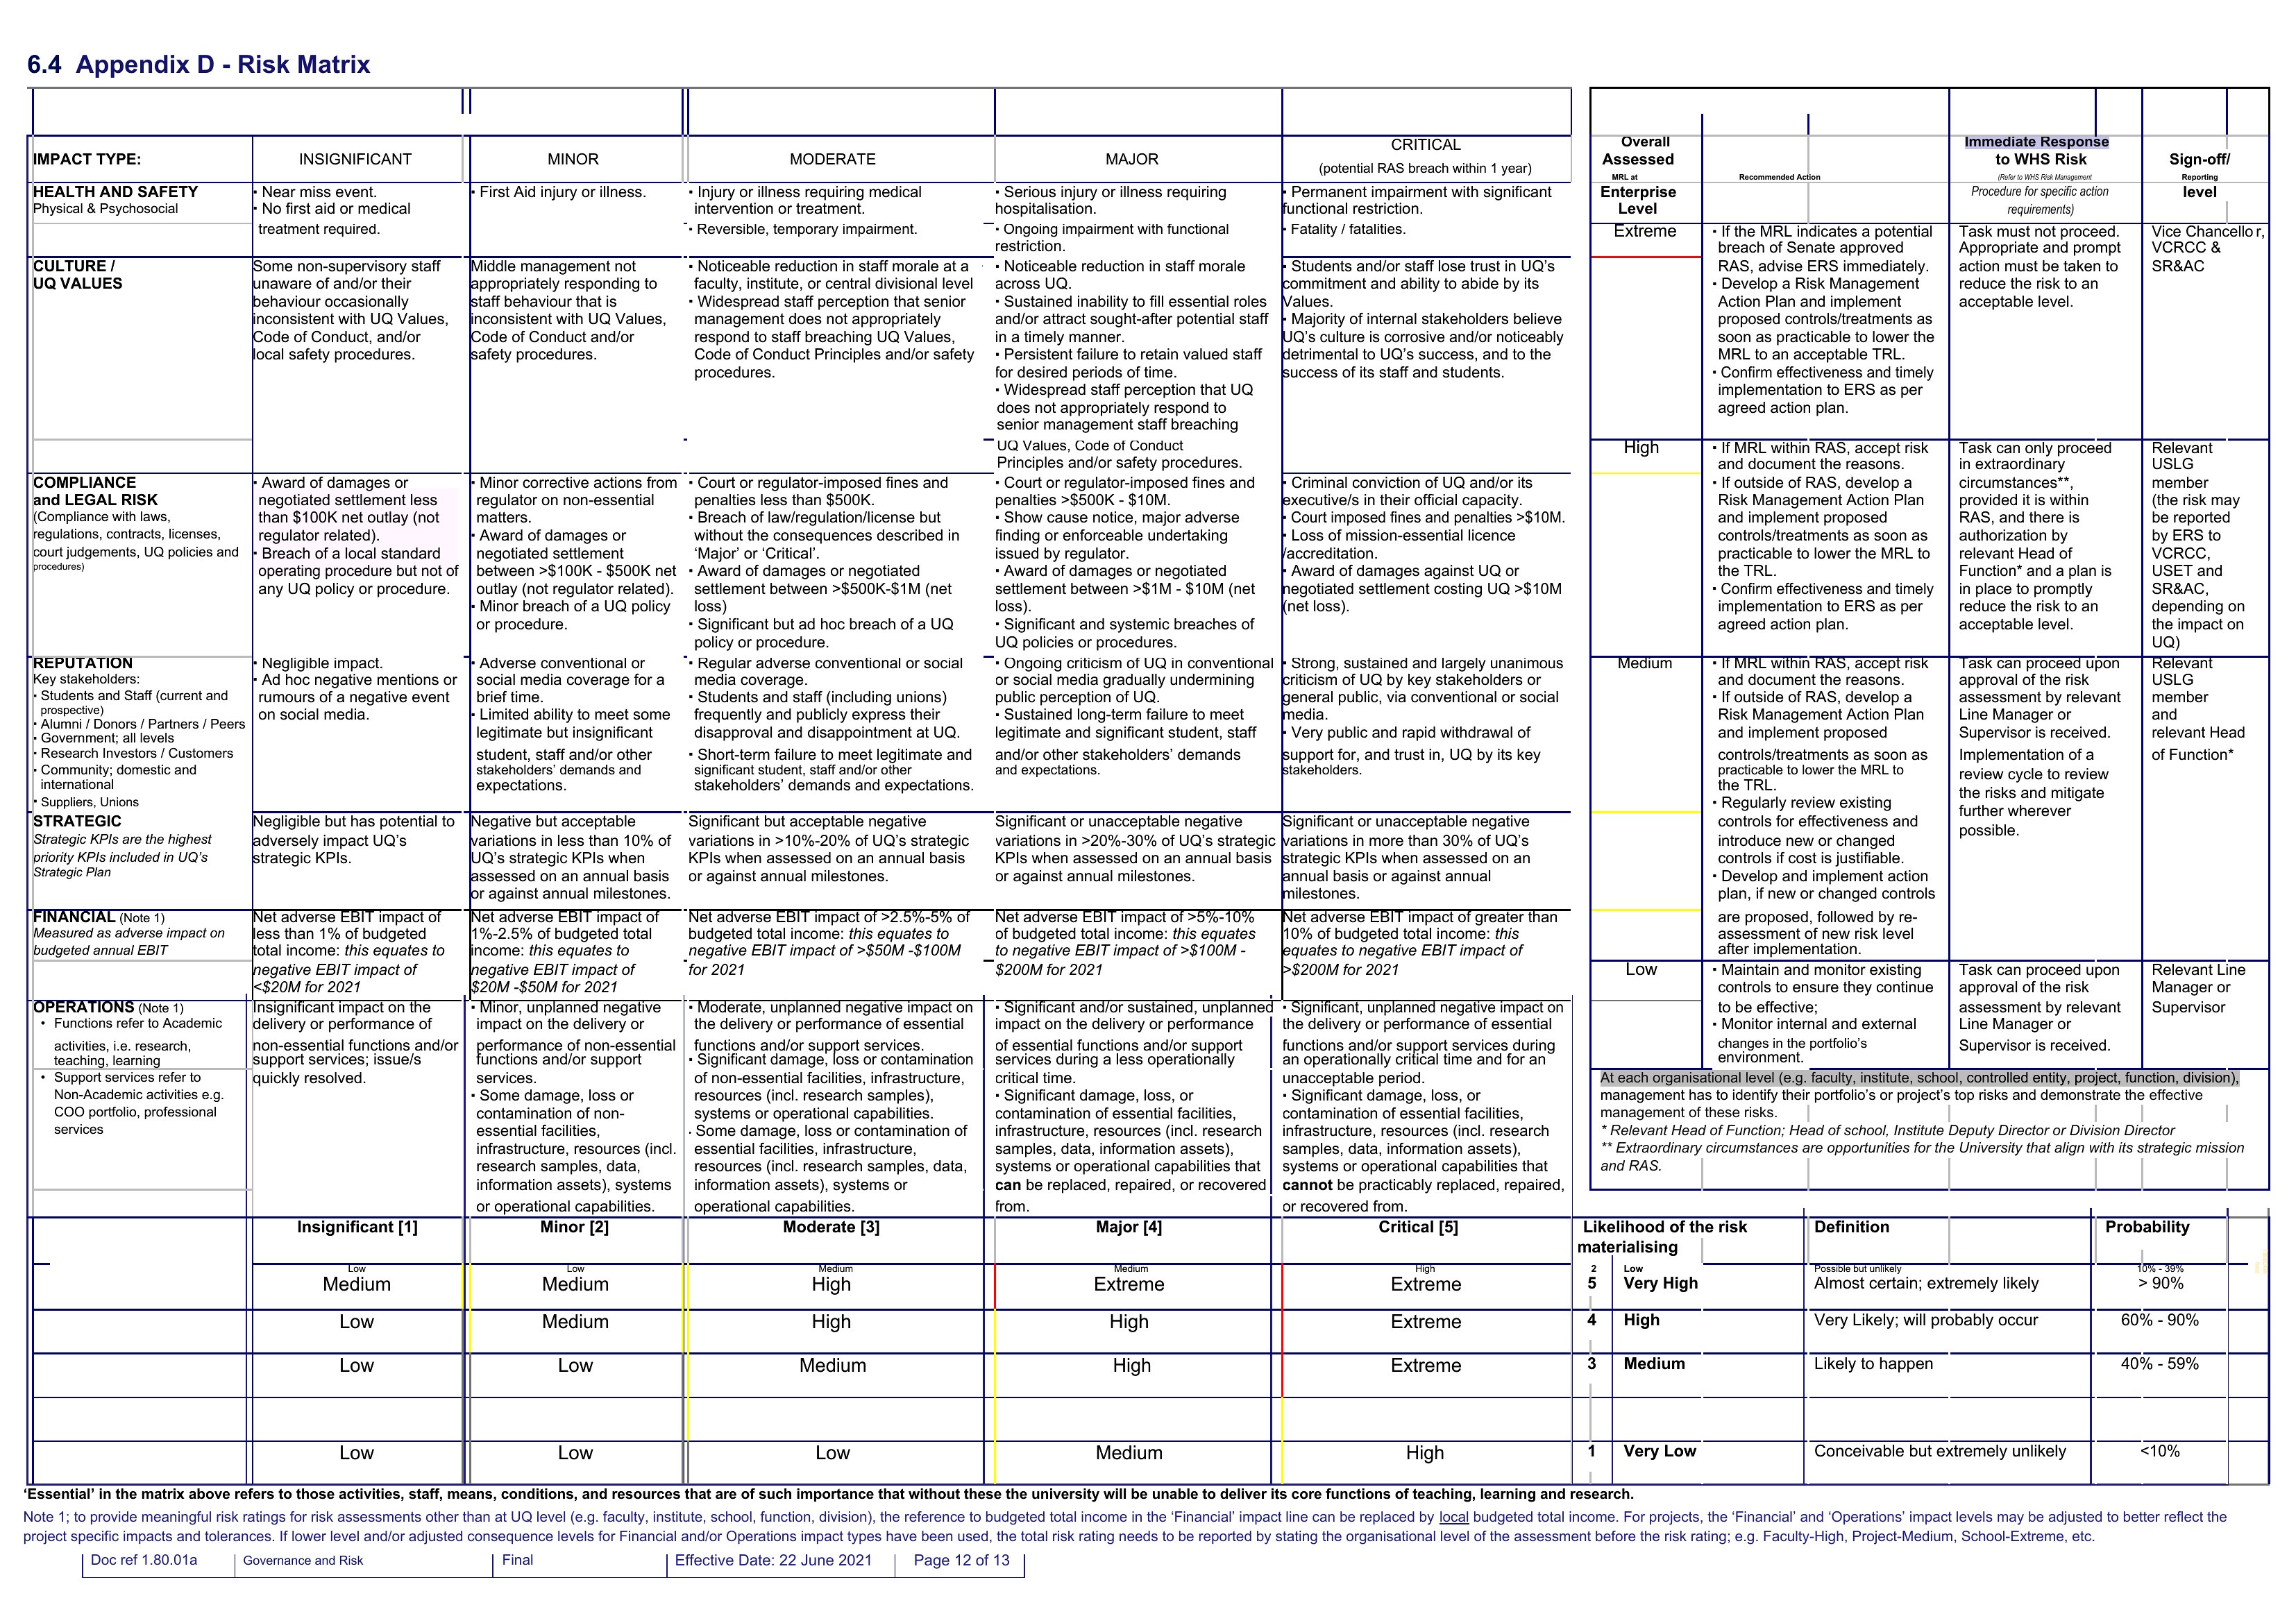
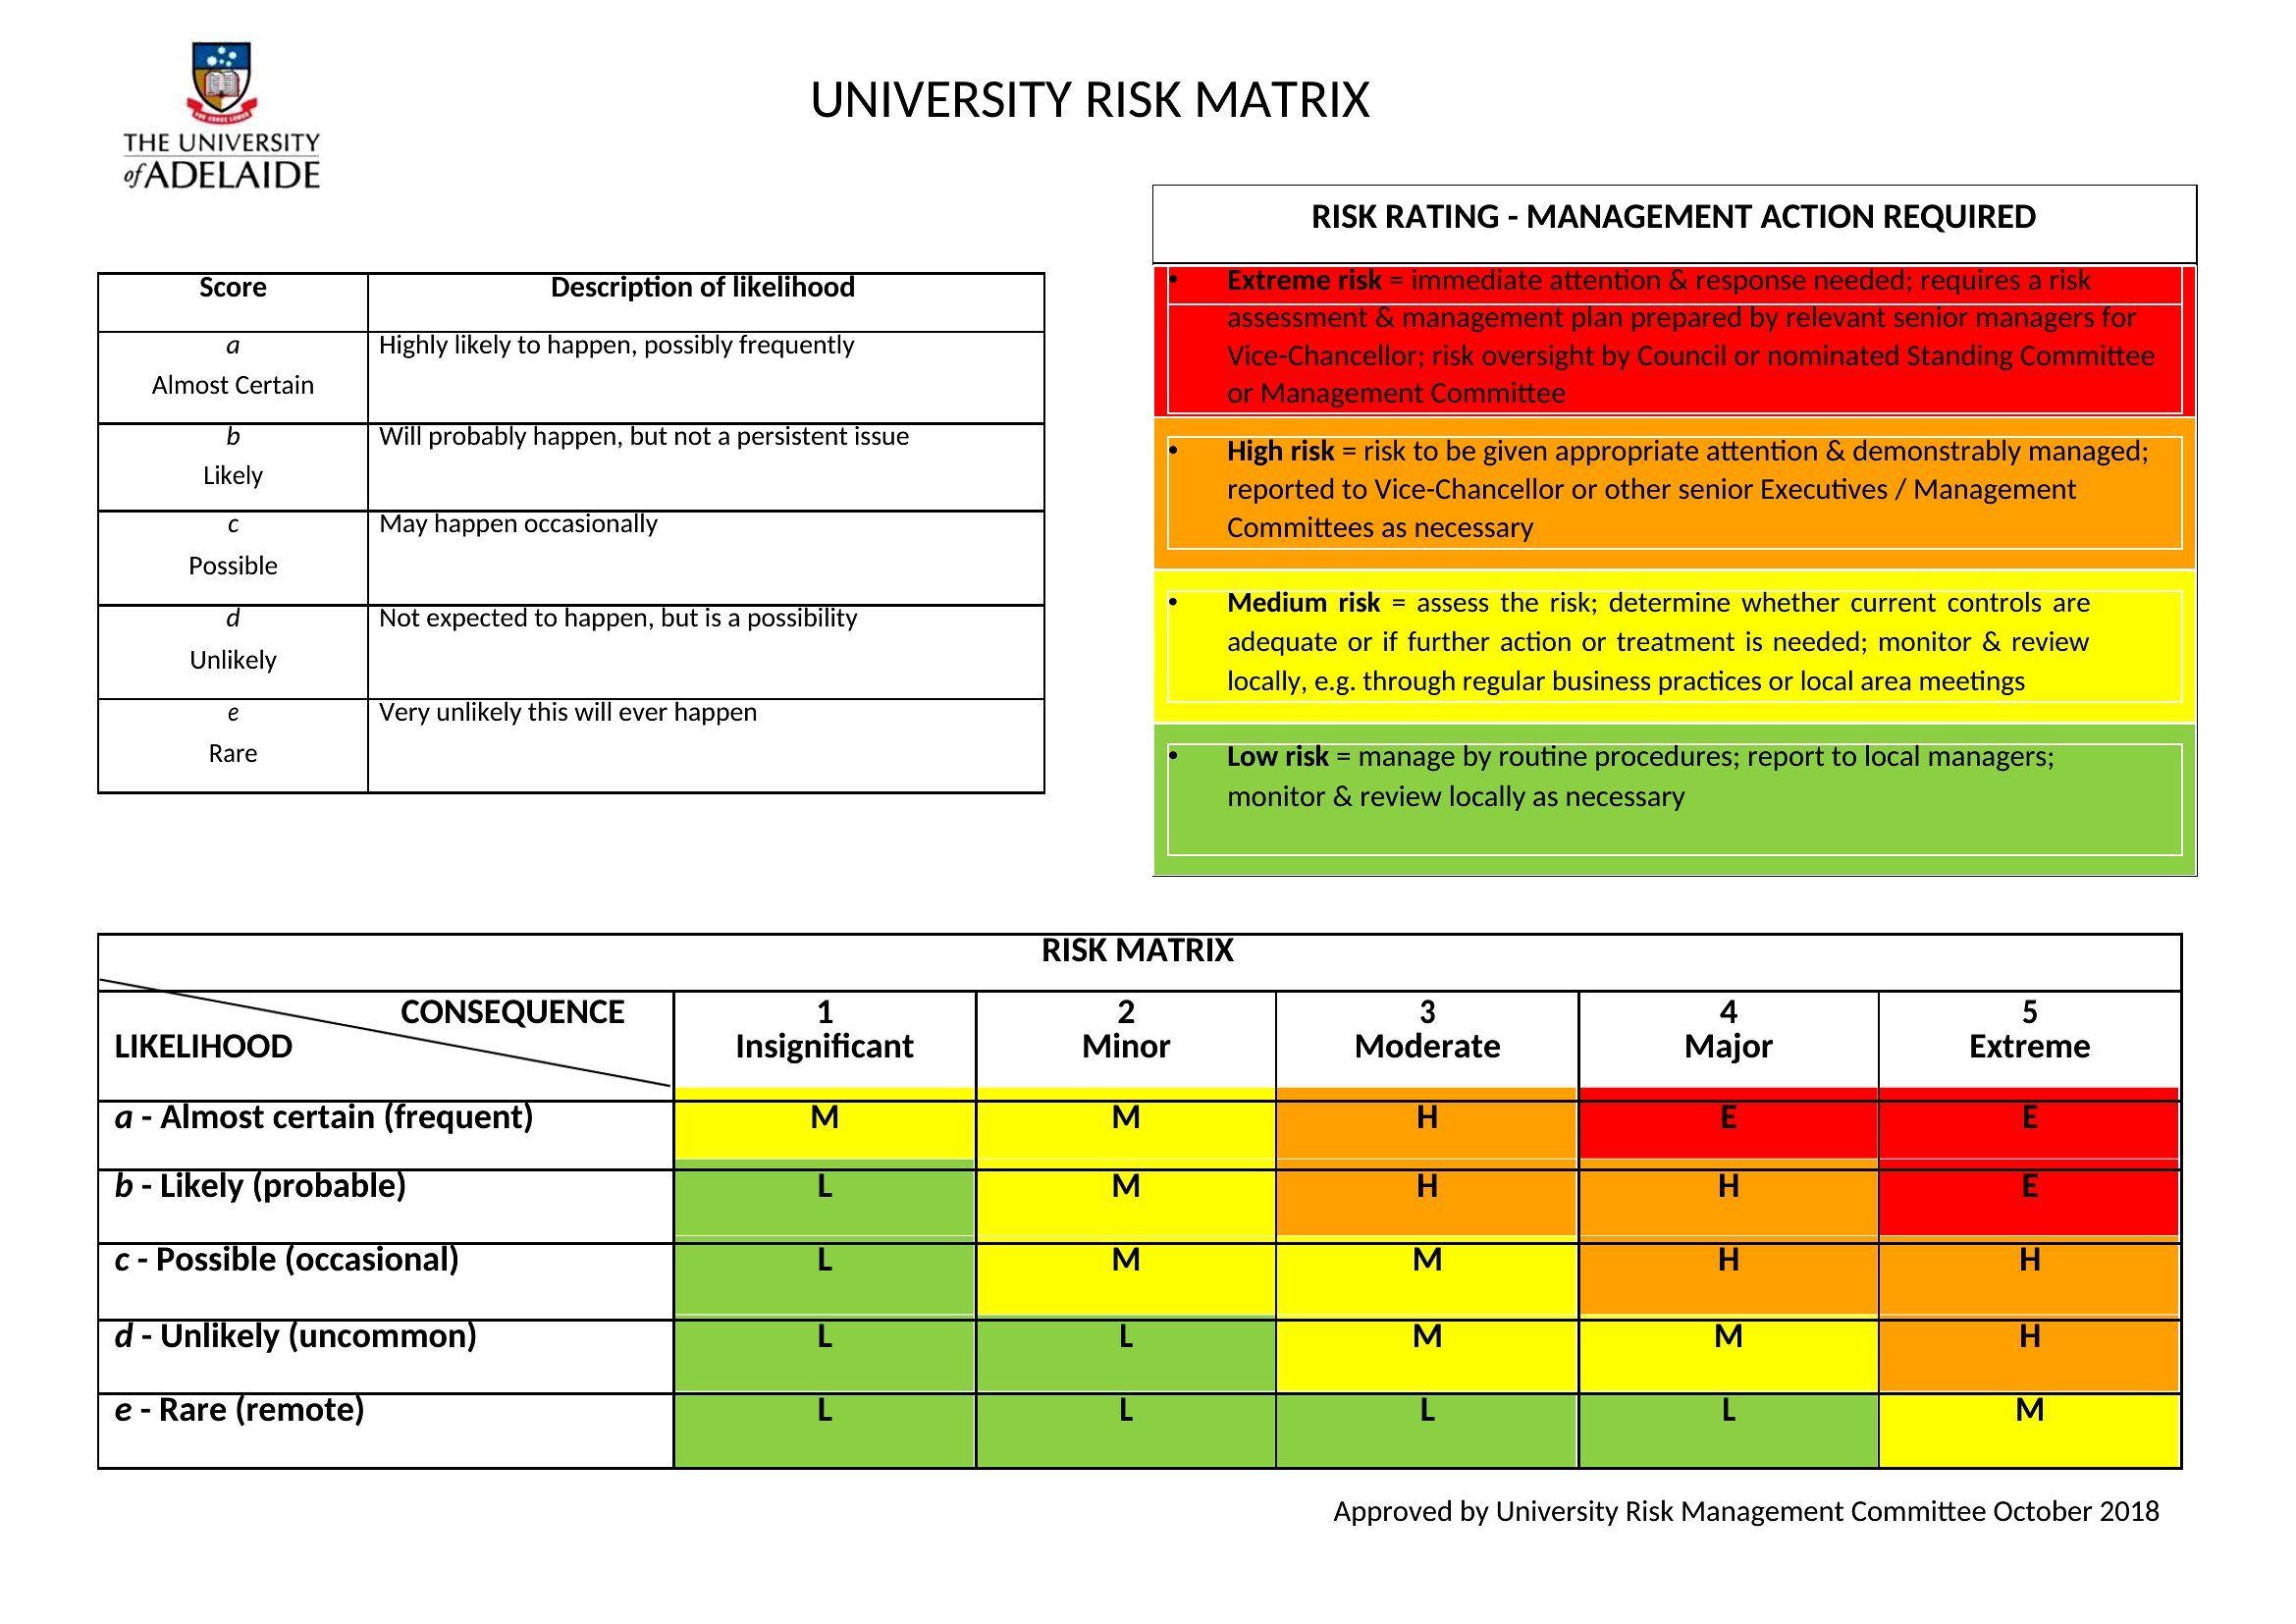
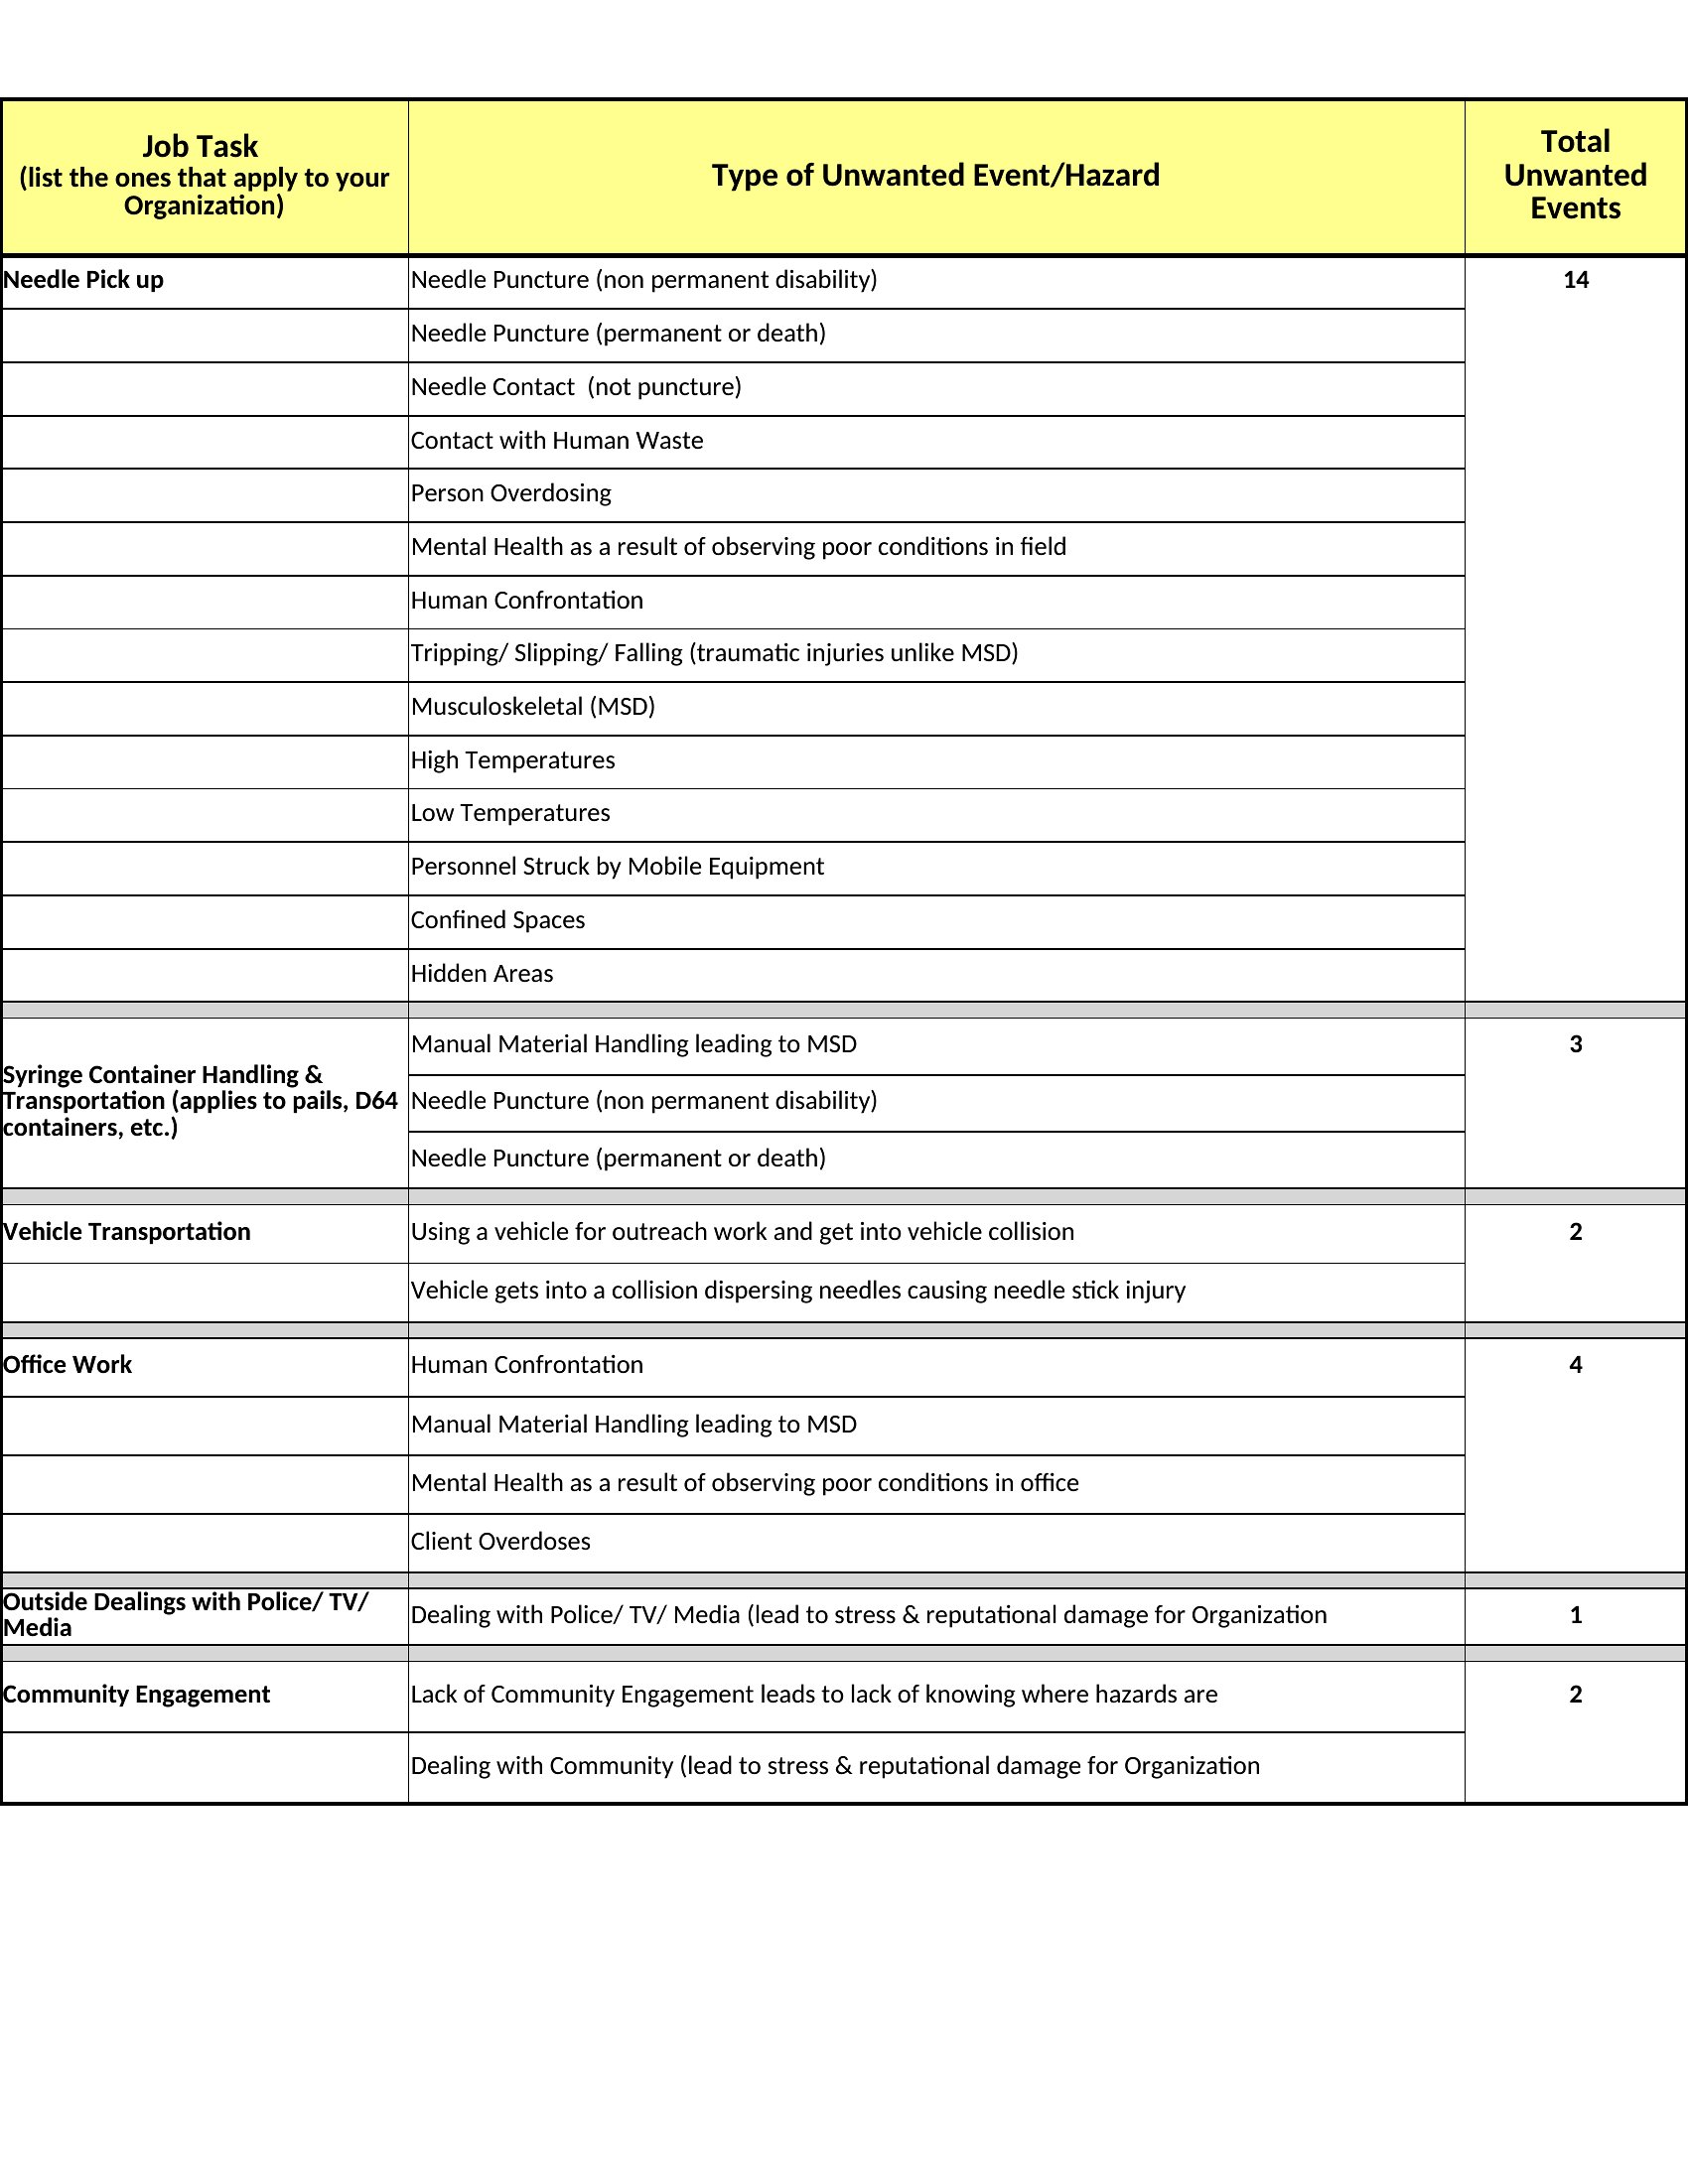
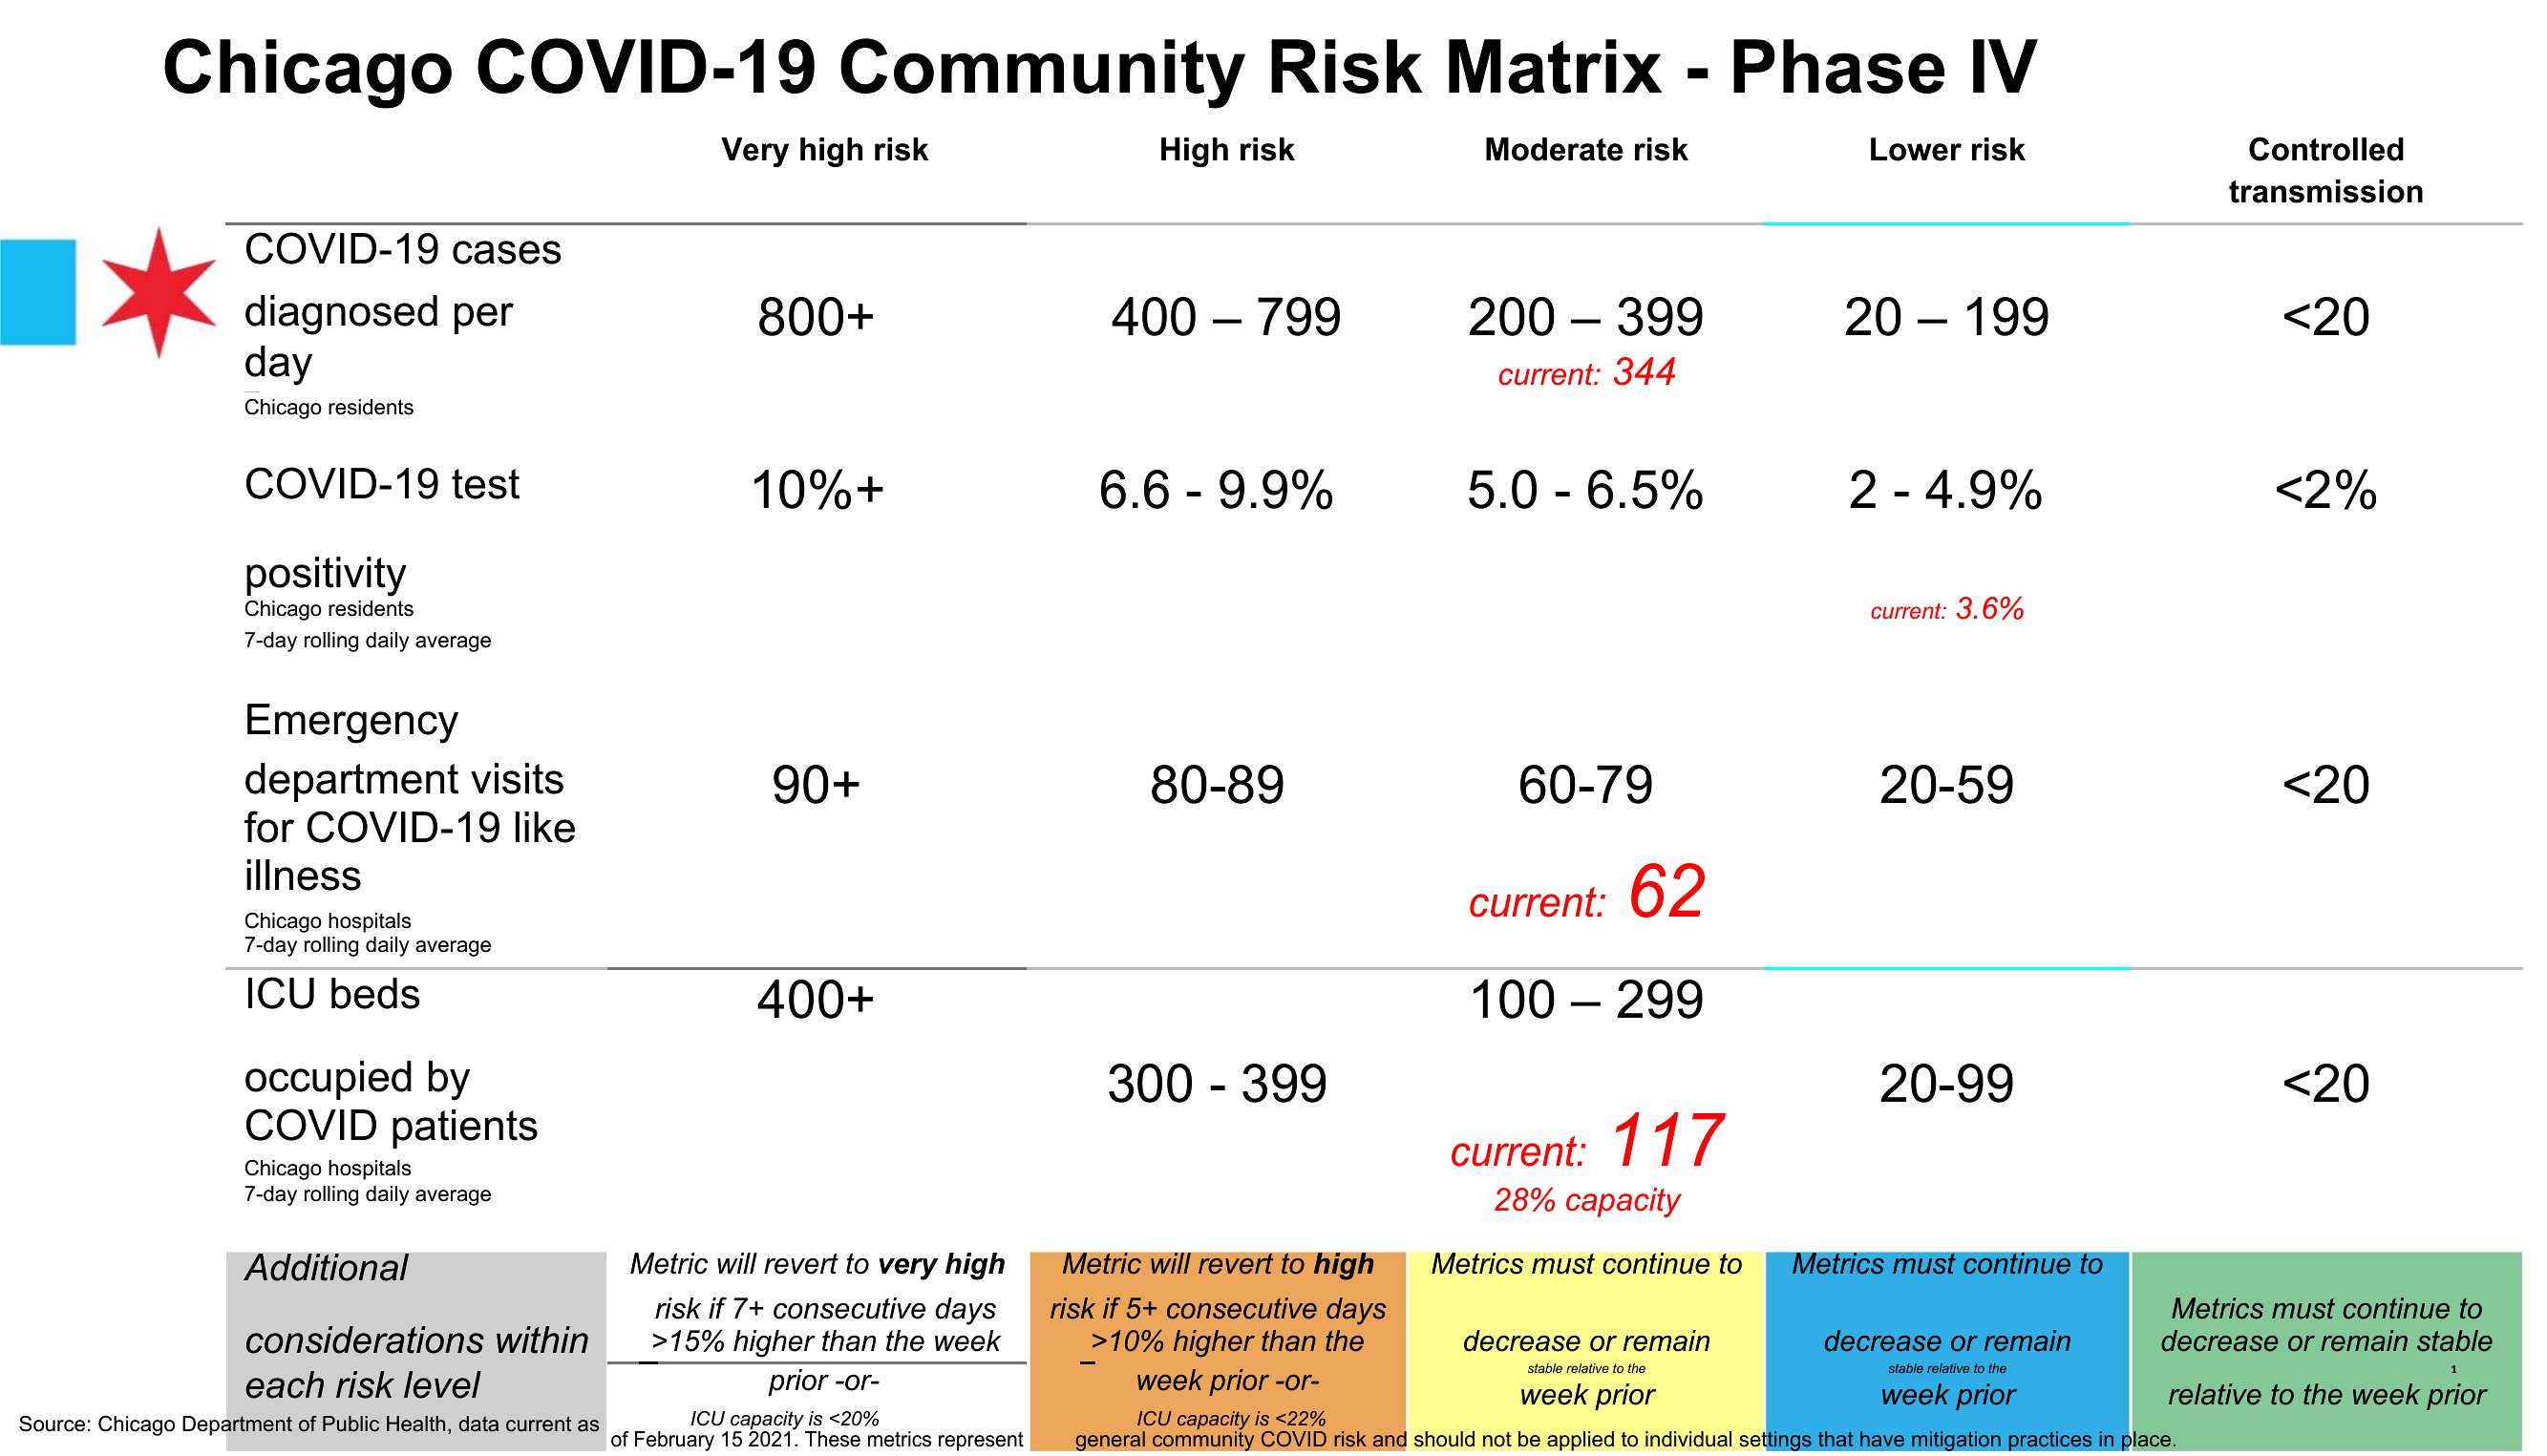
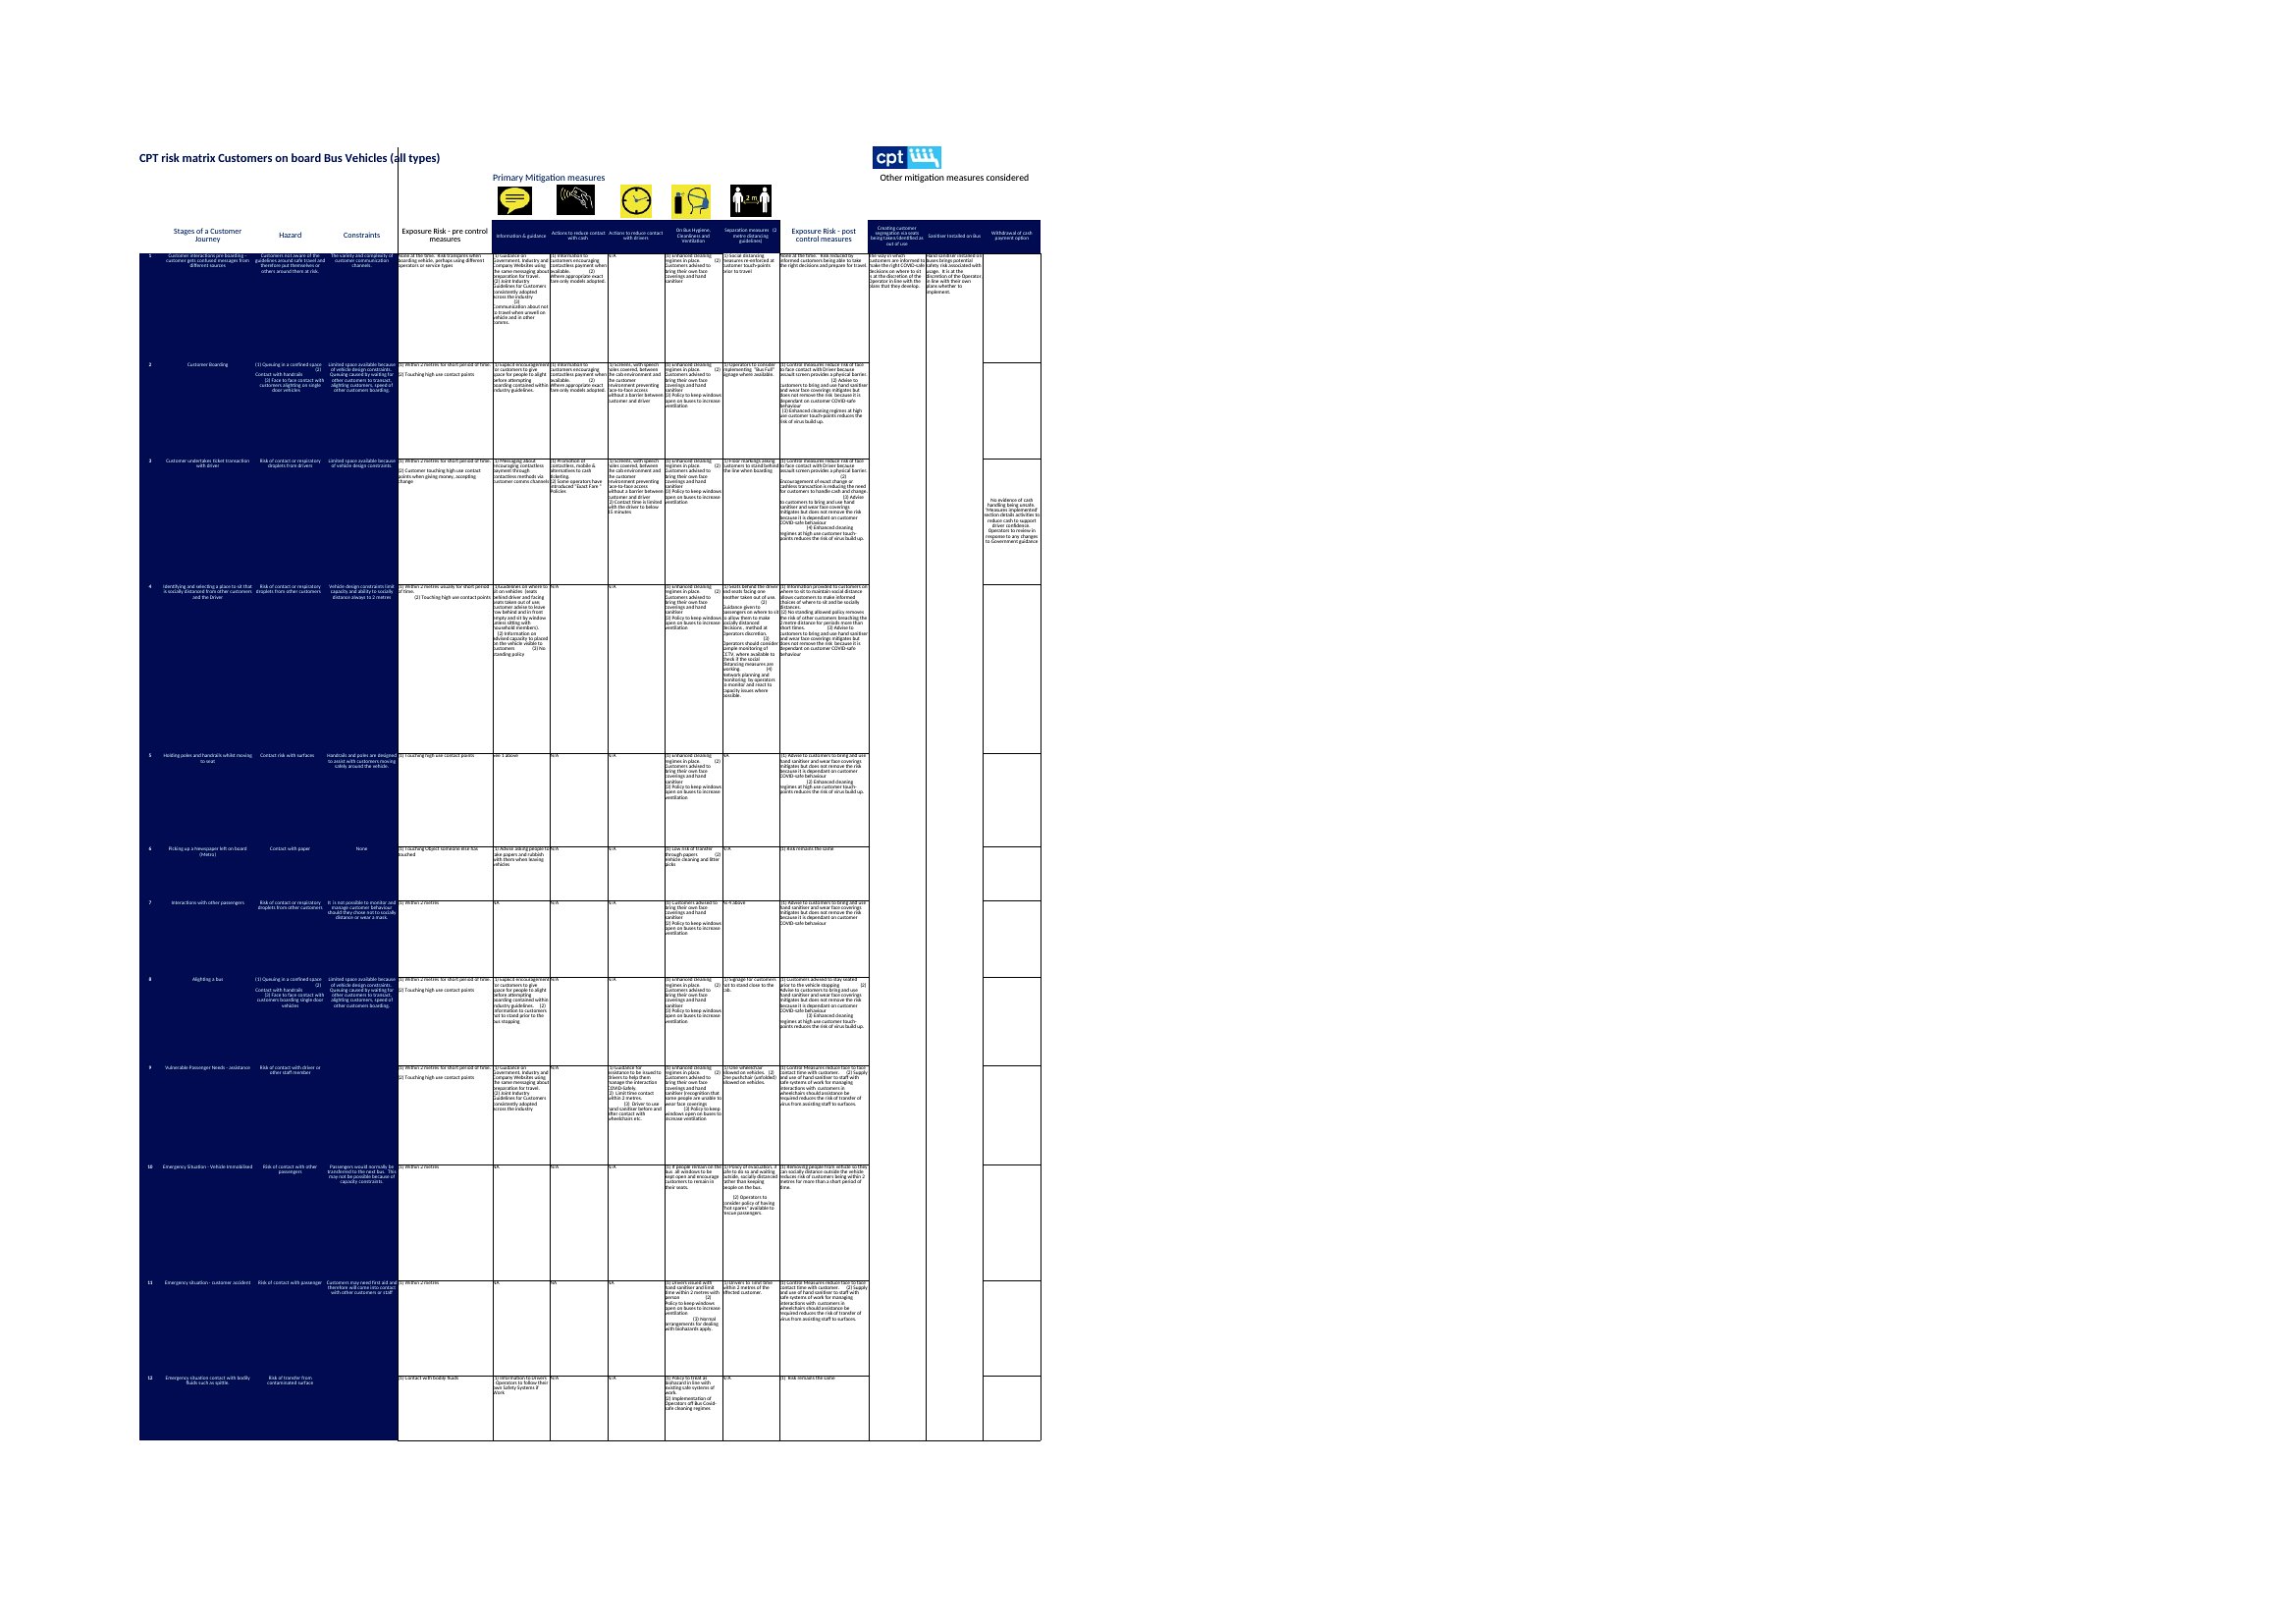
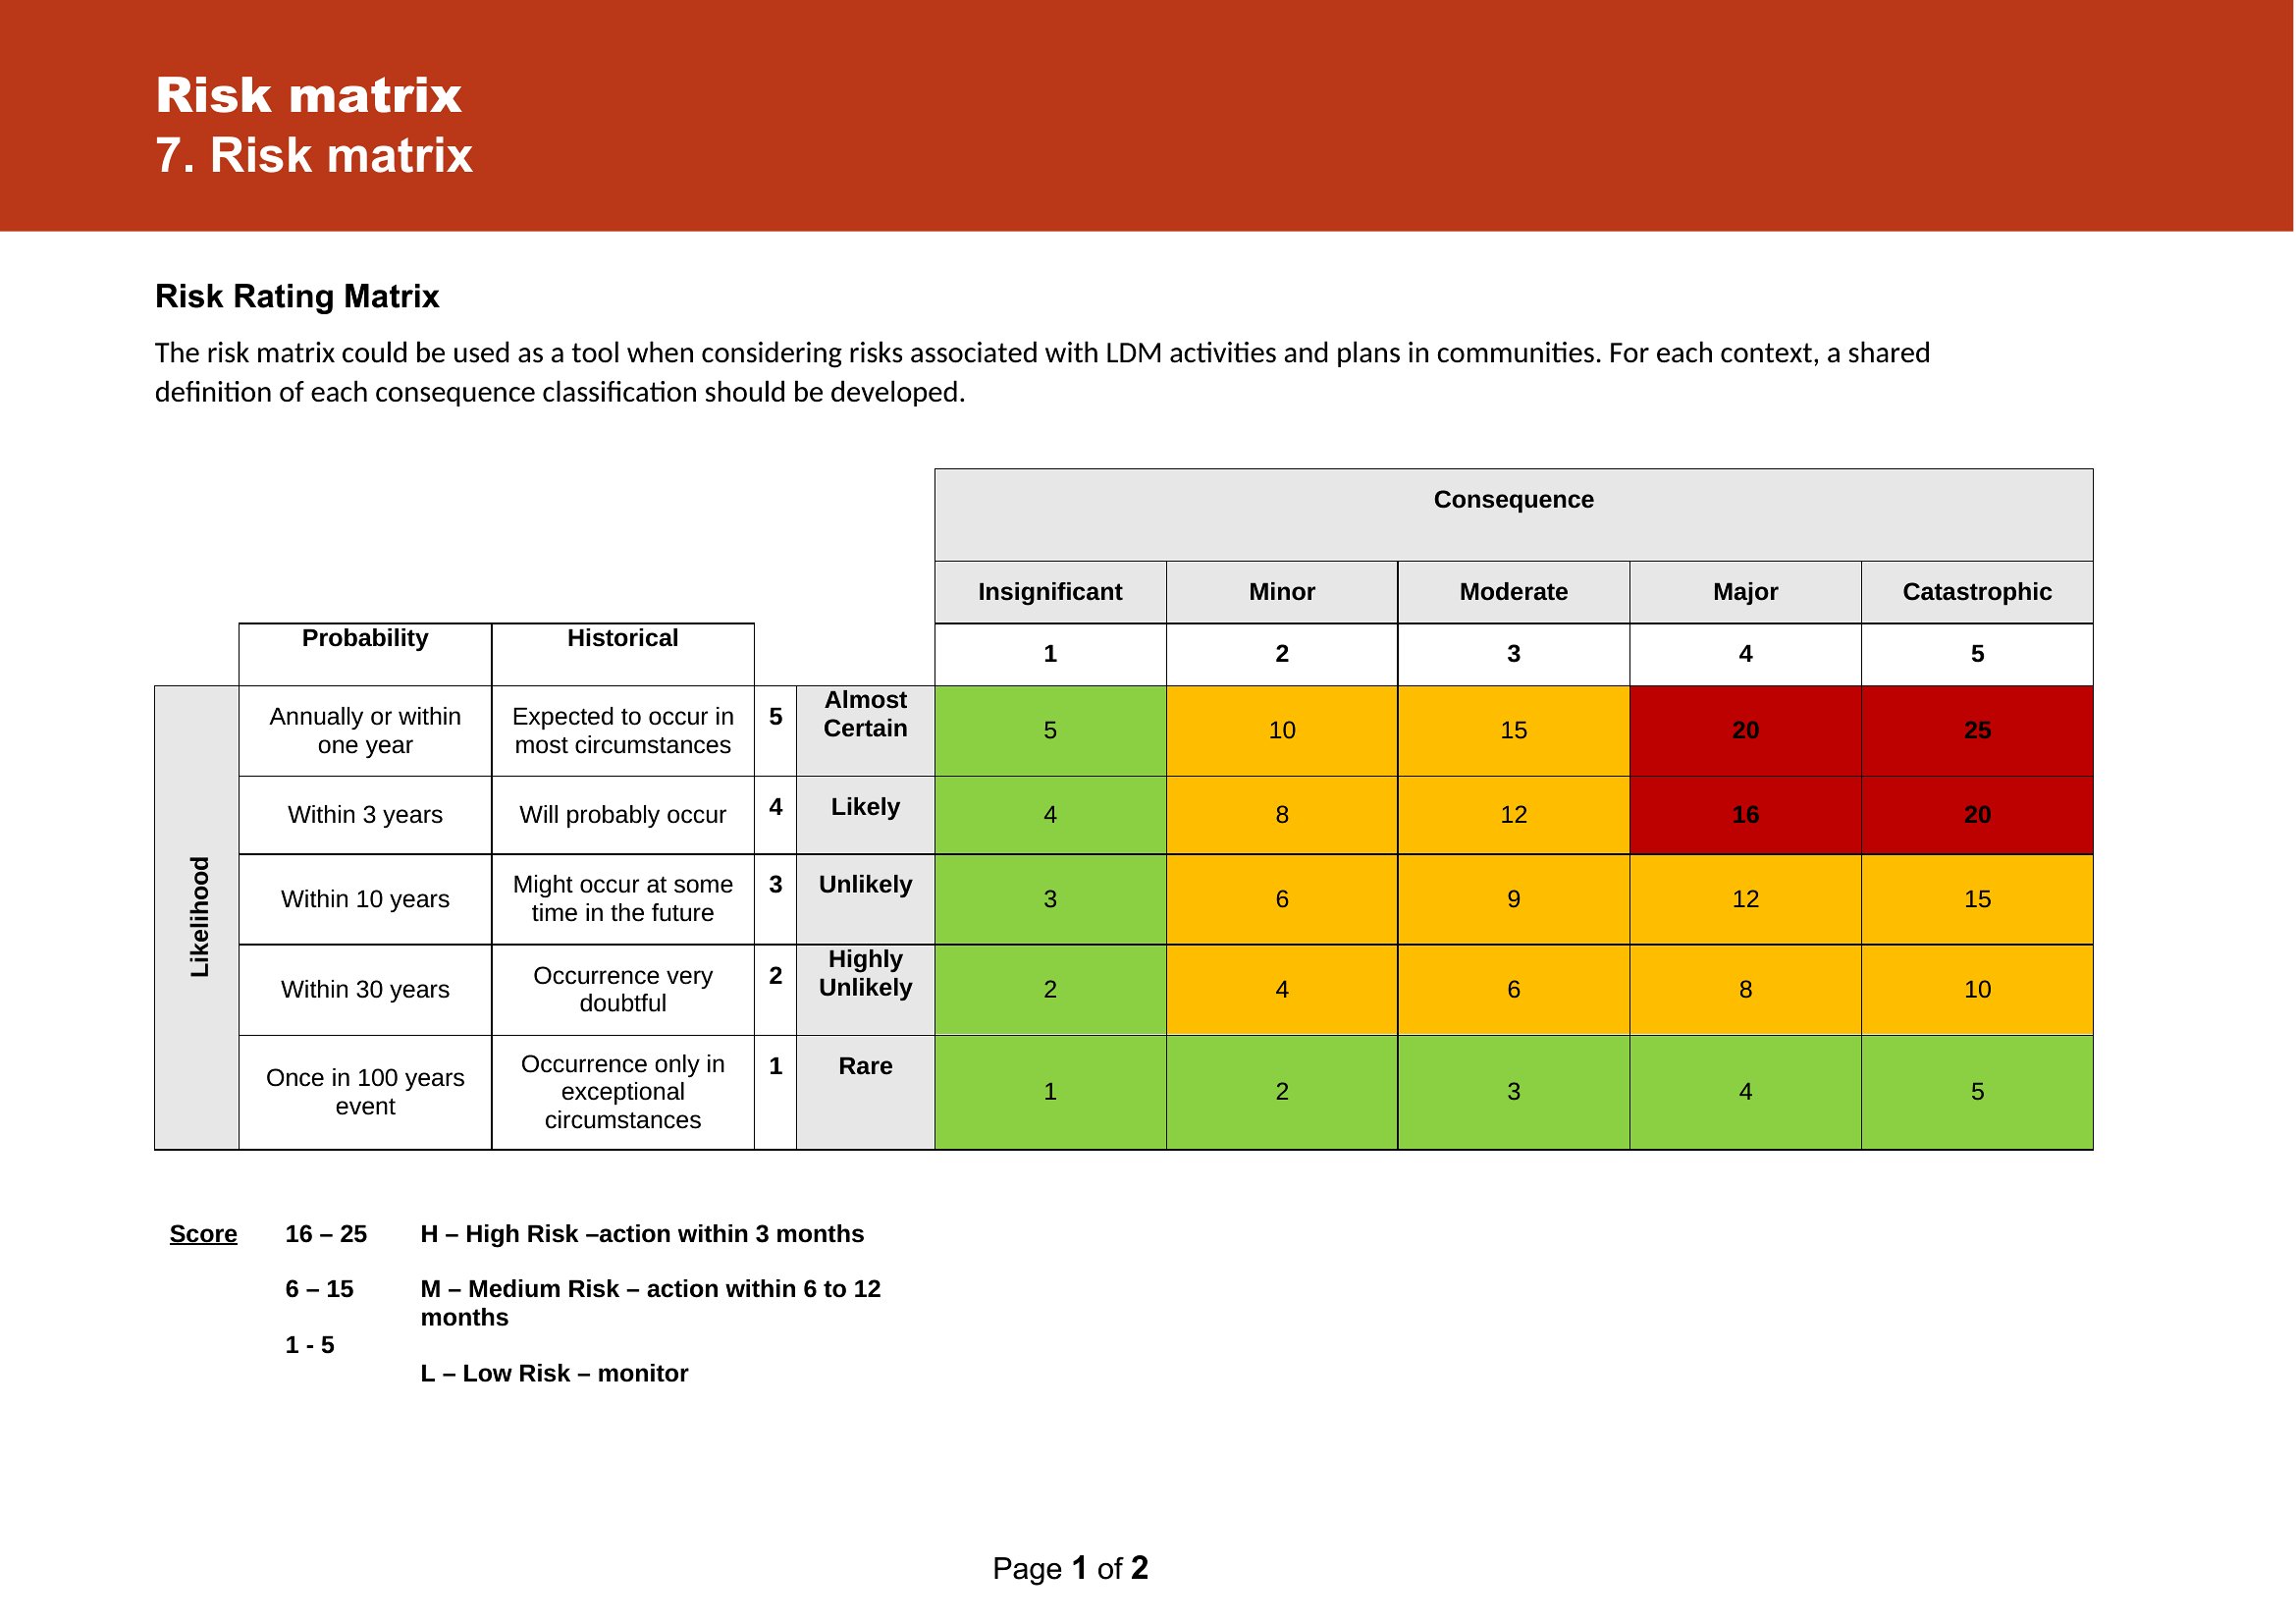
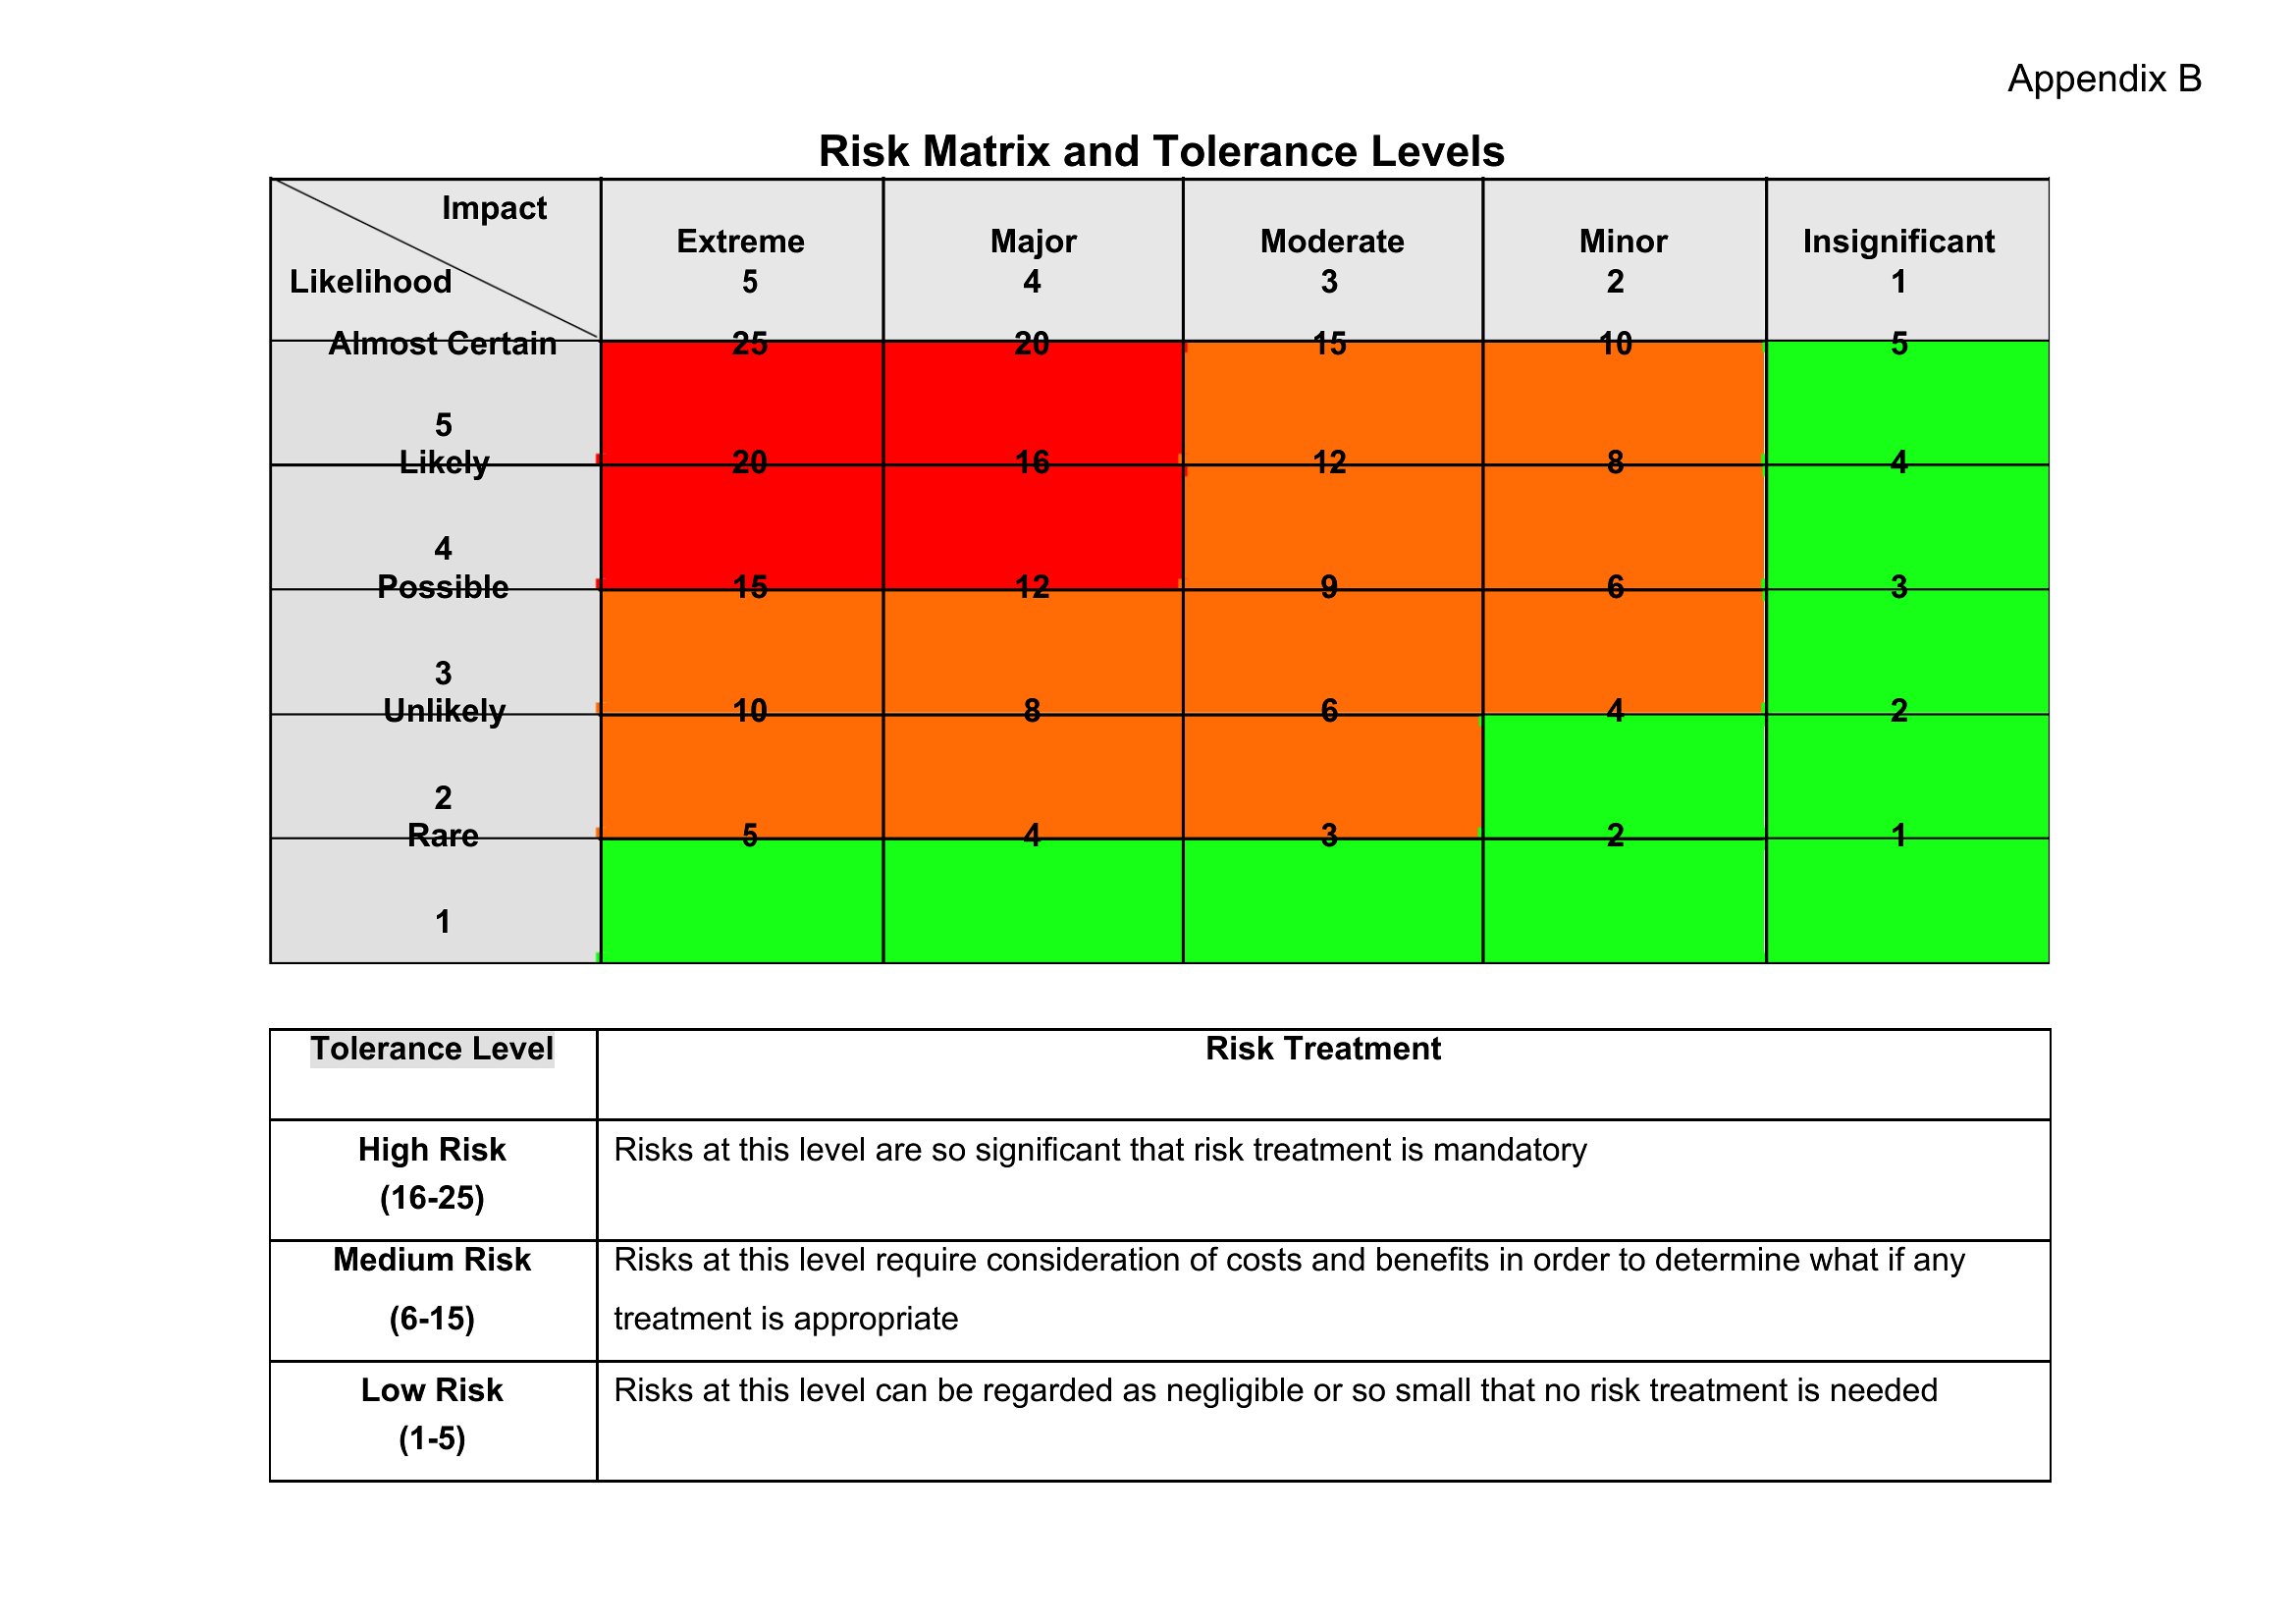
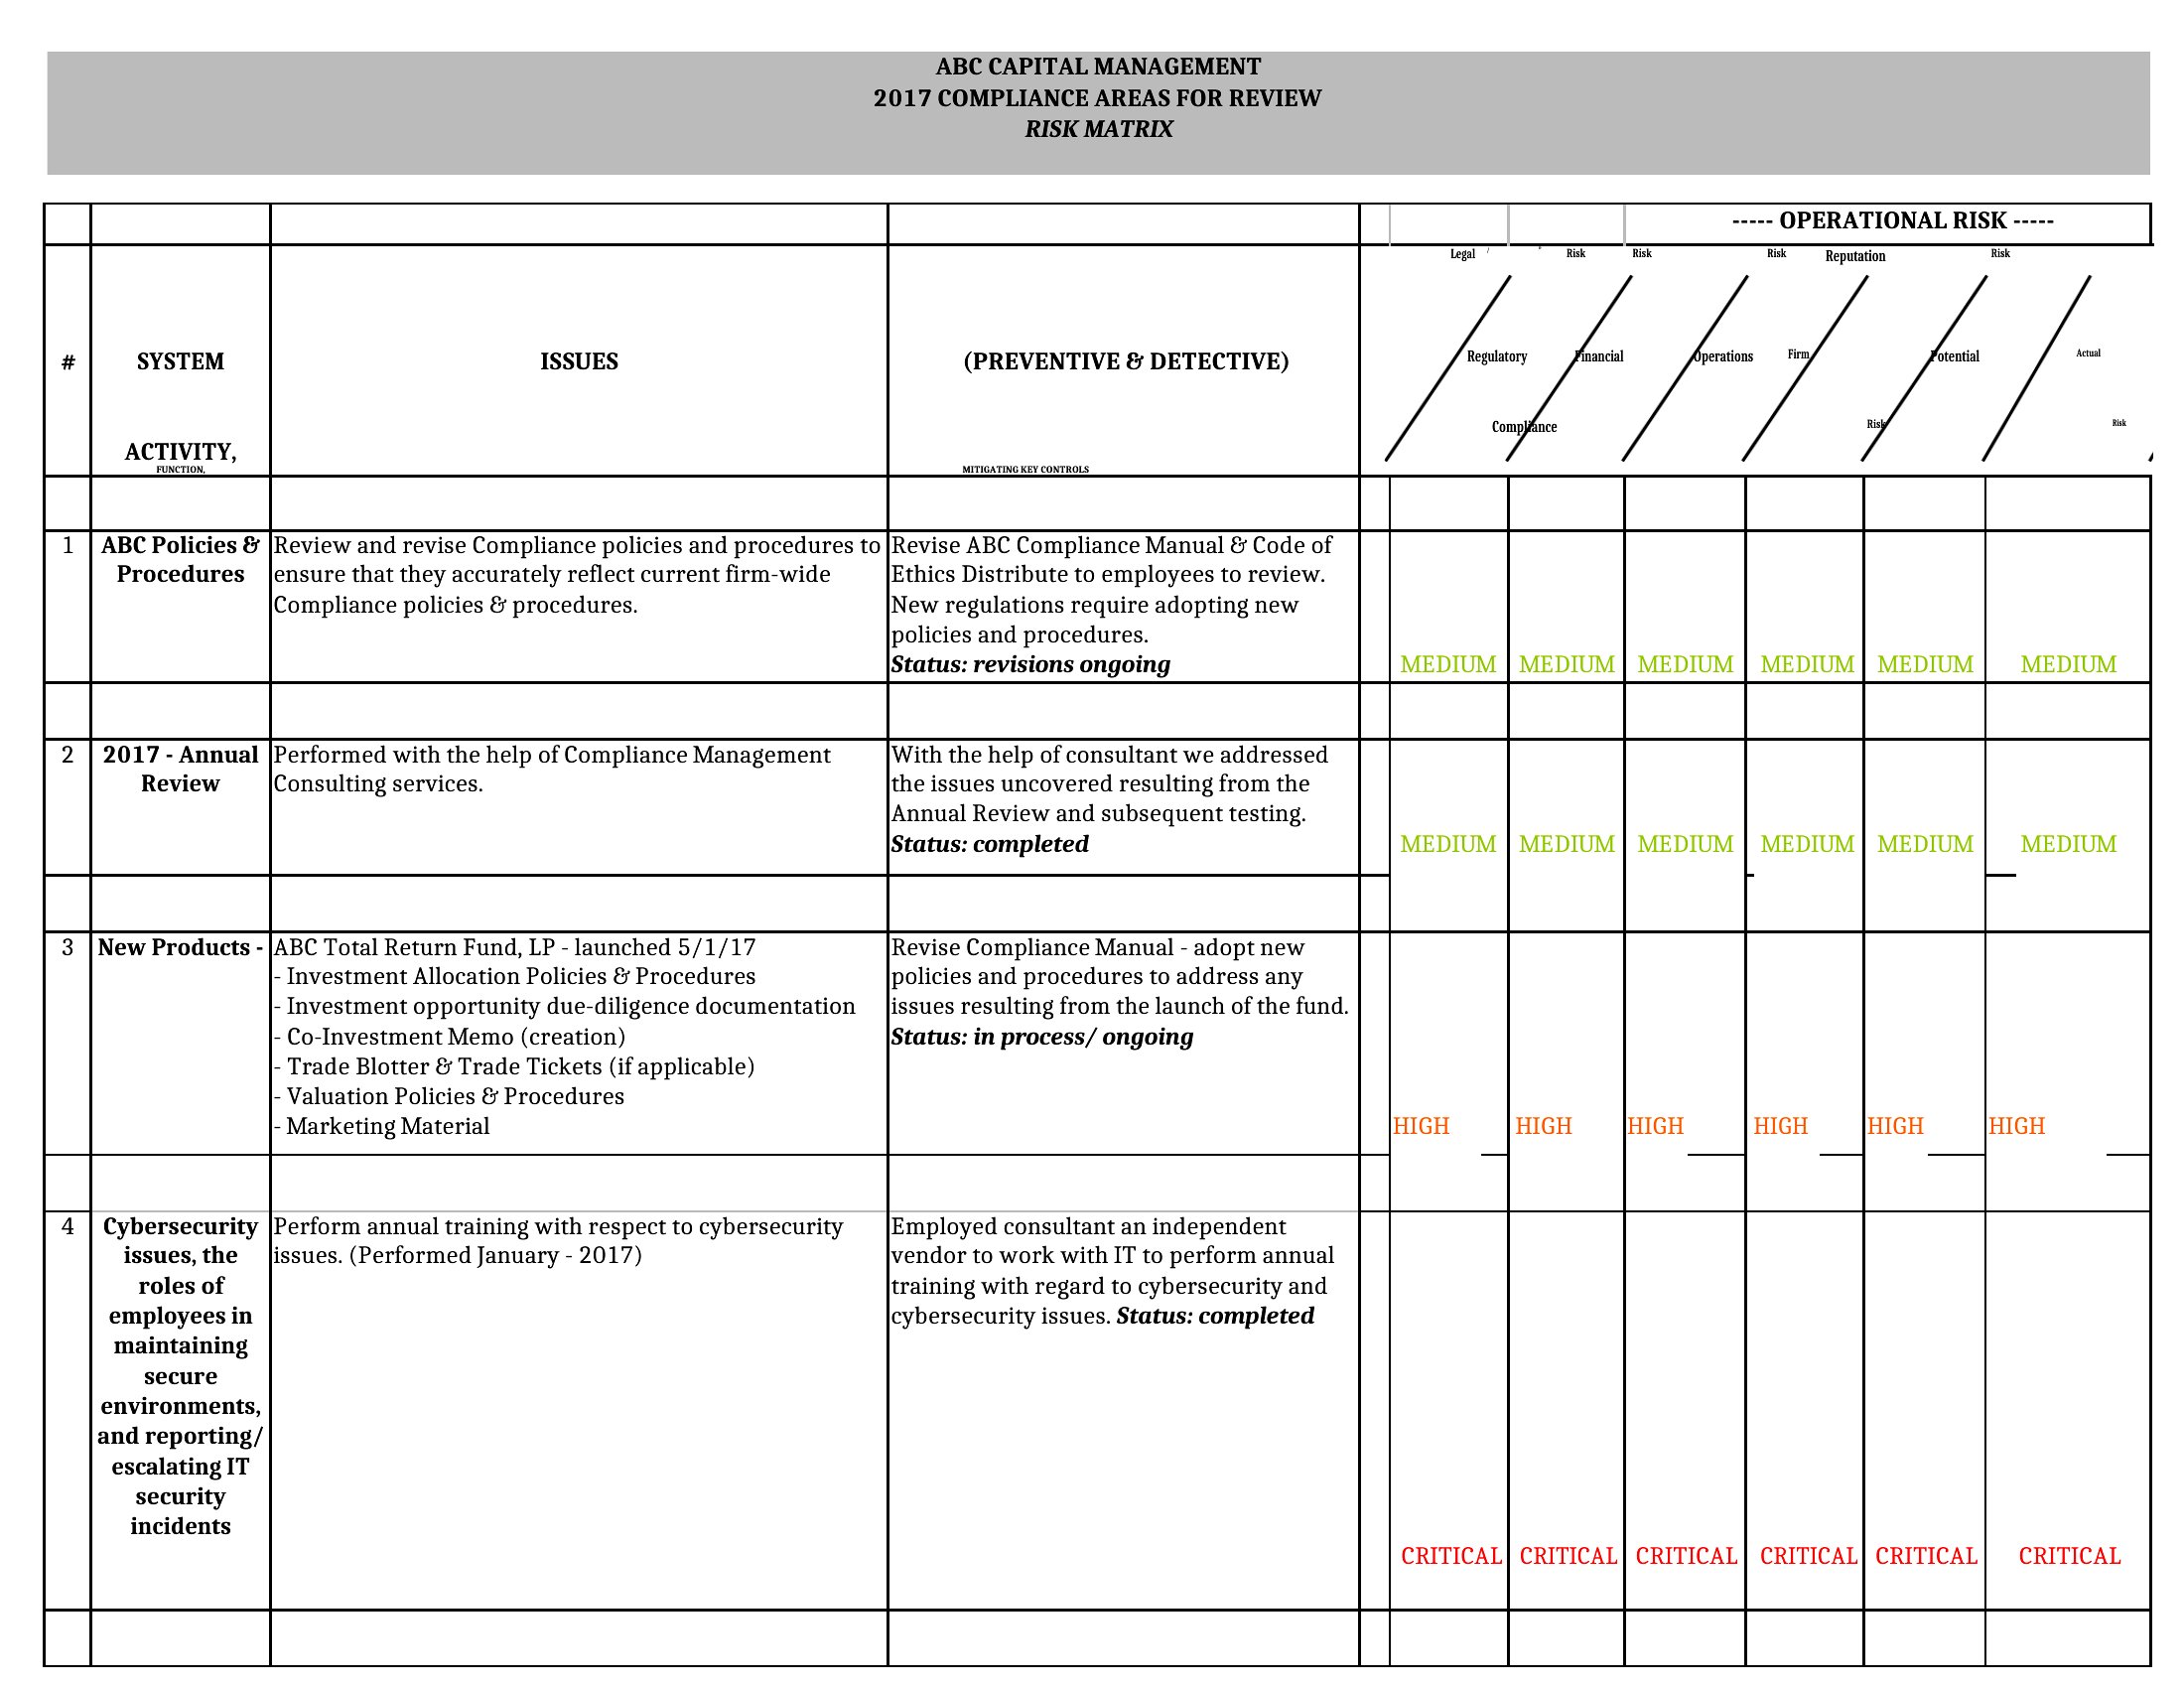
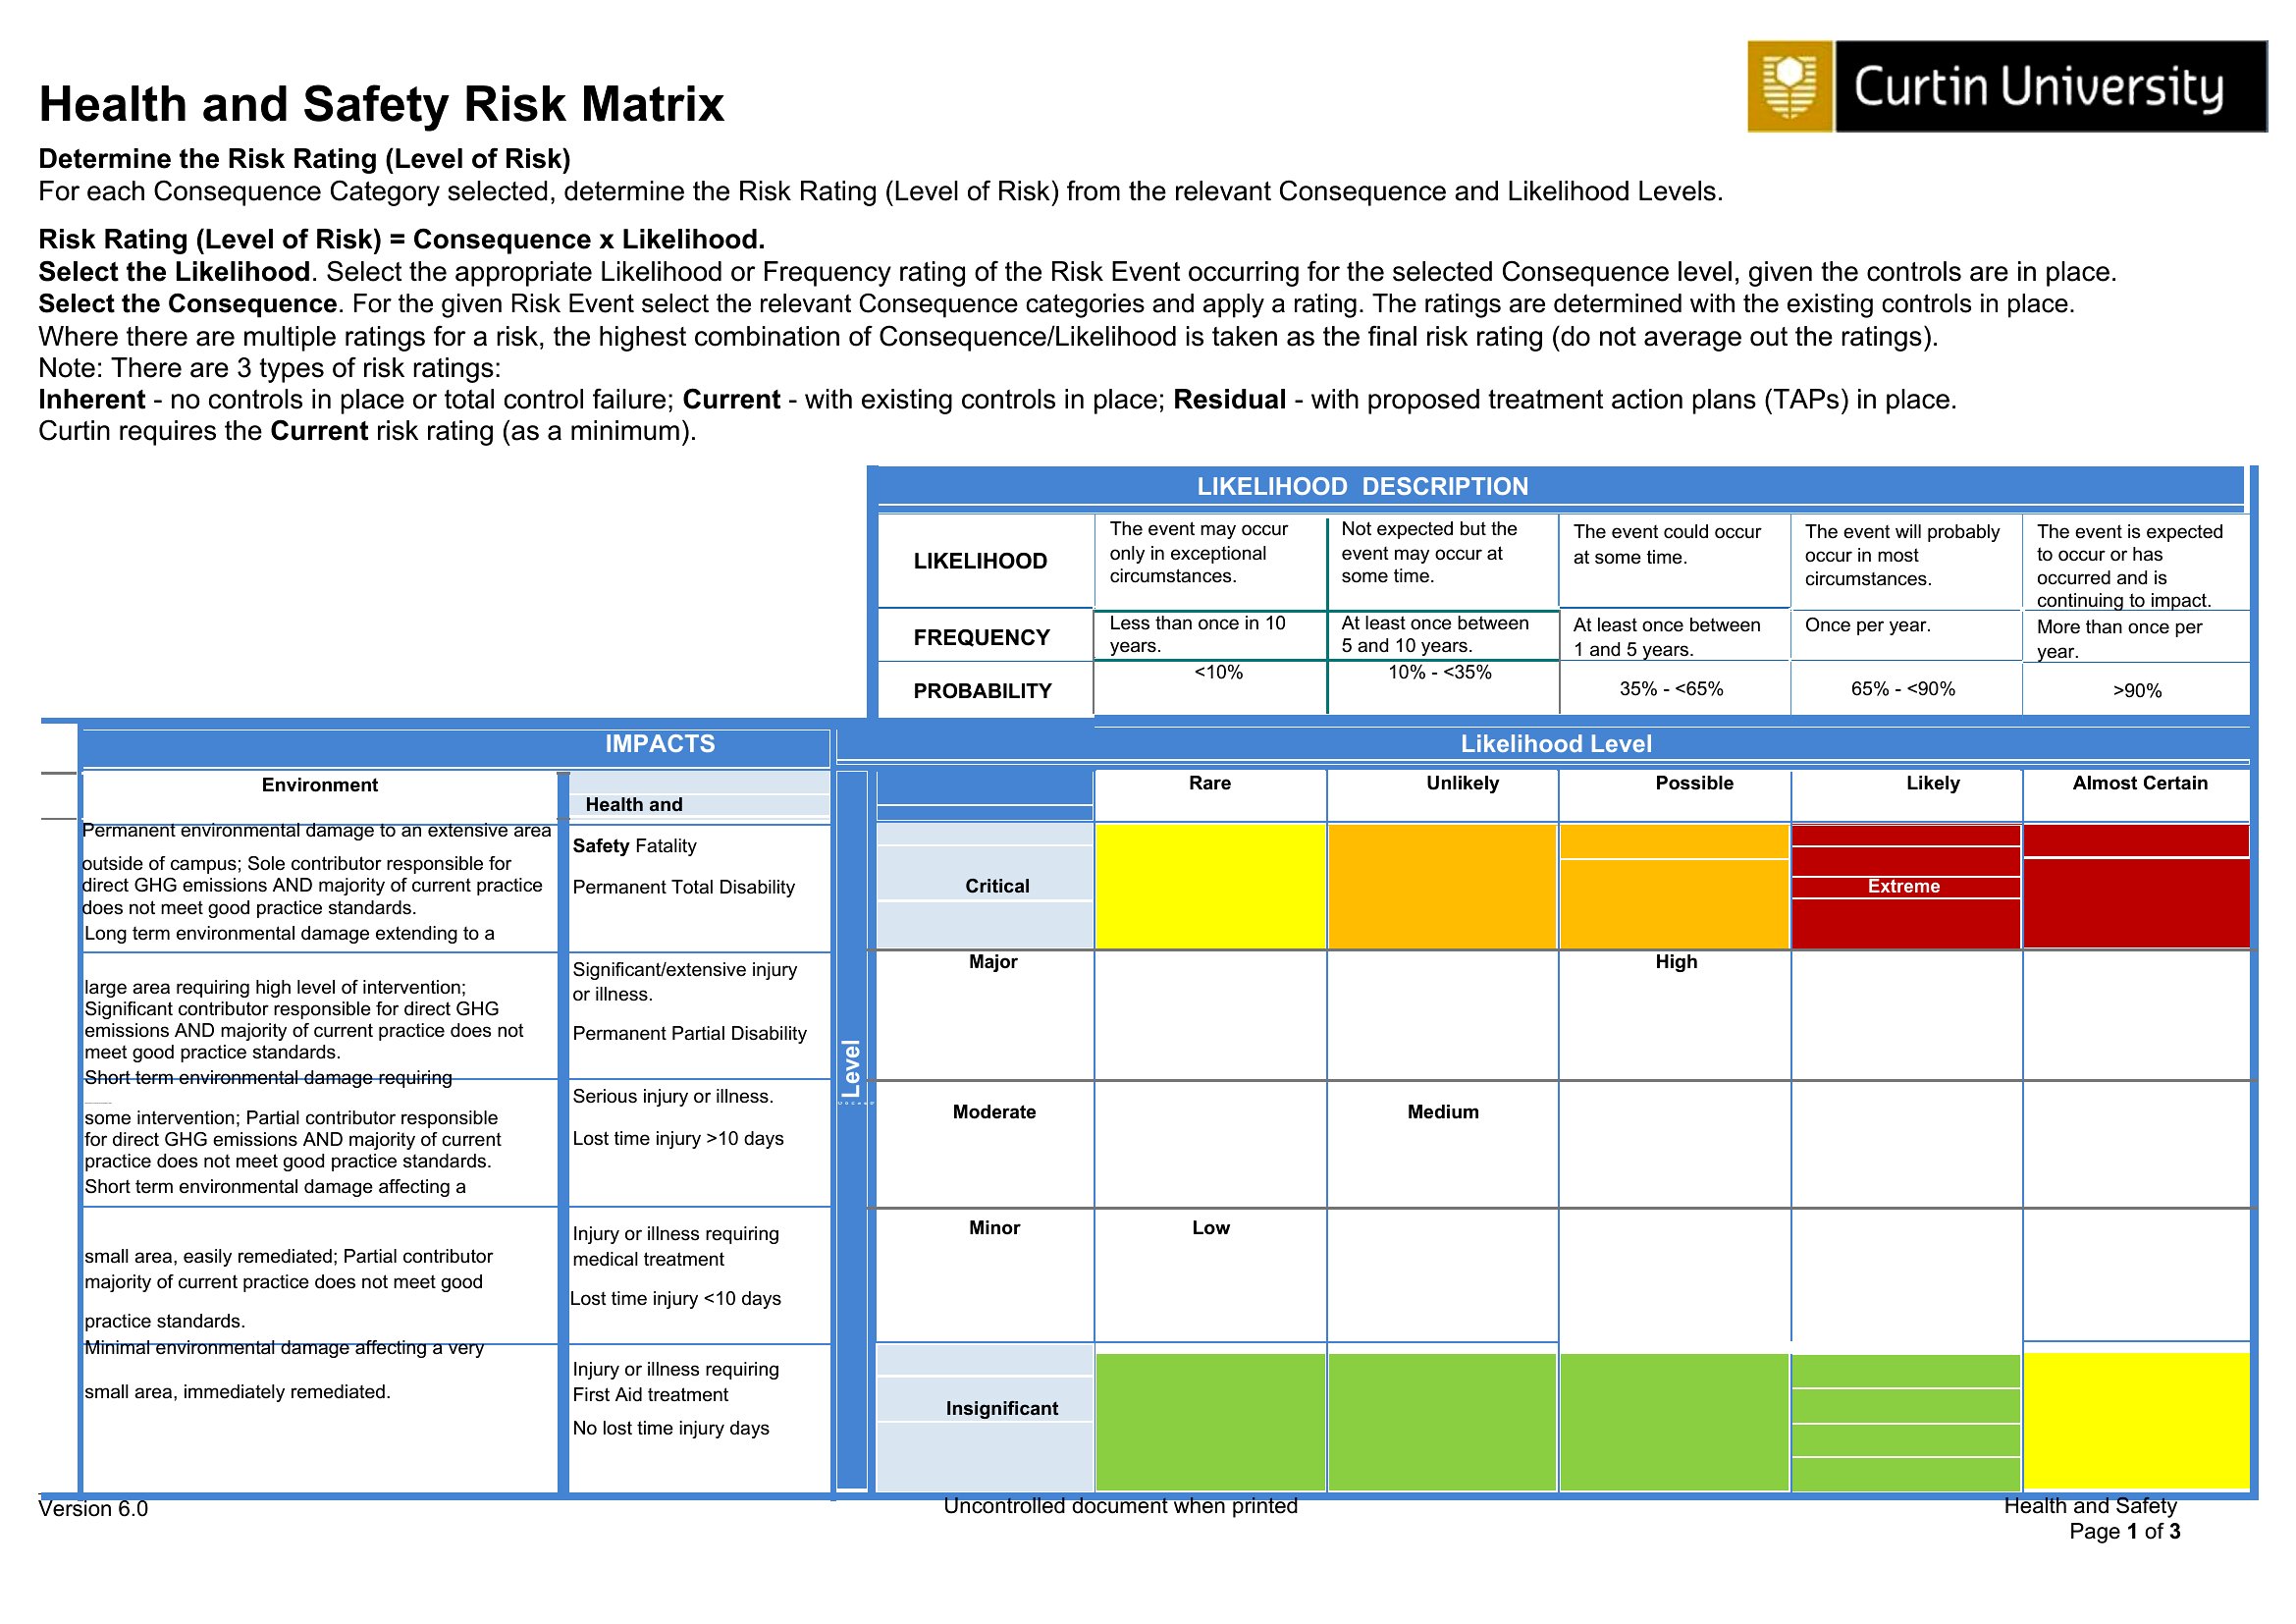
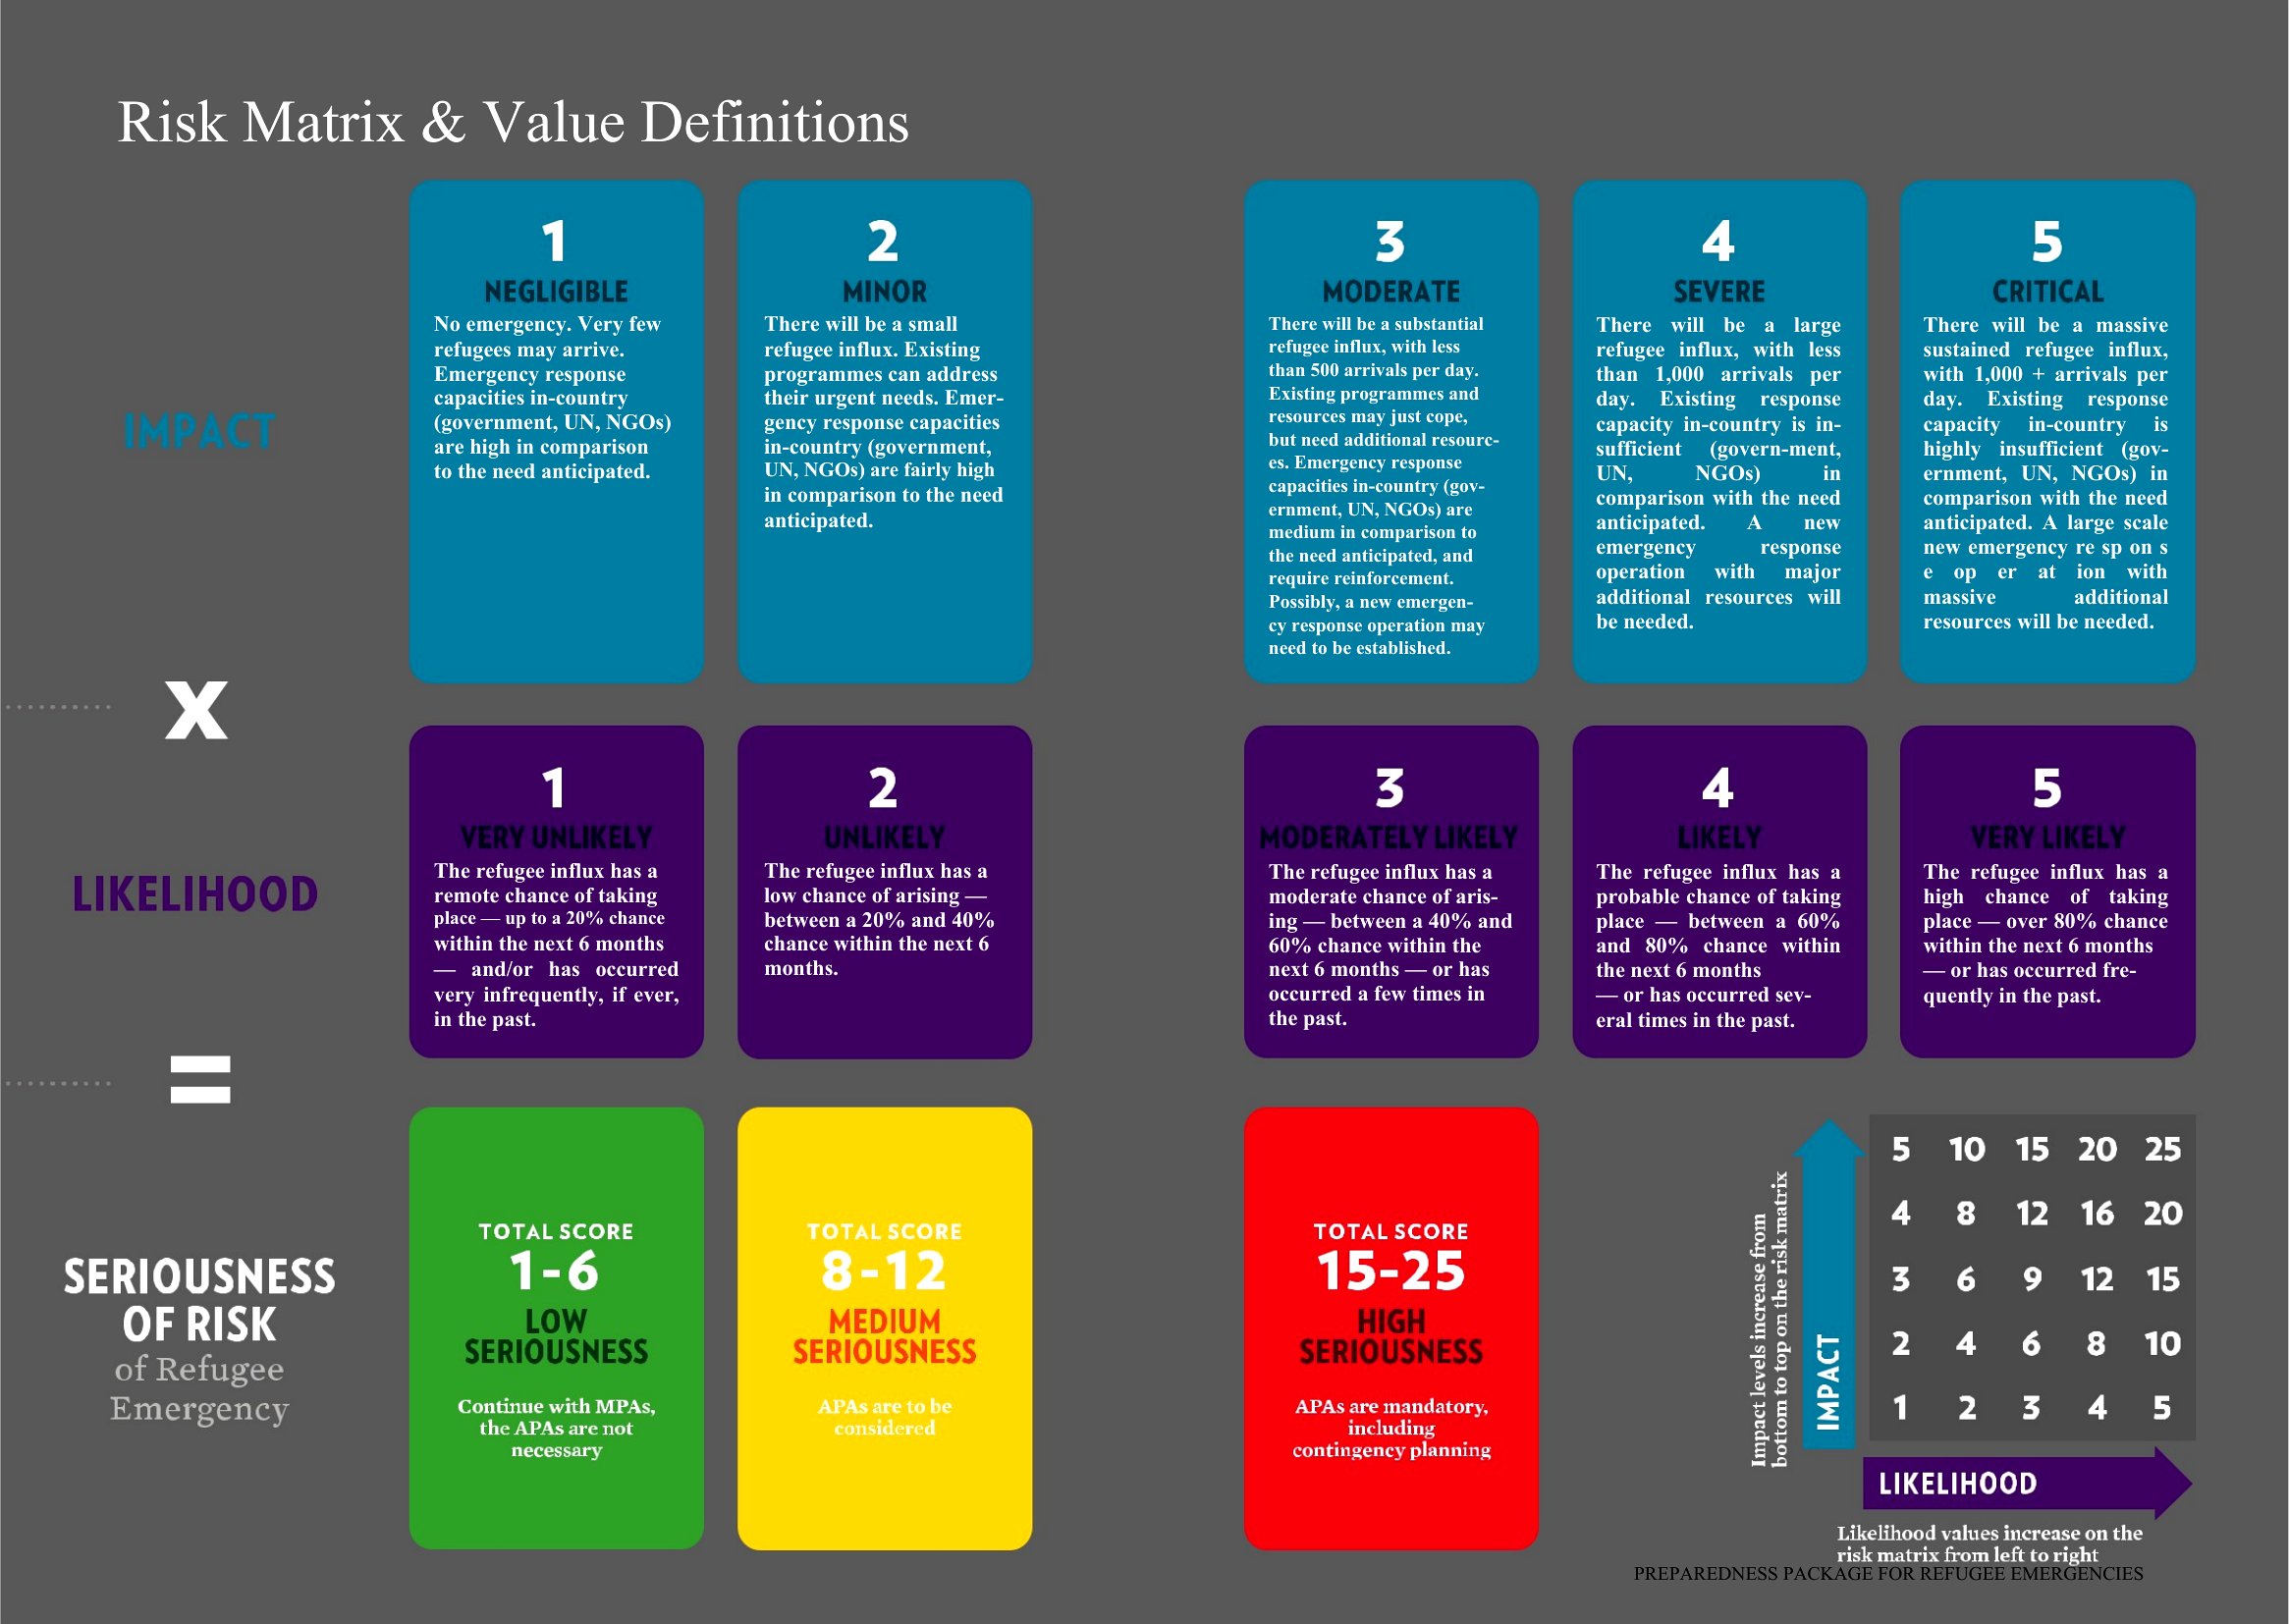
5X5 Risk Matrix
FAQ
Can these risk matrices help me justify budget requests for safety upgrades?
Yes, these templates let you visually tie specific risks—like equipment failure or ergonomic strain—to their probability and cost of impact. For example, plotting a ‘high/medium’ risk in a 5x5 matrix with a $20K repair cost can directly support your case for preventive maintenance funding. Pair the matrix with a brief narrative in the Word version or a cost-benefit table in Excel.
How do I decide between a 3x3 and a 5x5 grid for my industry?
Use a 3x3 grid for broad, high-level overviews where you need quick prioritization (e.g., project kickoffs or annual compliance reviews). A 5x5 grid is better for granular risks—like cybersecurity threats or detailed manufacturing hazards—where you need to distinguish between ‘medium-high’ and ‘high-medium’ severity. Healthcare or finance teams often prefer 5x5 for nuanced regulatory alignment.
What’s the best way to explain risk matrix results to non-technical stakeholders?
Start by labeling the axes clearly (e.g., ‘Probability: Rare/Occasional/Frequent’ and ‘Impact: Minor/Serious/Catastrophic’). In Word, use the ‘Risk Ranking Matrix’ template to highlight the top-right quadrant in red and add a 1-sentence summary like ‘These 3 risks require immediate mitigation.’ For Excel, add a sparkline or color-coding to turn numbers into an intuitive visual. Avoid jargon—focus on outcomes, like ‘This could delay our launch by 6 weeks.’
Comments
Join the conversation
Sign in to share your thoughts and leave a comment on this resource.