
Free Fishbone Diagram Templates (PDF)
Diagrams by miguelhidalgo
When a problem keeps coming back, a fishbone diagram helps a team trace it to root causes instead of symptoms. This set of 21 templates supports quality teams, students, and project managers running cause-and-effect analysis across categories like people, process, and equipment.
Each diagram is a print-ready PDF, ready for a whiteboard session or a handout. Print one, label the spine with your problem, and fill in the branches as the group brainstorms. Download the template that fits your analysis and turn a messy discussion into a clear picture of what's really going on.
Choose from 21 Fishbone Diagram Templates
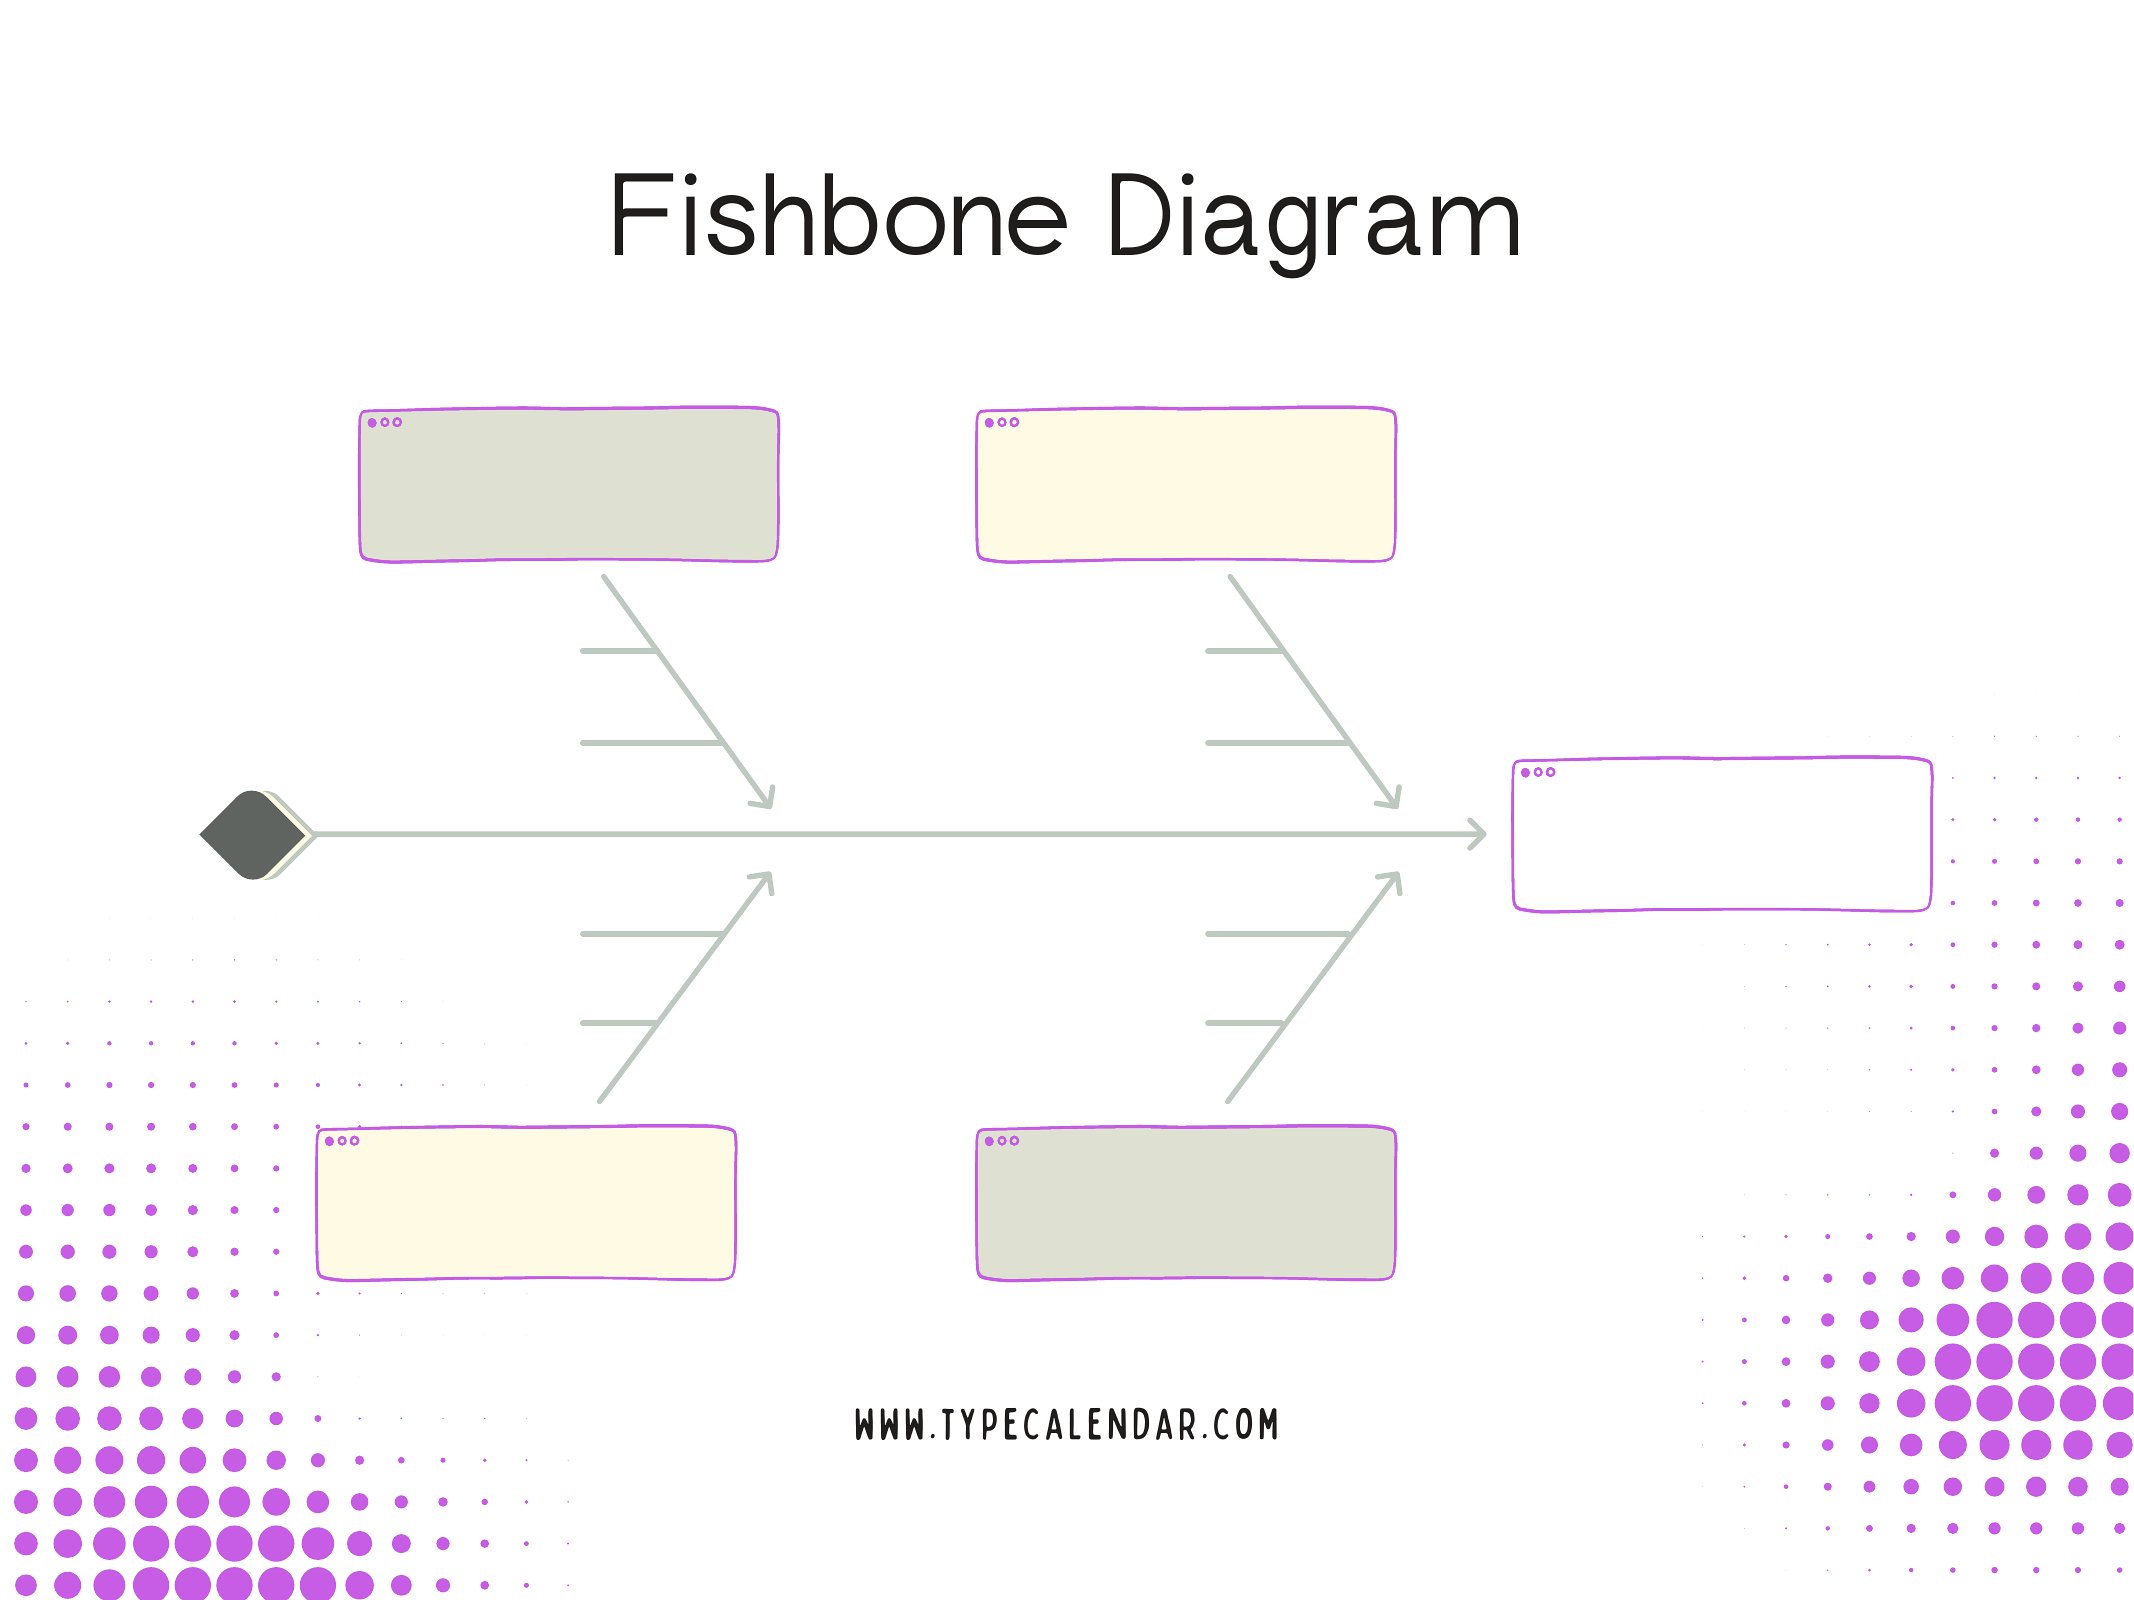
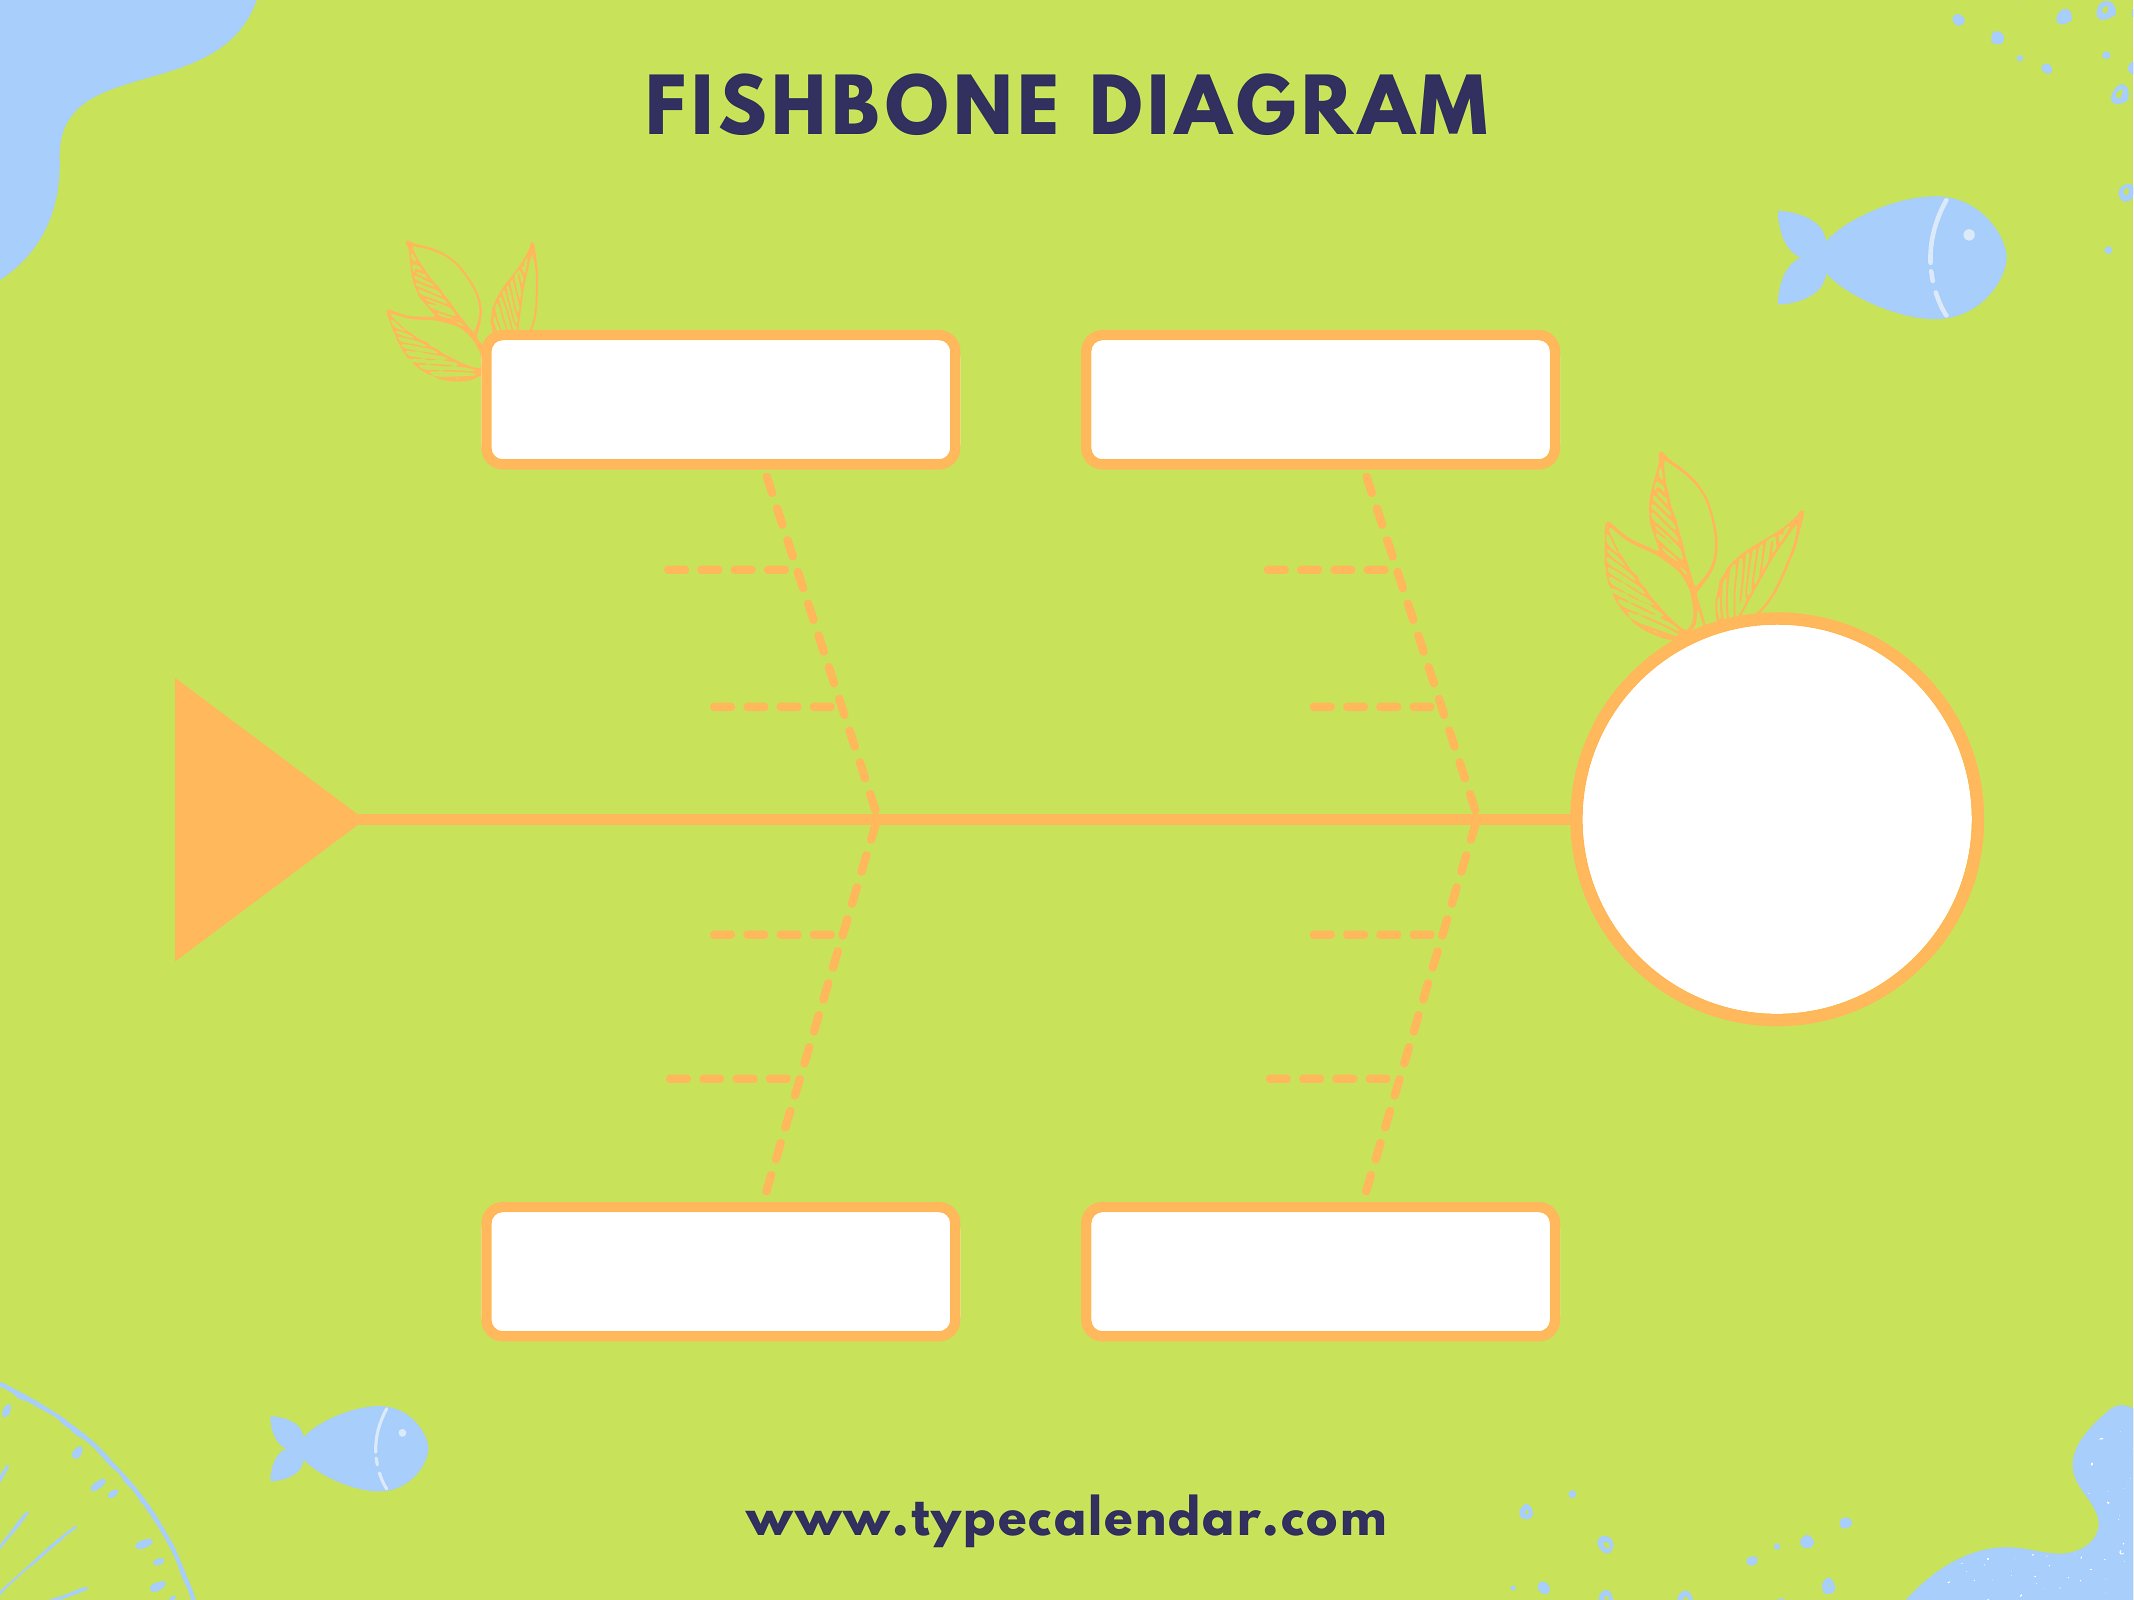
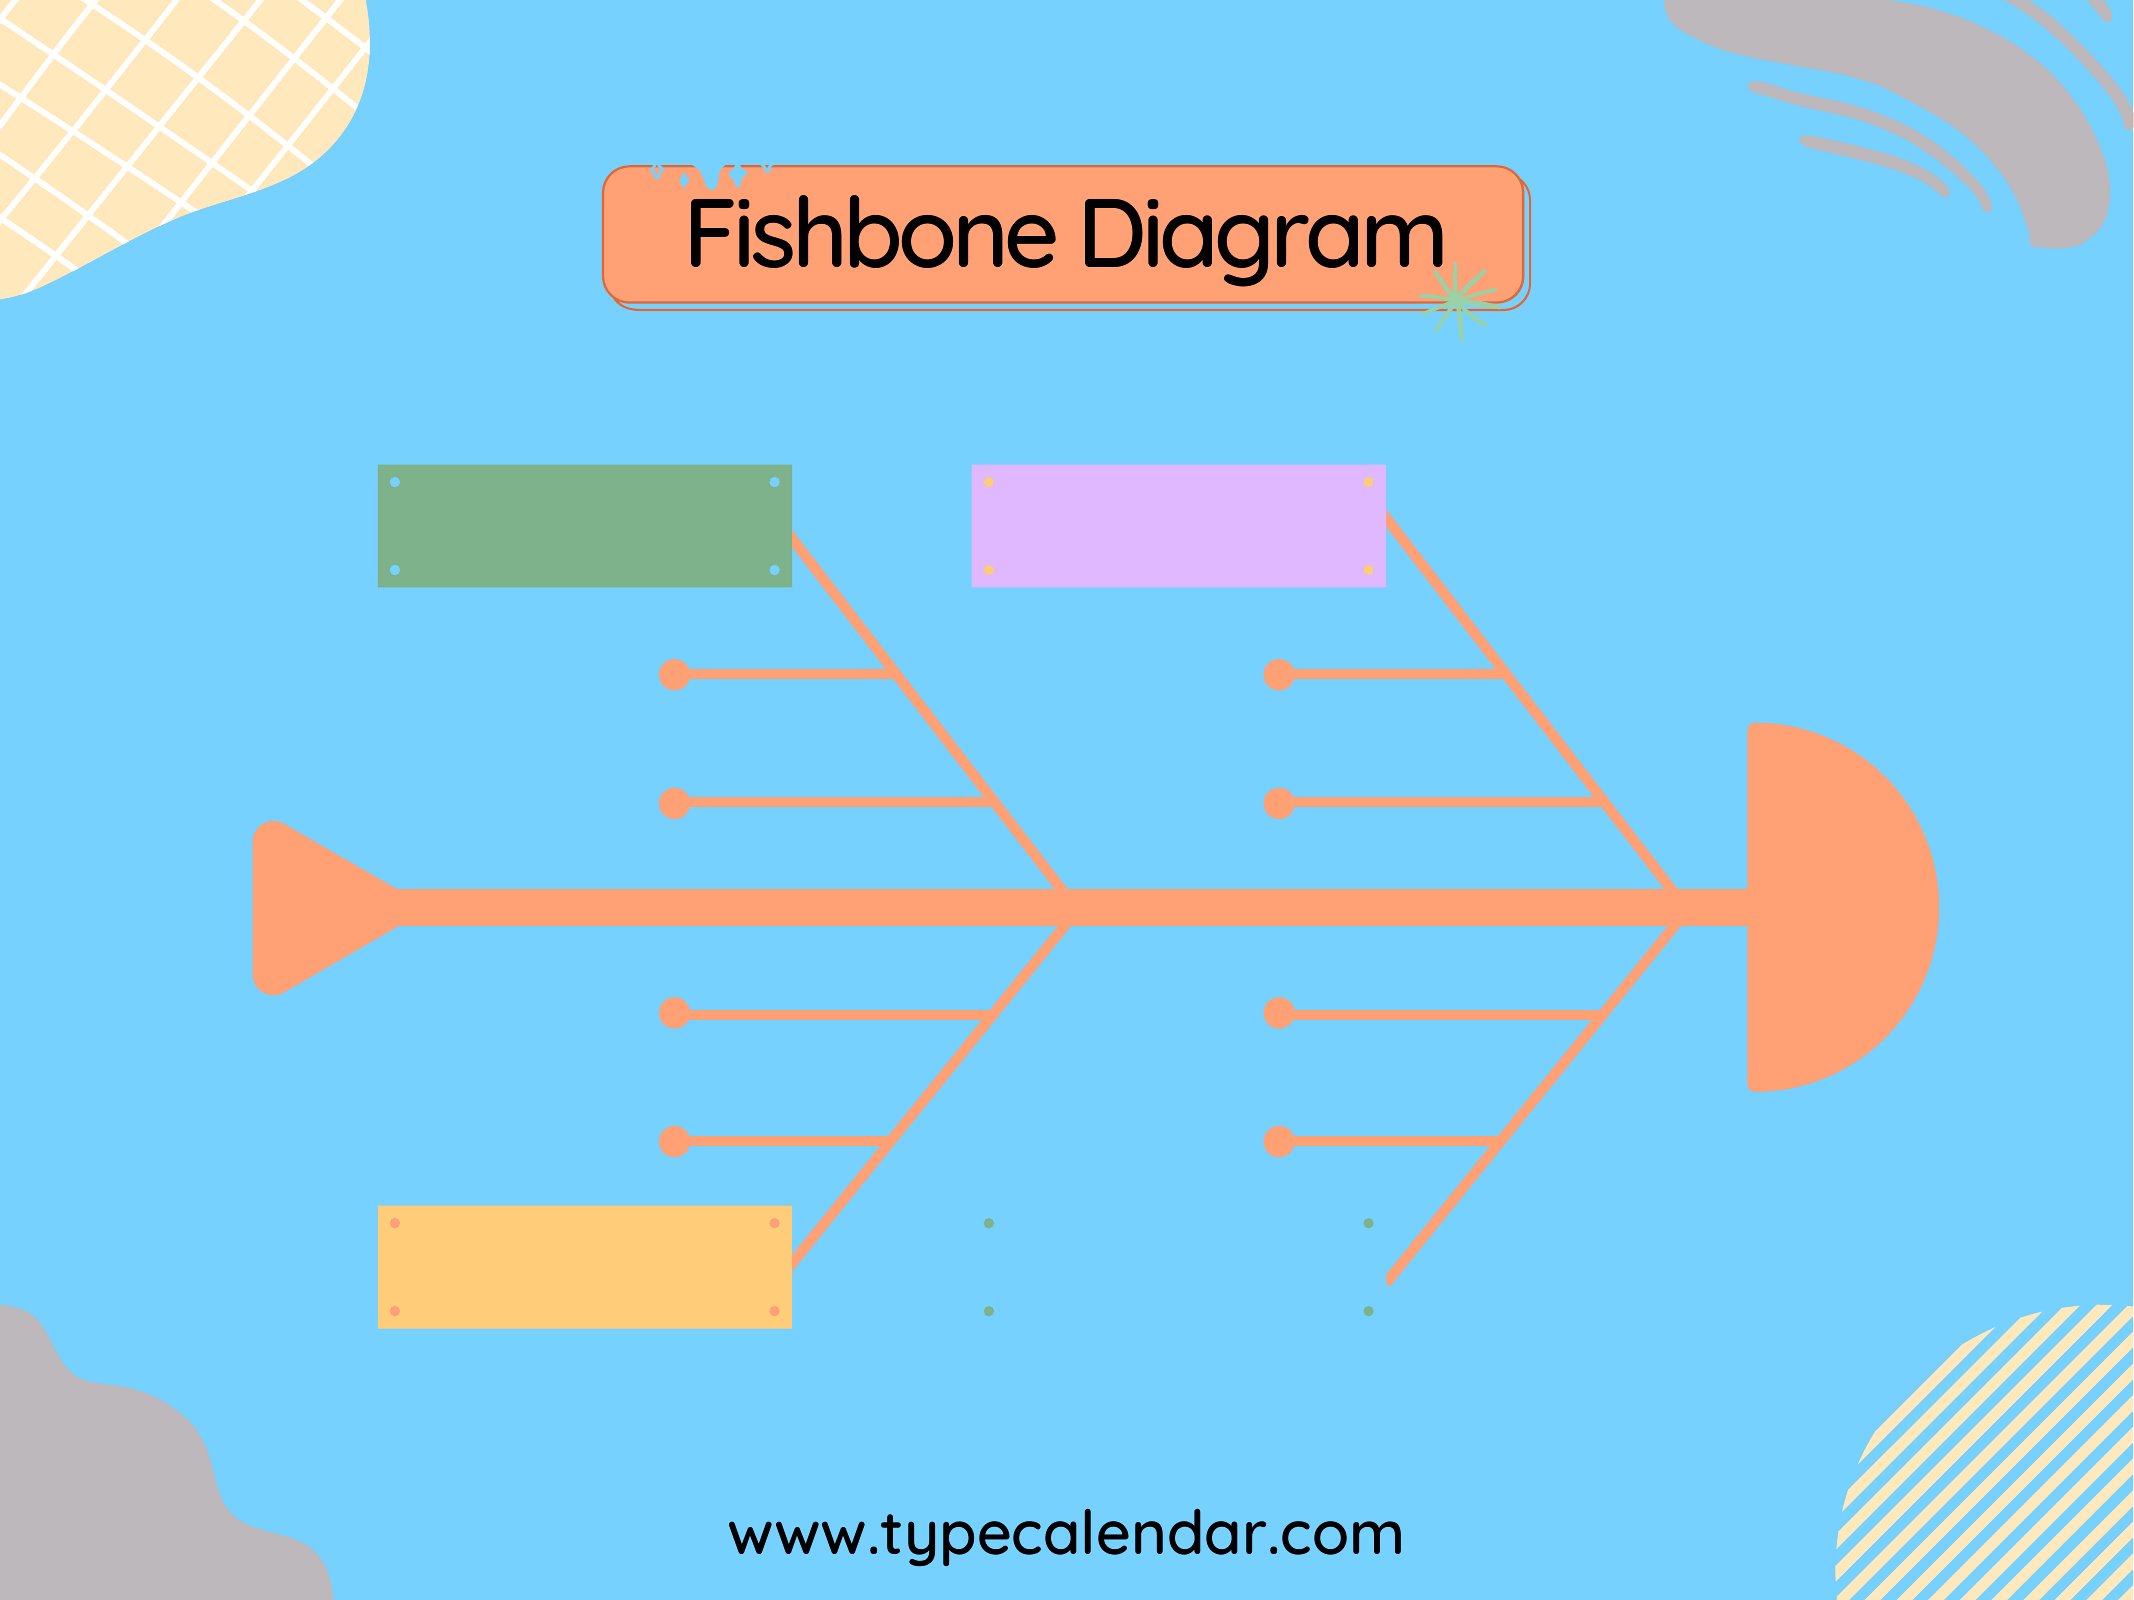
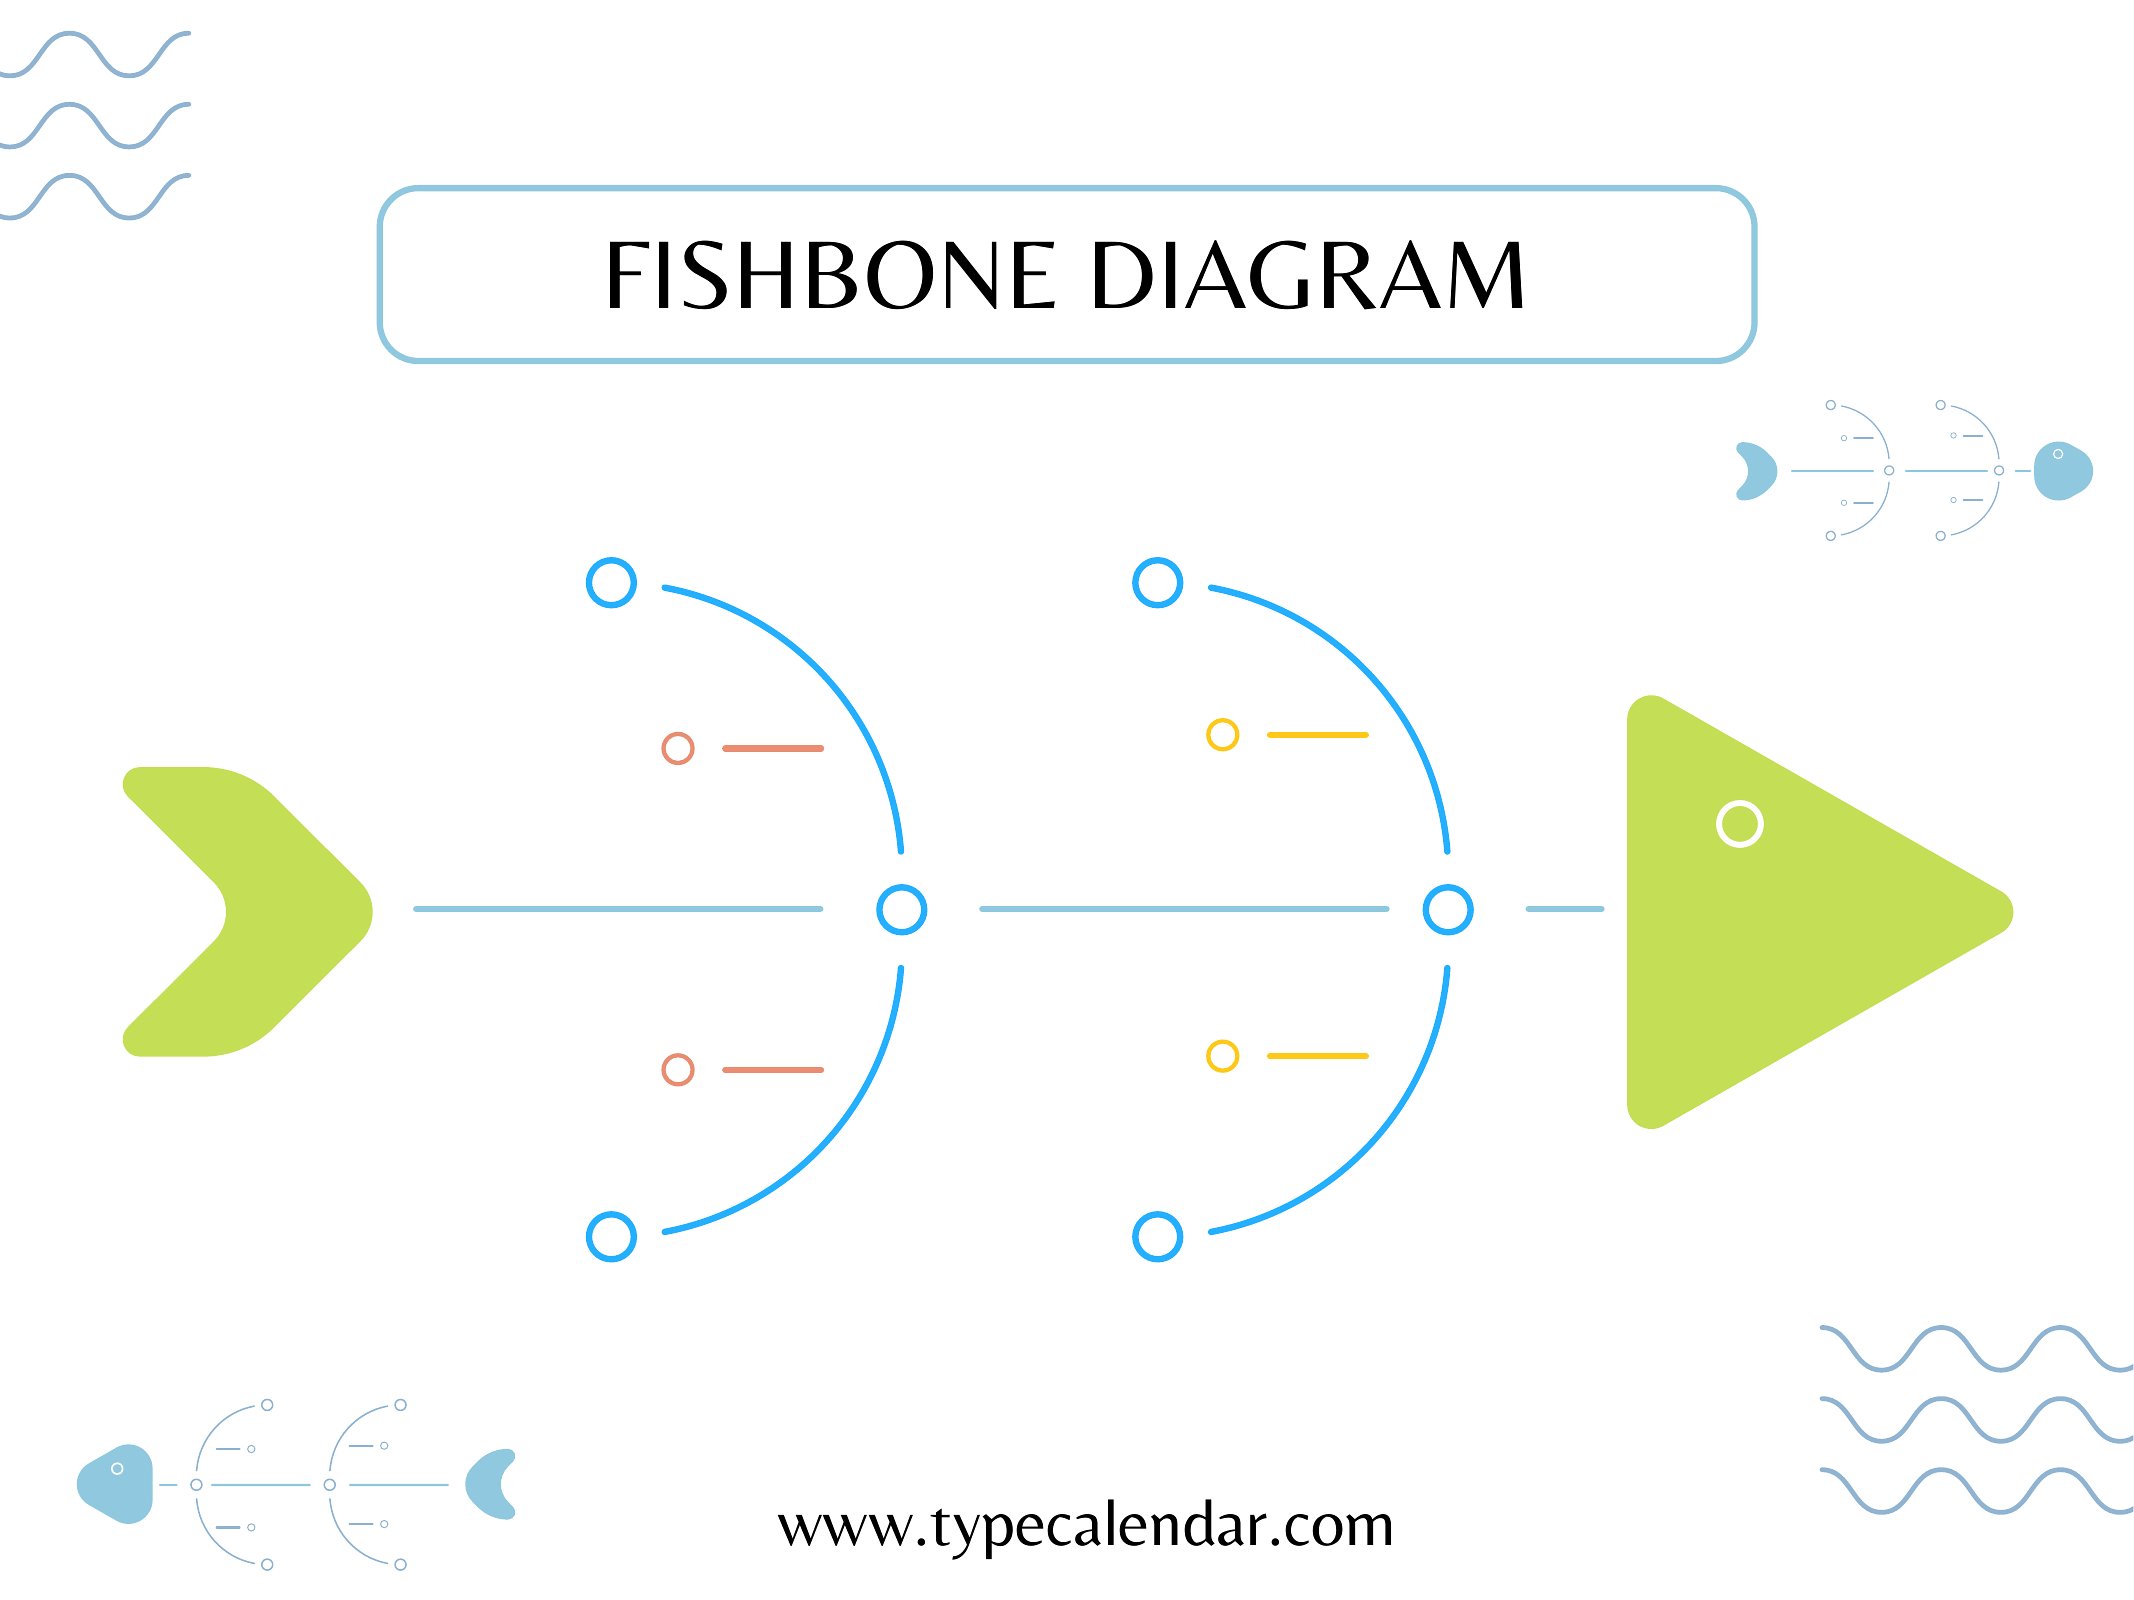
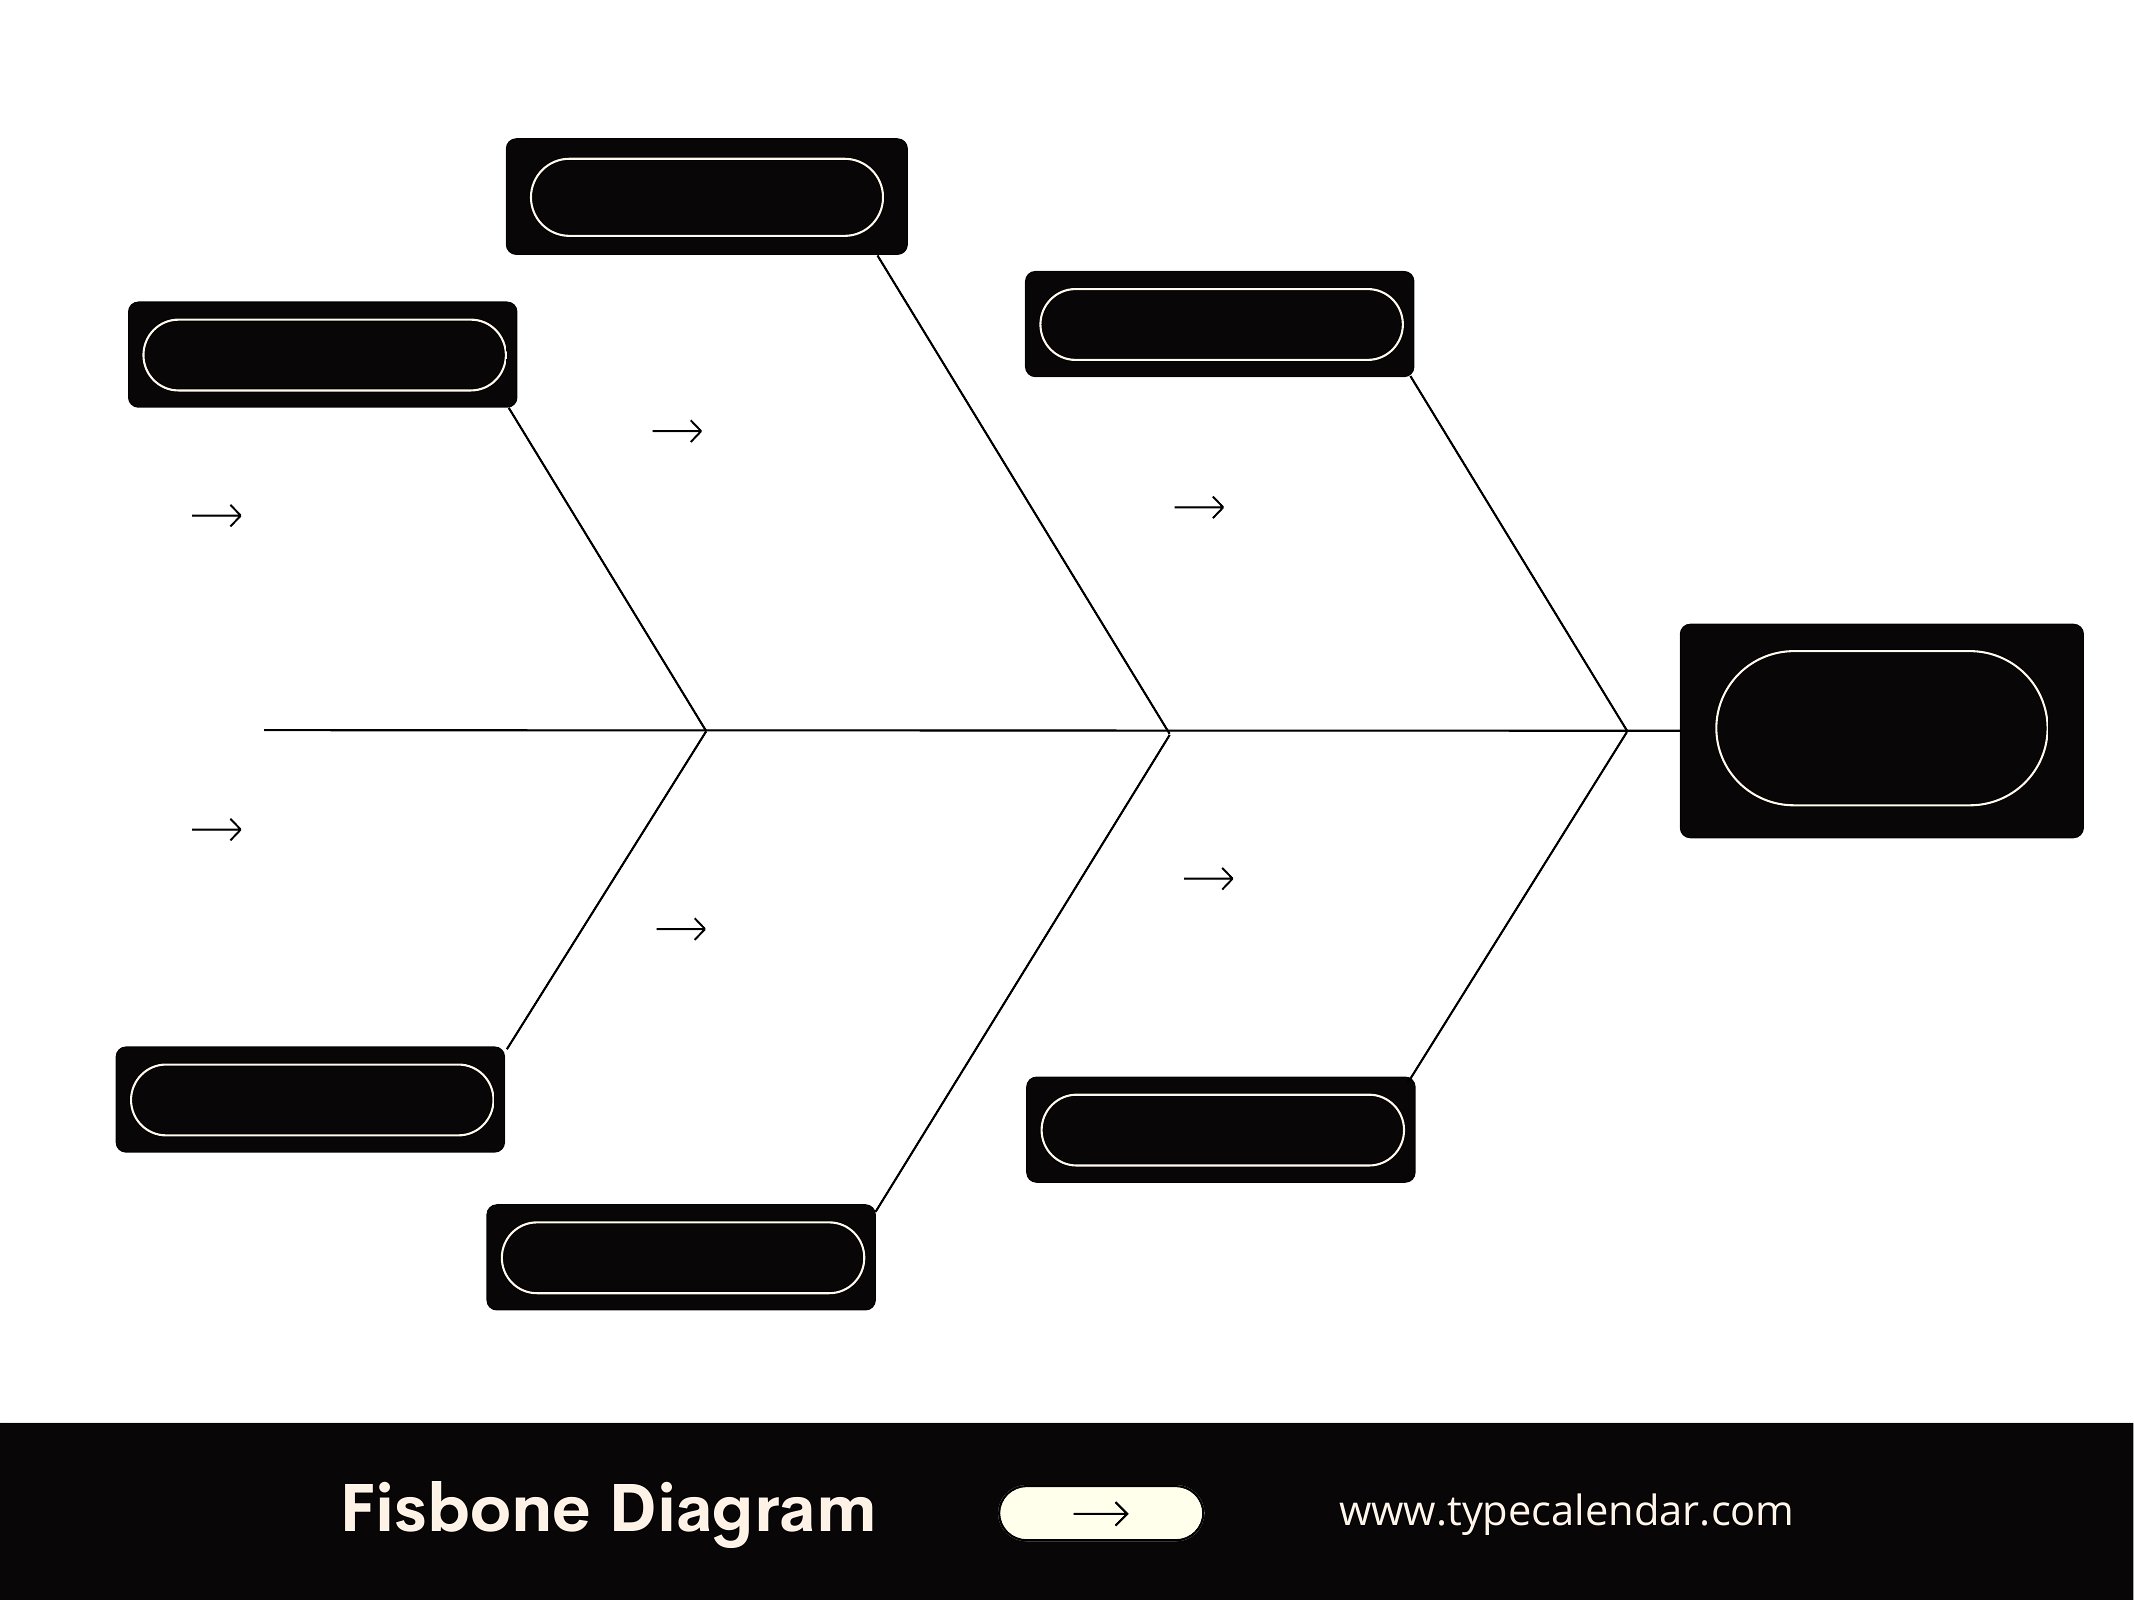

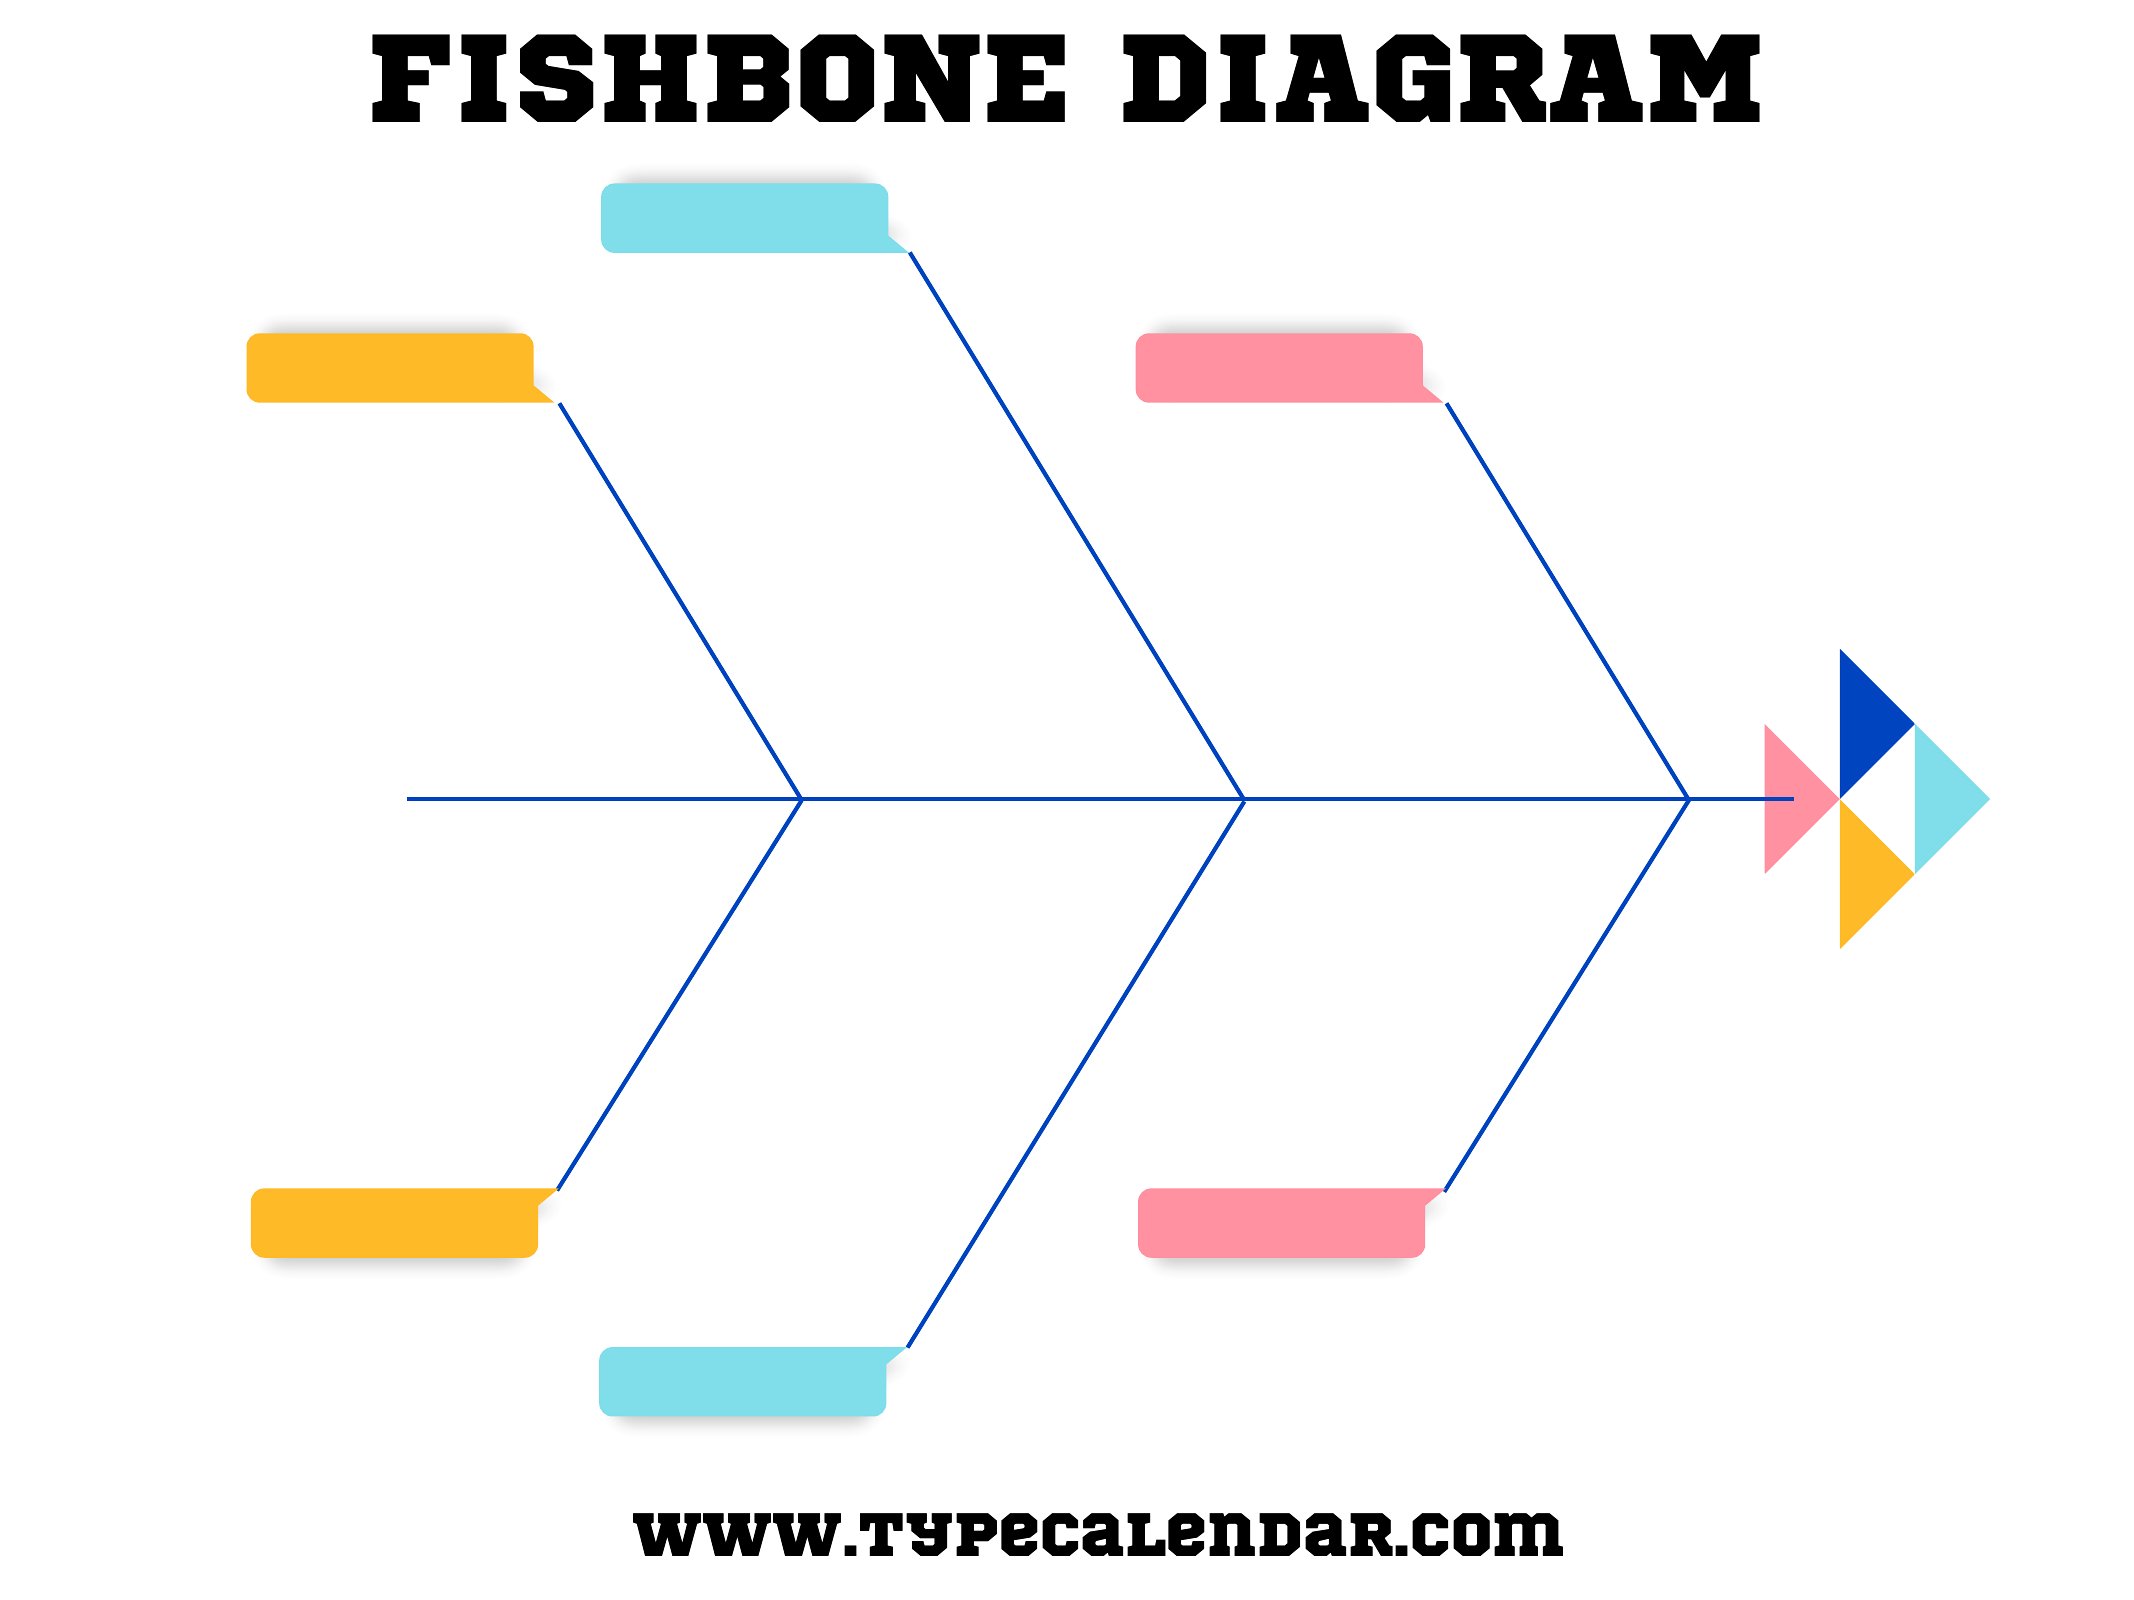
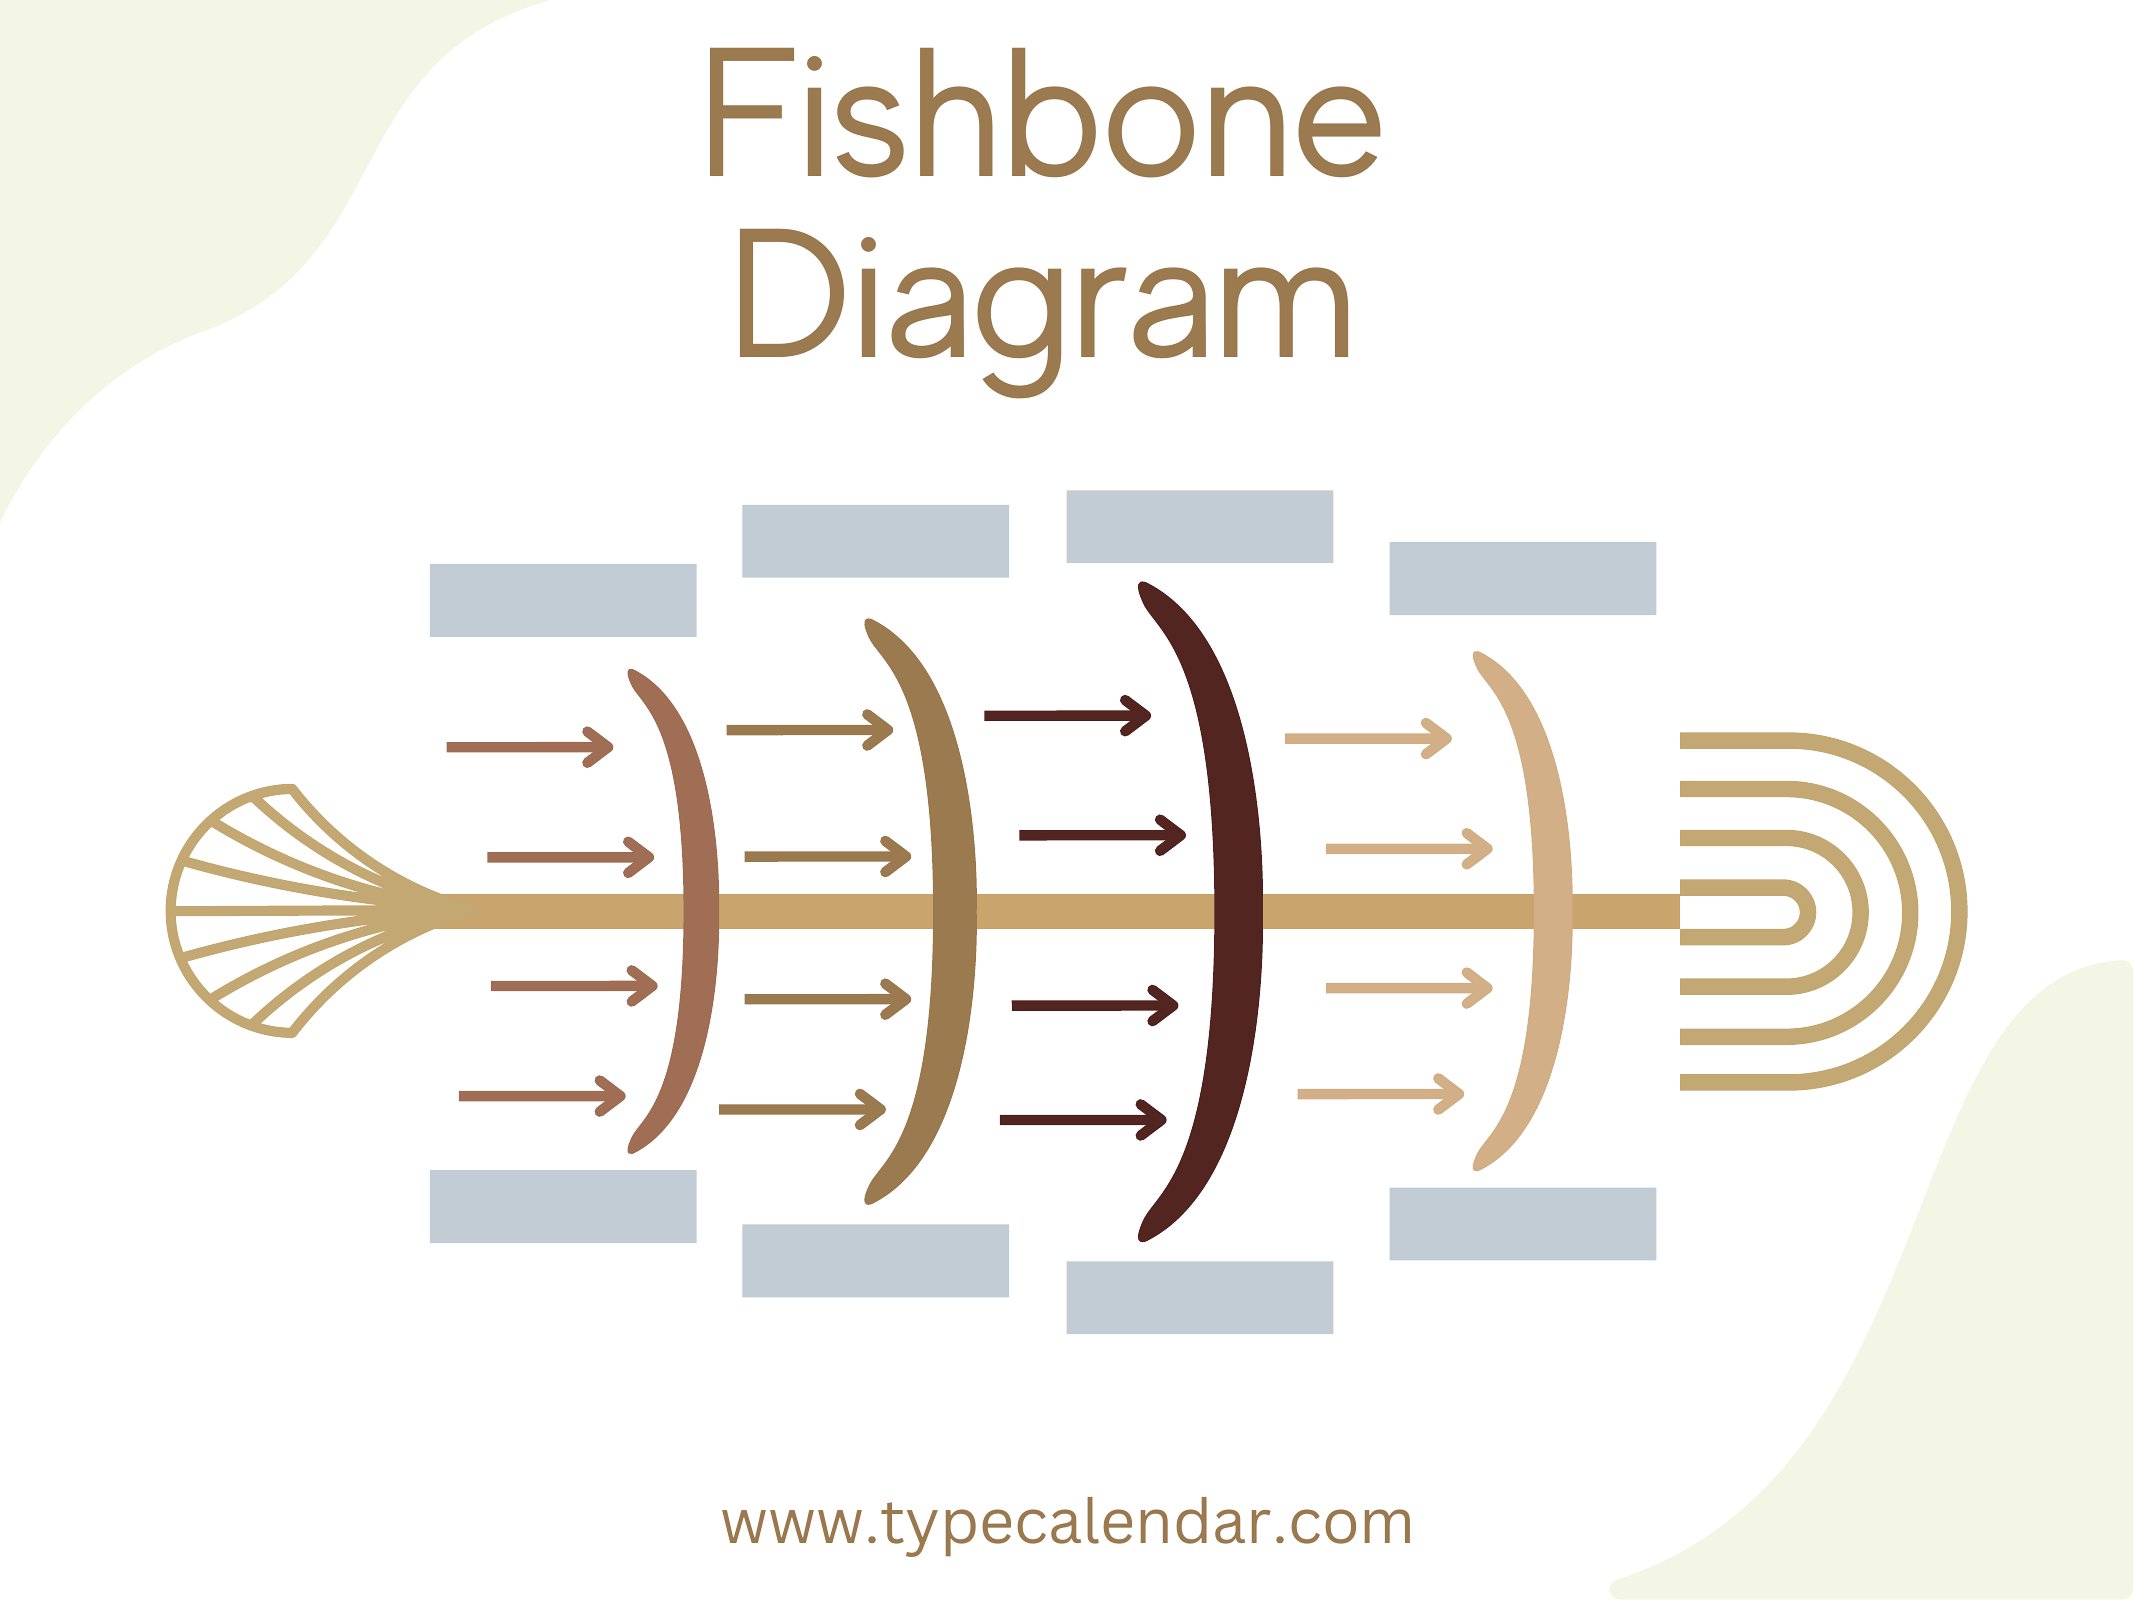
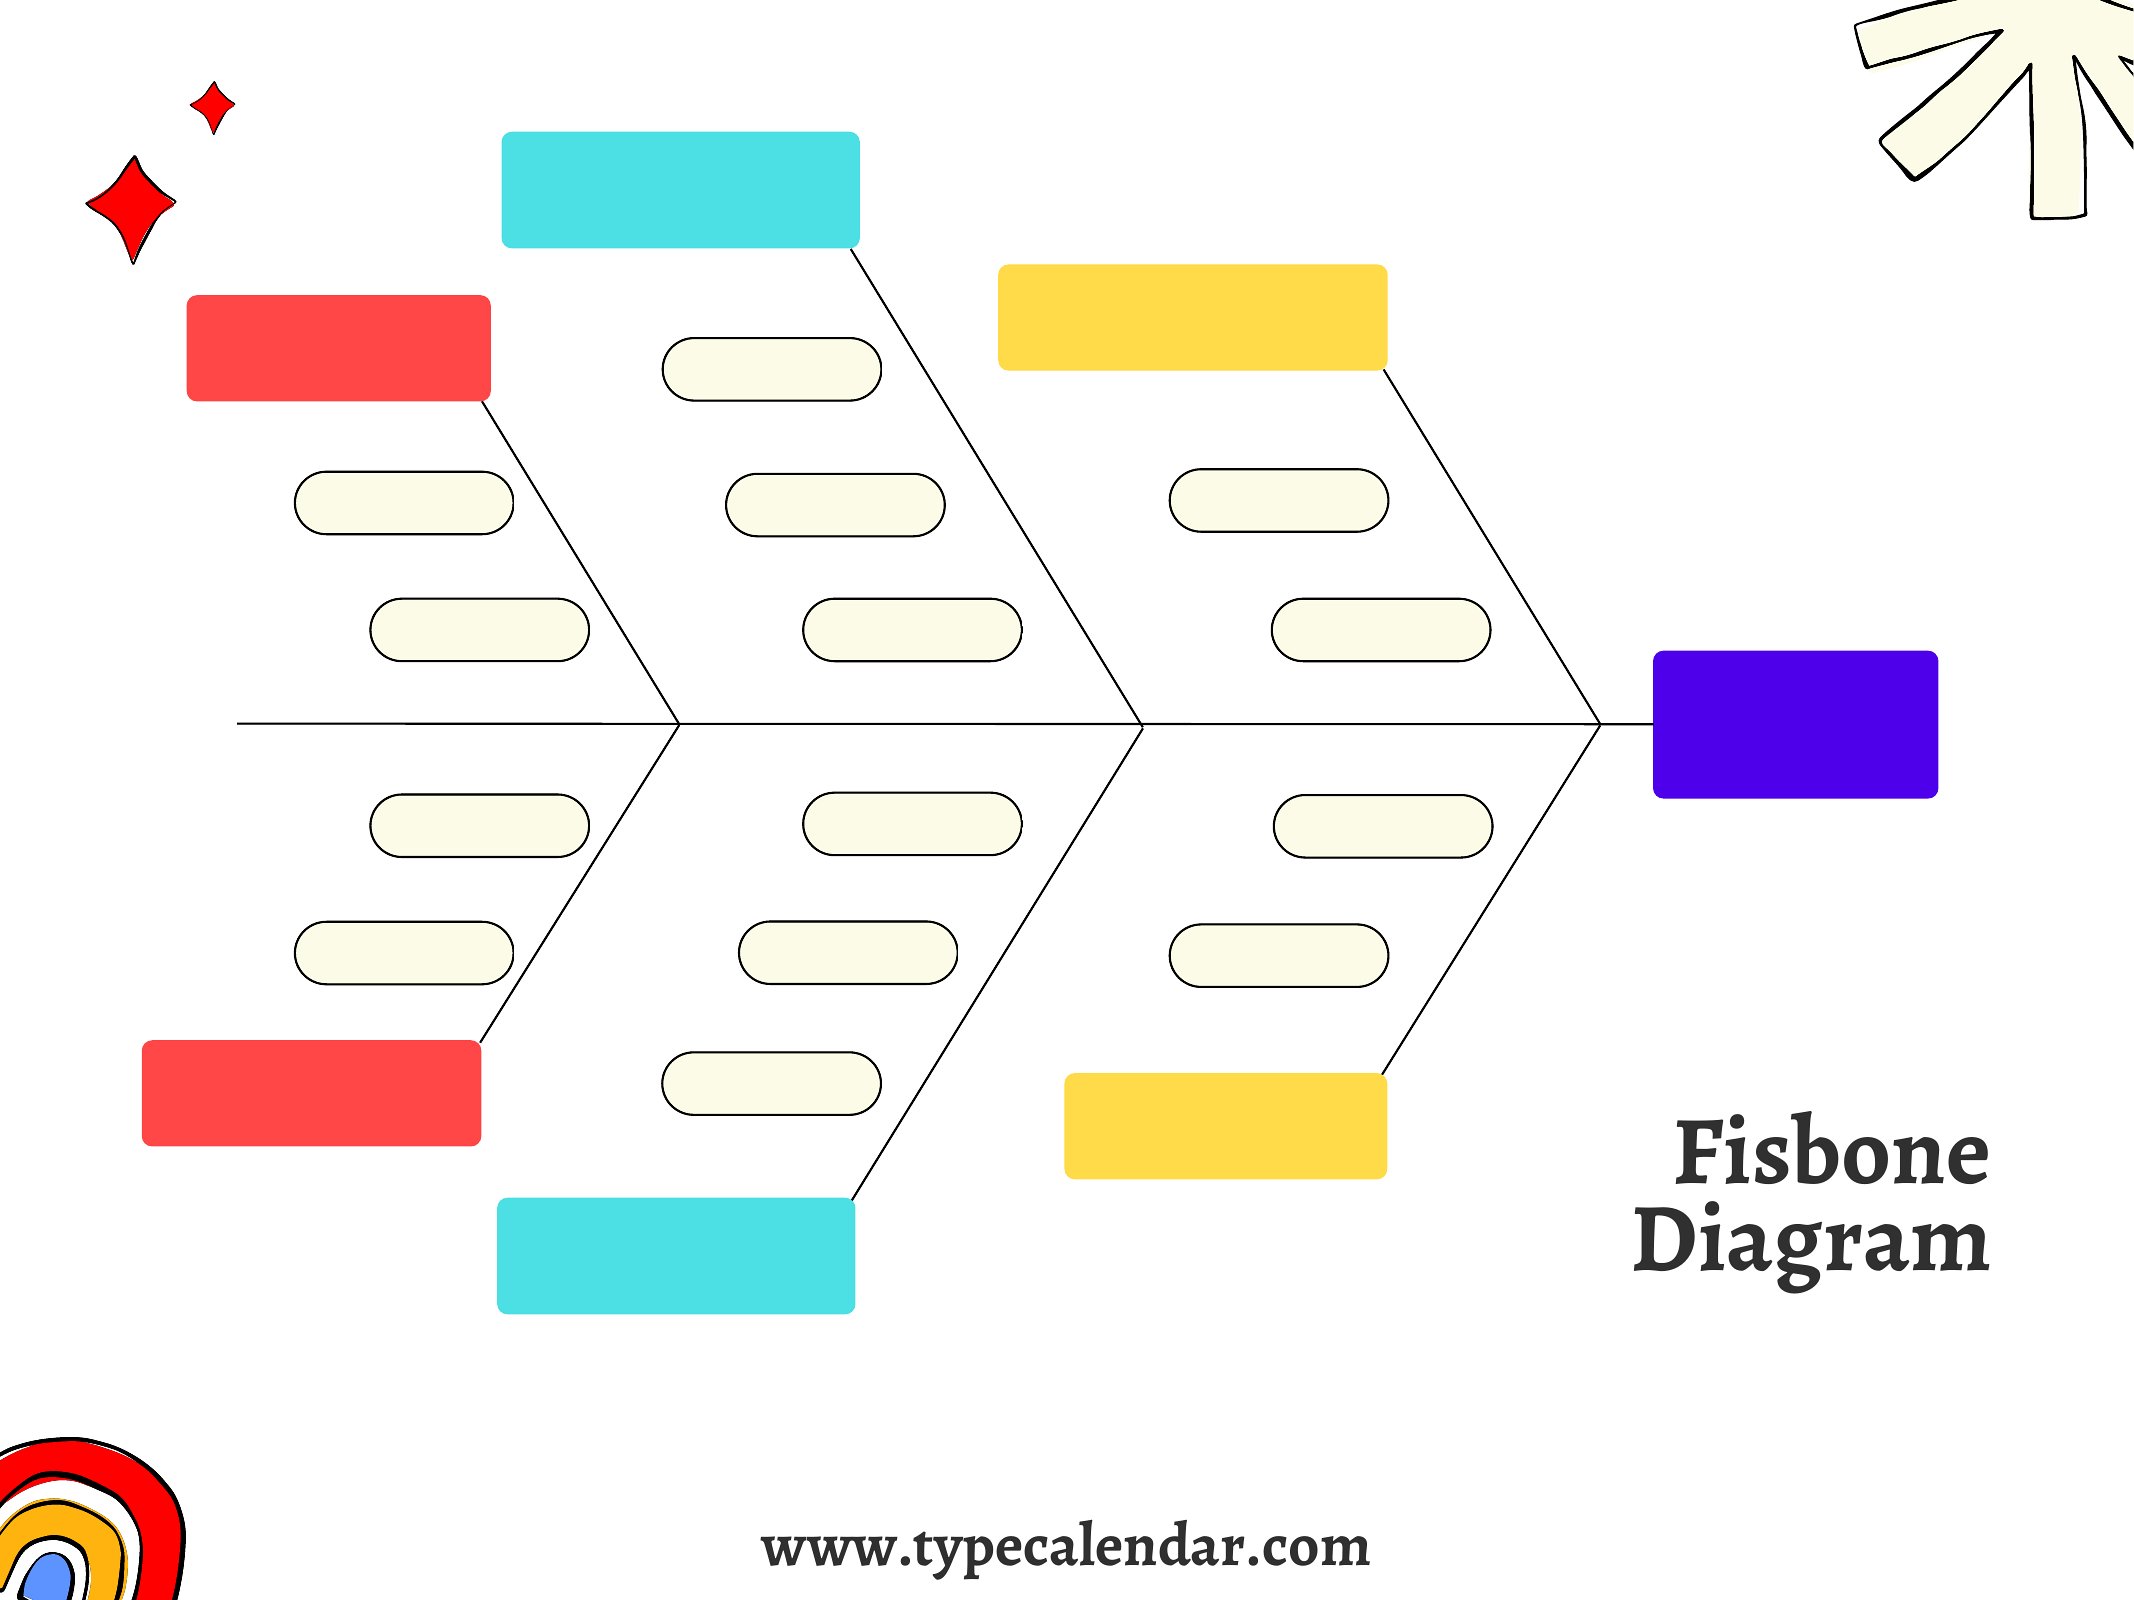
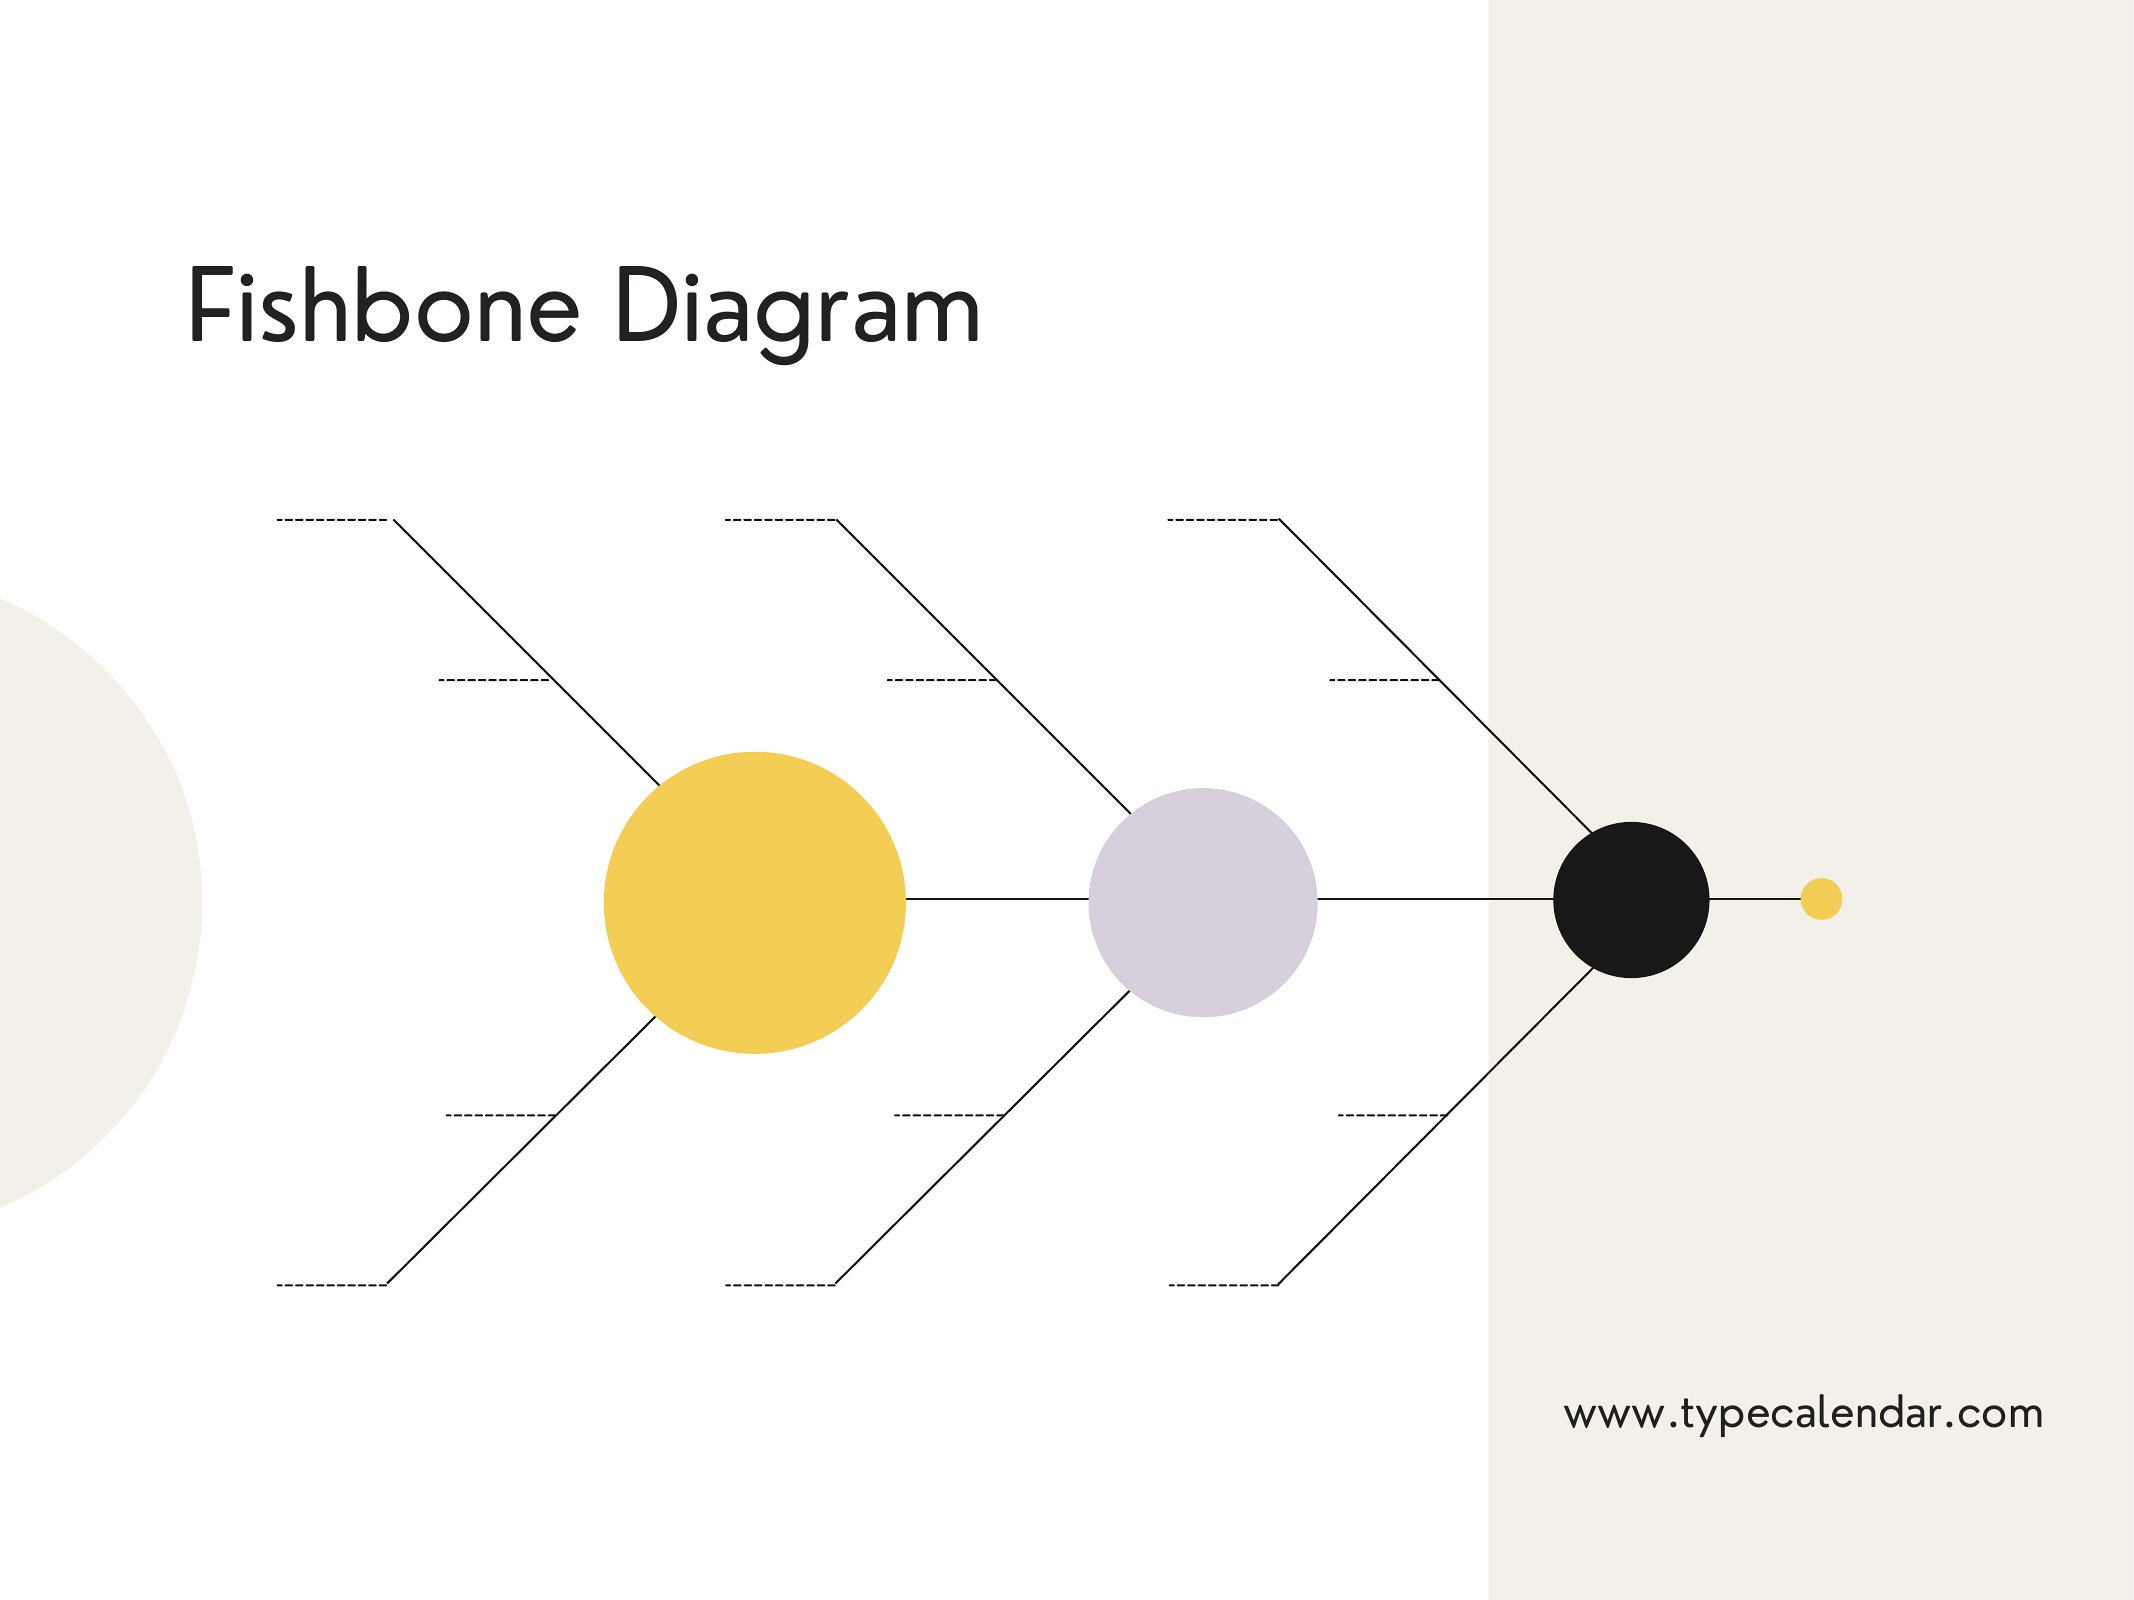
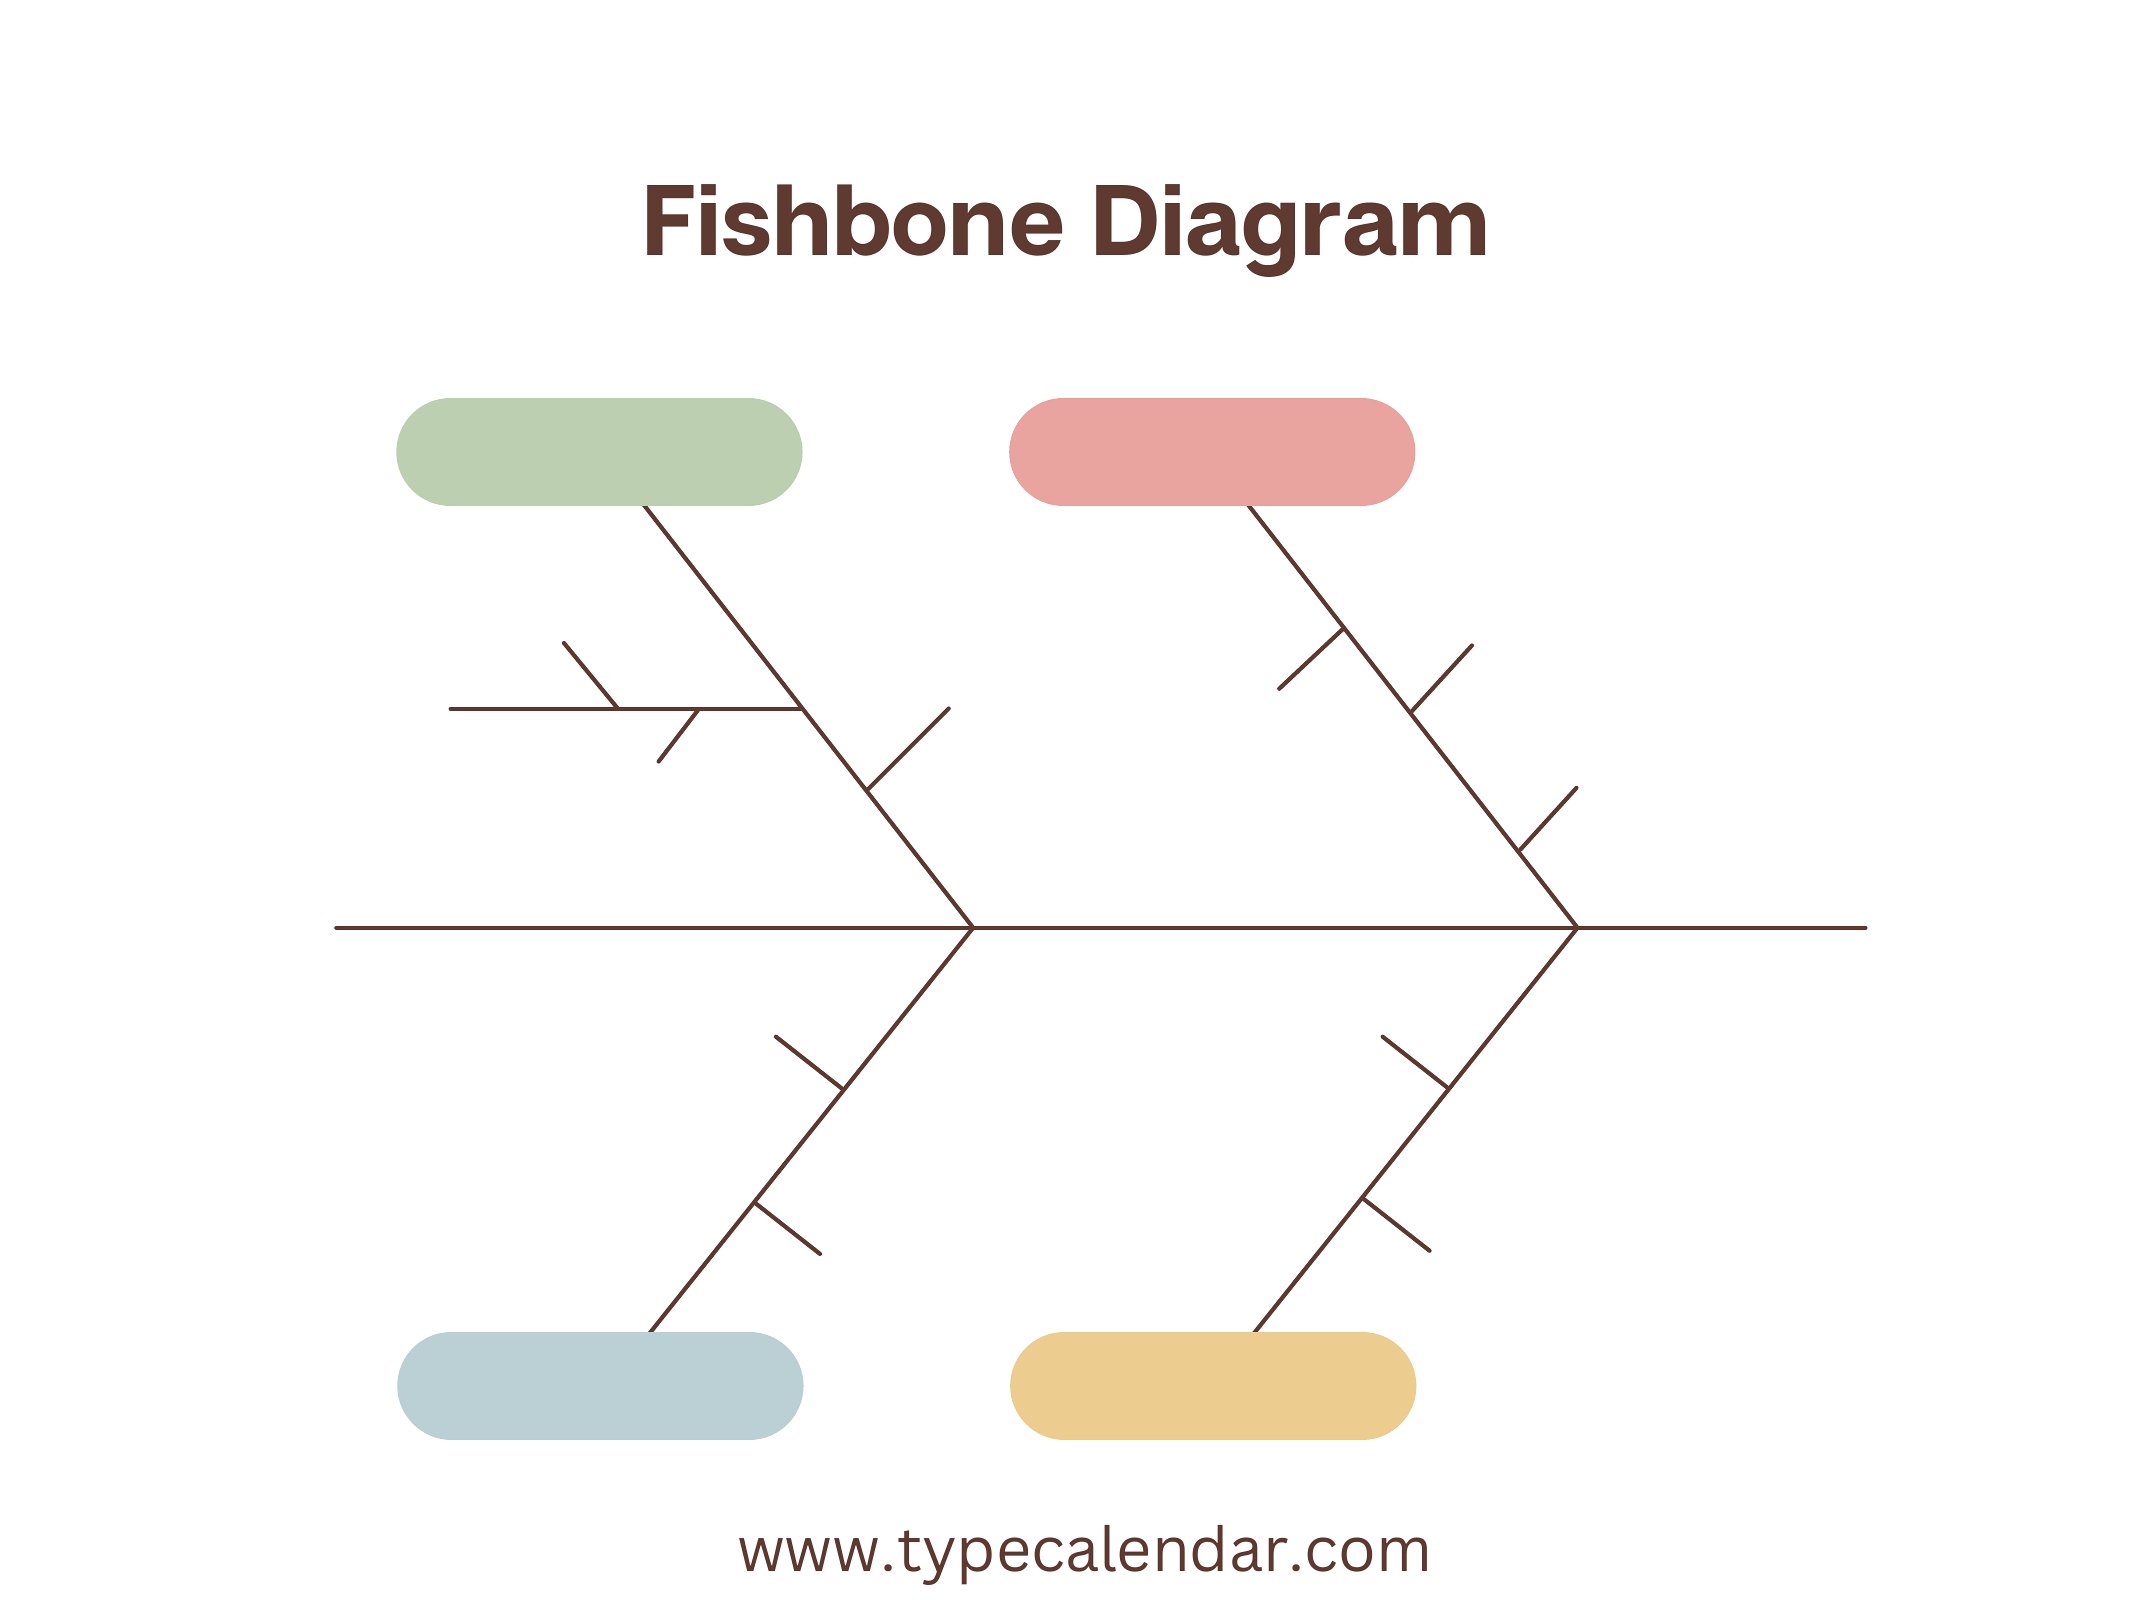
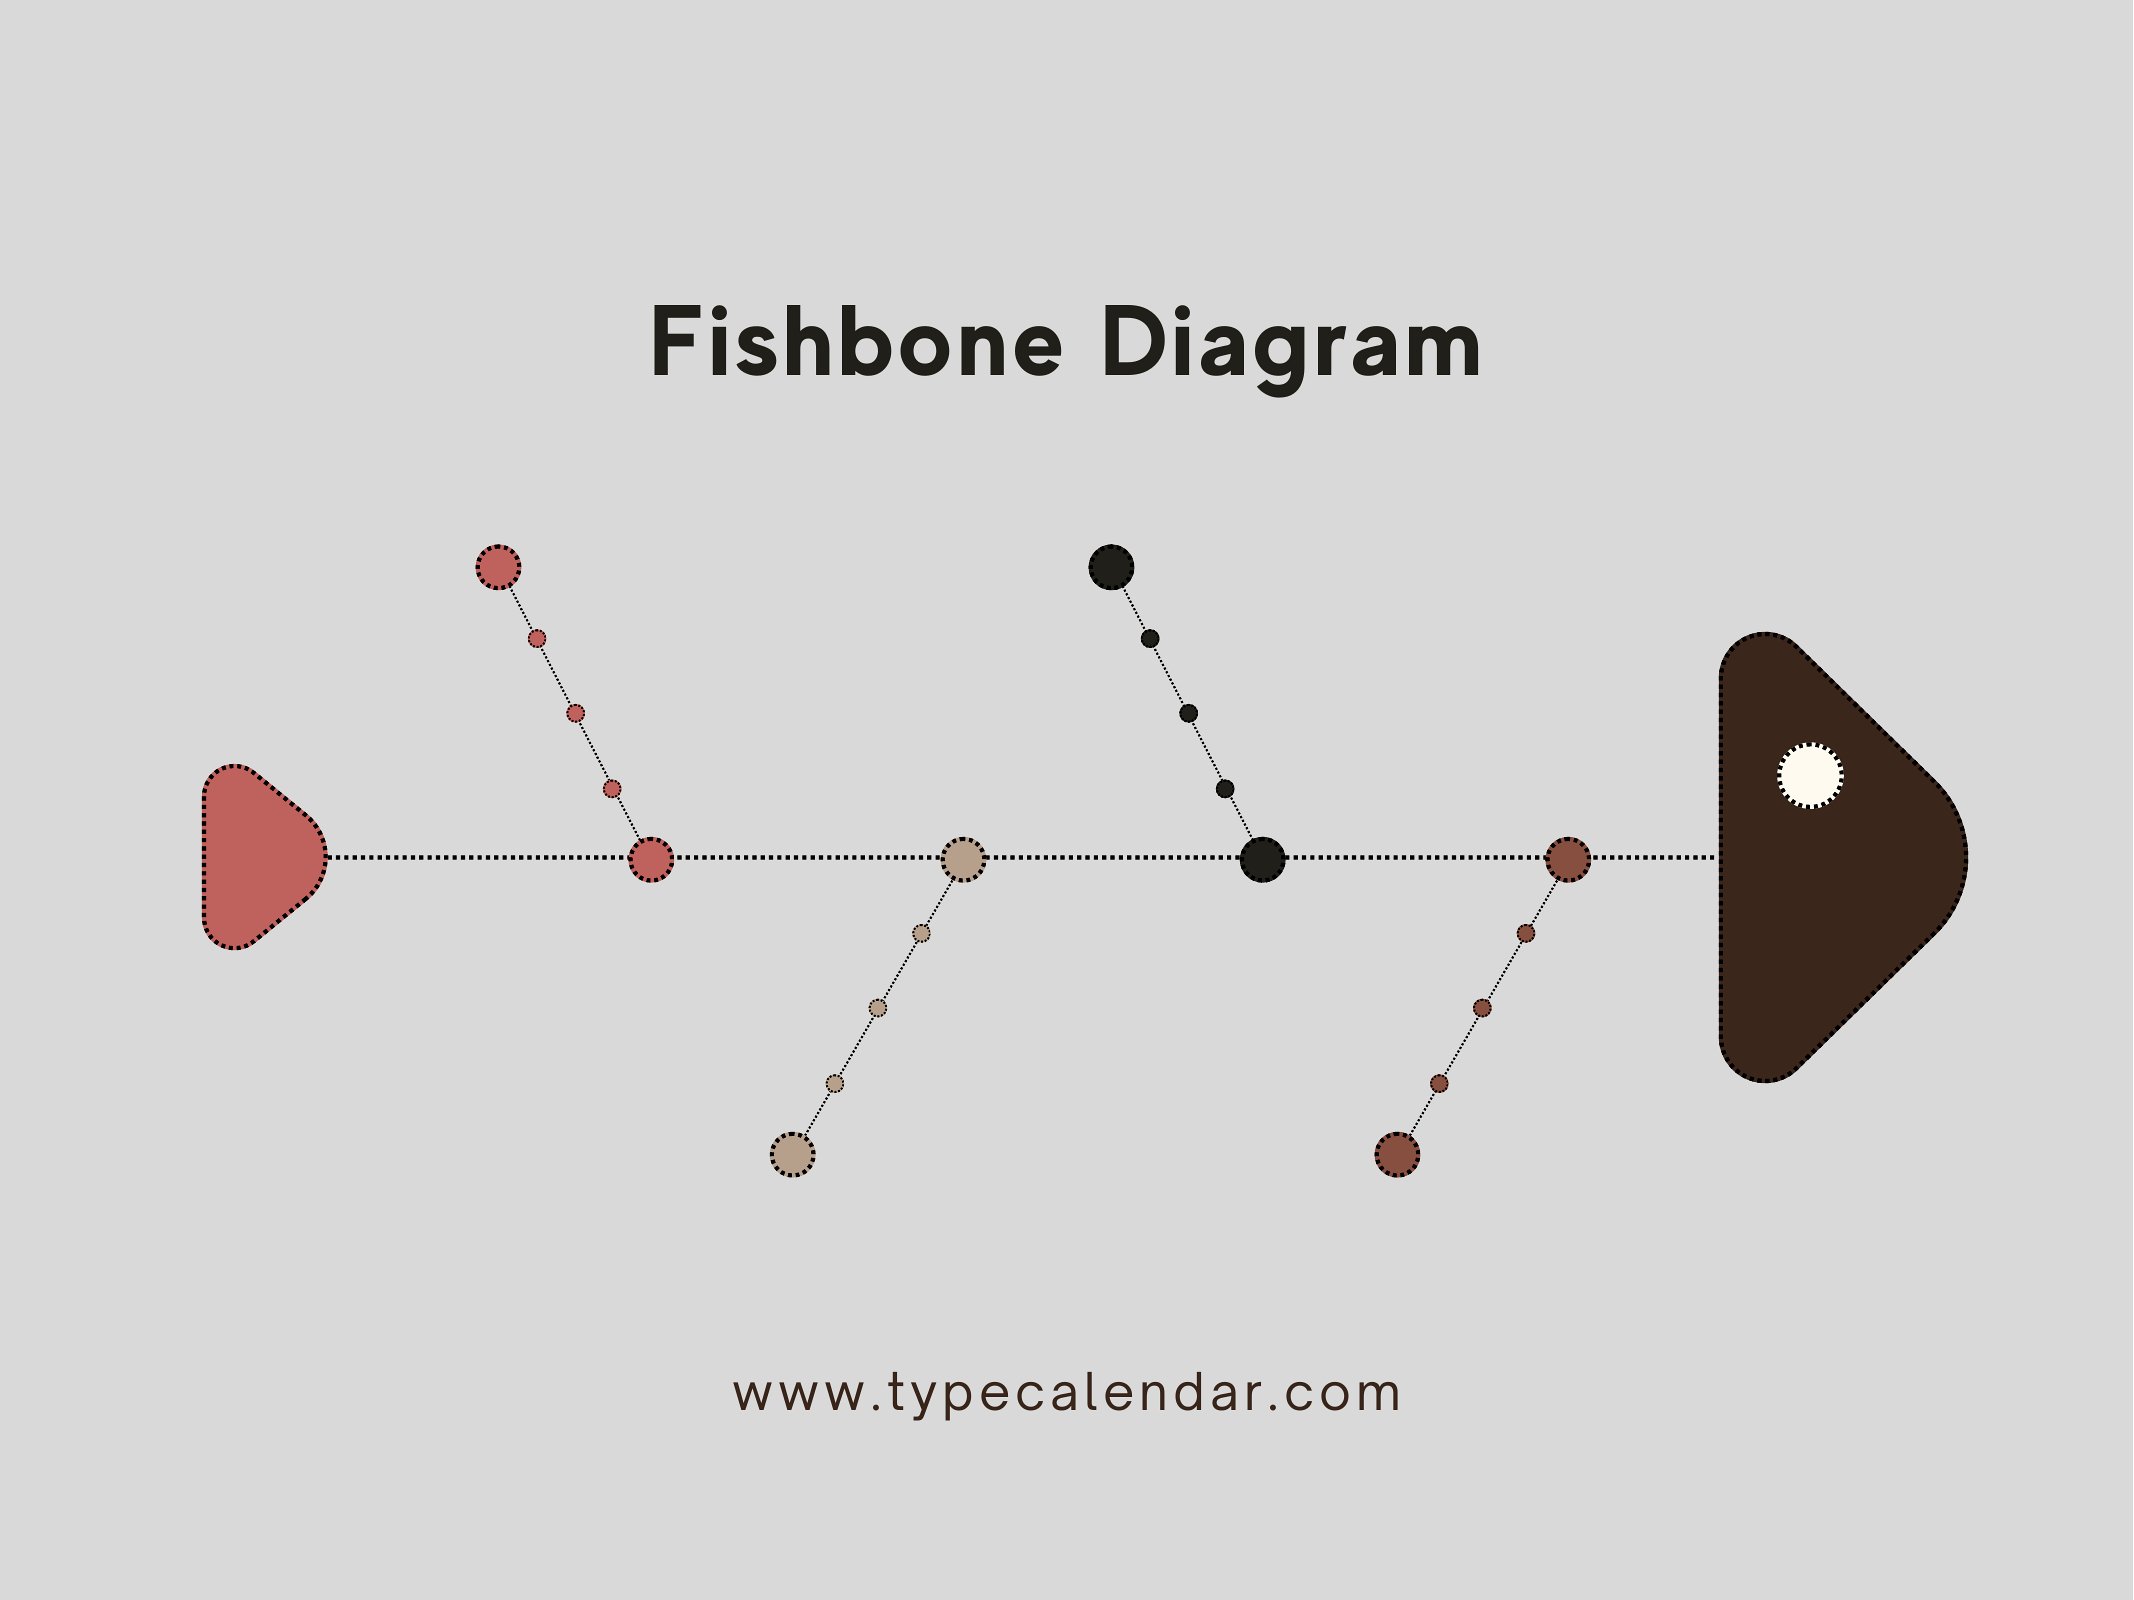

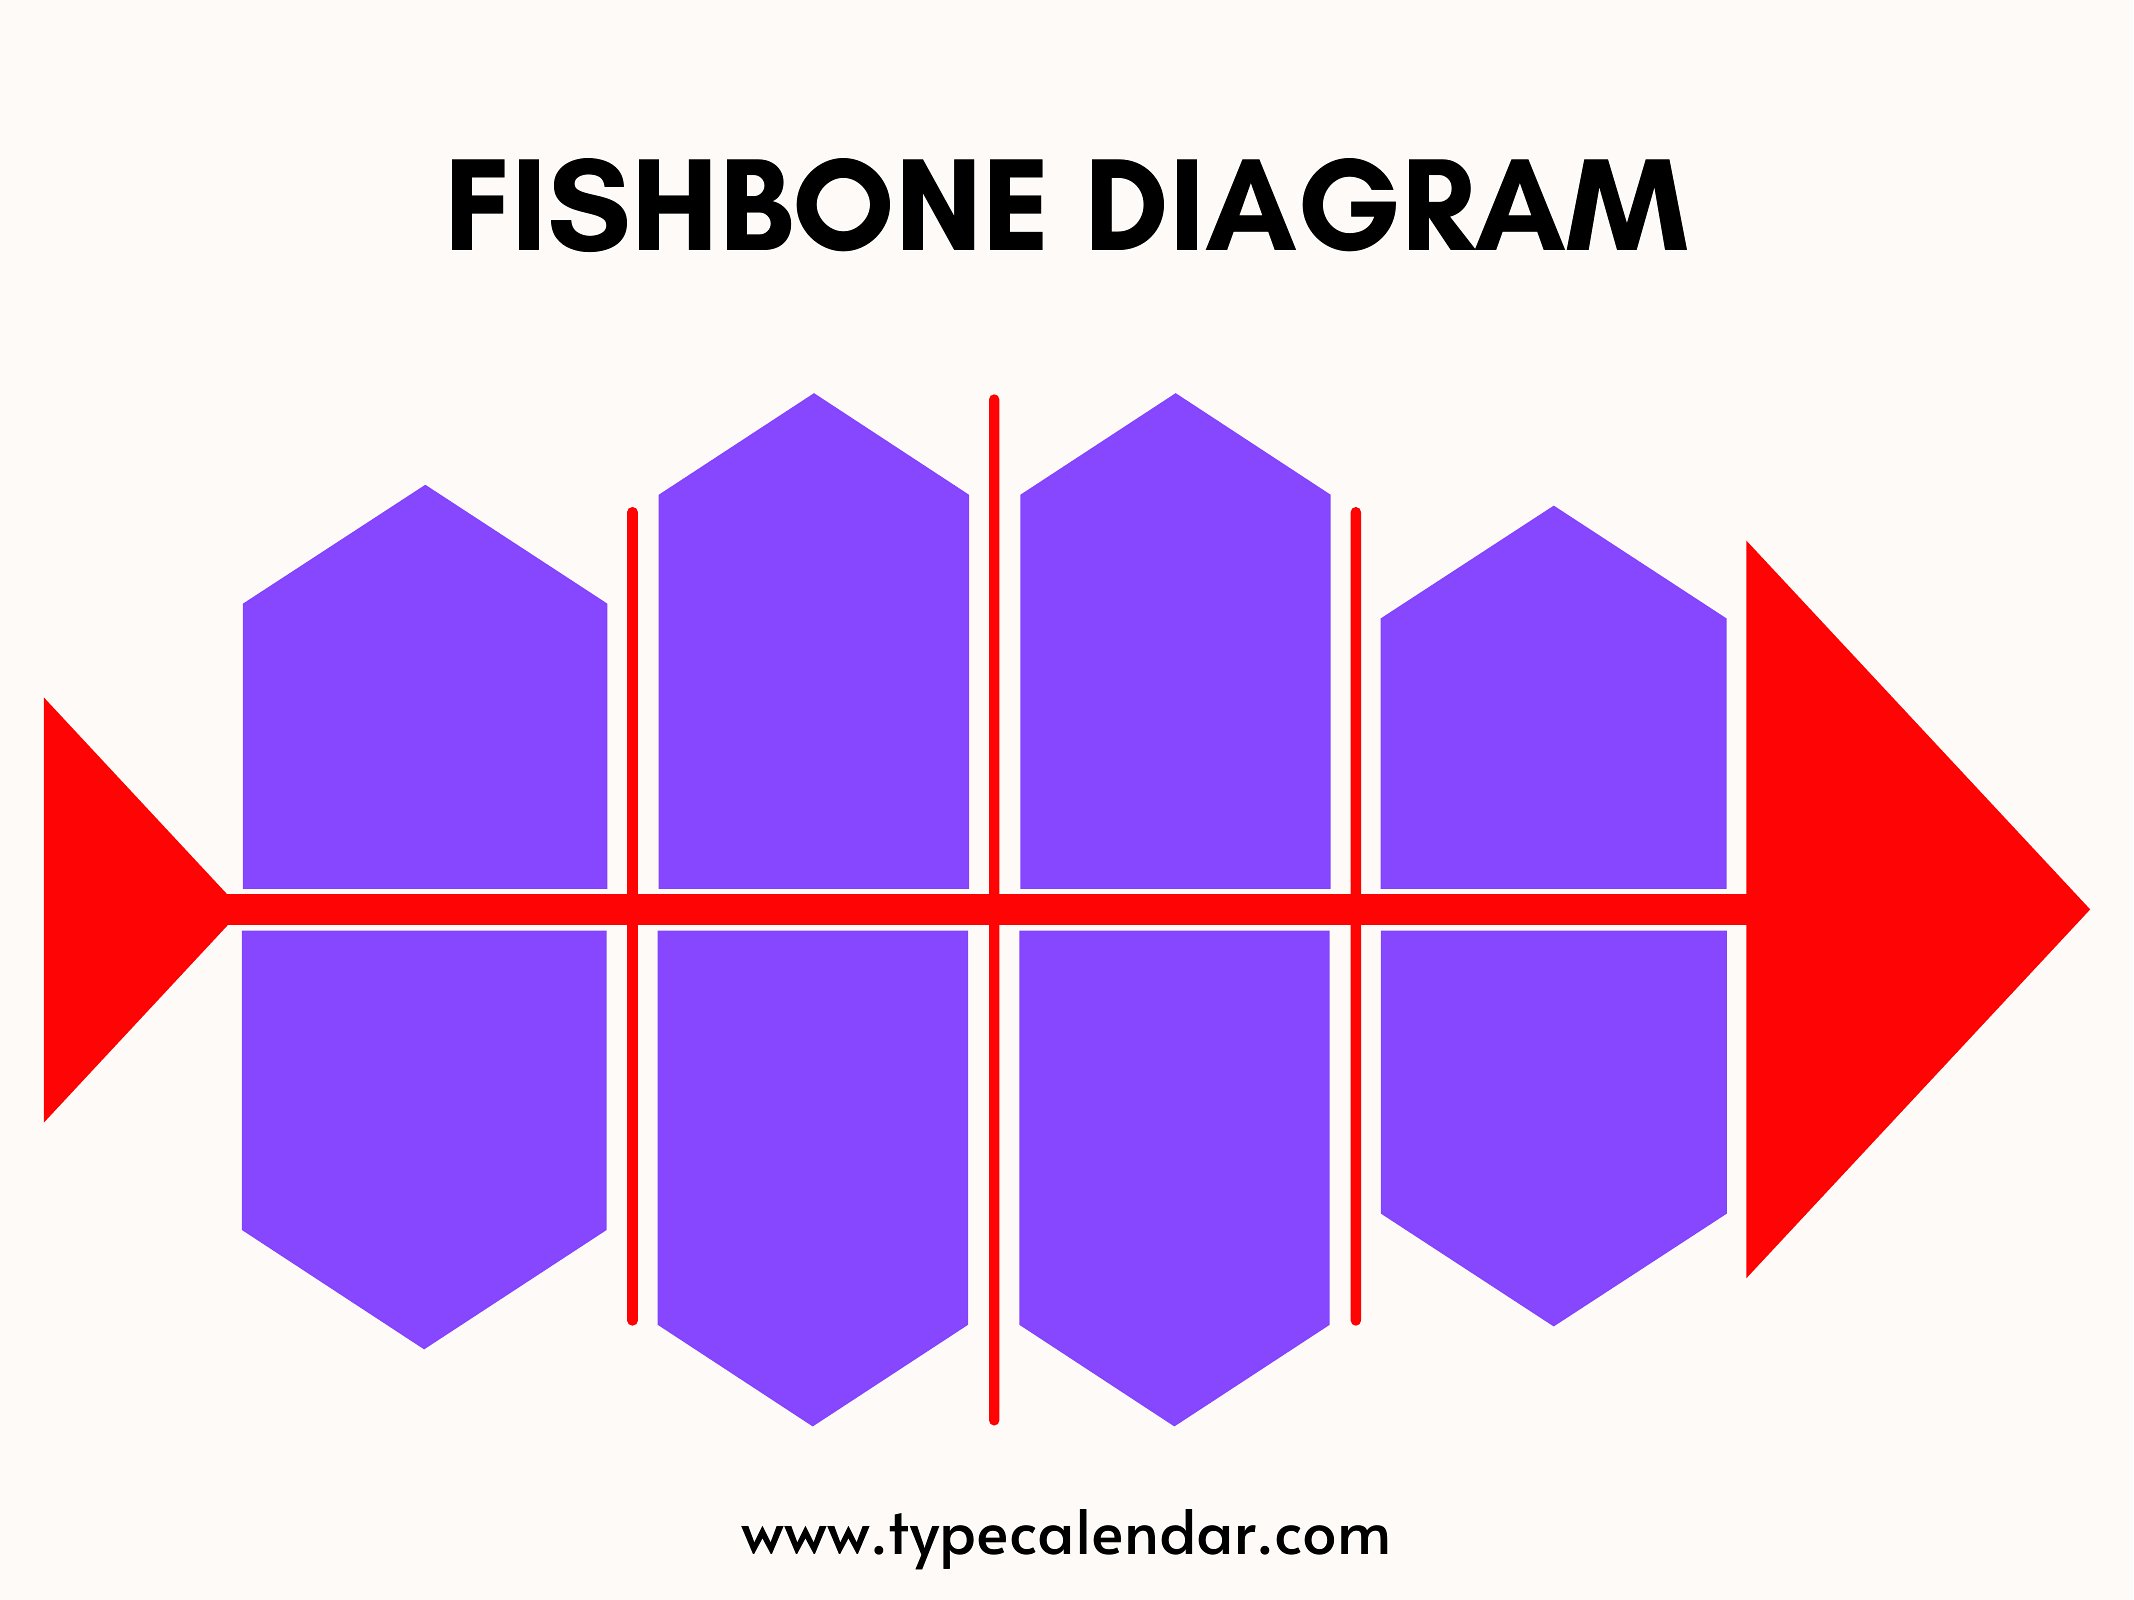

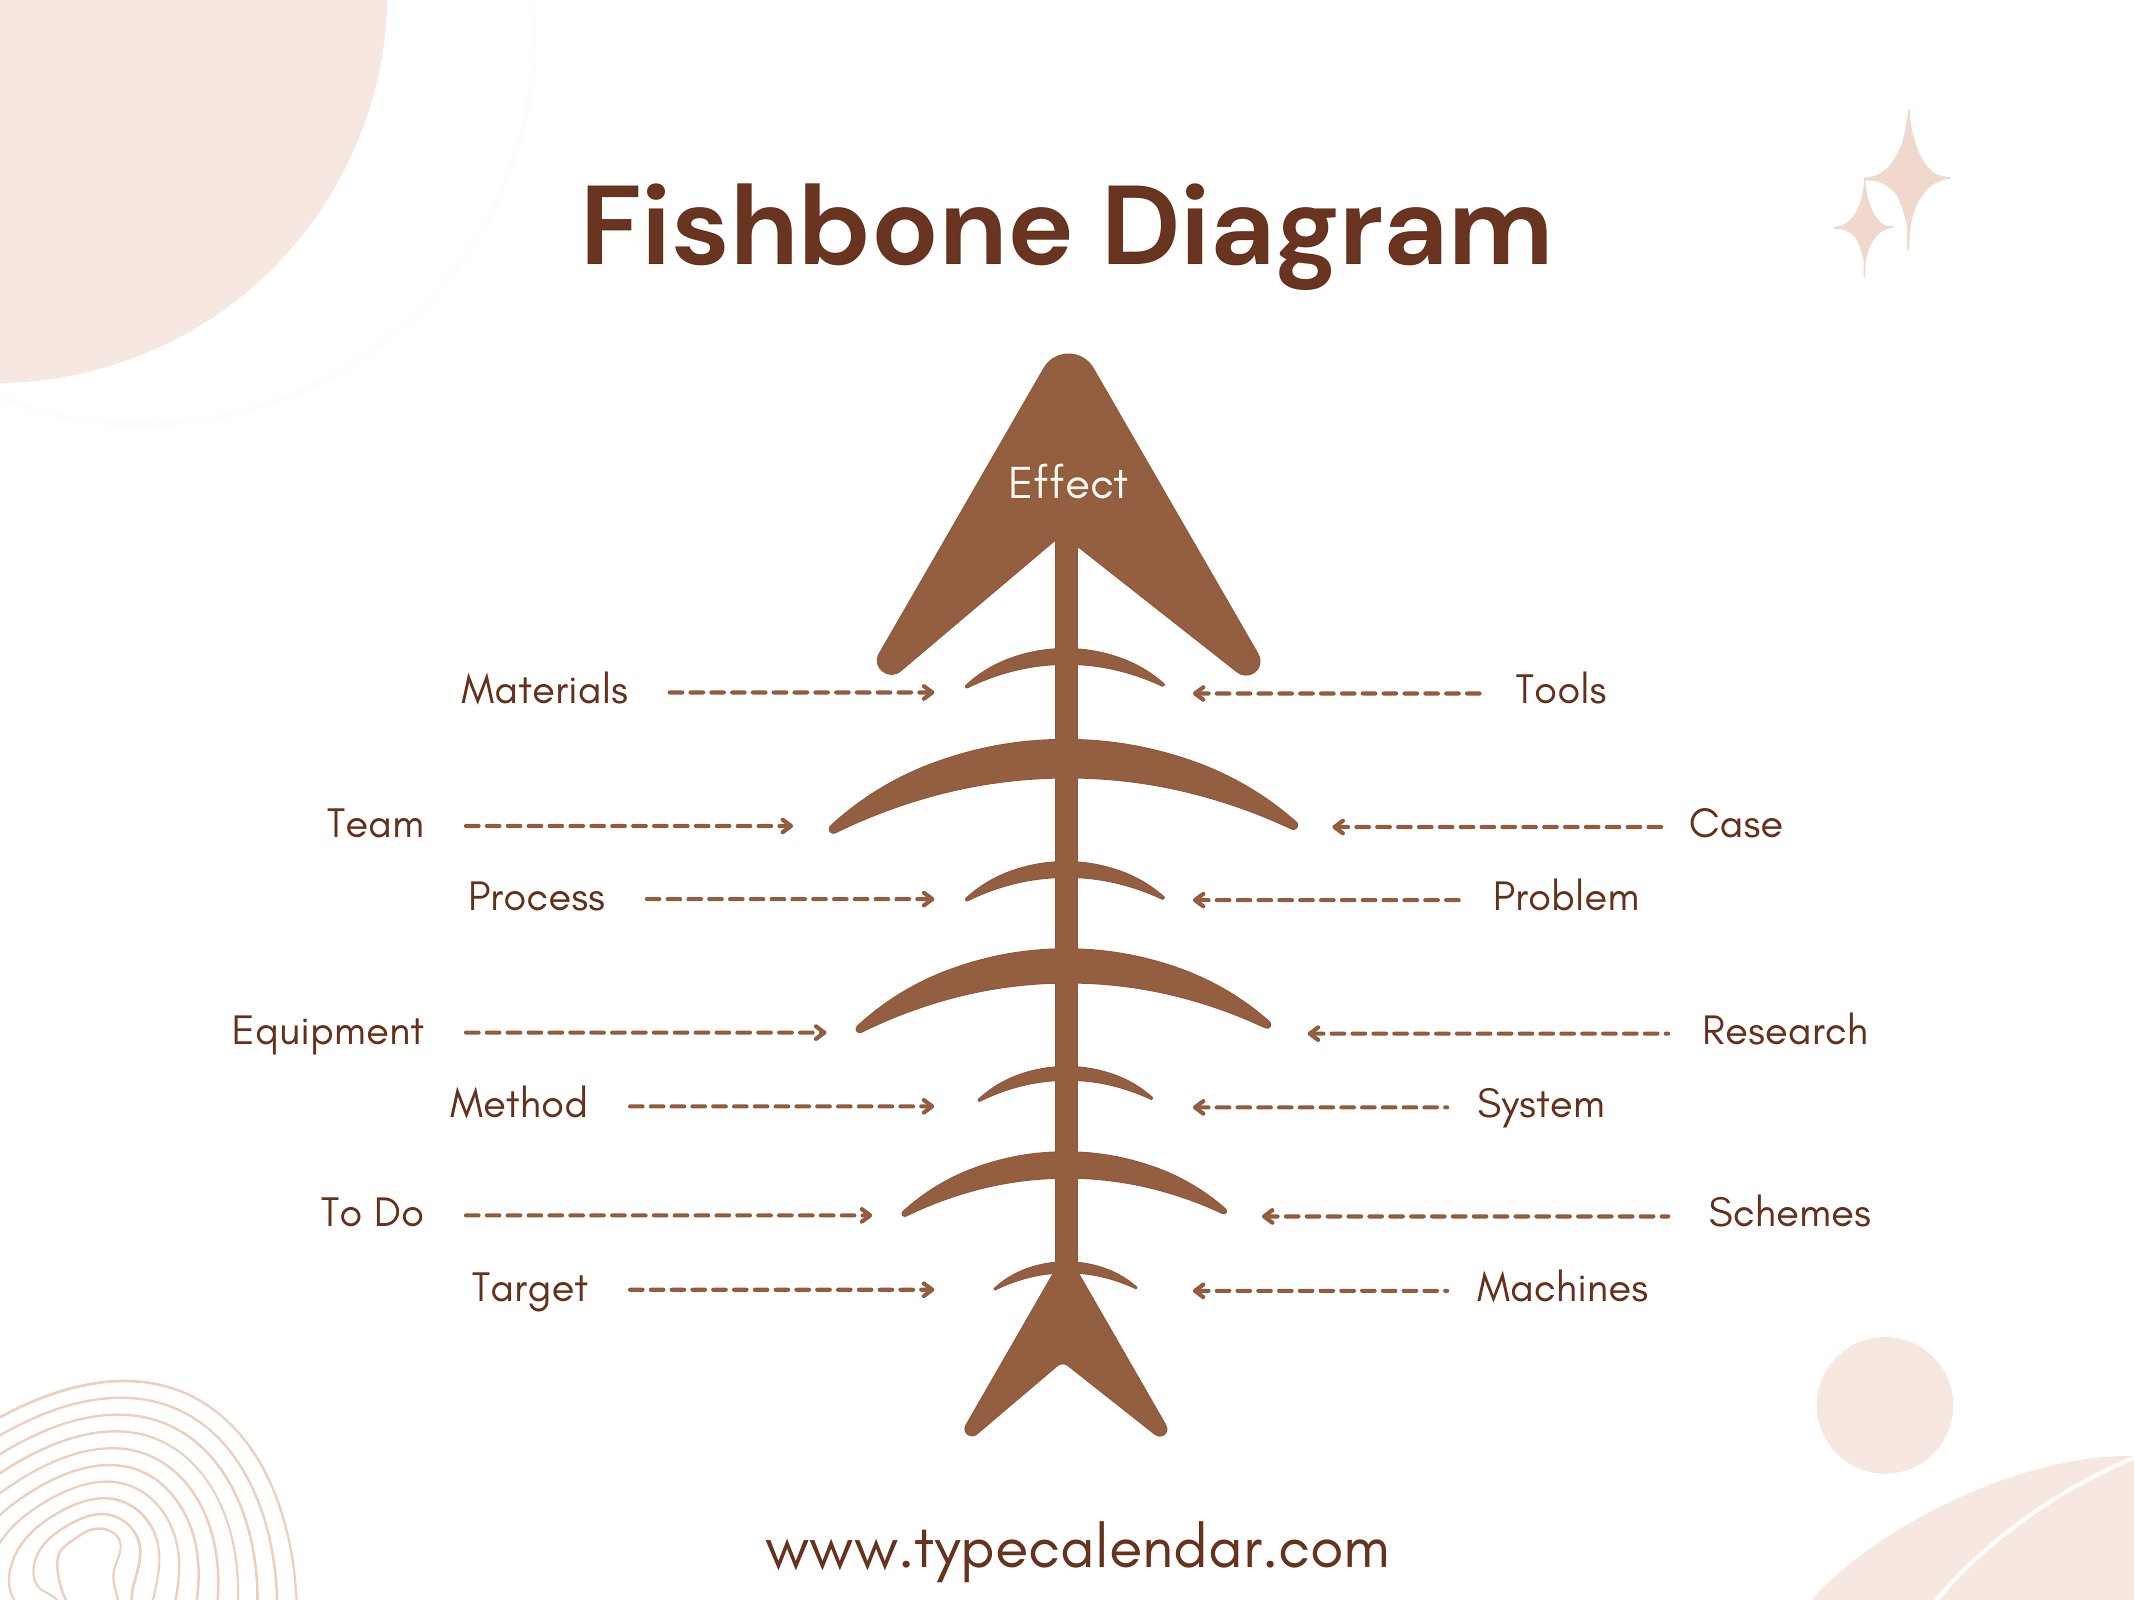
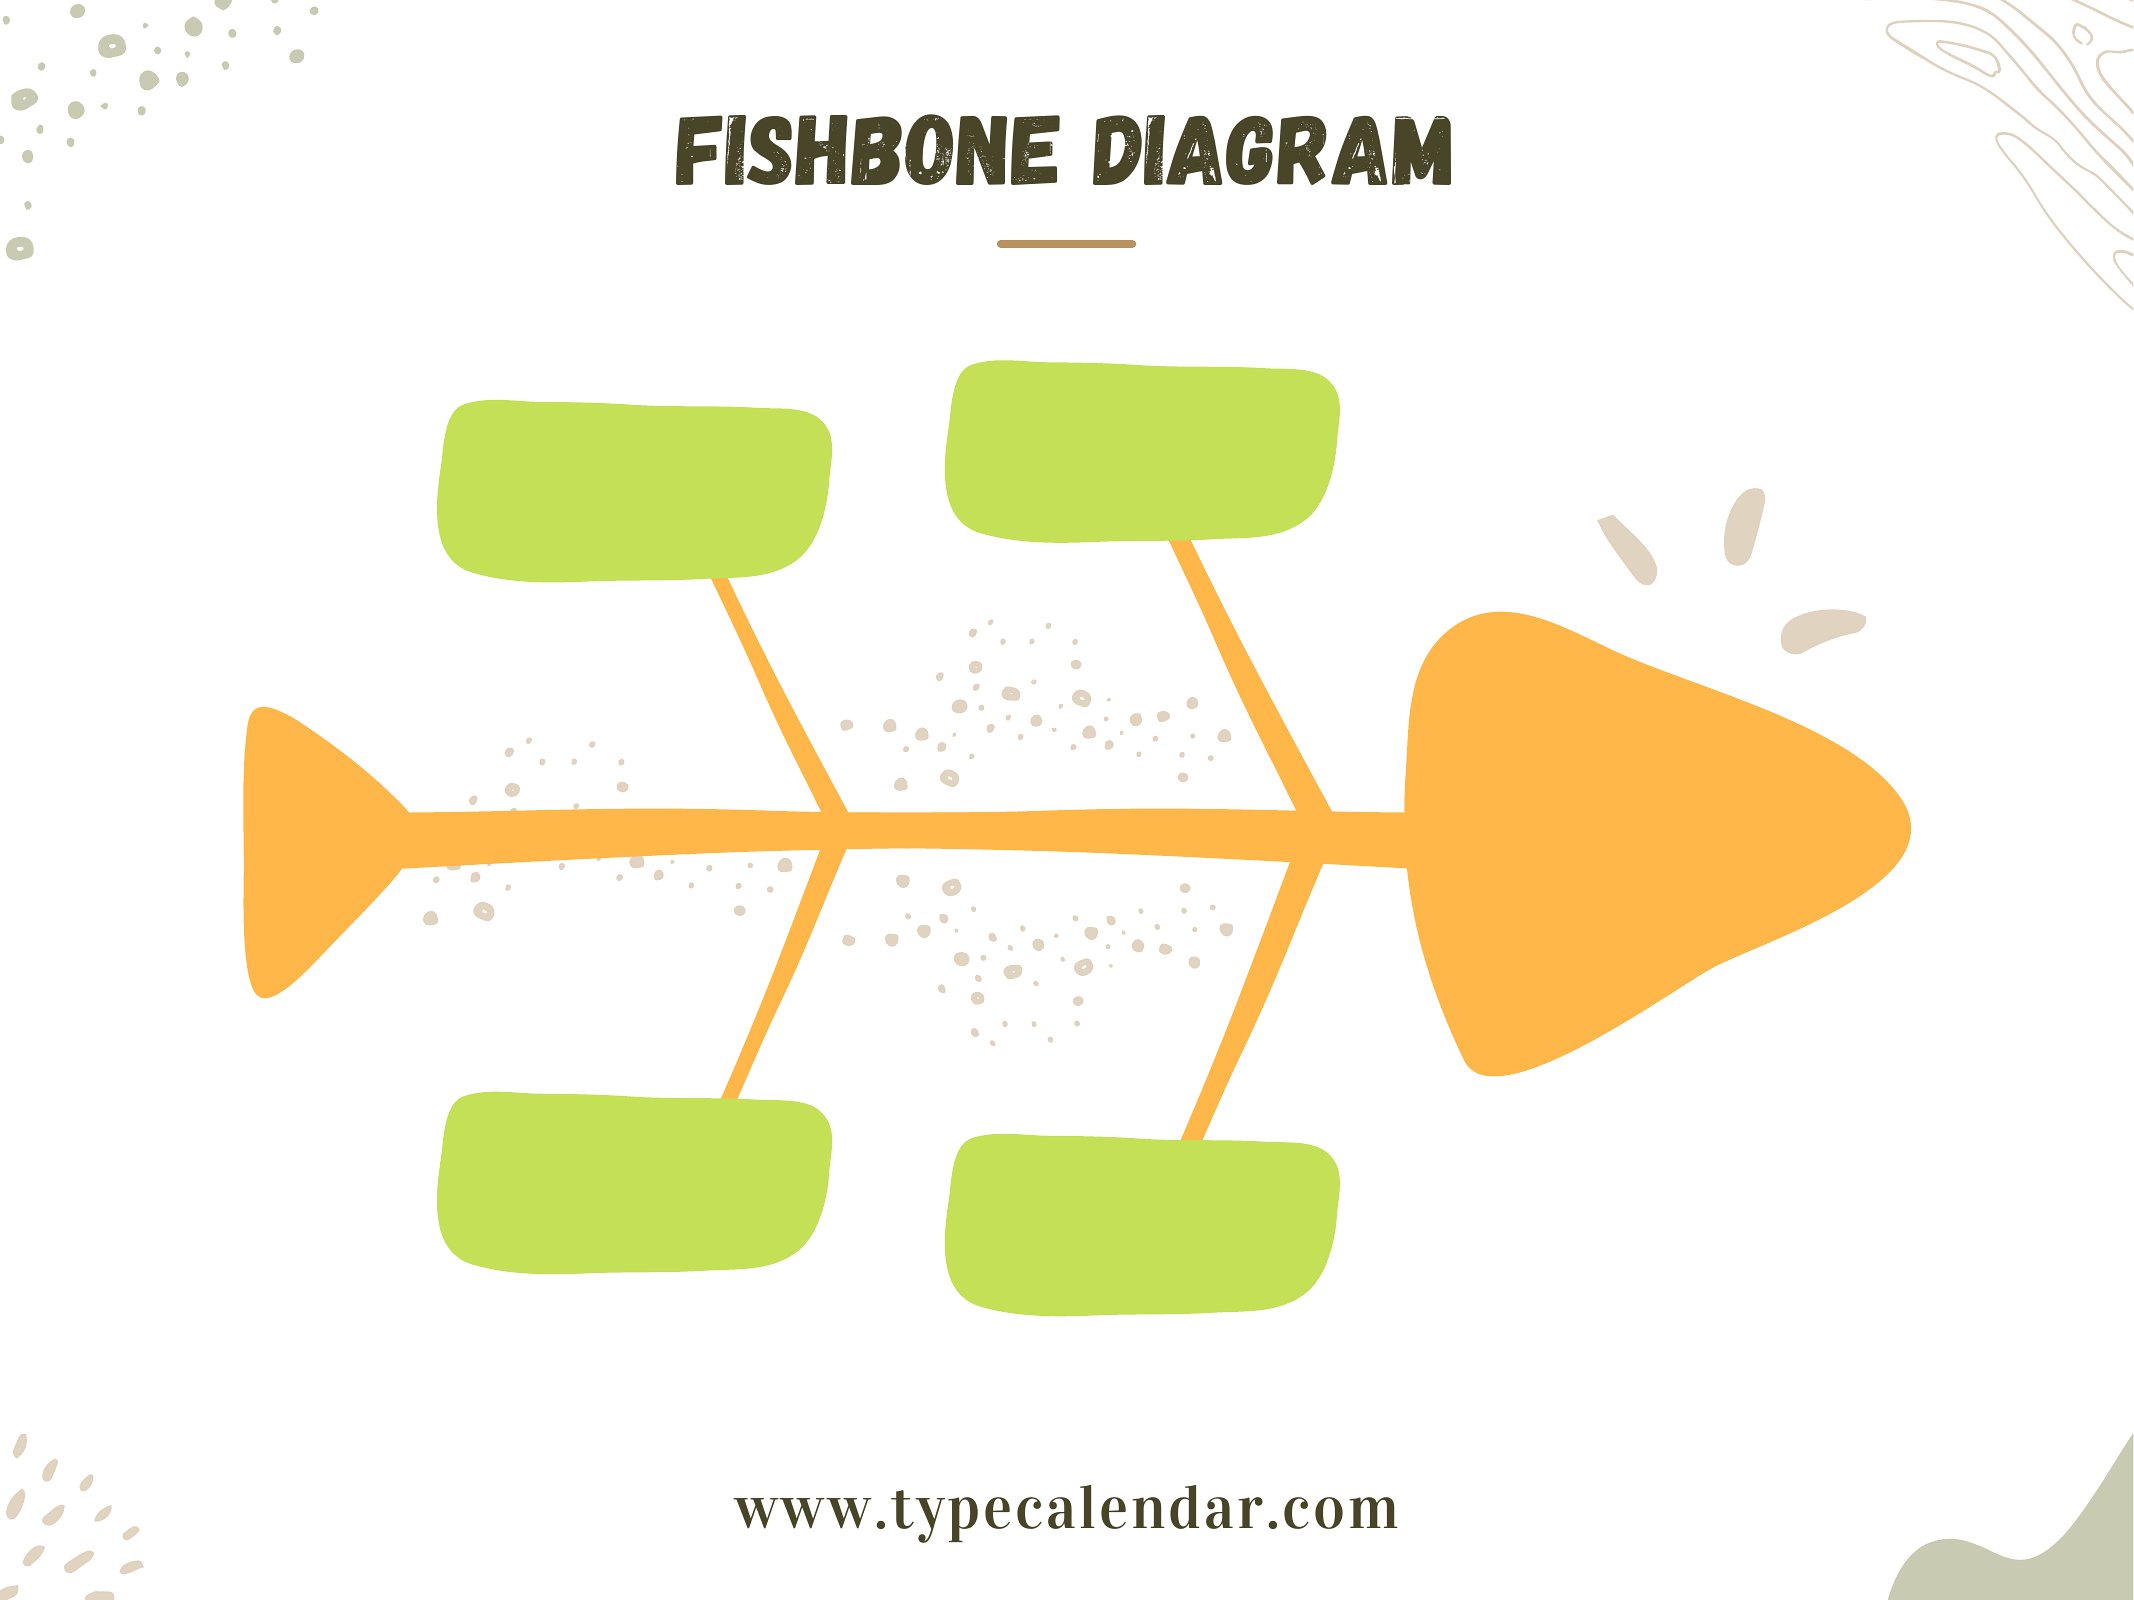
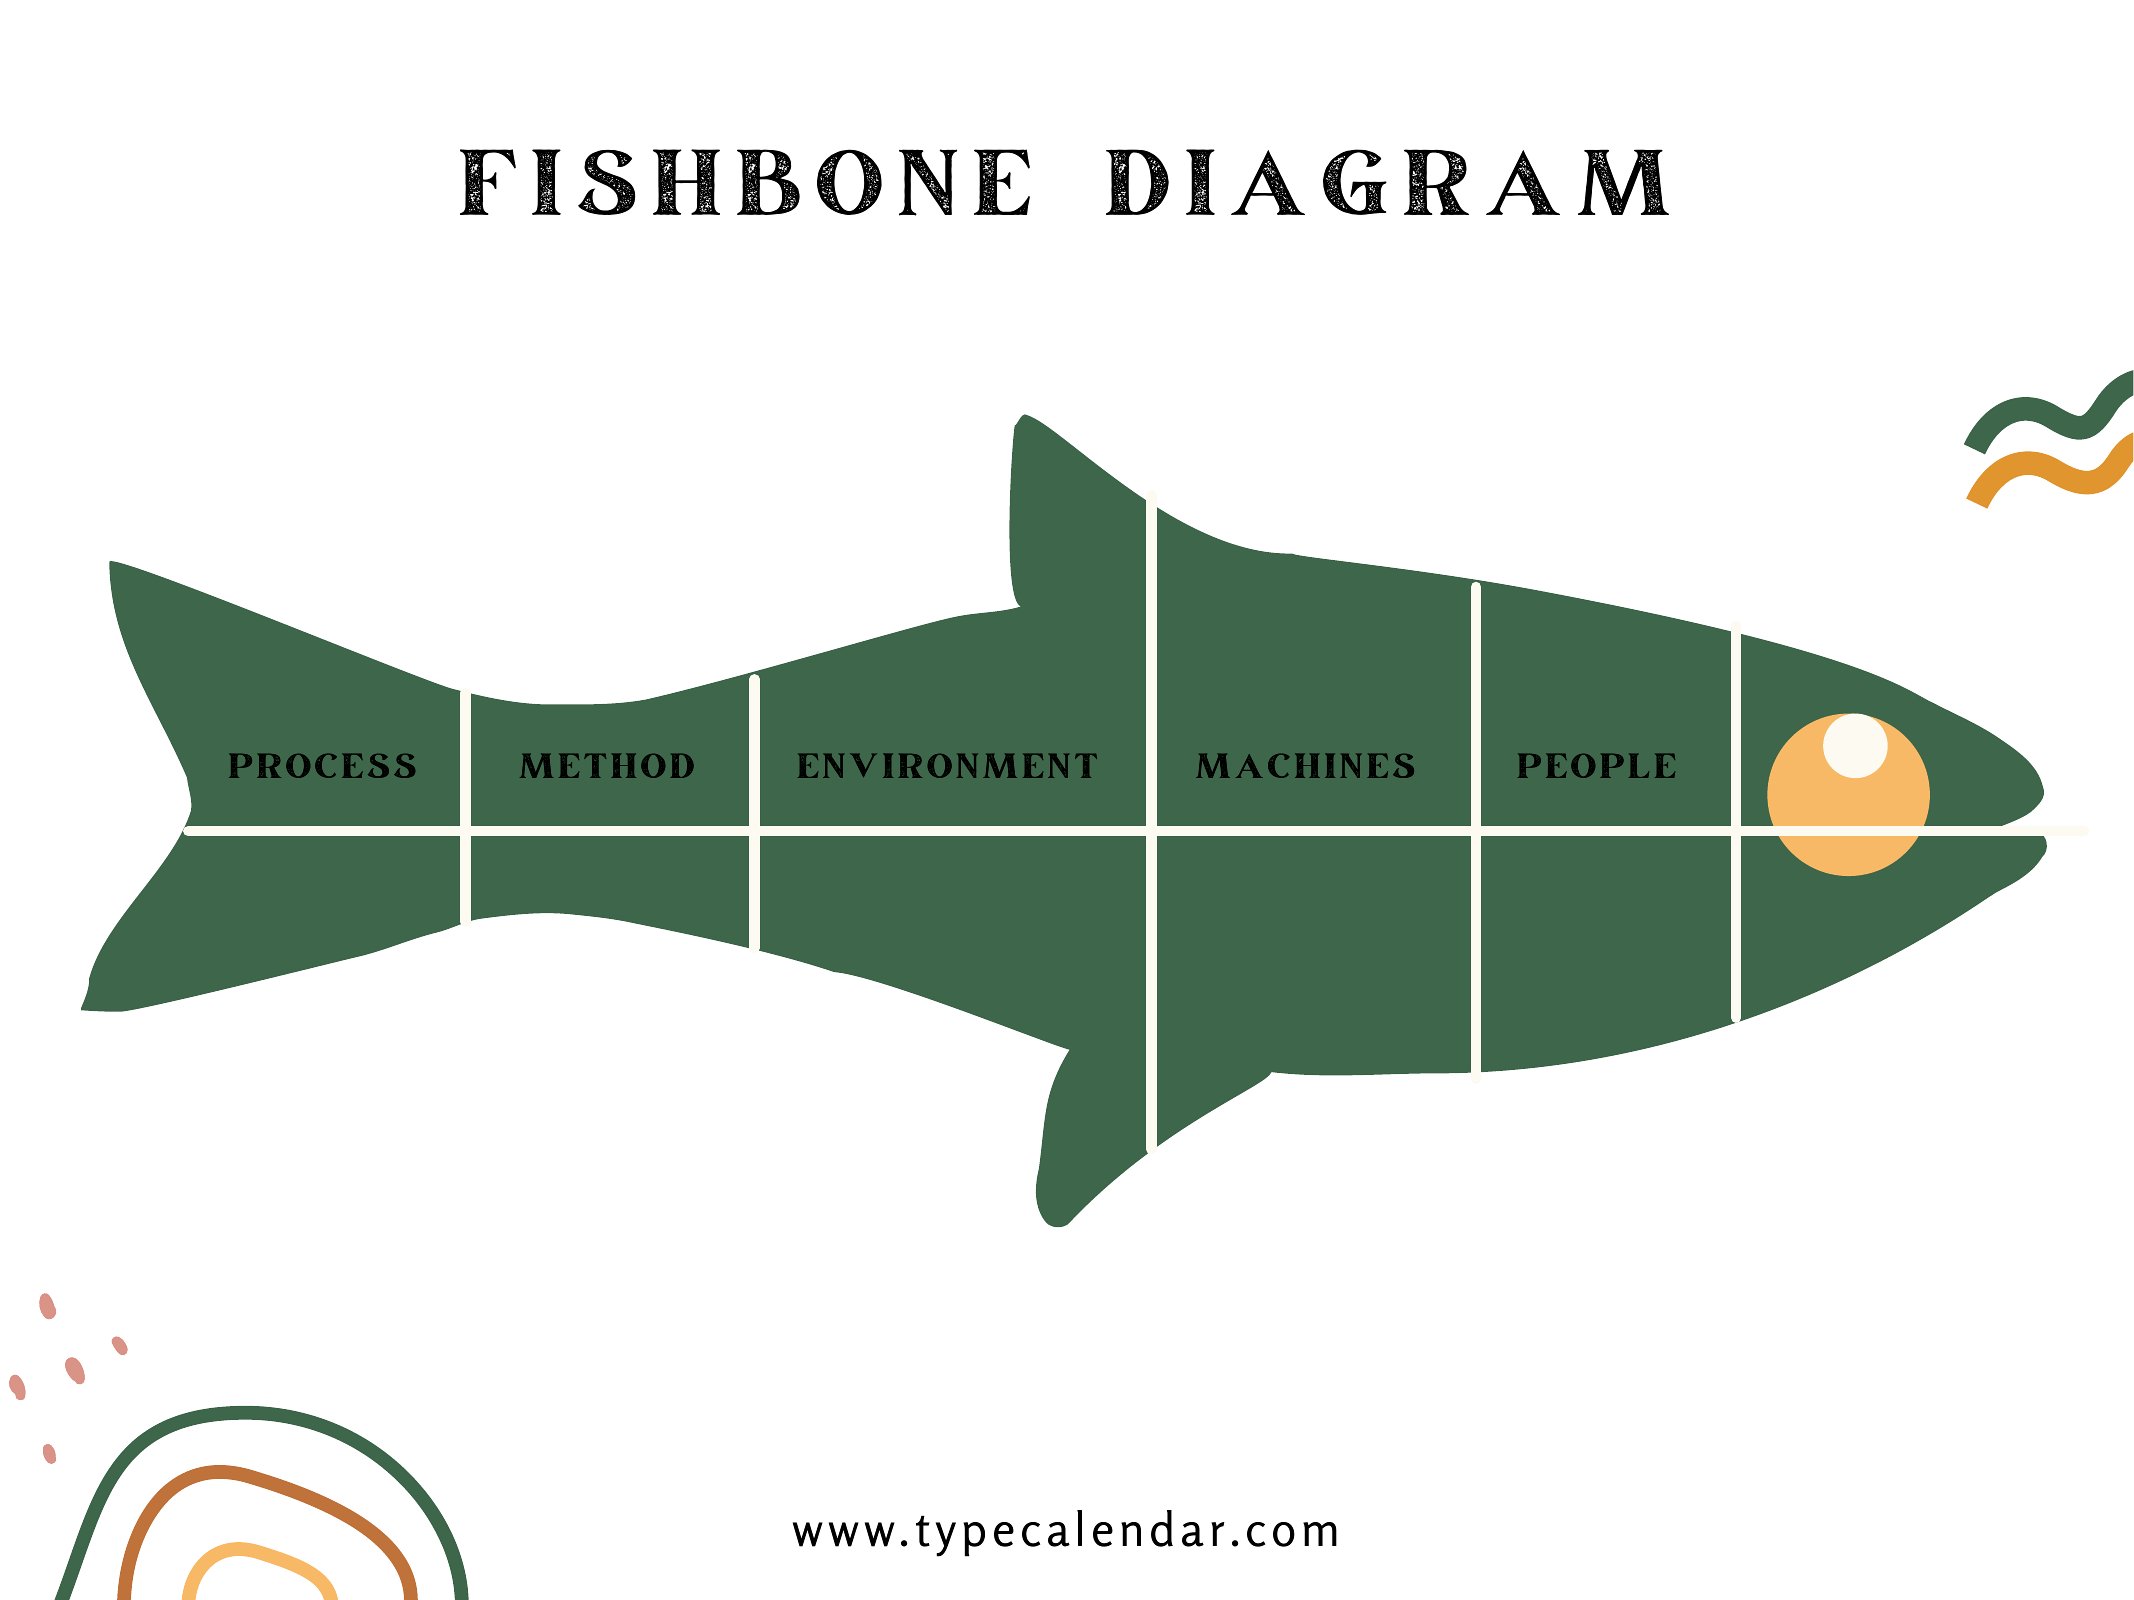
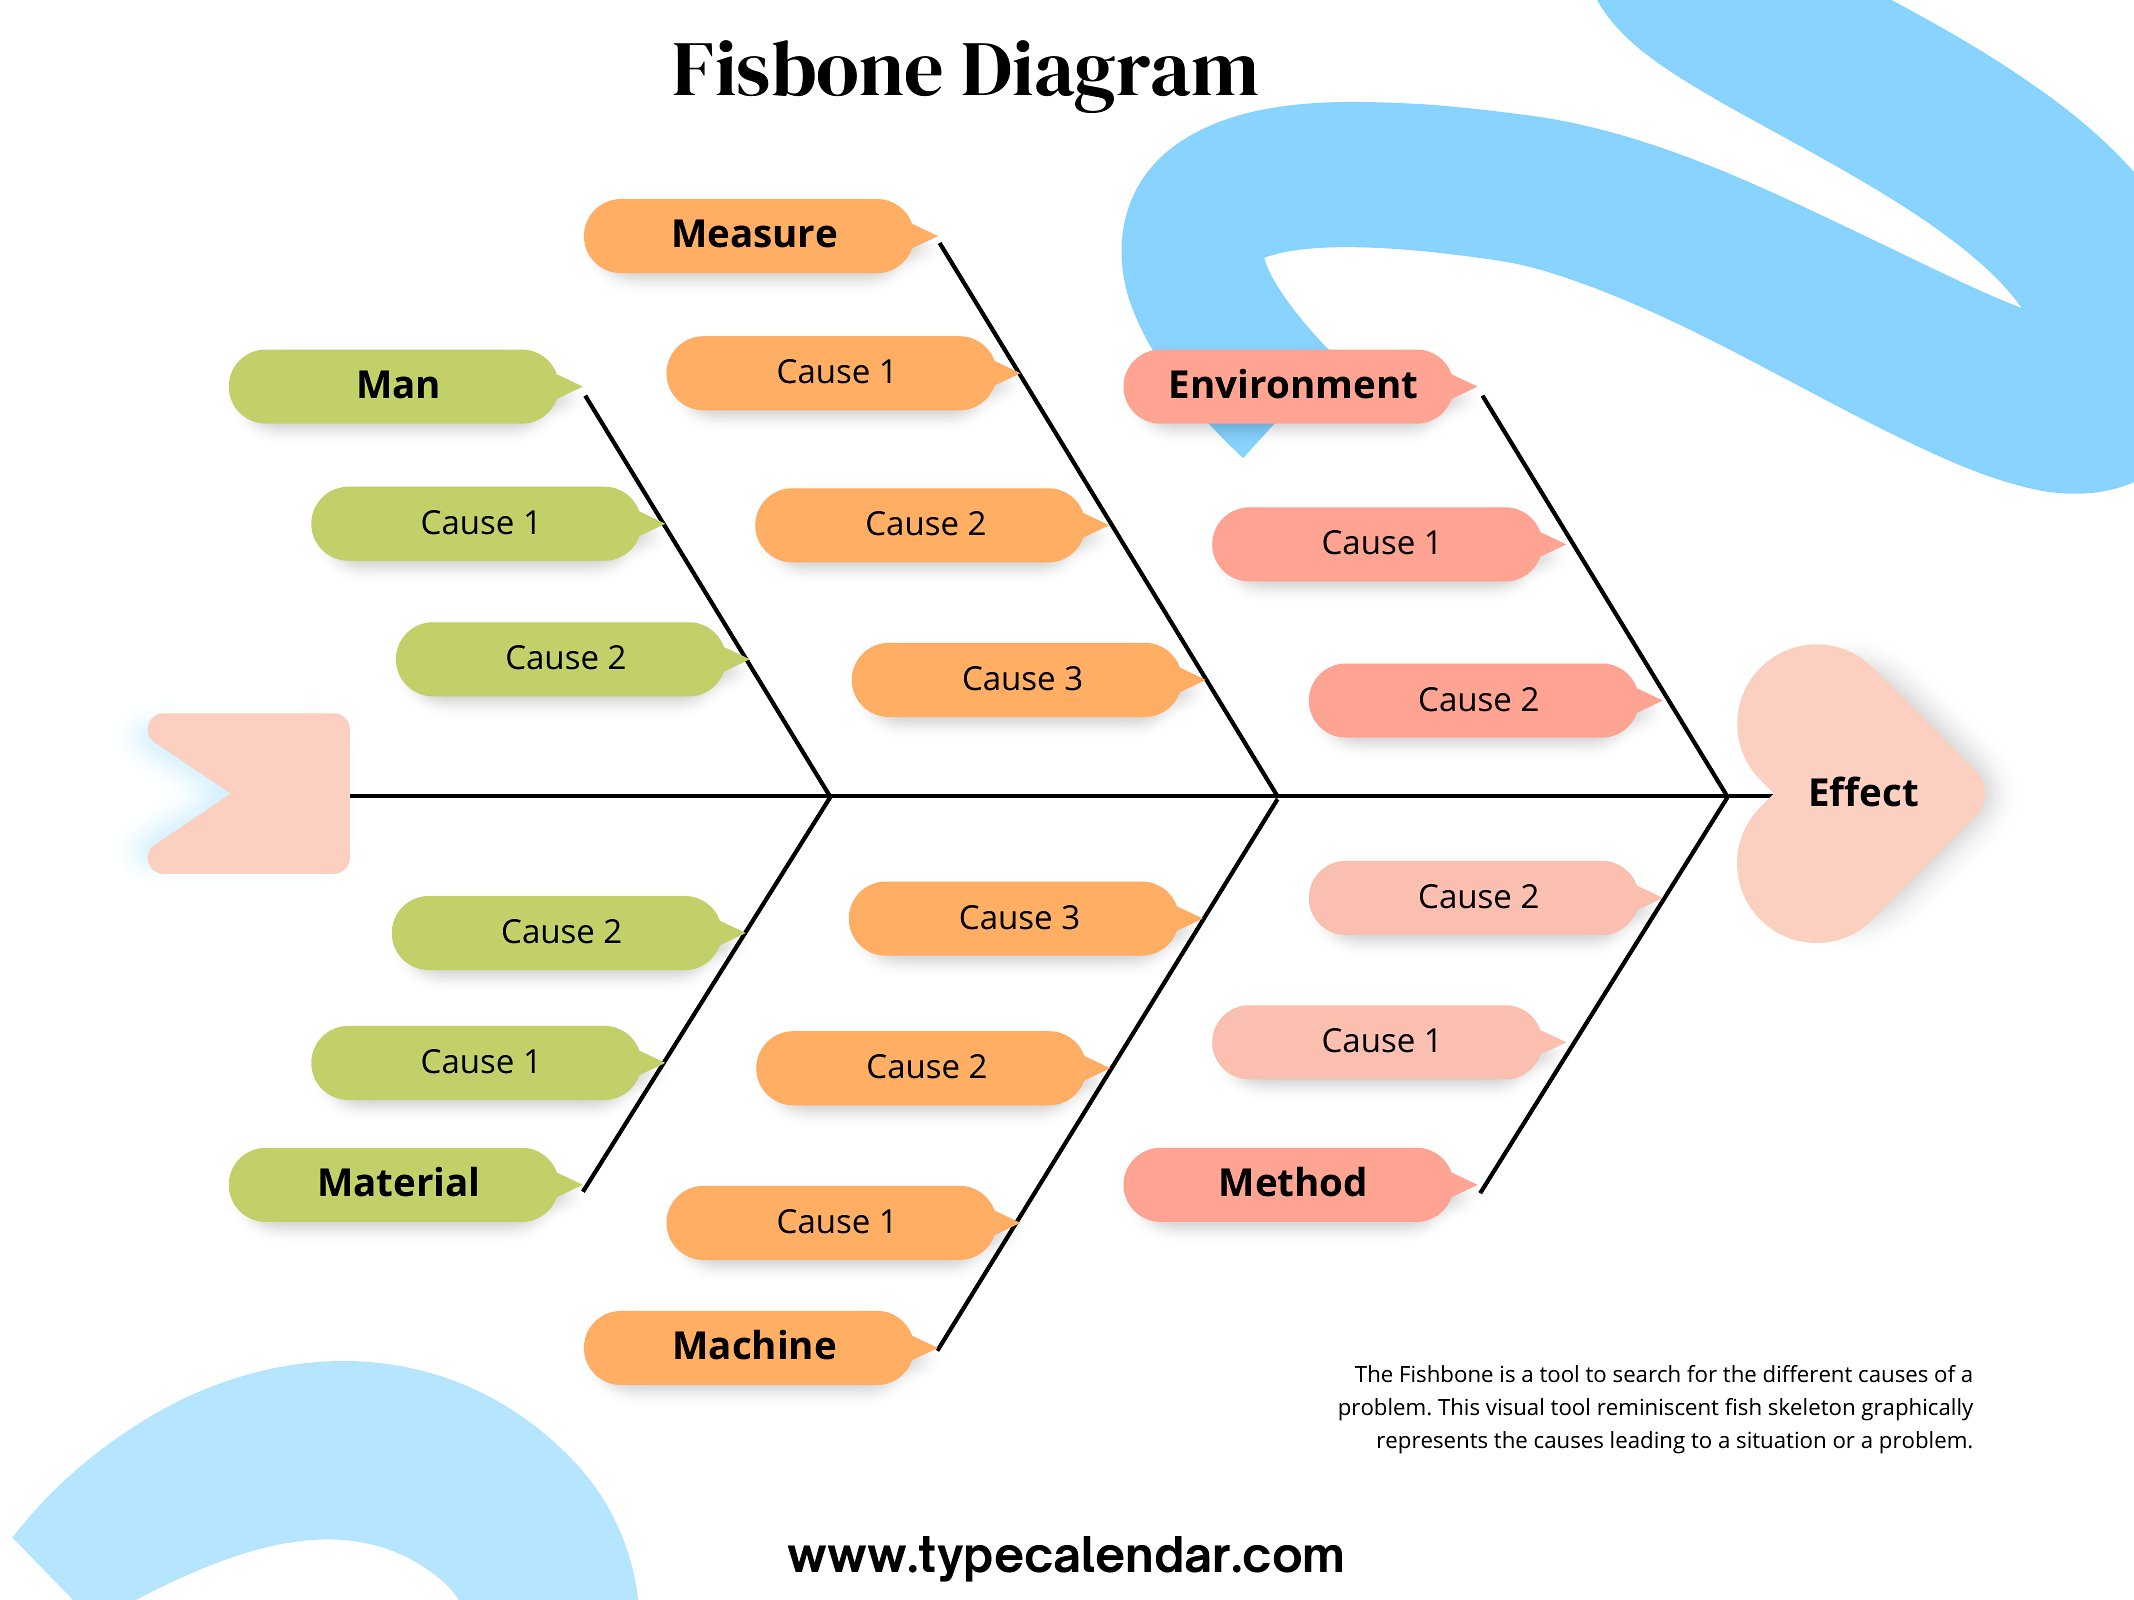
Fishbone Diagram
Frequently Asked Questions about Fishbone Diagram Templates
Are these Fishbone Diagram templates free to download?
Yes. Every Fishbone Diagram template in this collection is free to download from TemplateSpark. Just open the template you need, download it, and start editing right away — no subscription required to get started.
What file formats are available for Fishbone Diagram templates?
These Fishbone Diagram templates are available in PDF. Pick the format that matches your workflow — each download keeps the original layout so it looks right whether you open, print, or share it.
Can I edit or fill in these Fishbone Diagram PDF templates?
These Fishbone Diagram templates are print-ready PDFs. You can fill them in with any PDF reader or print and complete them by hand — ideal when you want a clean, consistent layout without changing the original design.
How many Fishbone Diagram templates can I choose from?
This page collects 21 Fishbone Diagram templates so you can compare styles and layouts in one place. Browse the options, open the one that fits your purpose best, and download it in your preferred format.
Can I use Fishbone Diagram templates for commercial purposes?
In most cases, yes — these Fishbone Diagram templates are intended for both personal and business use. Check the license note on the template before redistributing or reselling, and avoid sharing the source files as your own product.
What is a fishbone diagram and what is it used for?
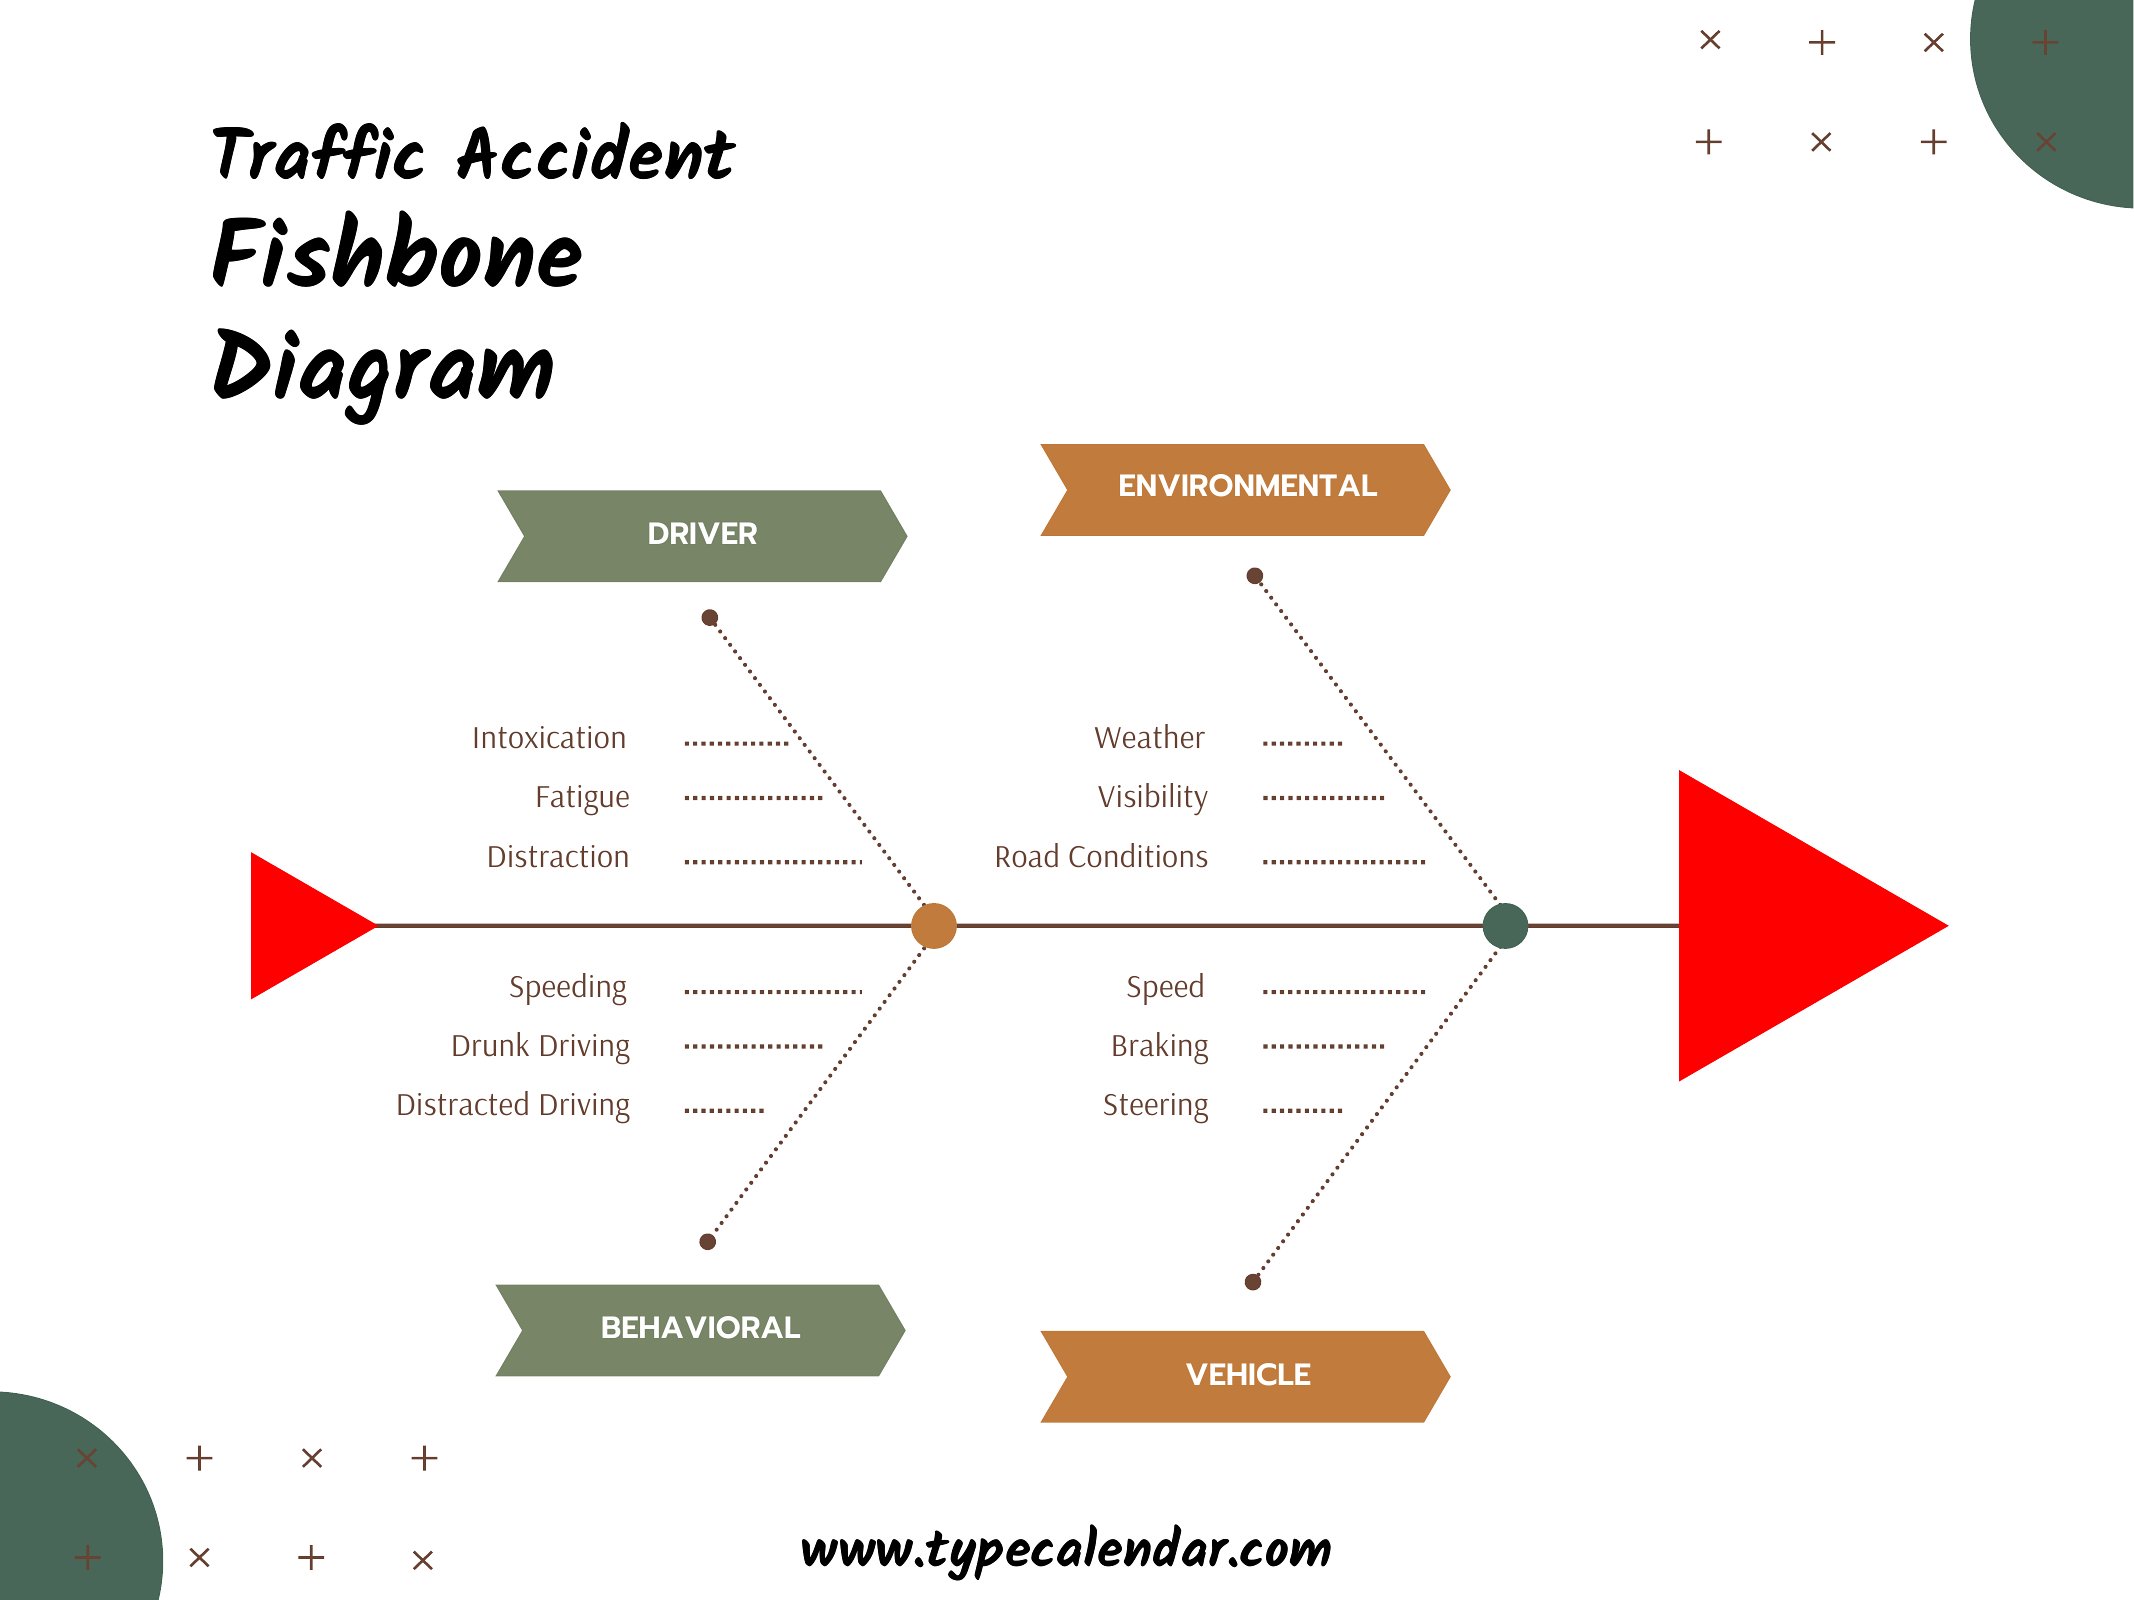
A fishbone diagram, also called an Ishikawa or cause-and-effect diagram, is a tool for identifying the root causes of a problem. The problem sits at the head, while branches represent categories of possible causes. Teams use it to organize brainstorming and trace issues to their underlying sources rather than symptoms.
What are the main categories used in a fishbone diagram?
Common categories include people, process, equipment, materials, environment, and management, often summarized as the six Ms in manufacturing. Service or other contexts may adapt these. Each category forms a main branch, and contributing causes are added as smaller bones to explore where the problem may originate.
How do you create a fishbone diagram for root cause analysis?
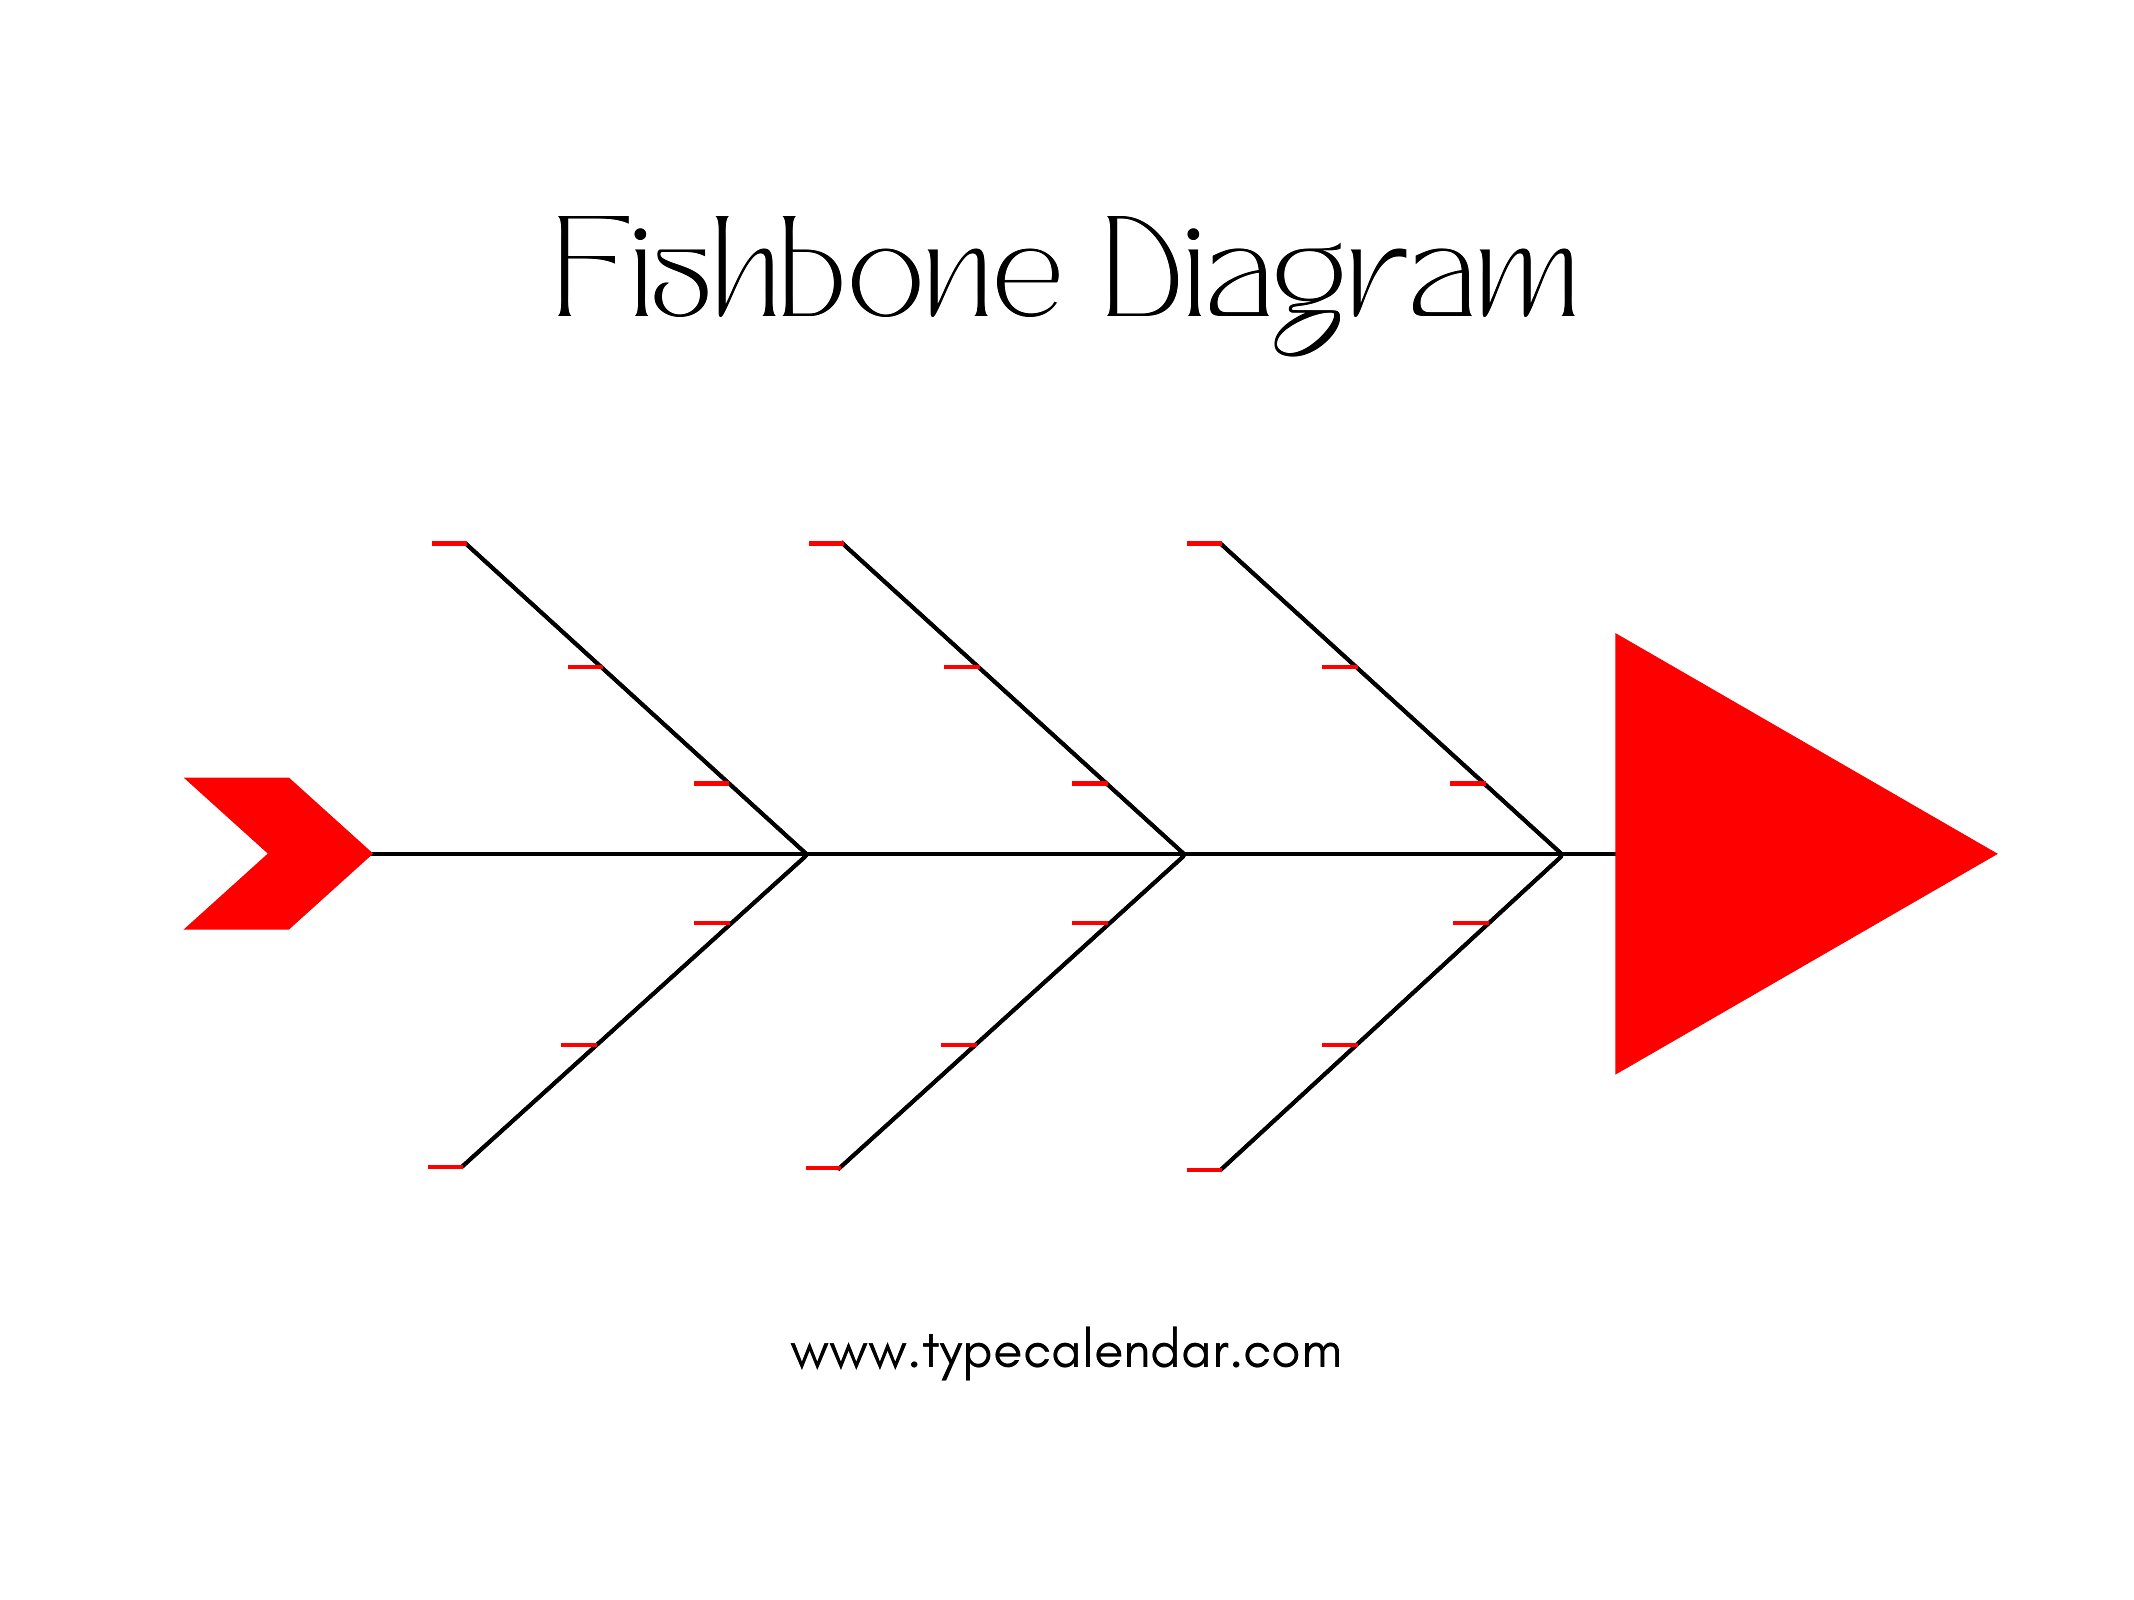
Write the problem at the head of the diagram, then draw the spine and main category branches. For each category, brainstorm possible causes and add them as sub-branches, asking why repeatedly to dig deeper. Review the completed diagram to identify the most likely root causes to investigate and address.
Comments
Join the conversation
Sign in to share your thoughts and leave a comment on this resource.