Free Break-Even Analysis Templates (Word, Excel, PDF)
AnalysisTemplates


FAQ
Can these templates account for multiple revenue streams or product lines?
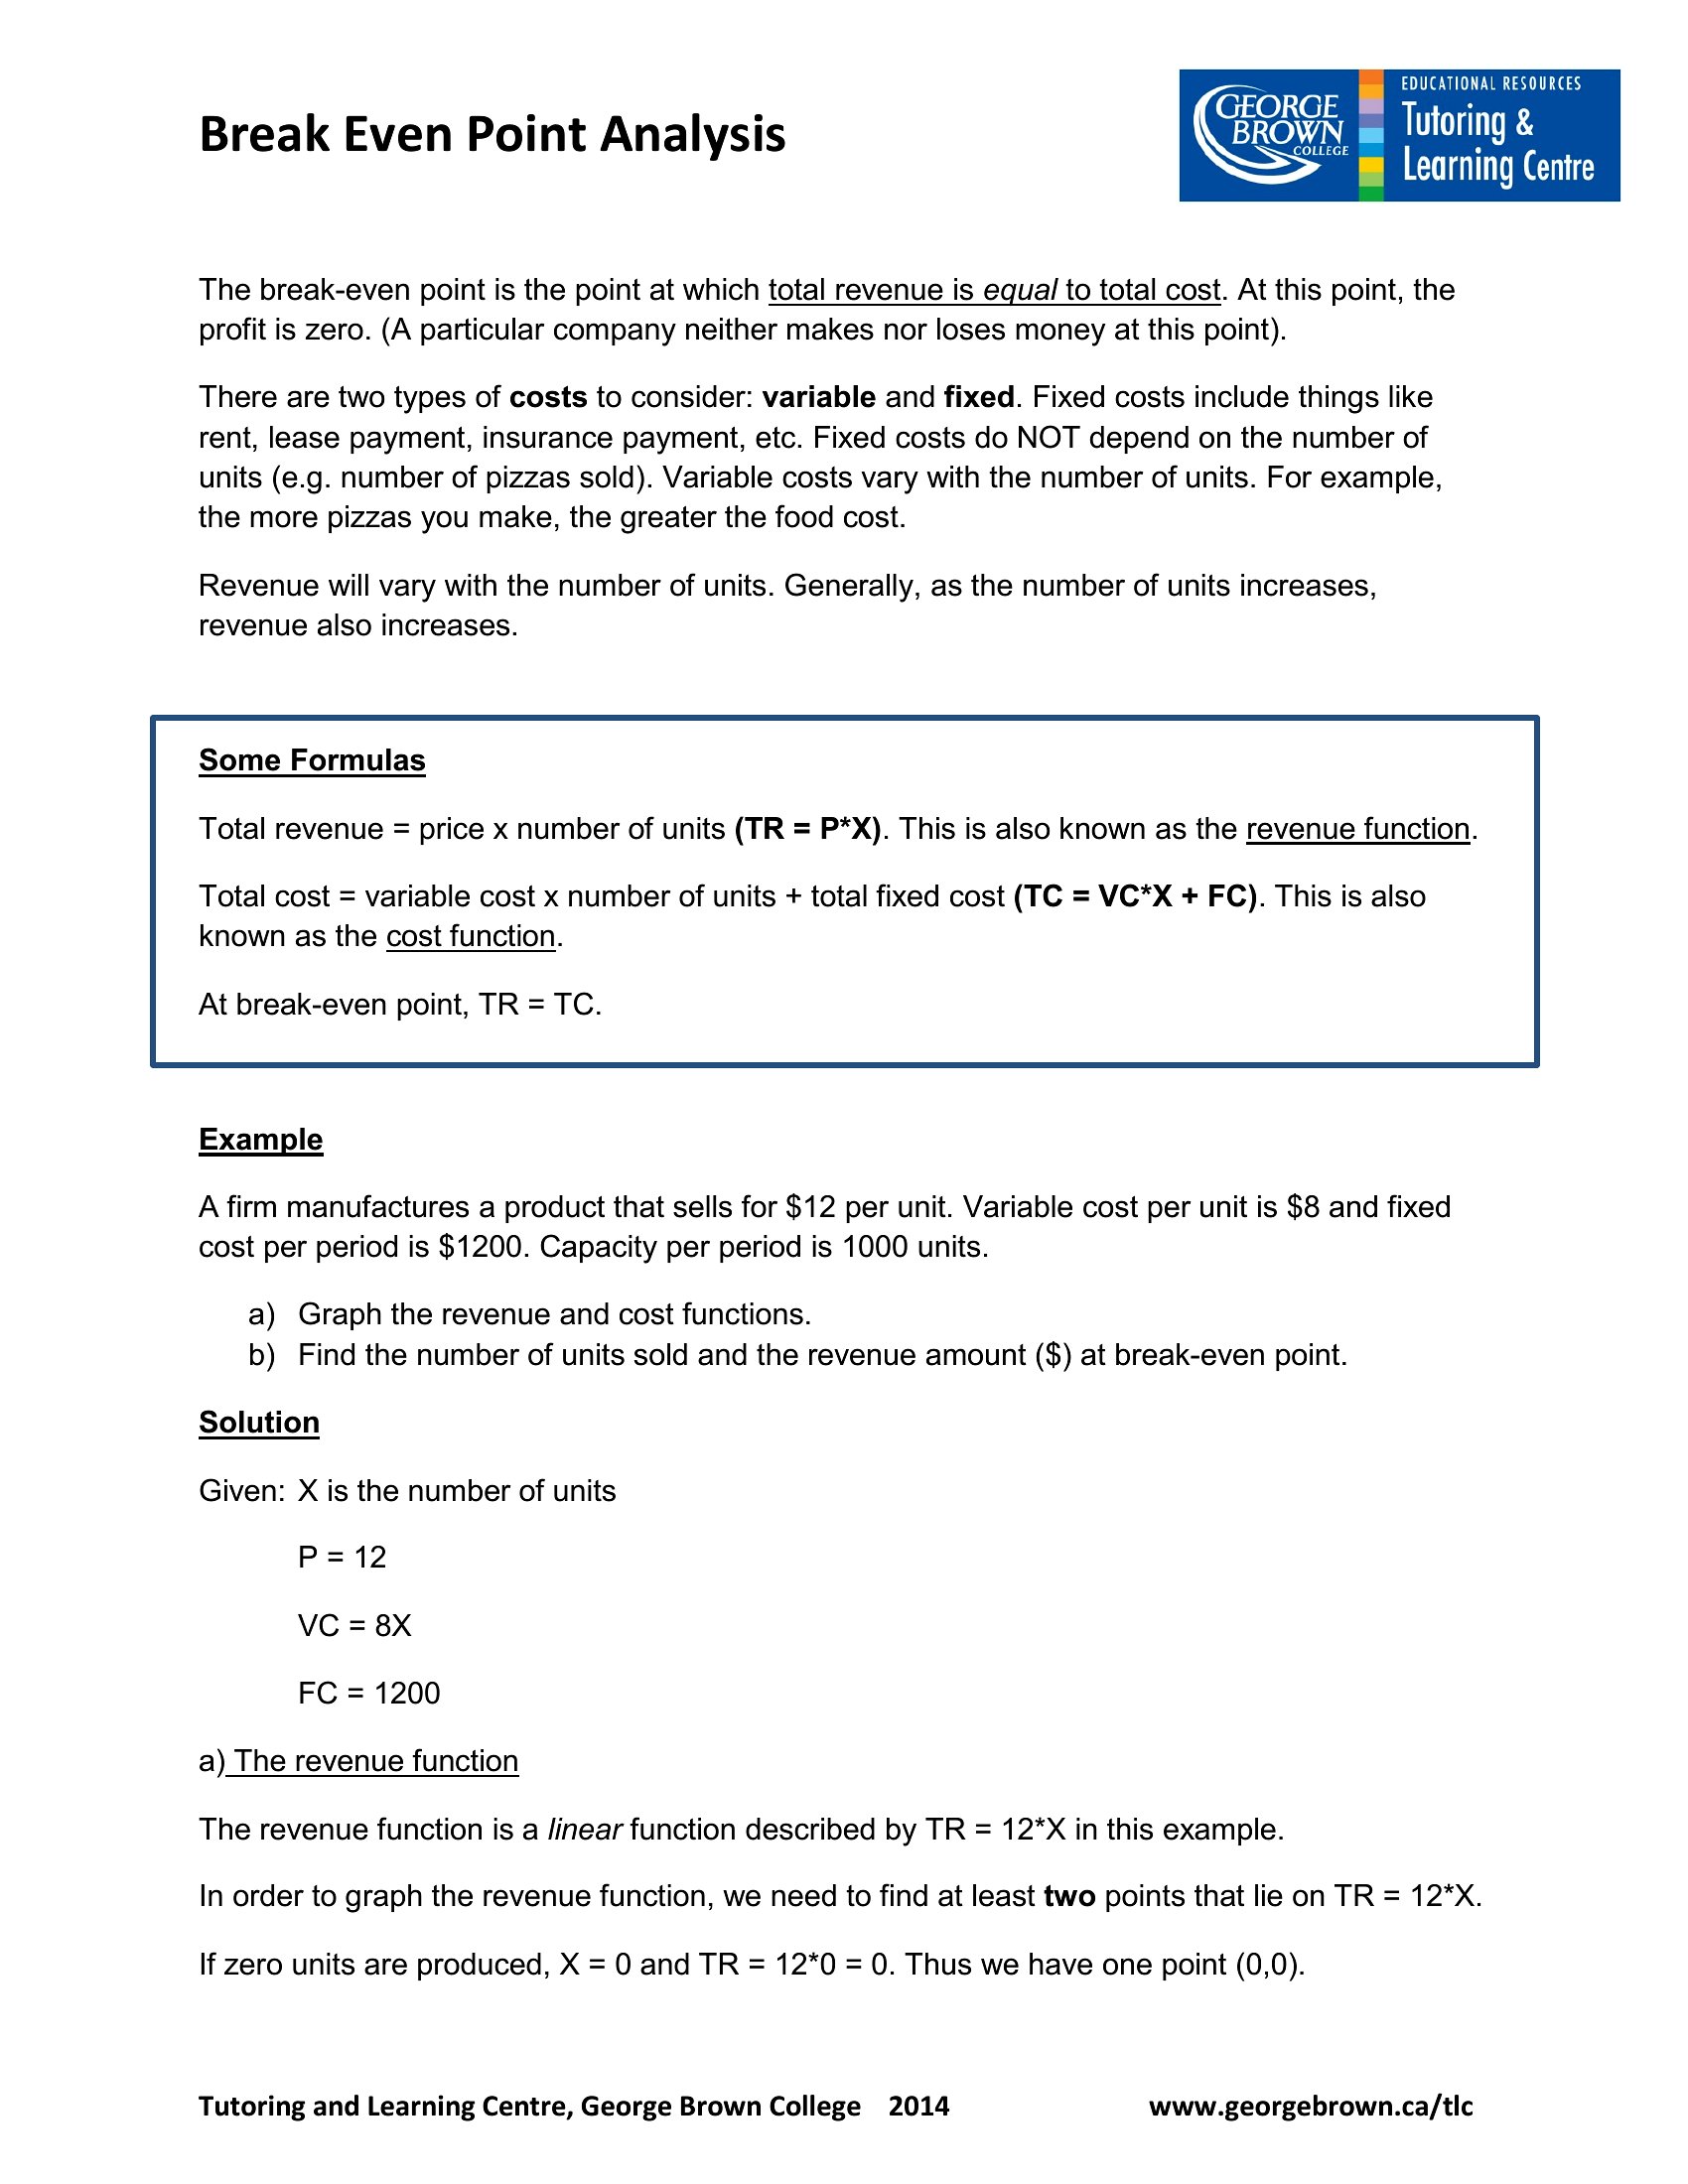
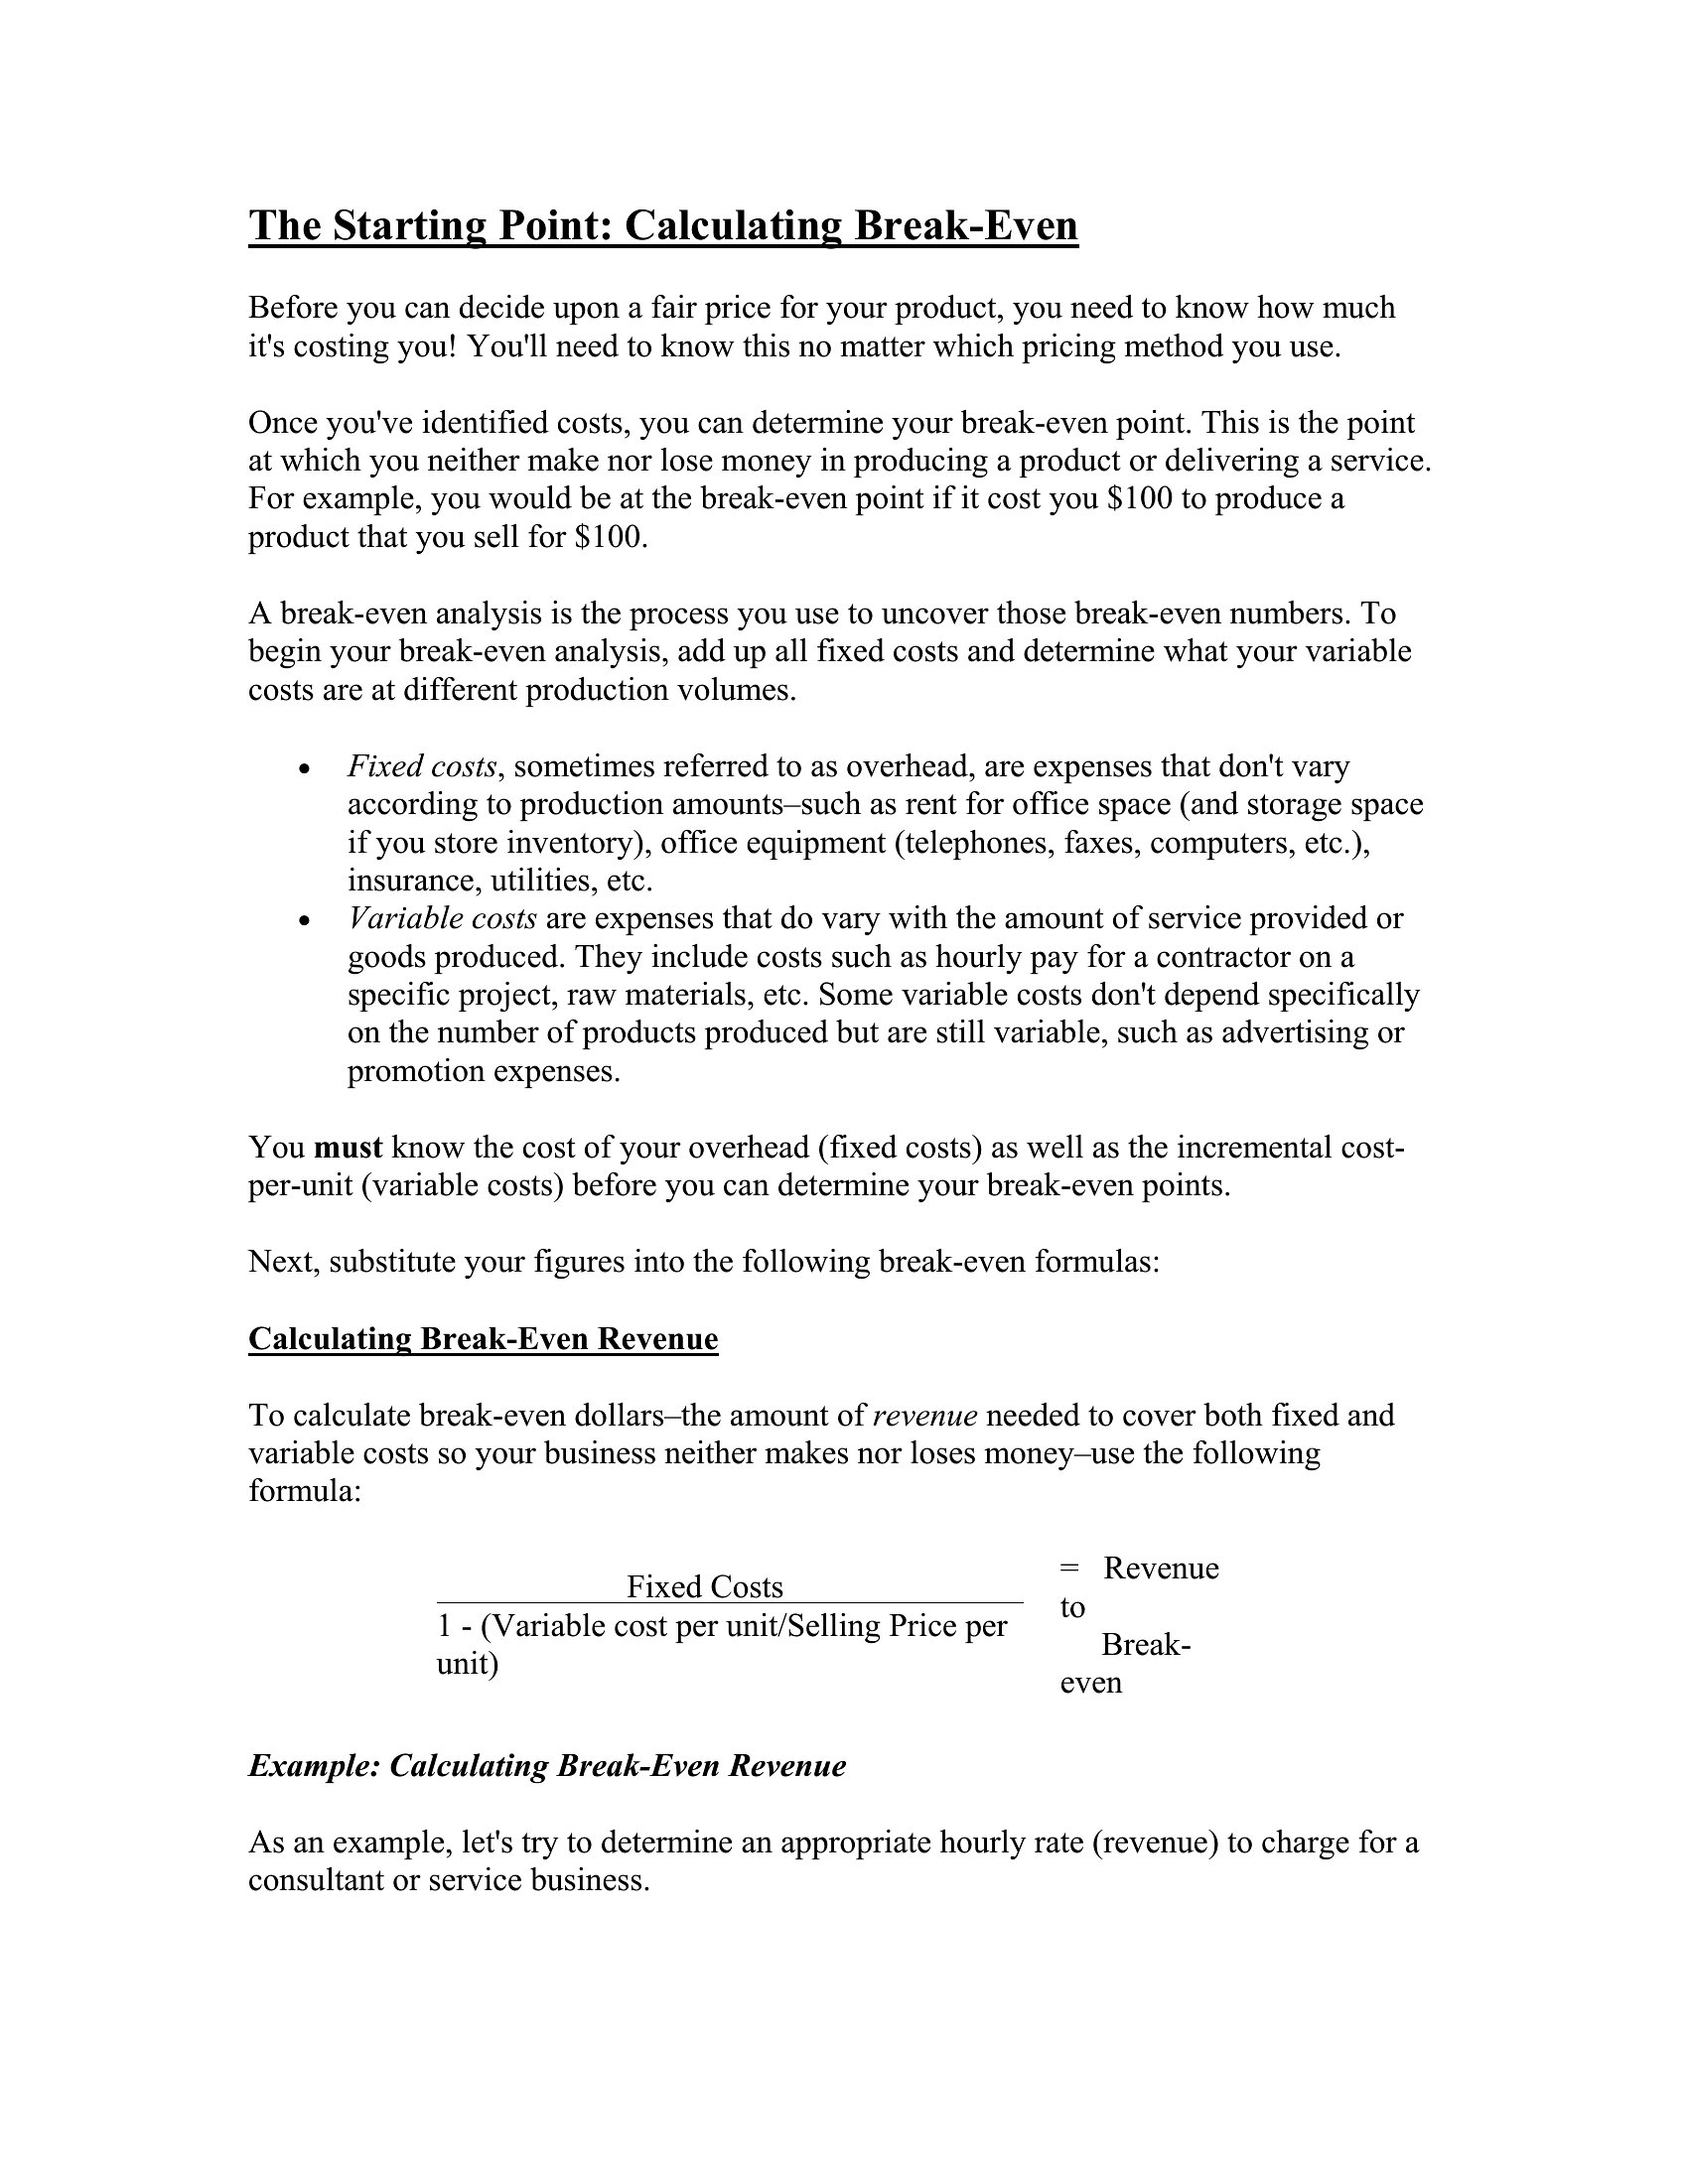
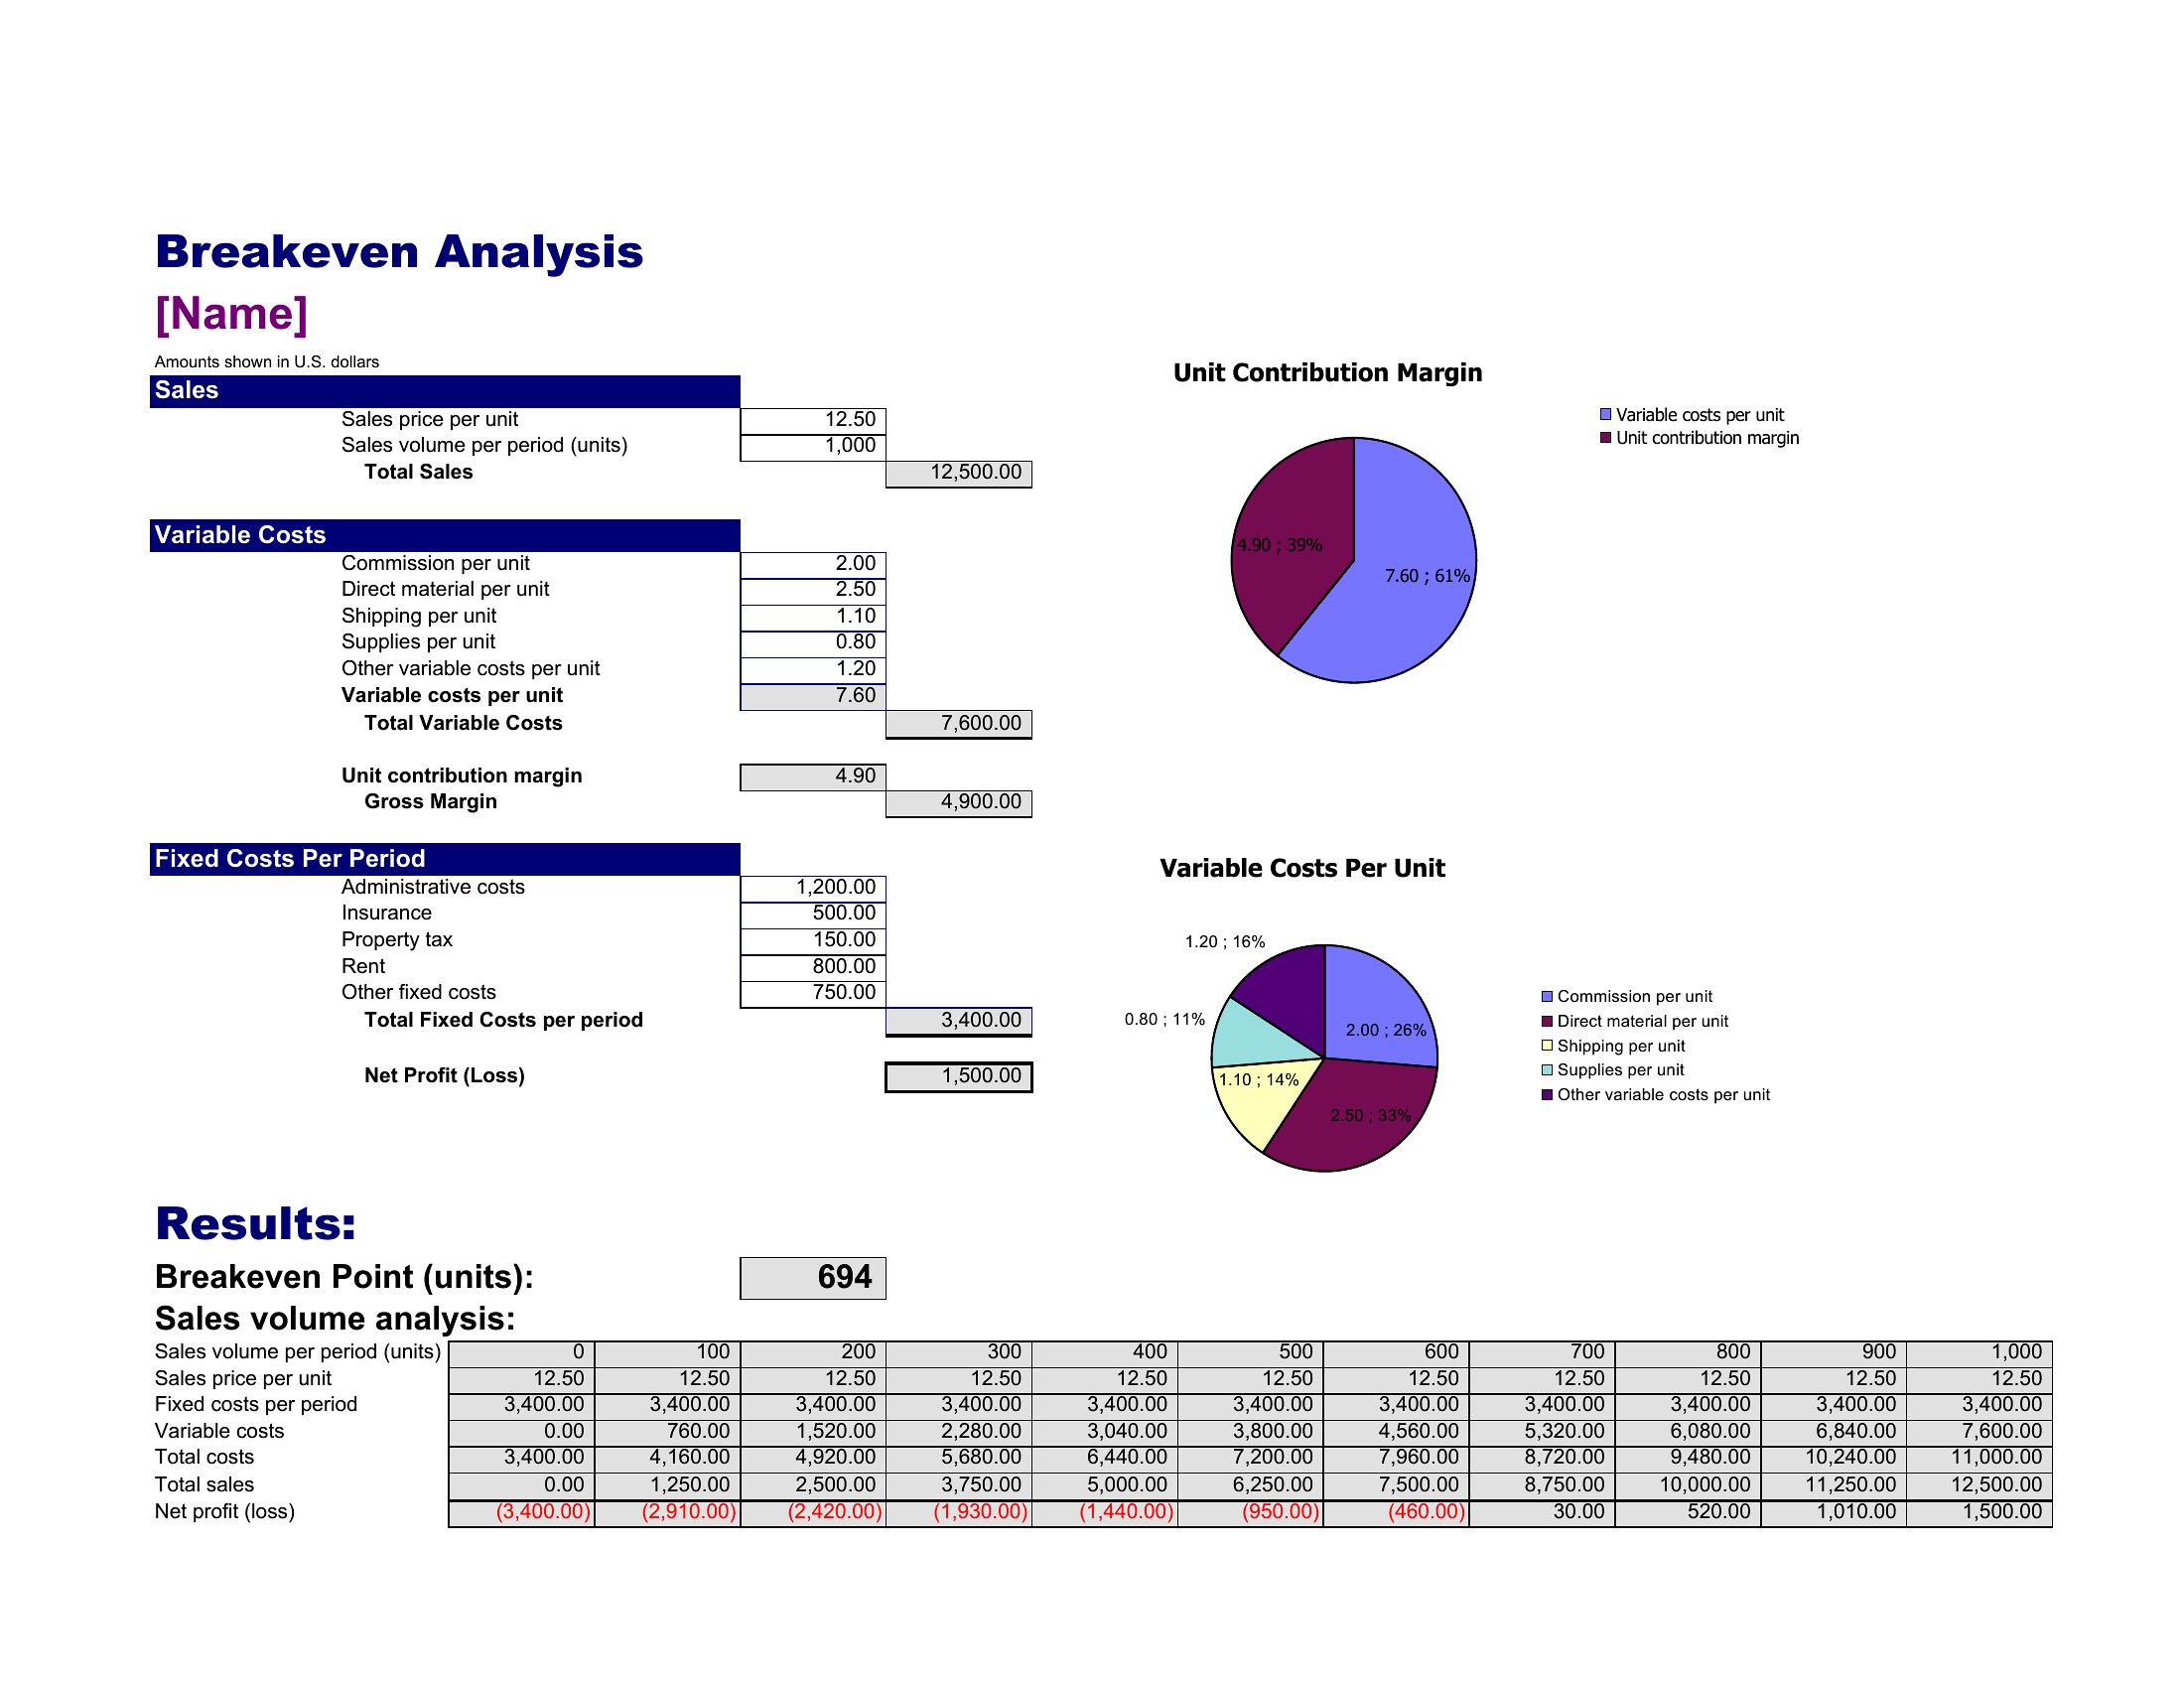
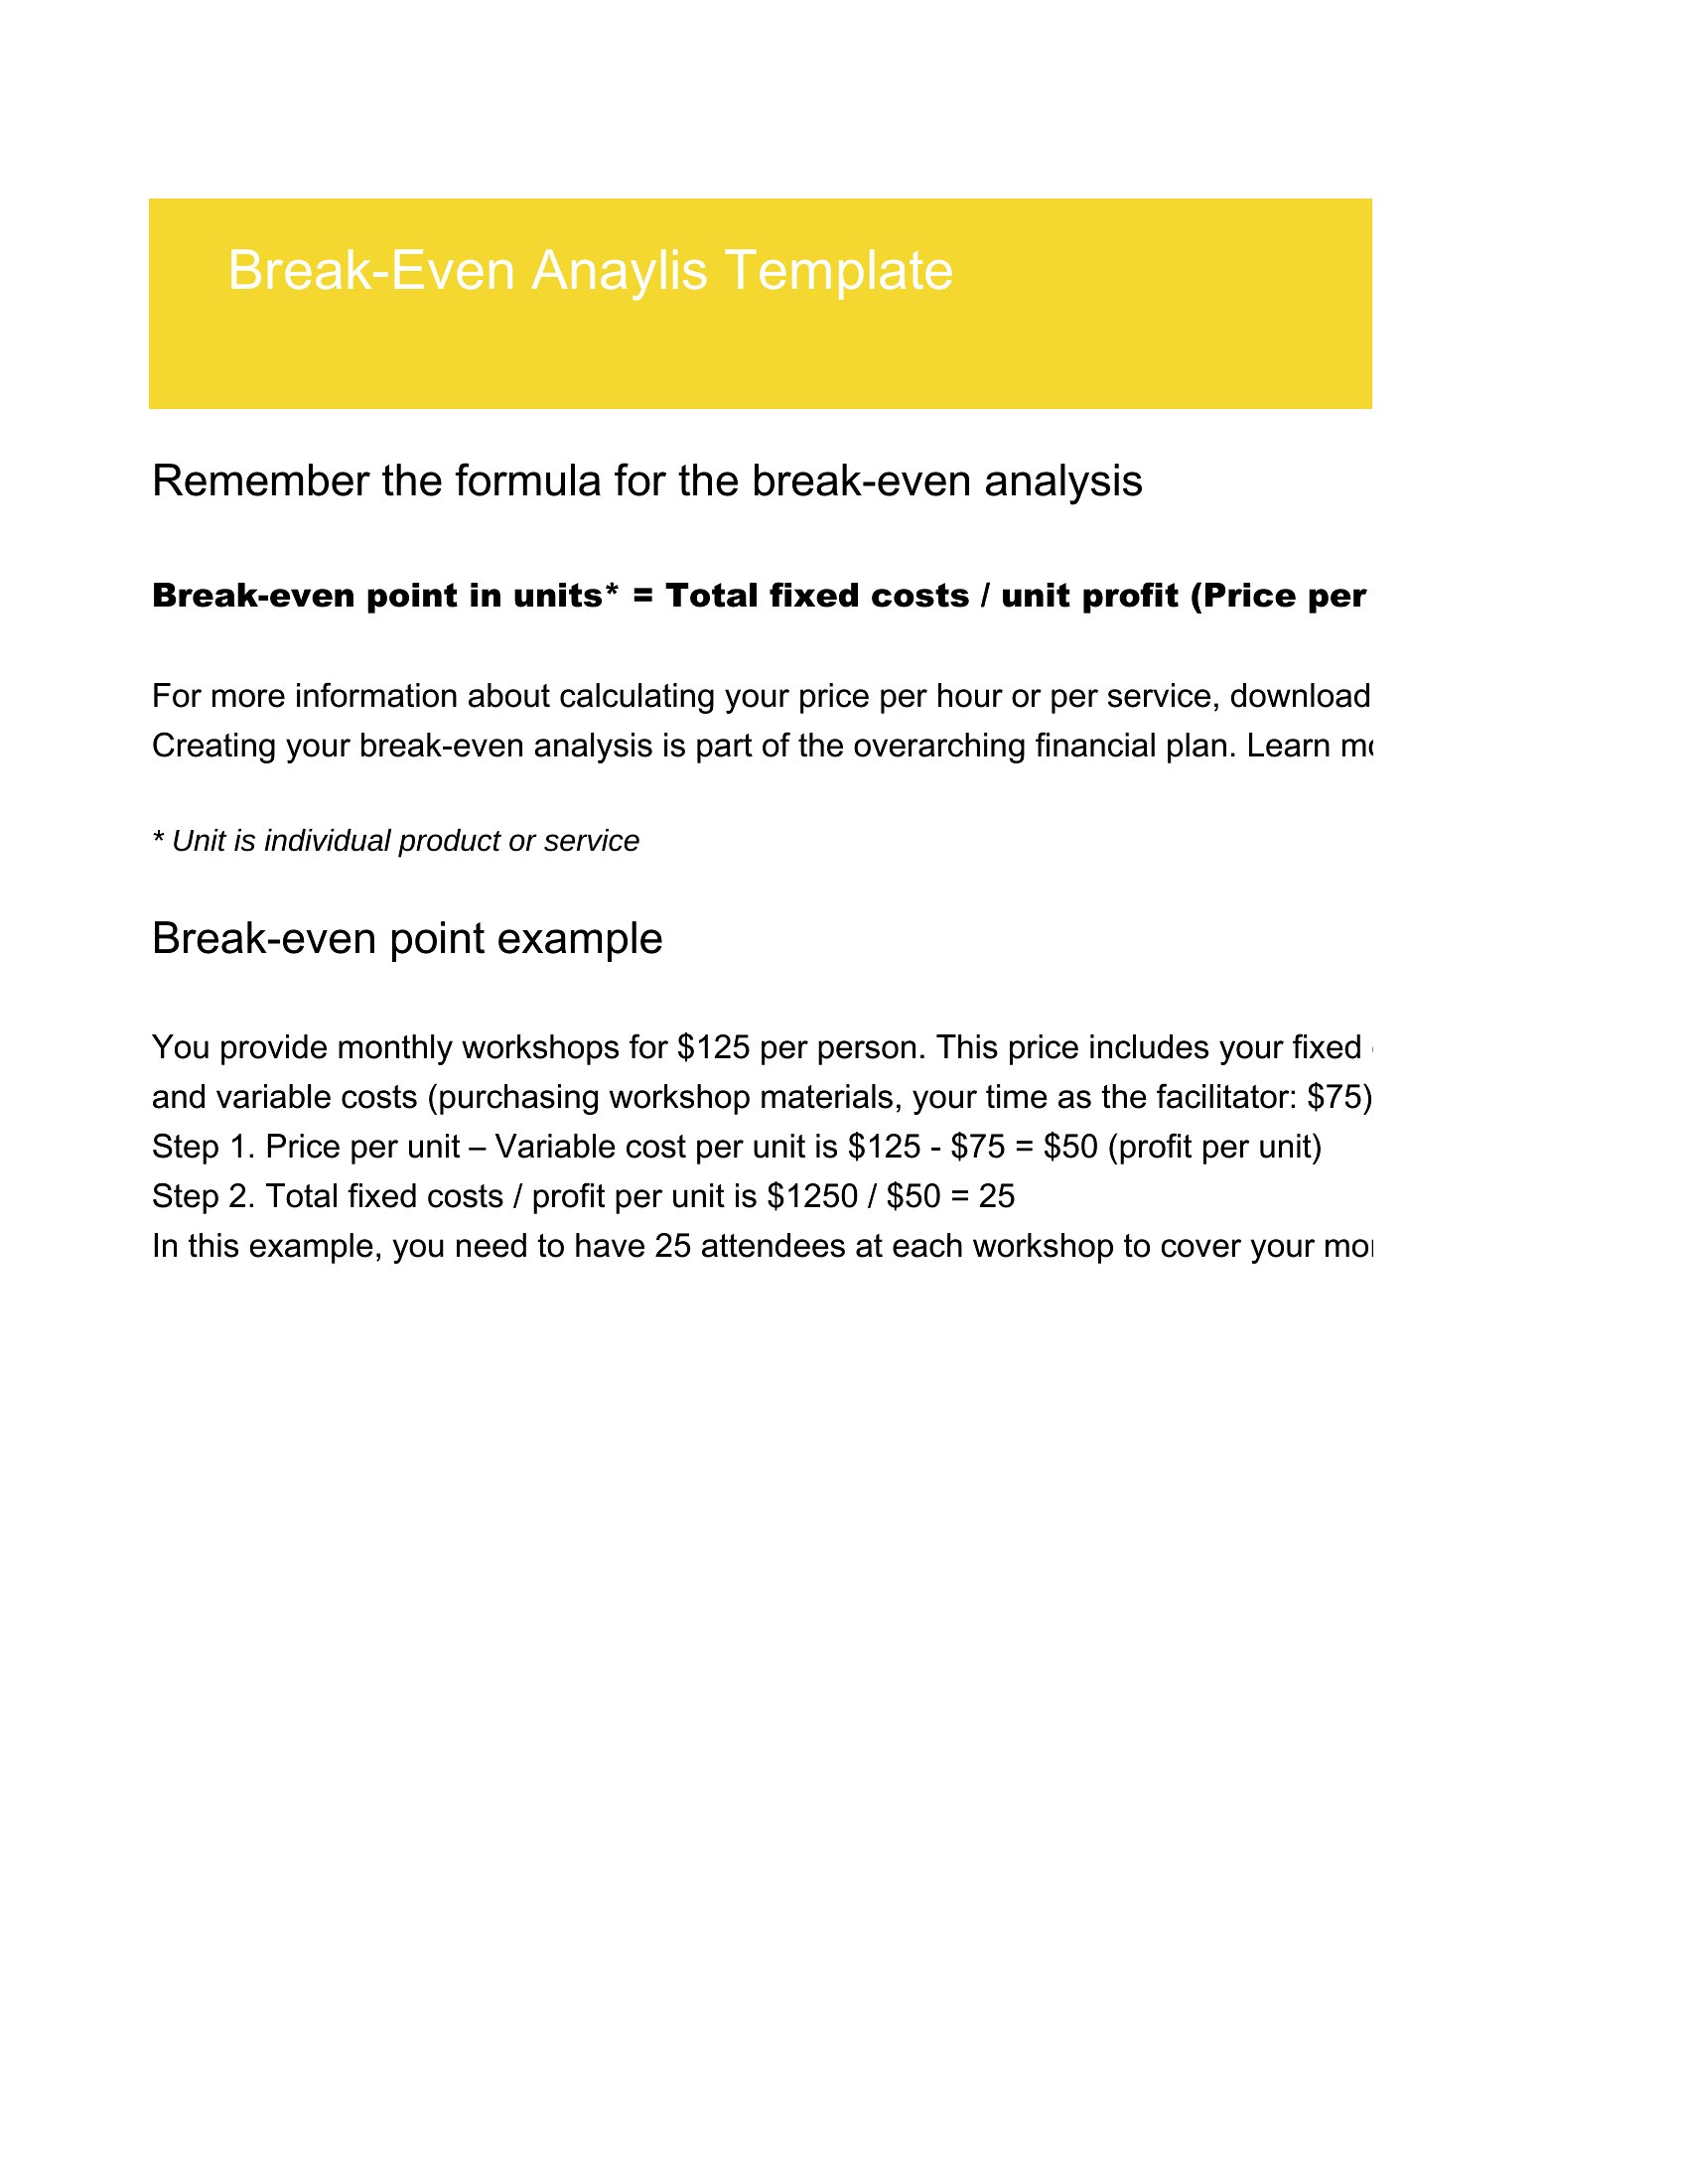
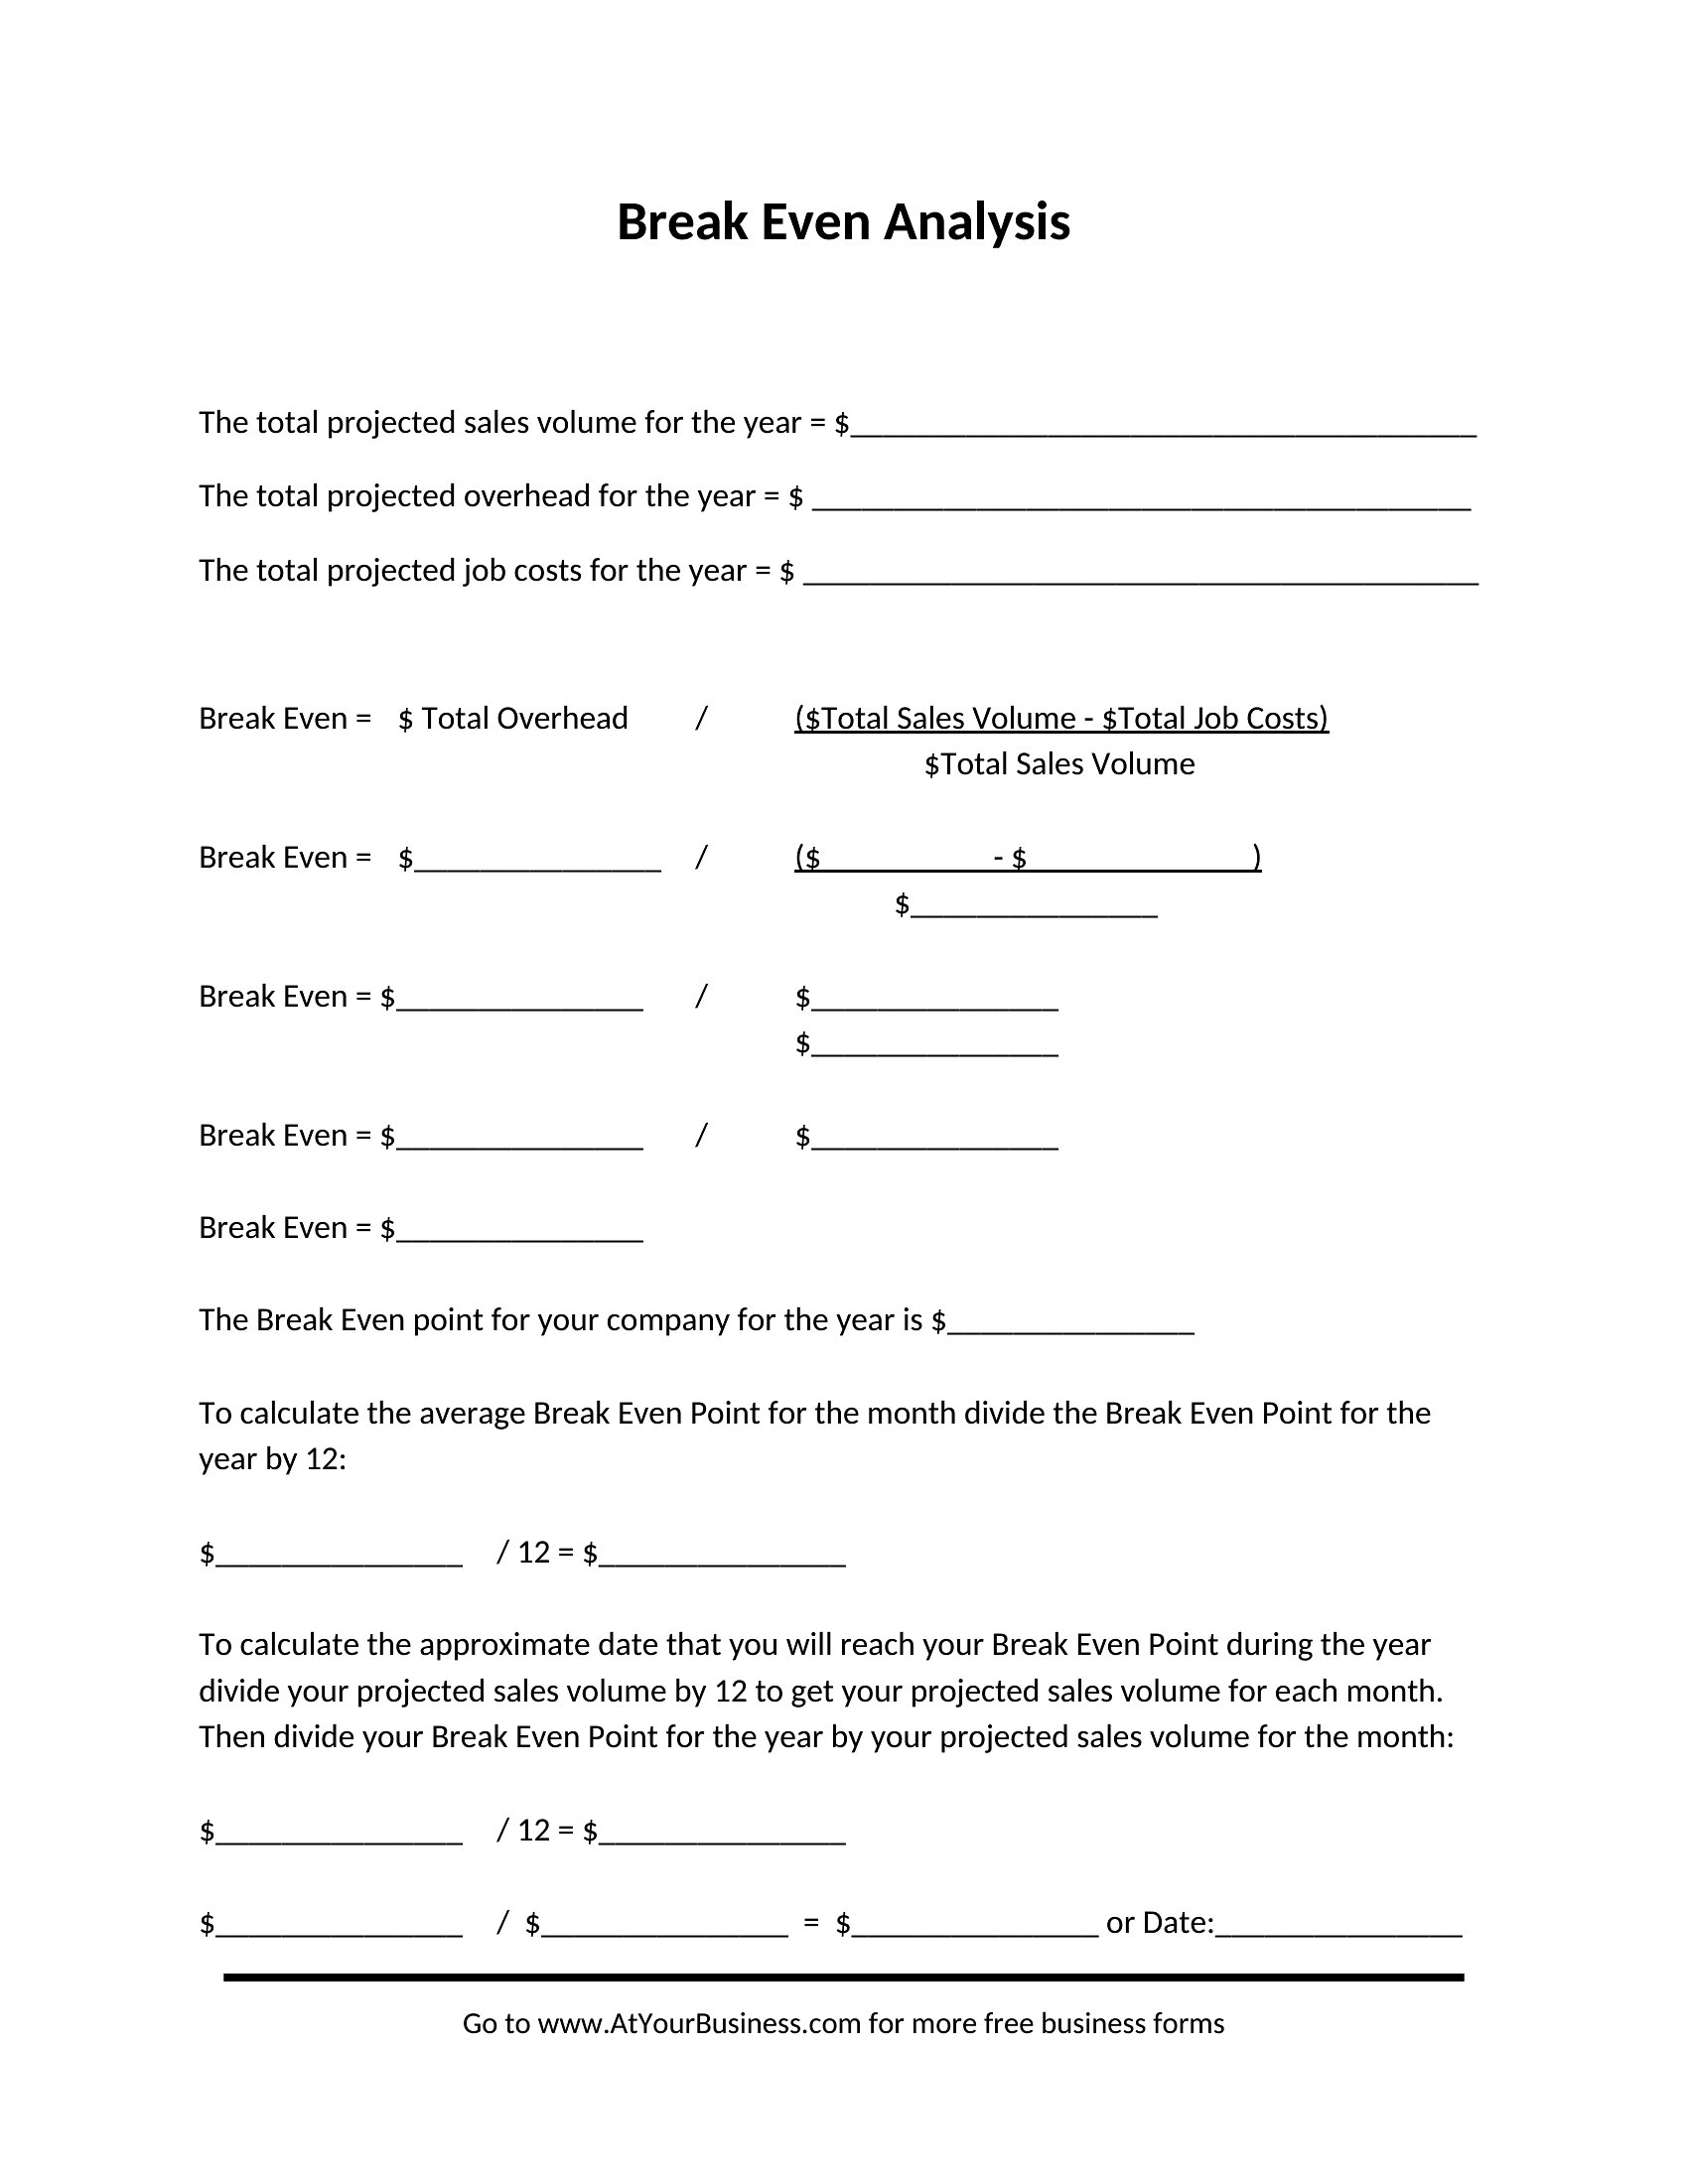
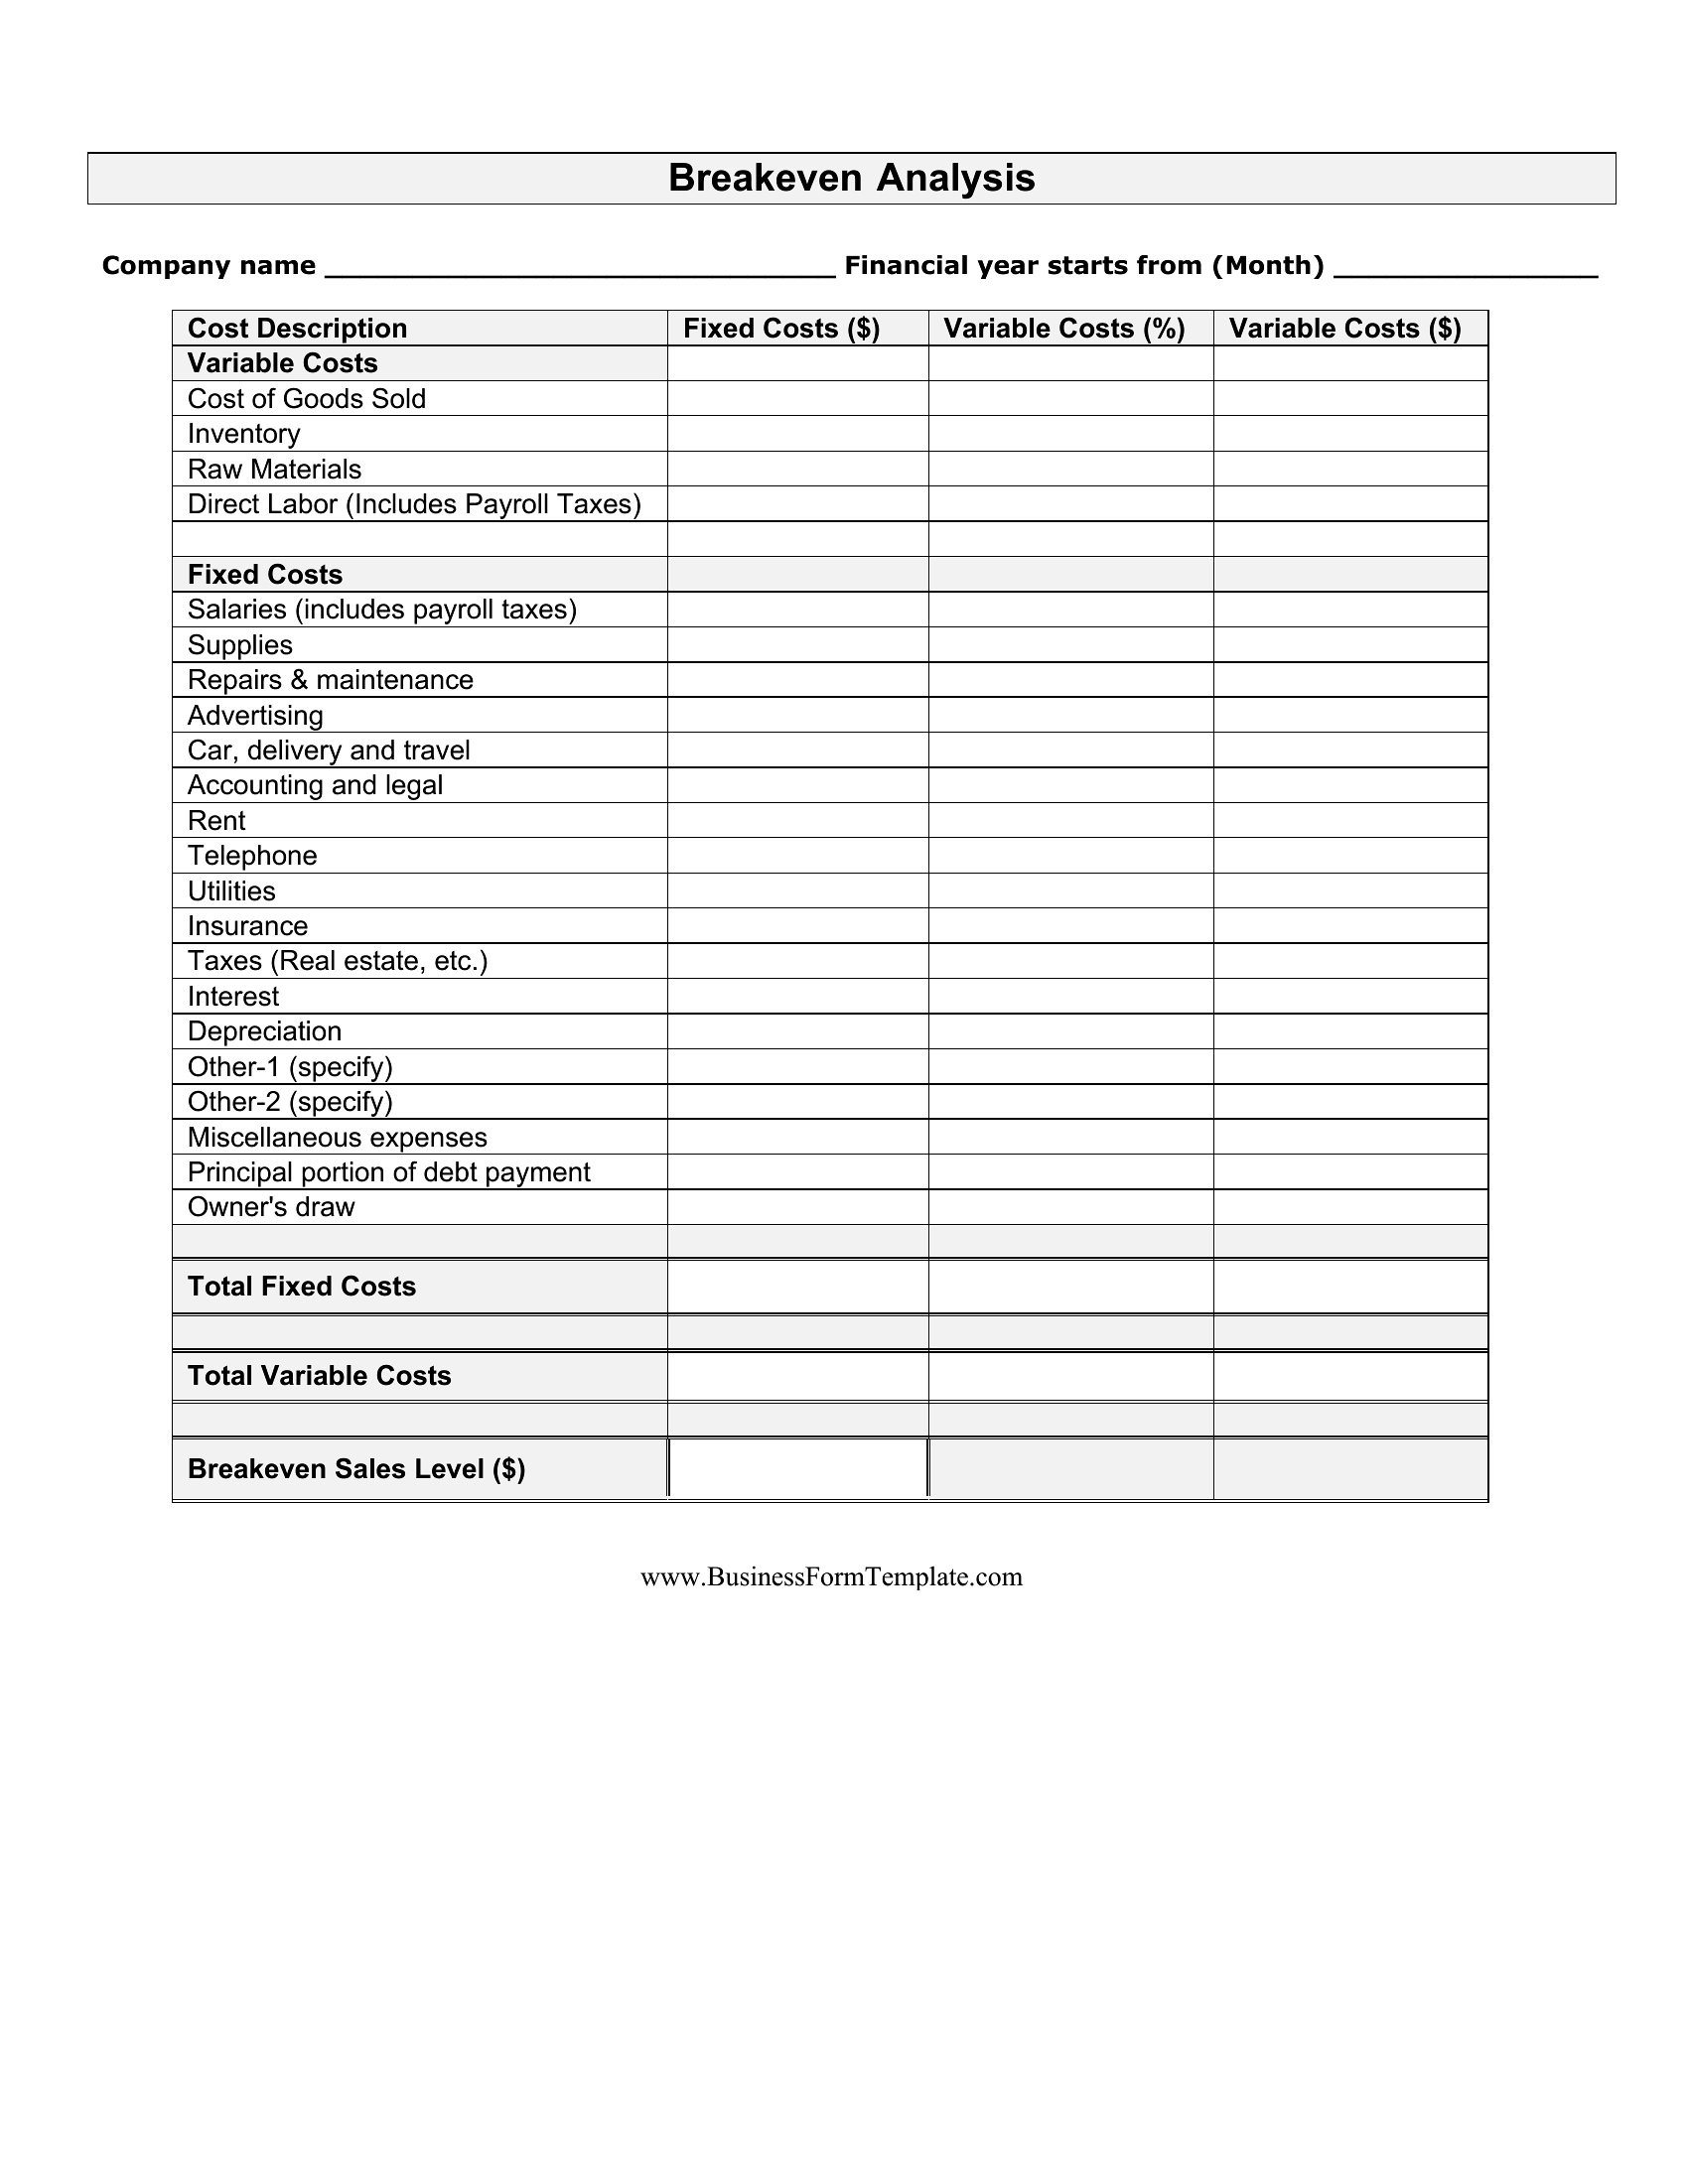
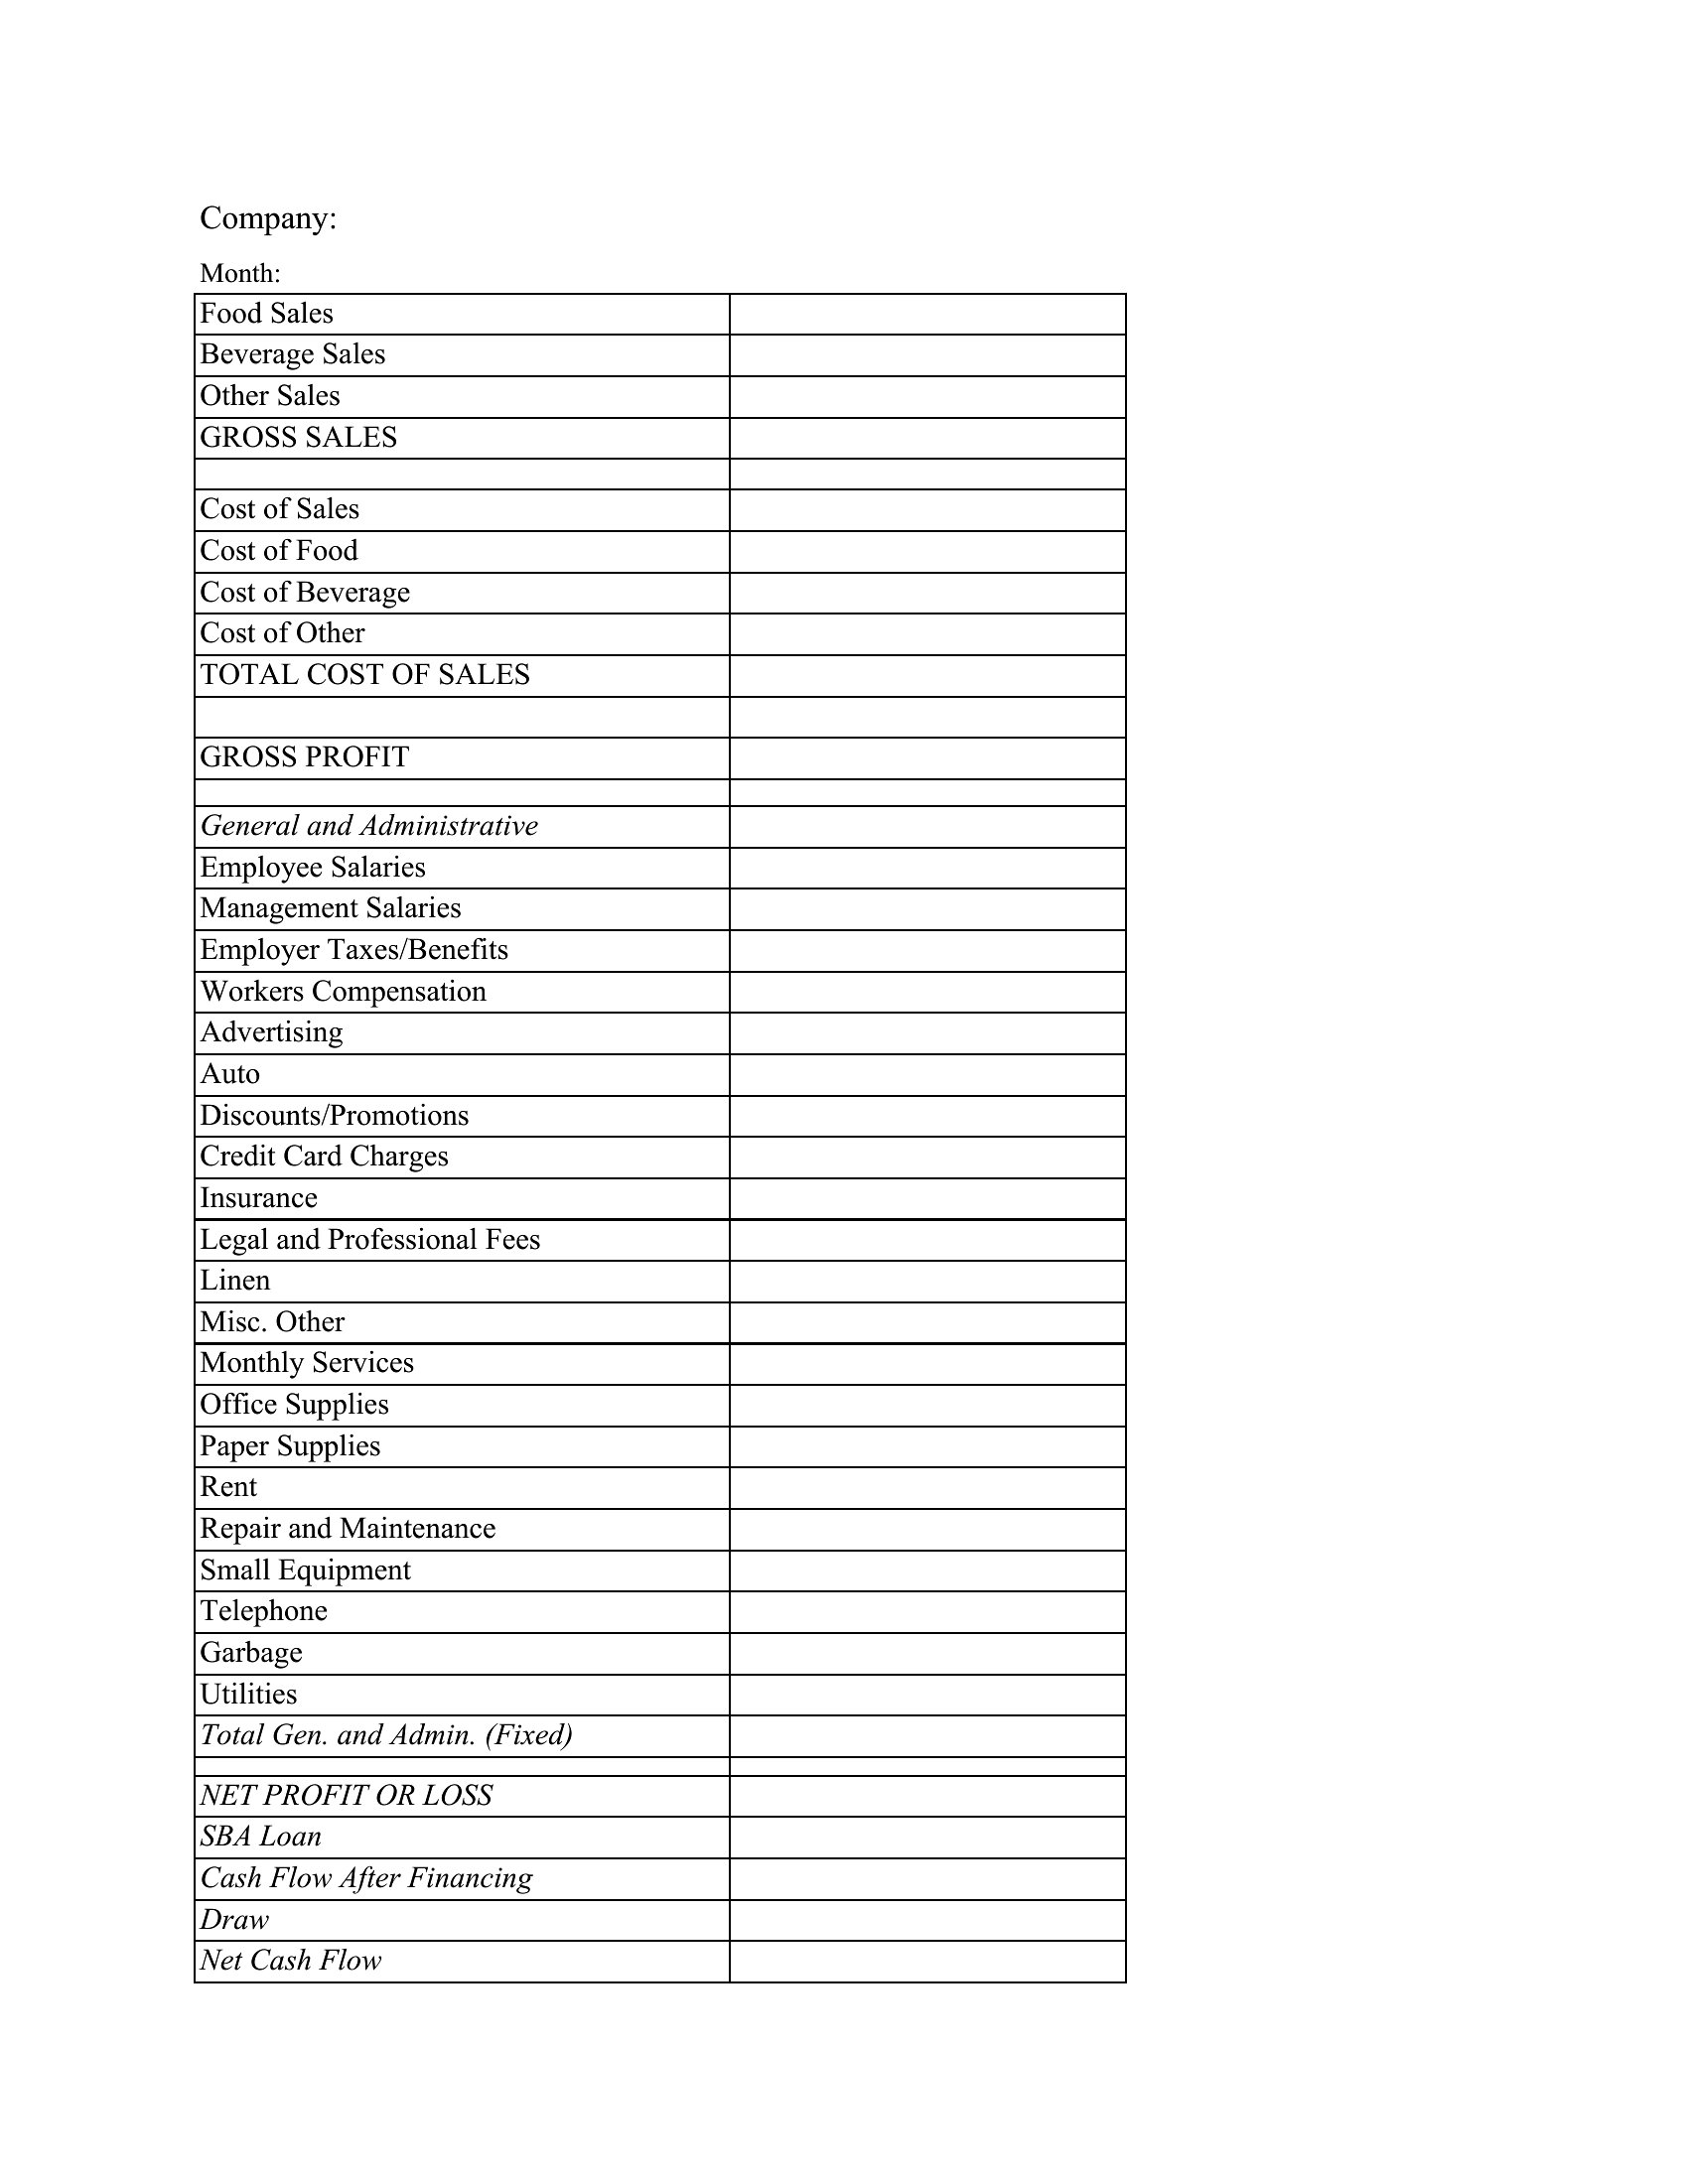
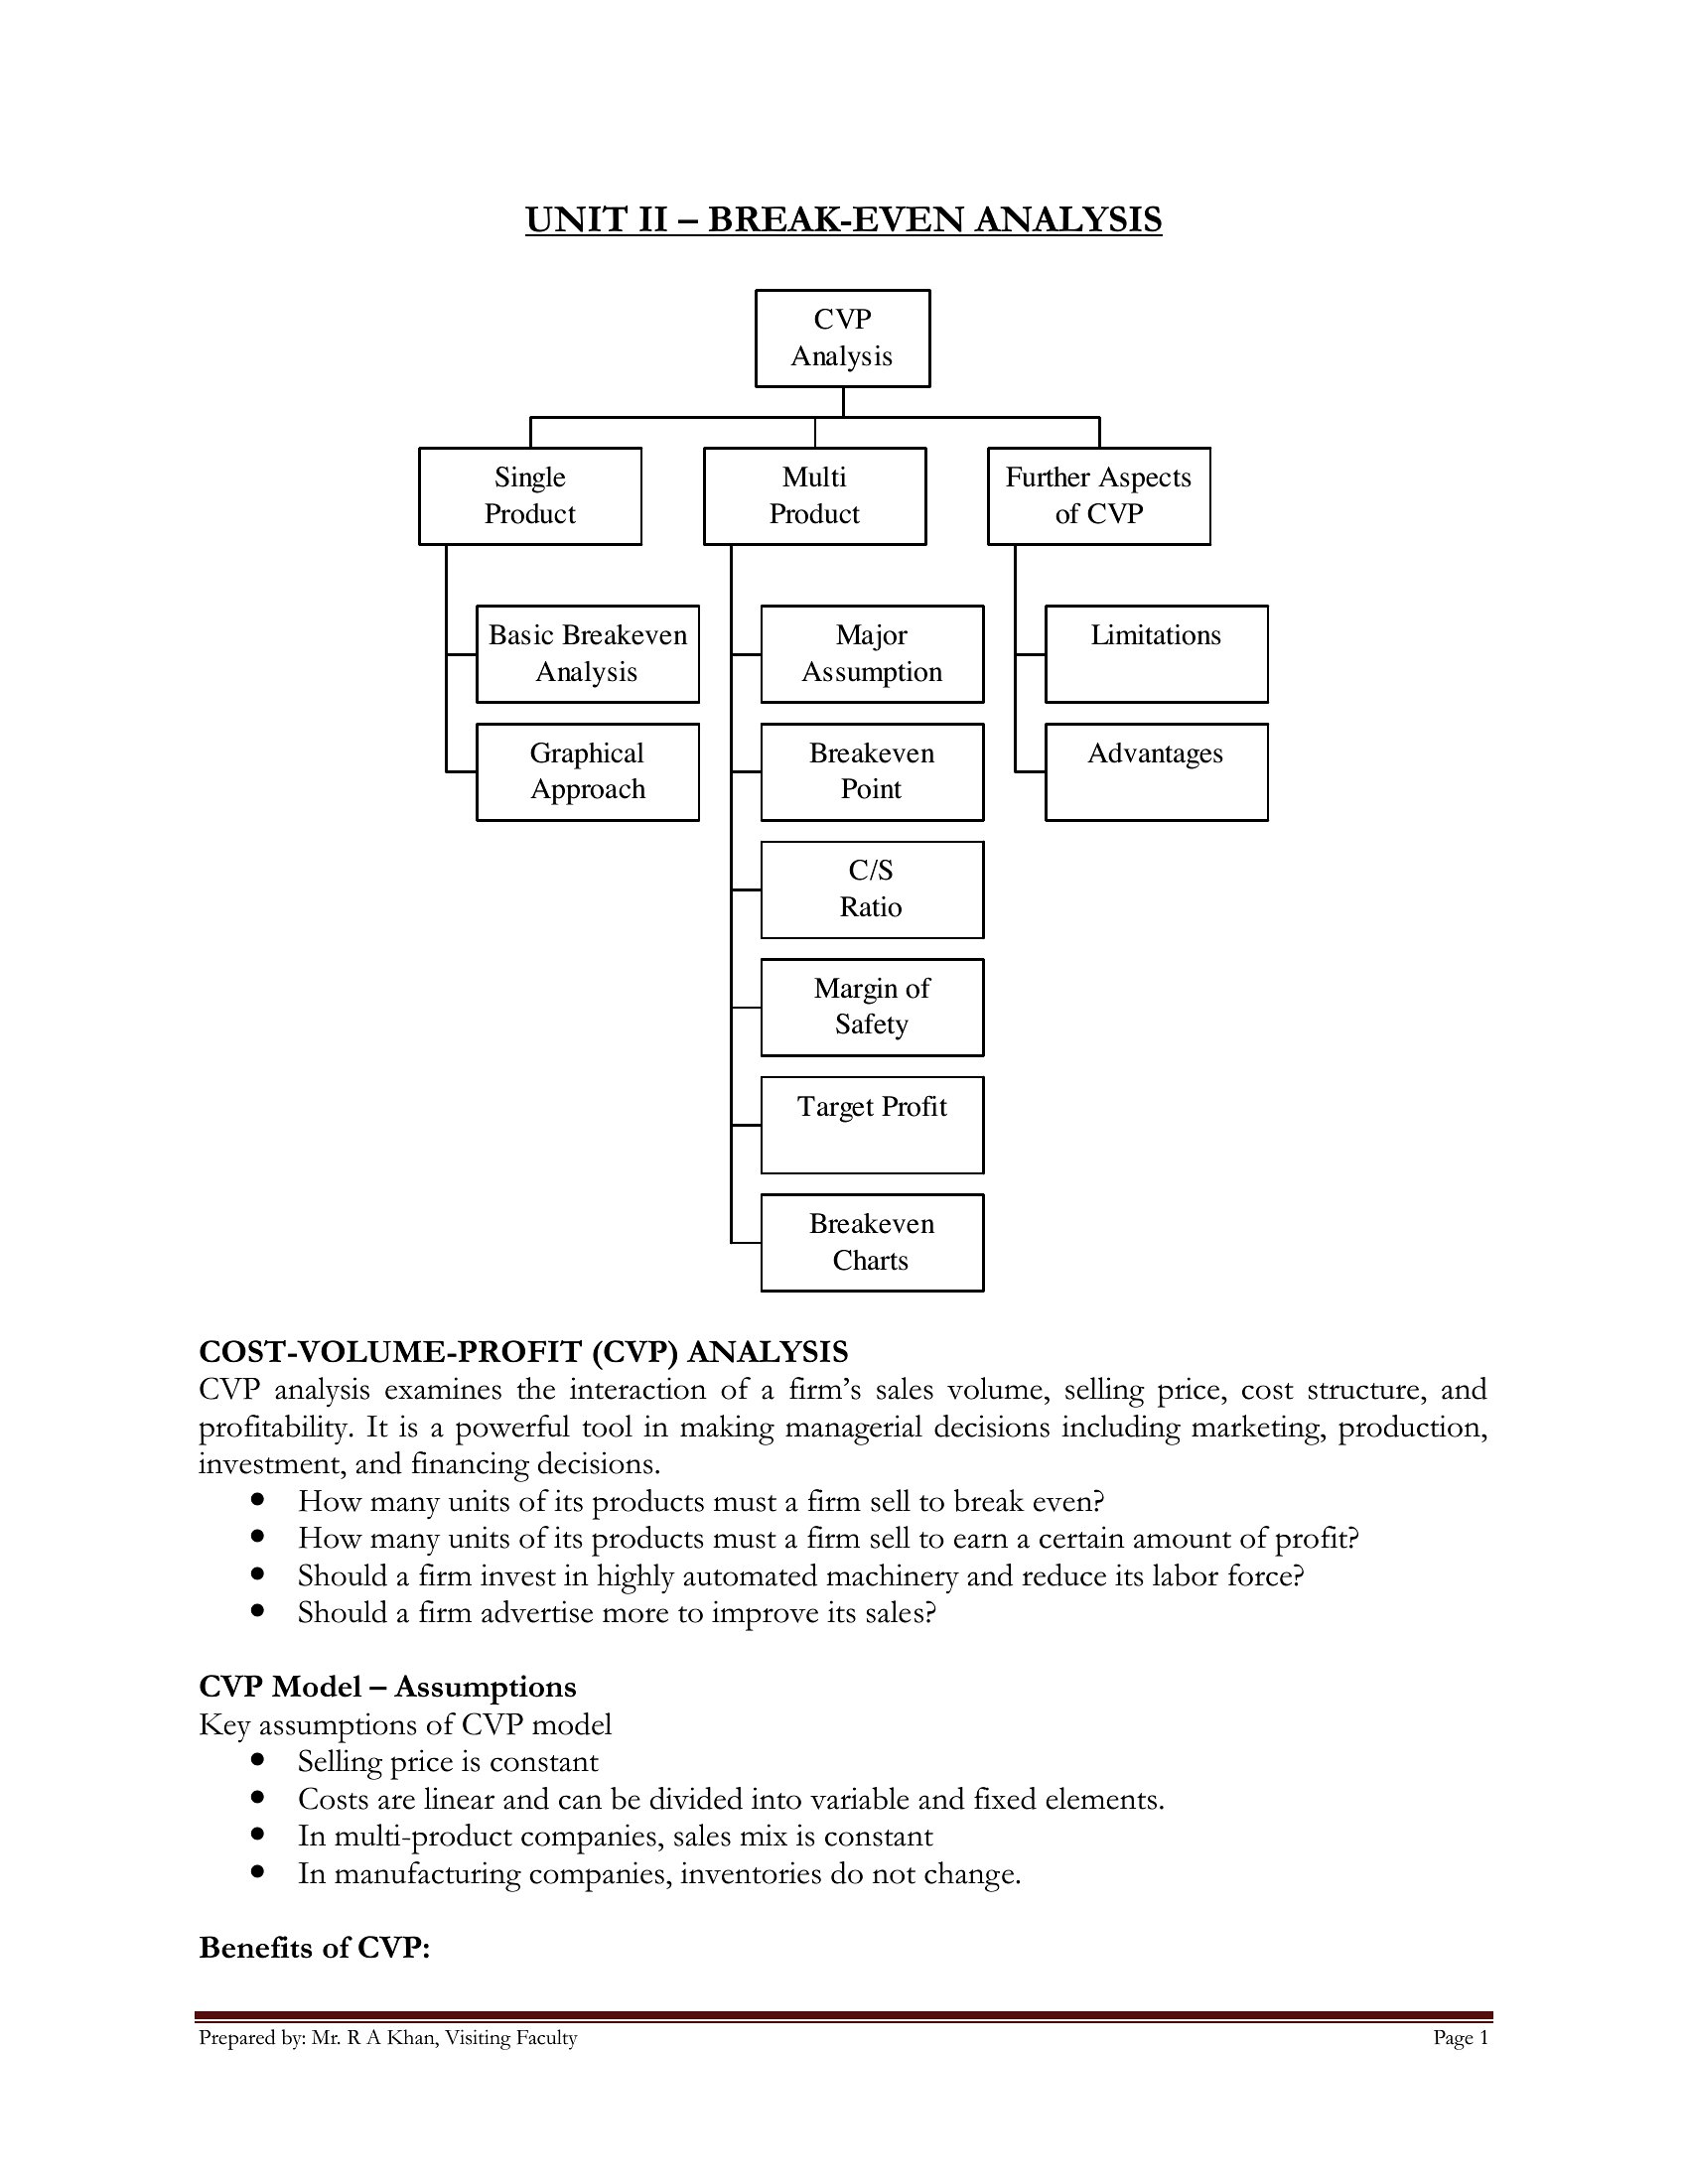
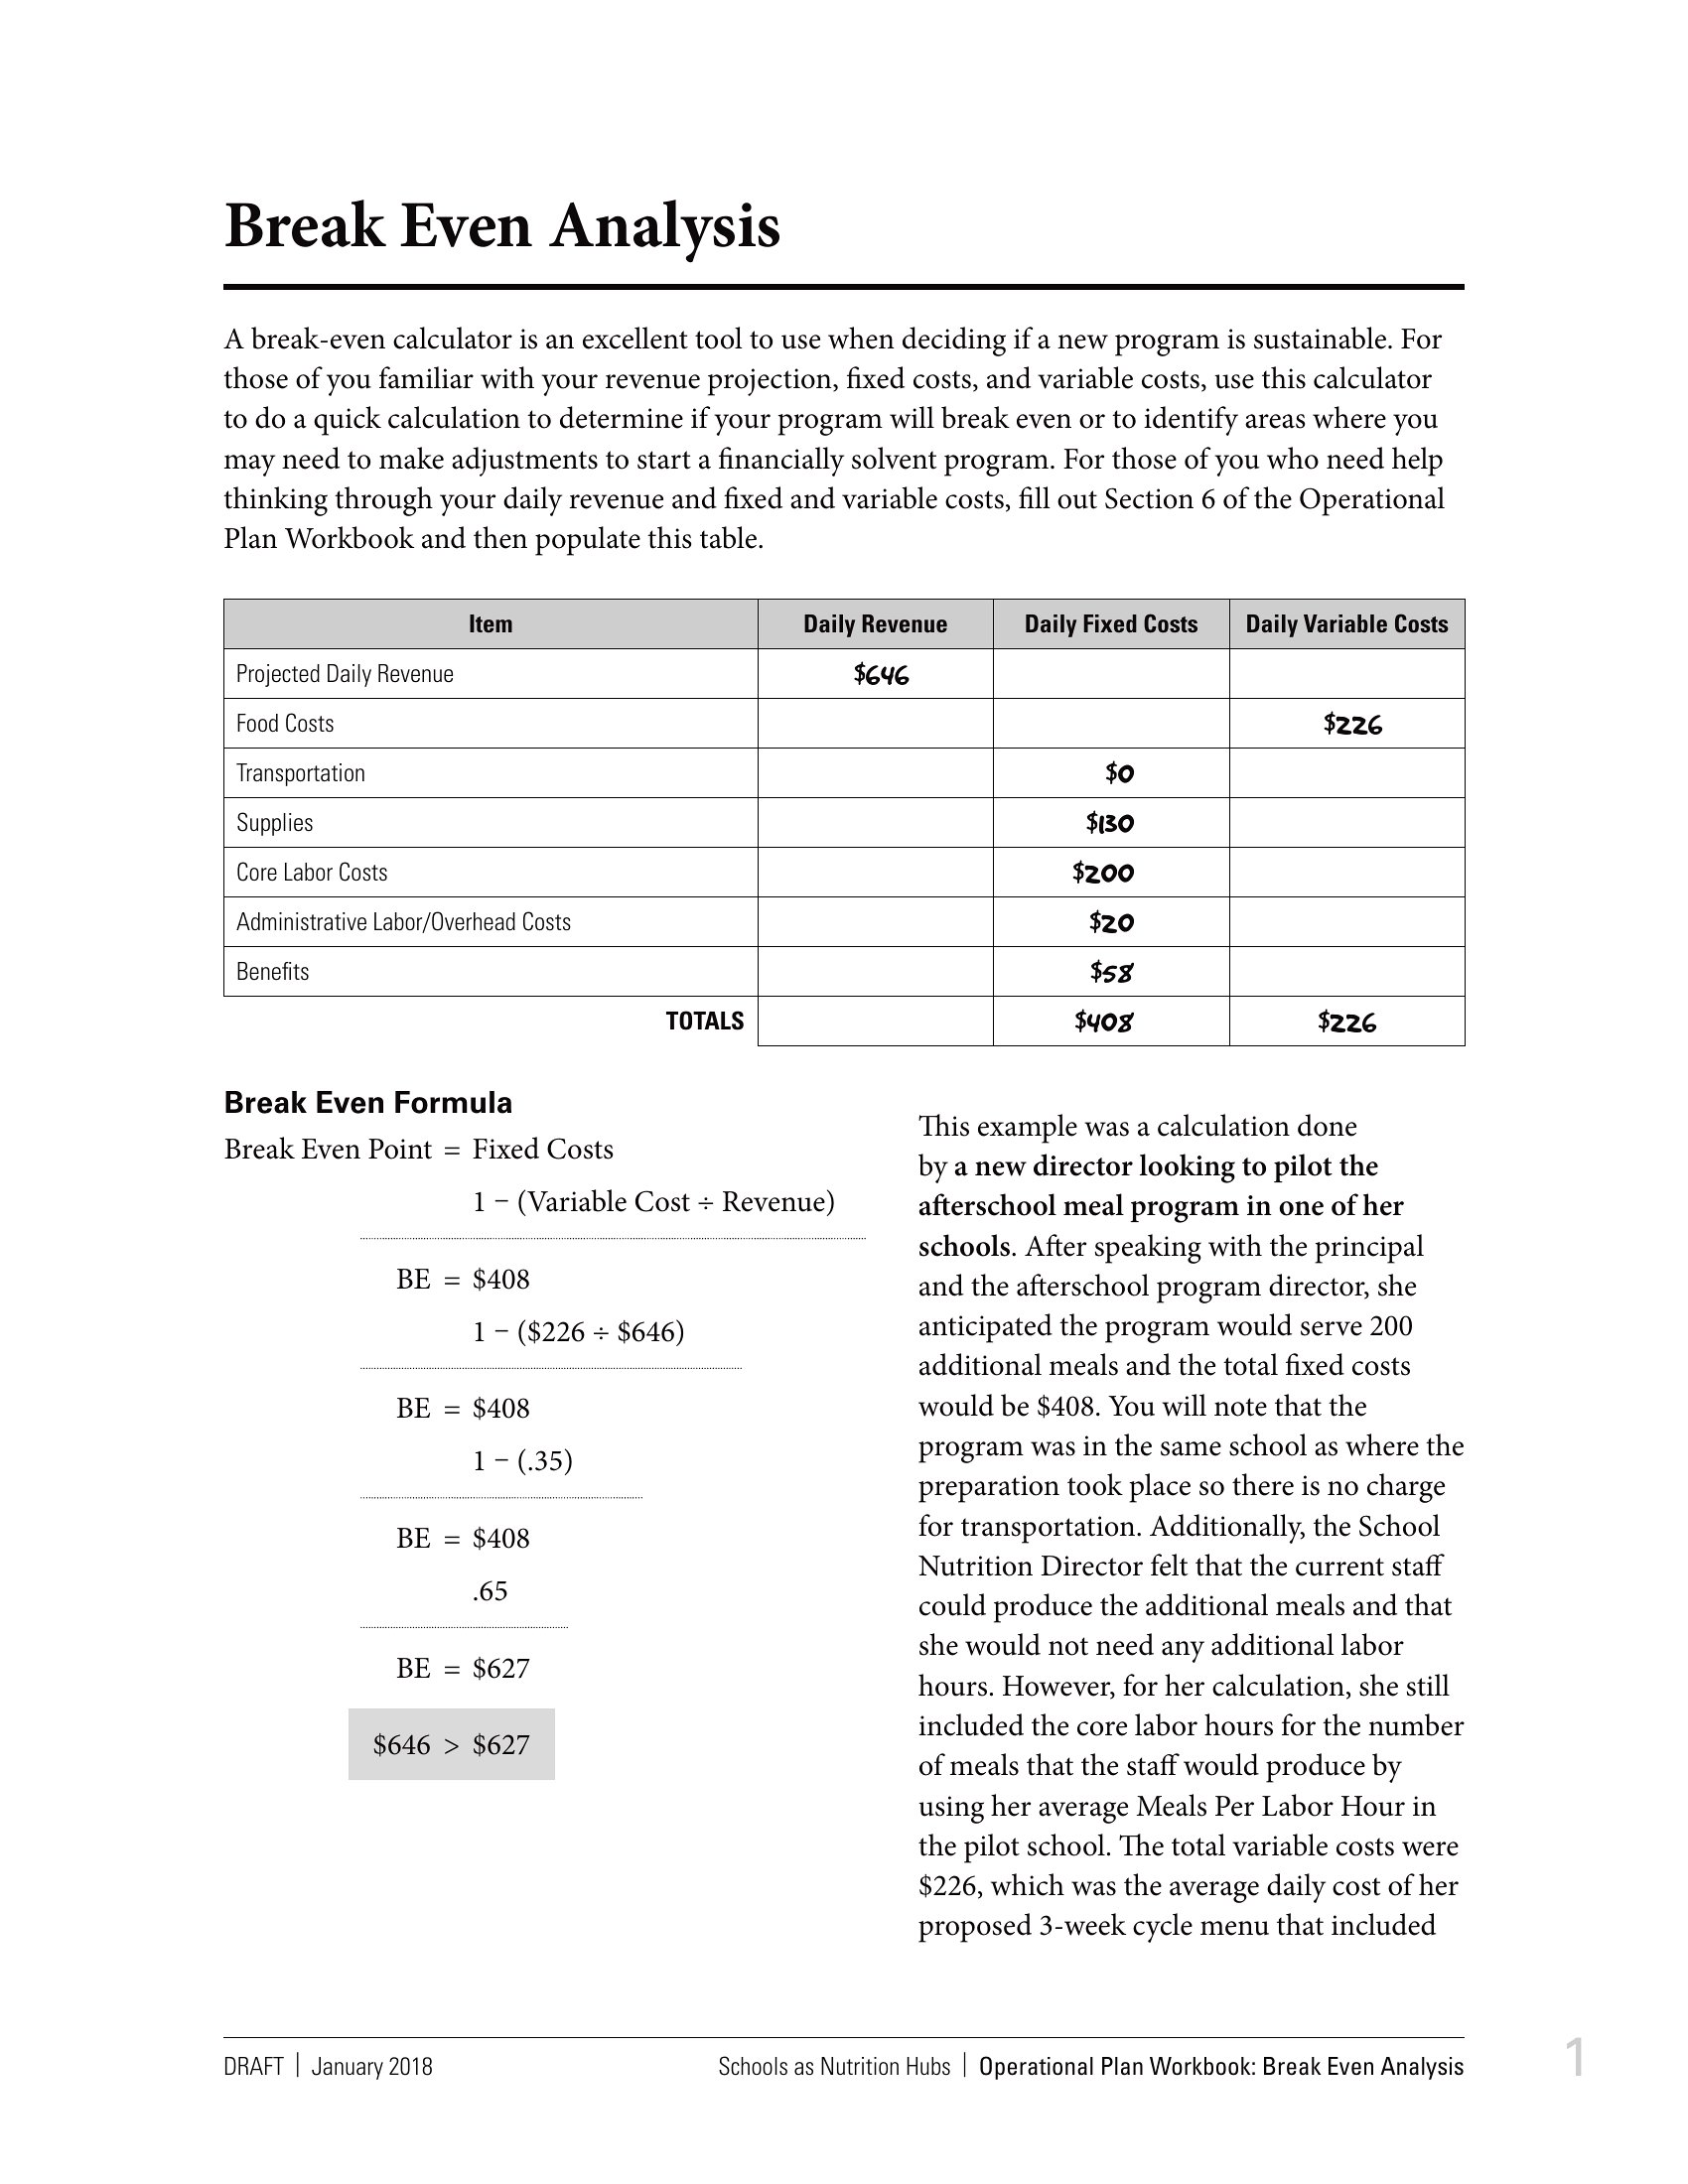
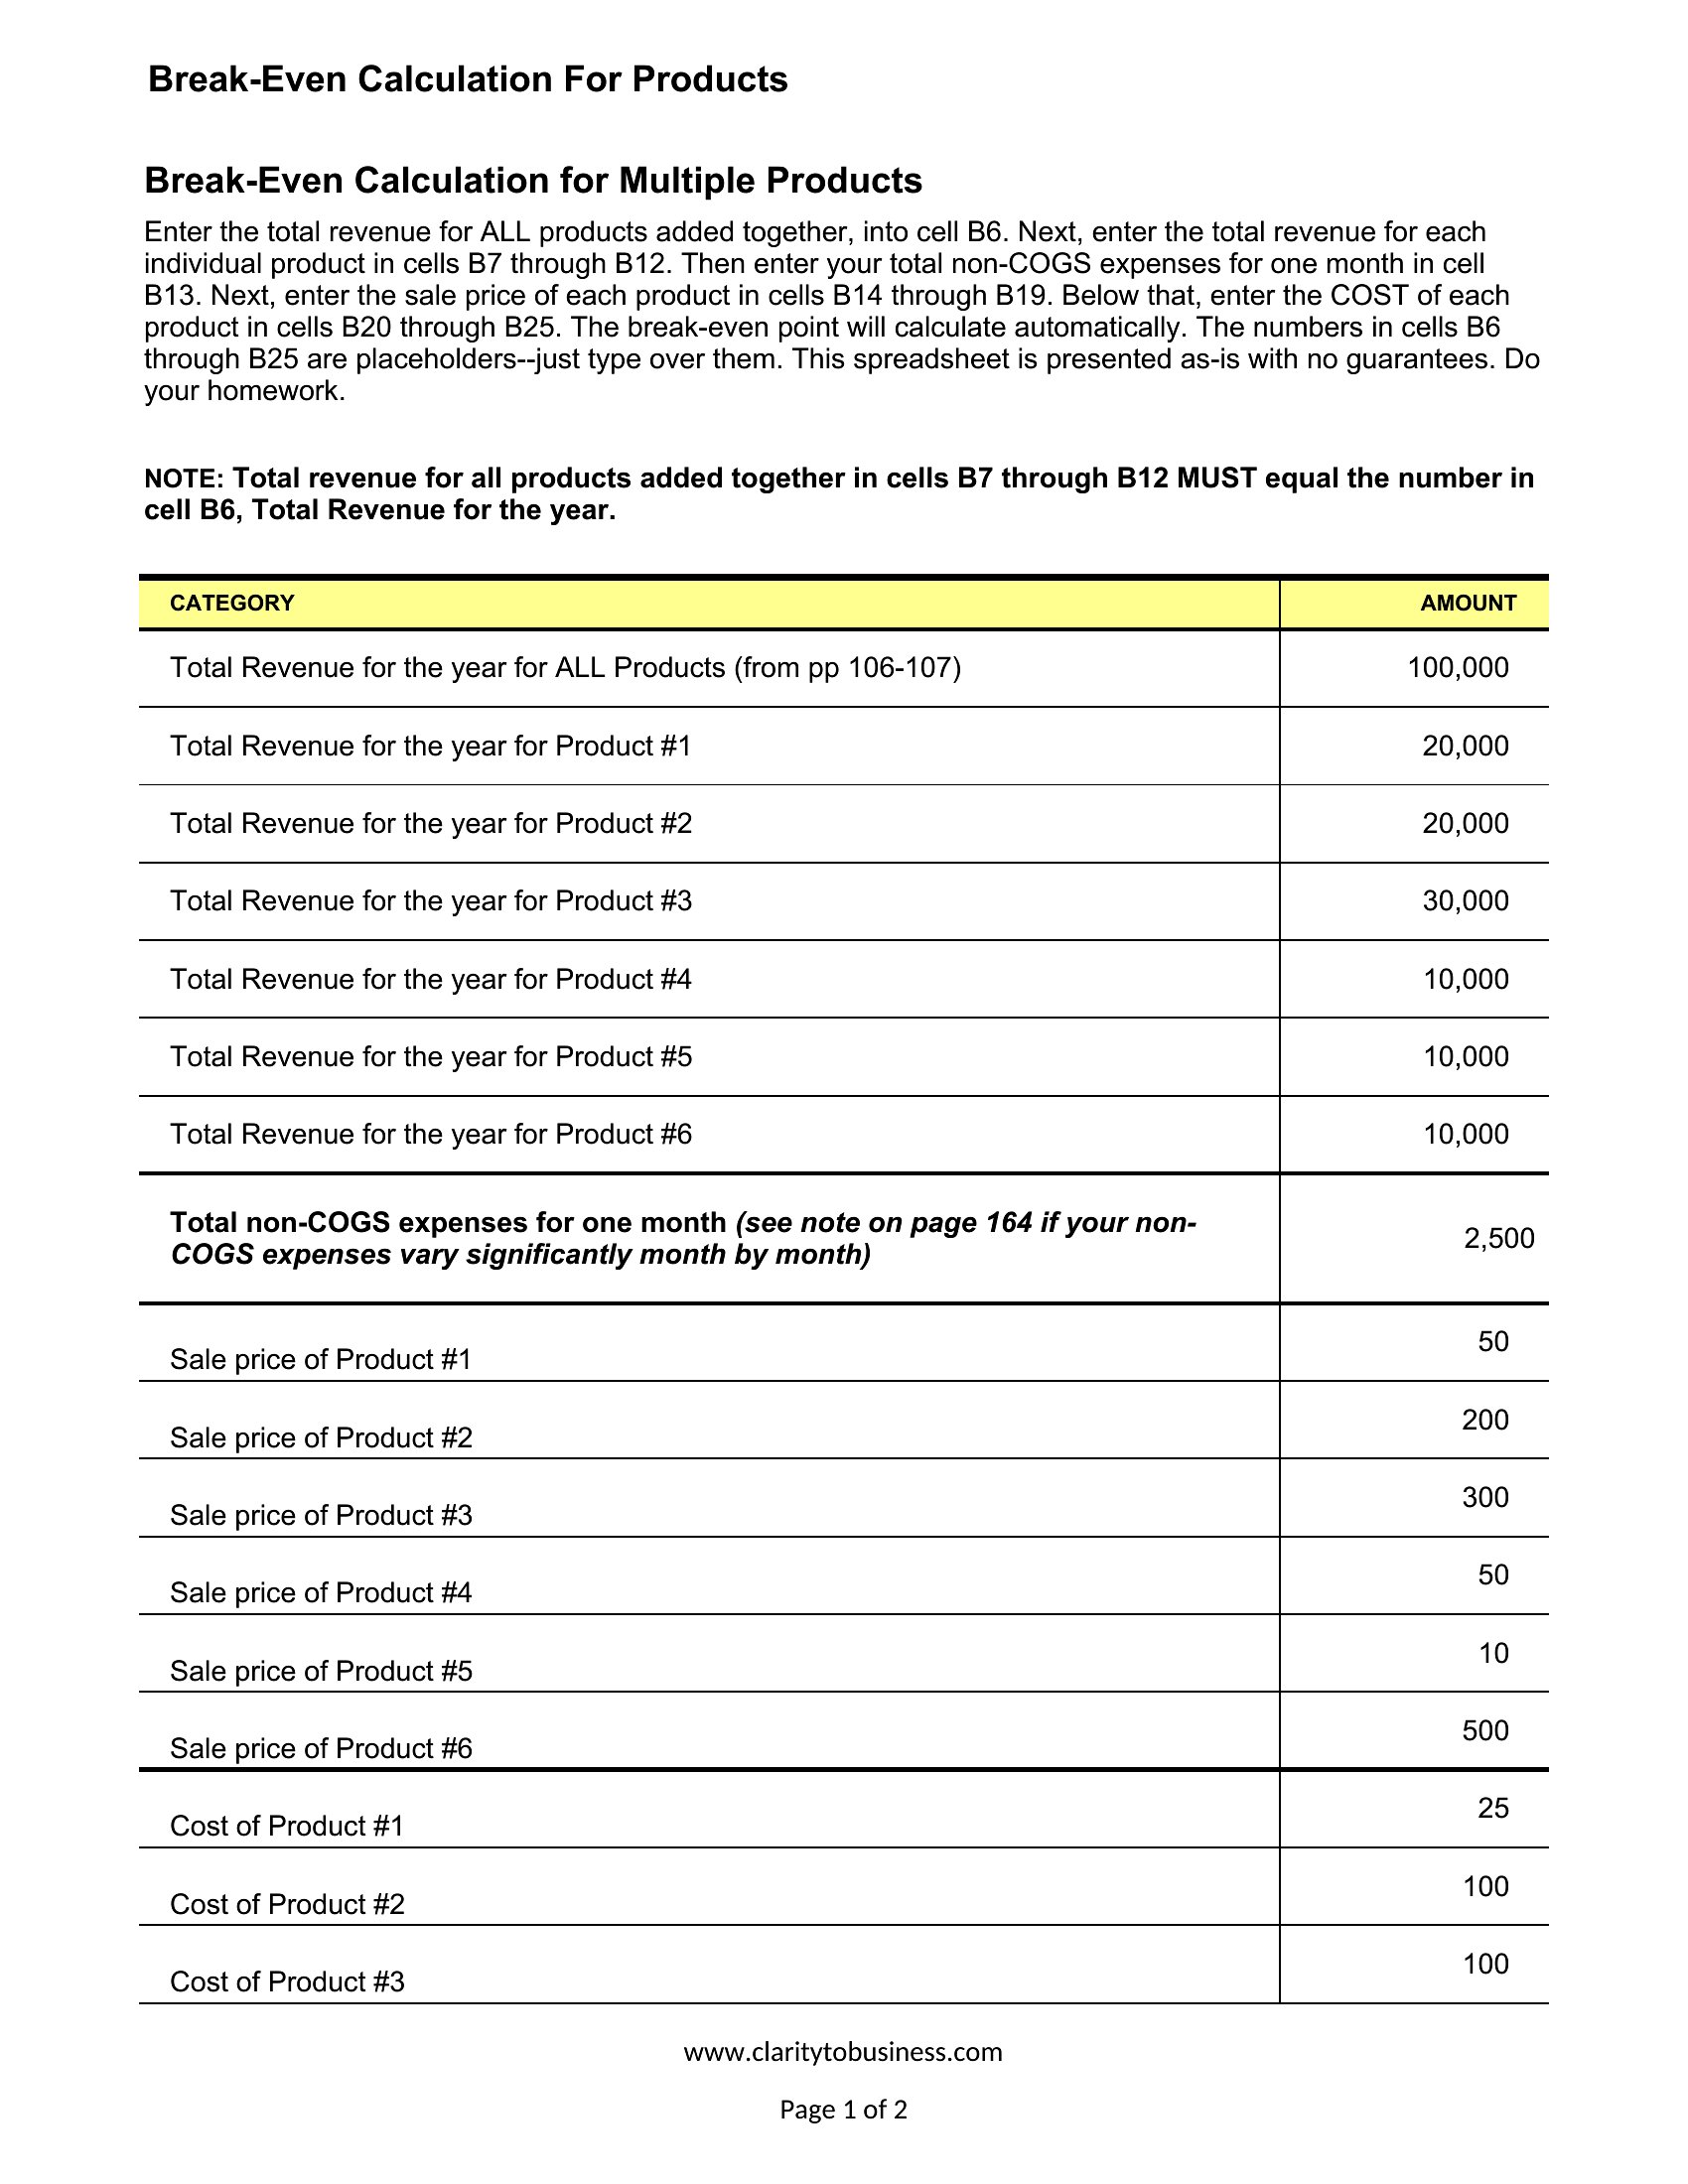
Yes, several templates in this collection—like *Multi Product Break Even Analysis*—are designed to factor in different pricing, costs, and sales volumes for each product. Input your data for each line, and the template calculates the combined break-even point. This is particularly useful for e-commerce stores or manufacturers selling diverse inventory.
How do I adjust the template if my fixed or variable costs change monthly?
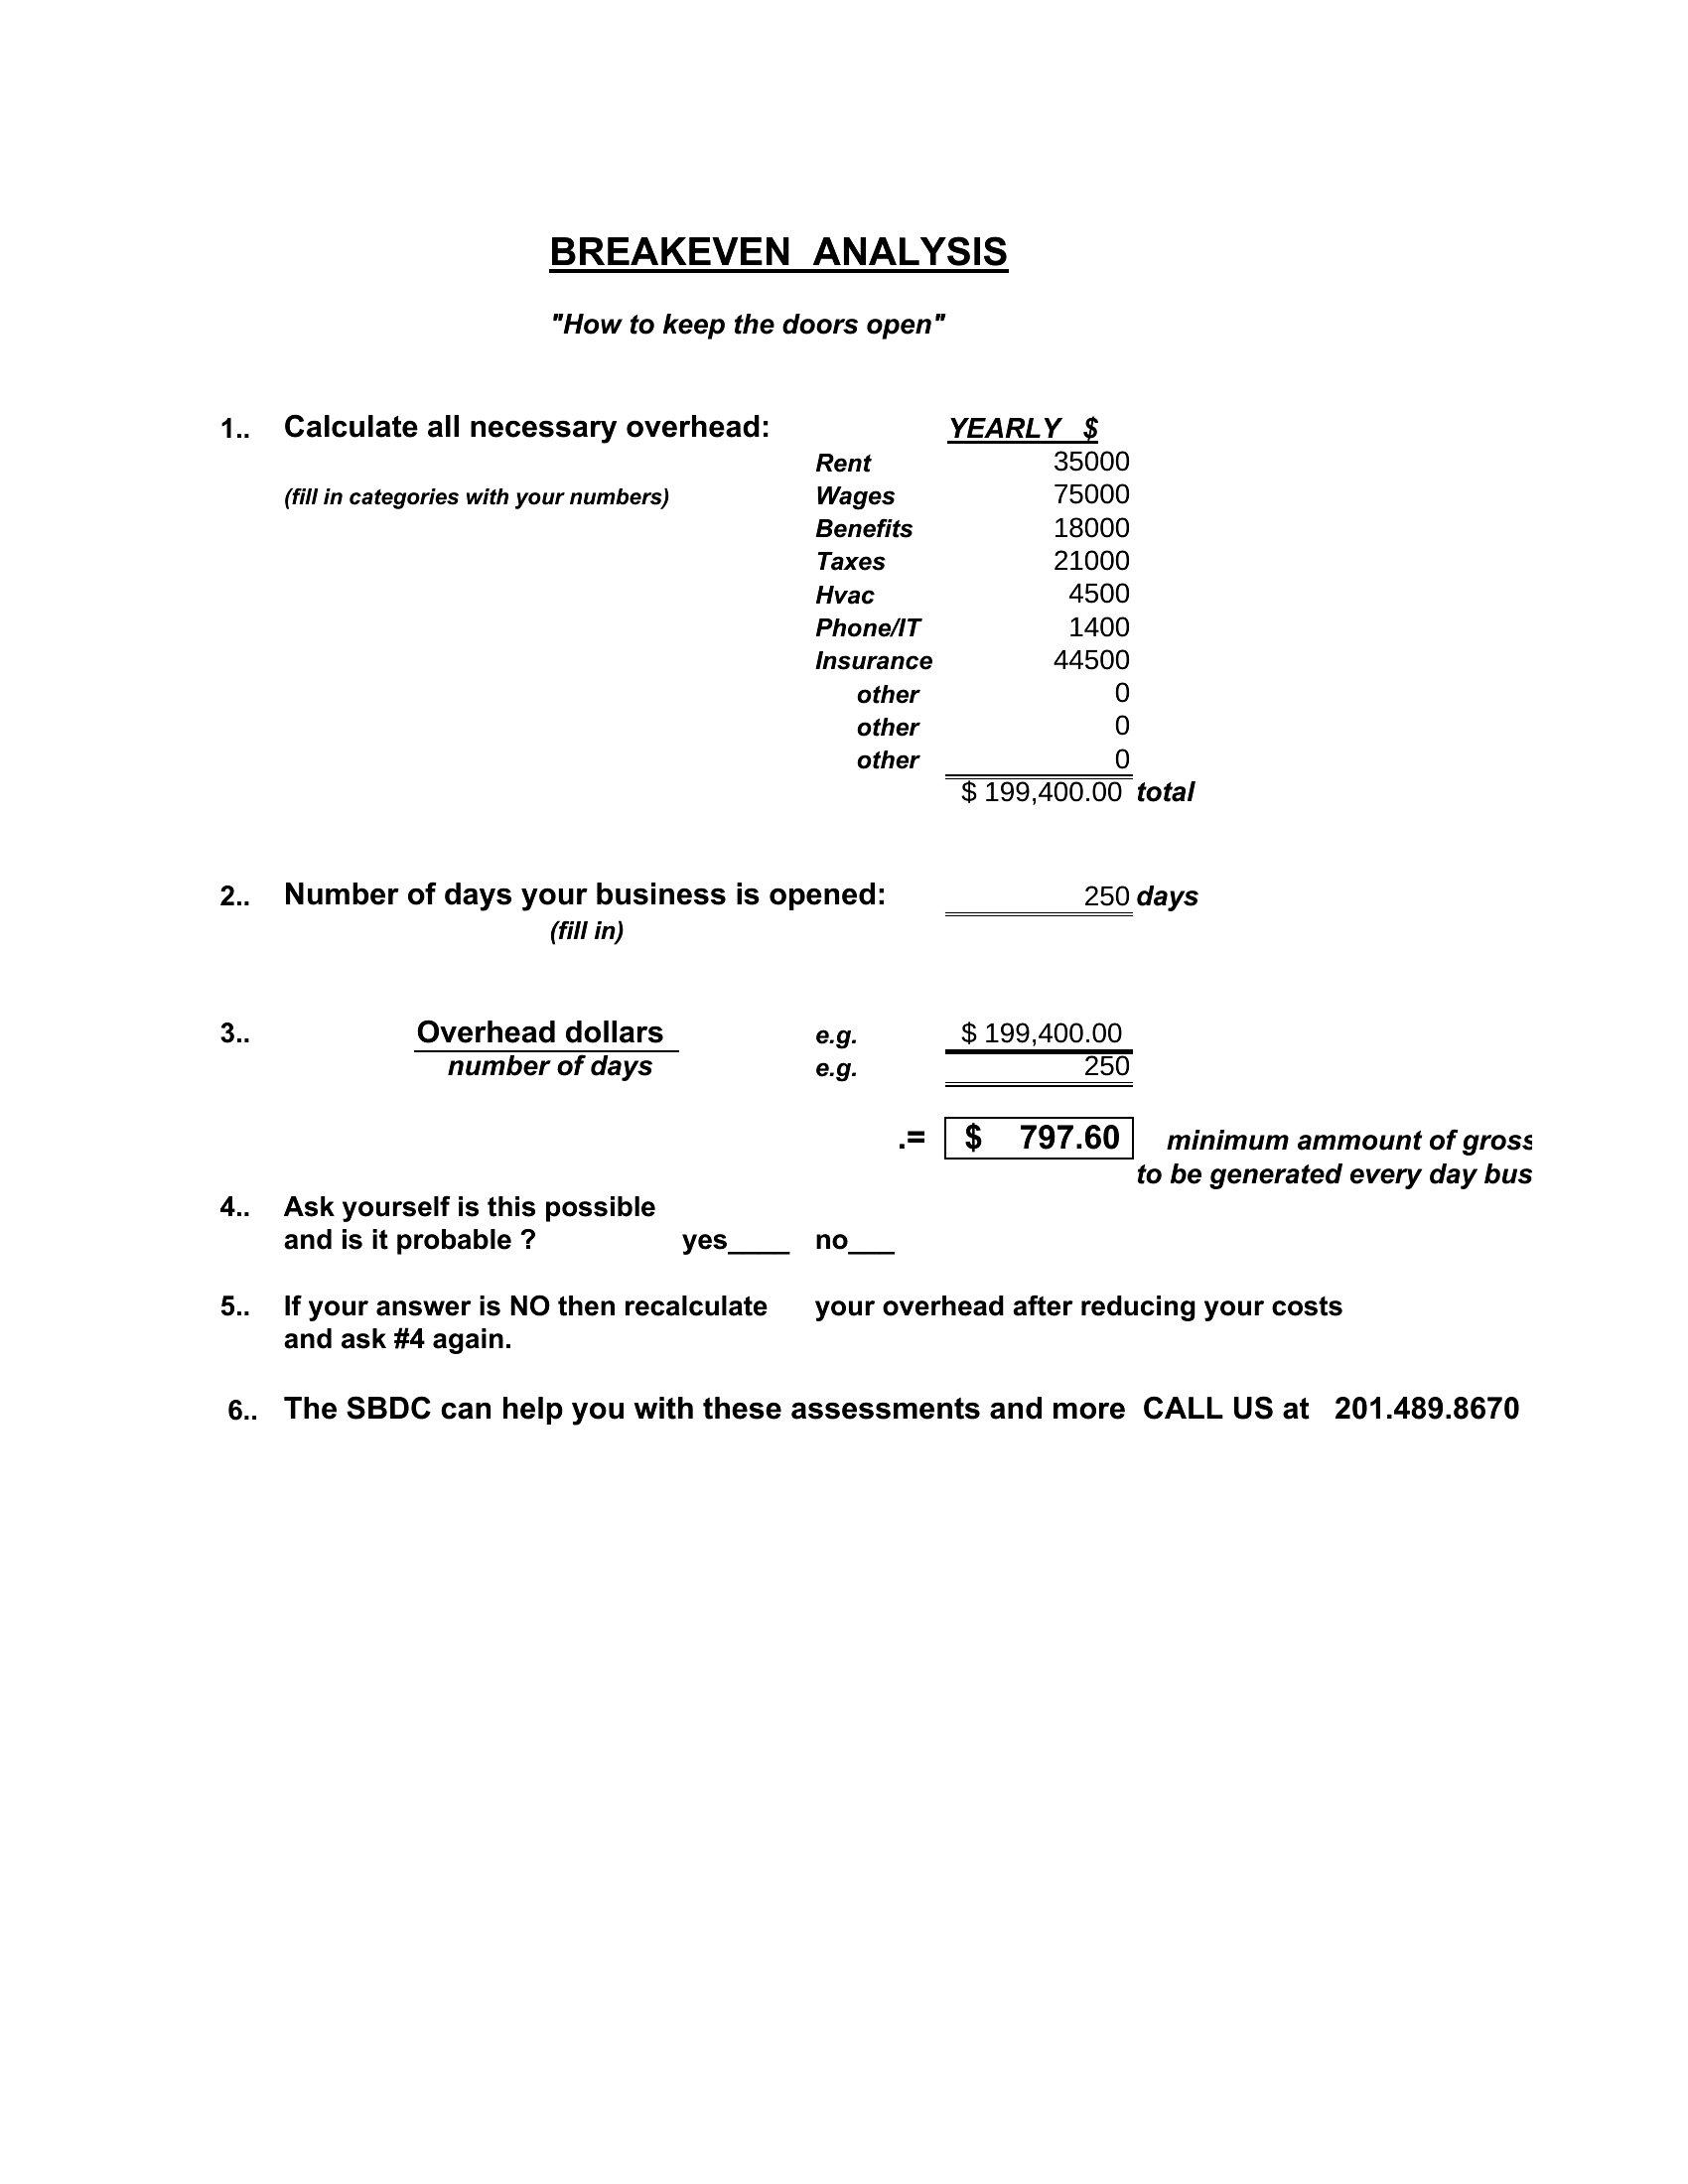
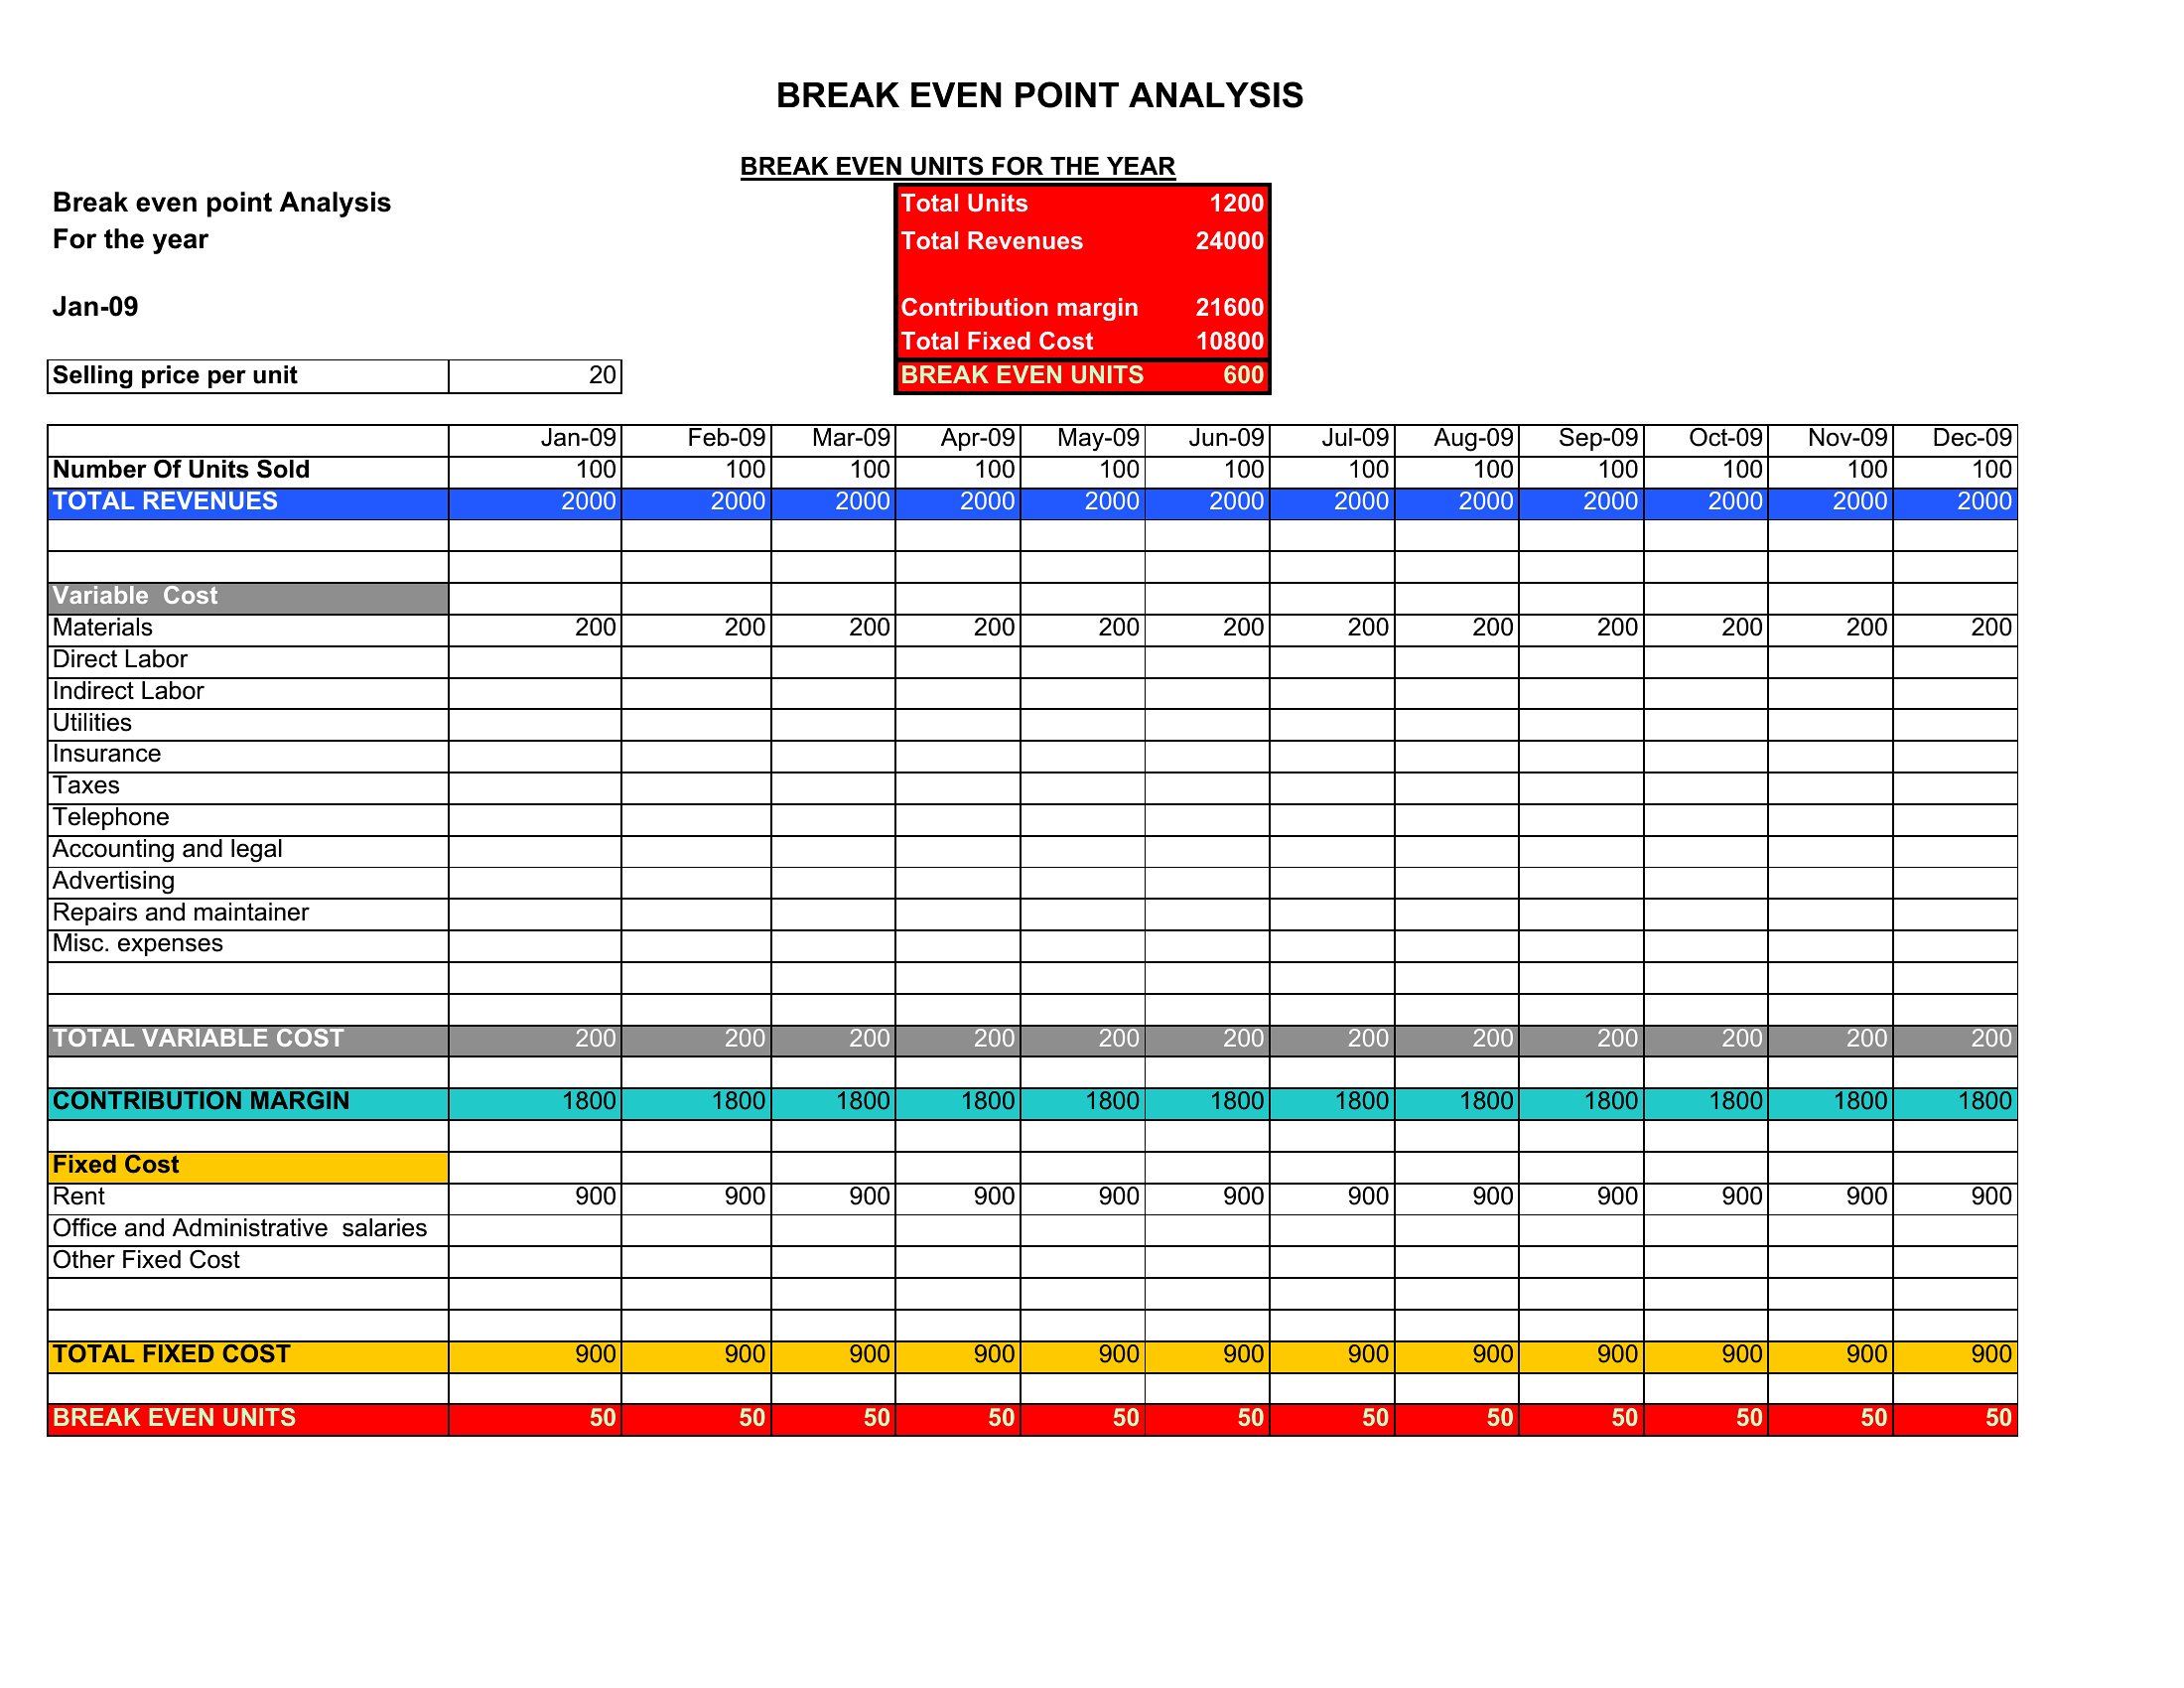
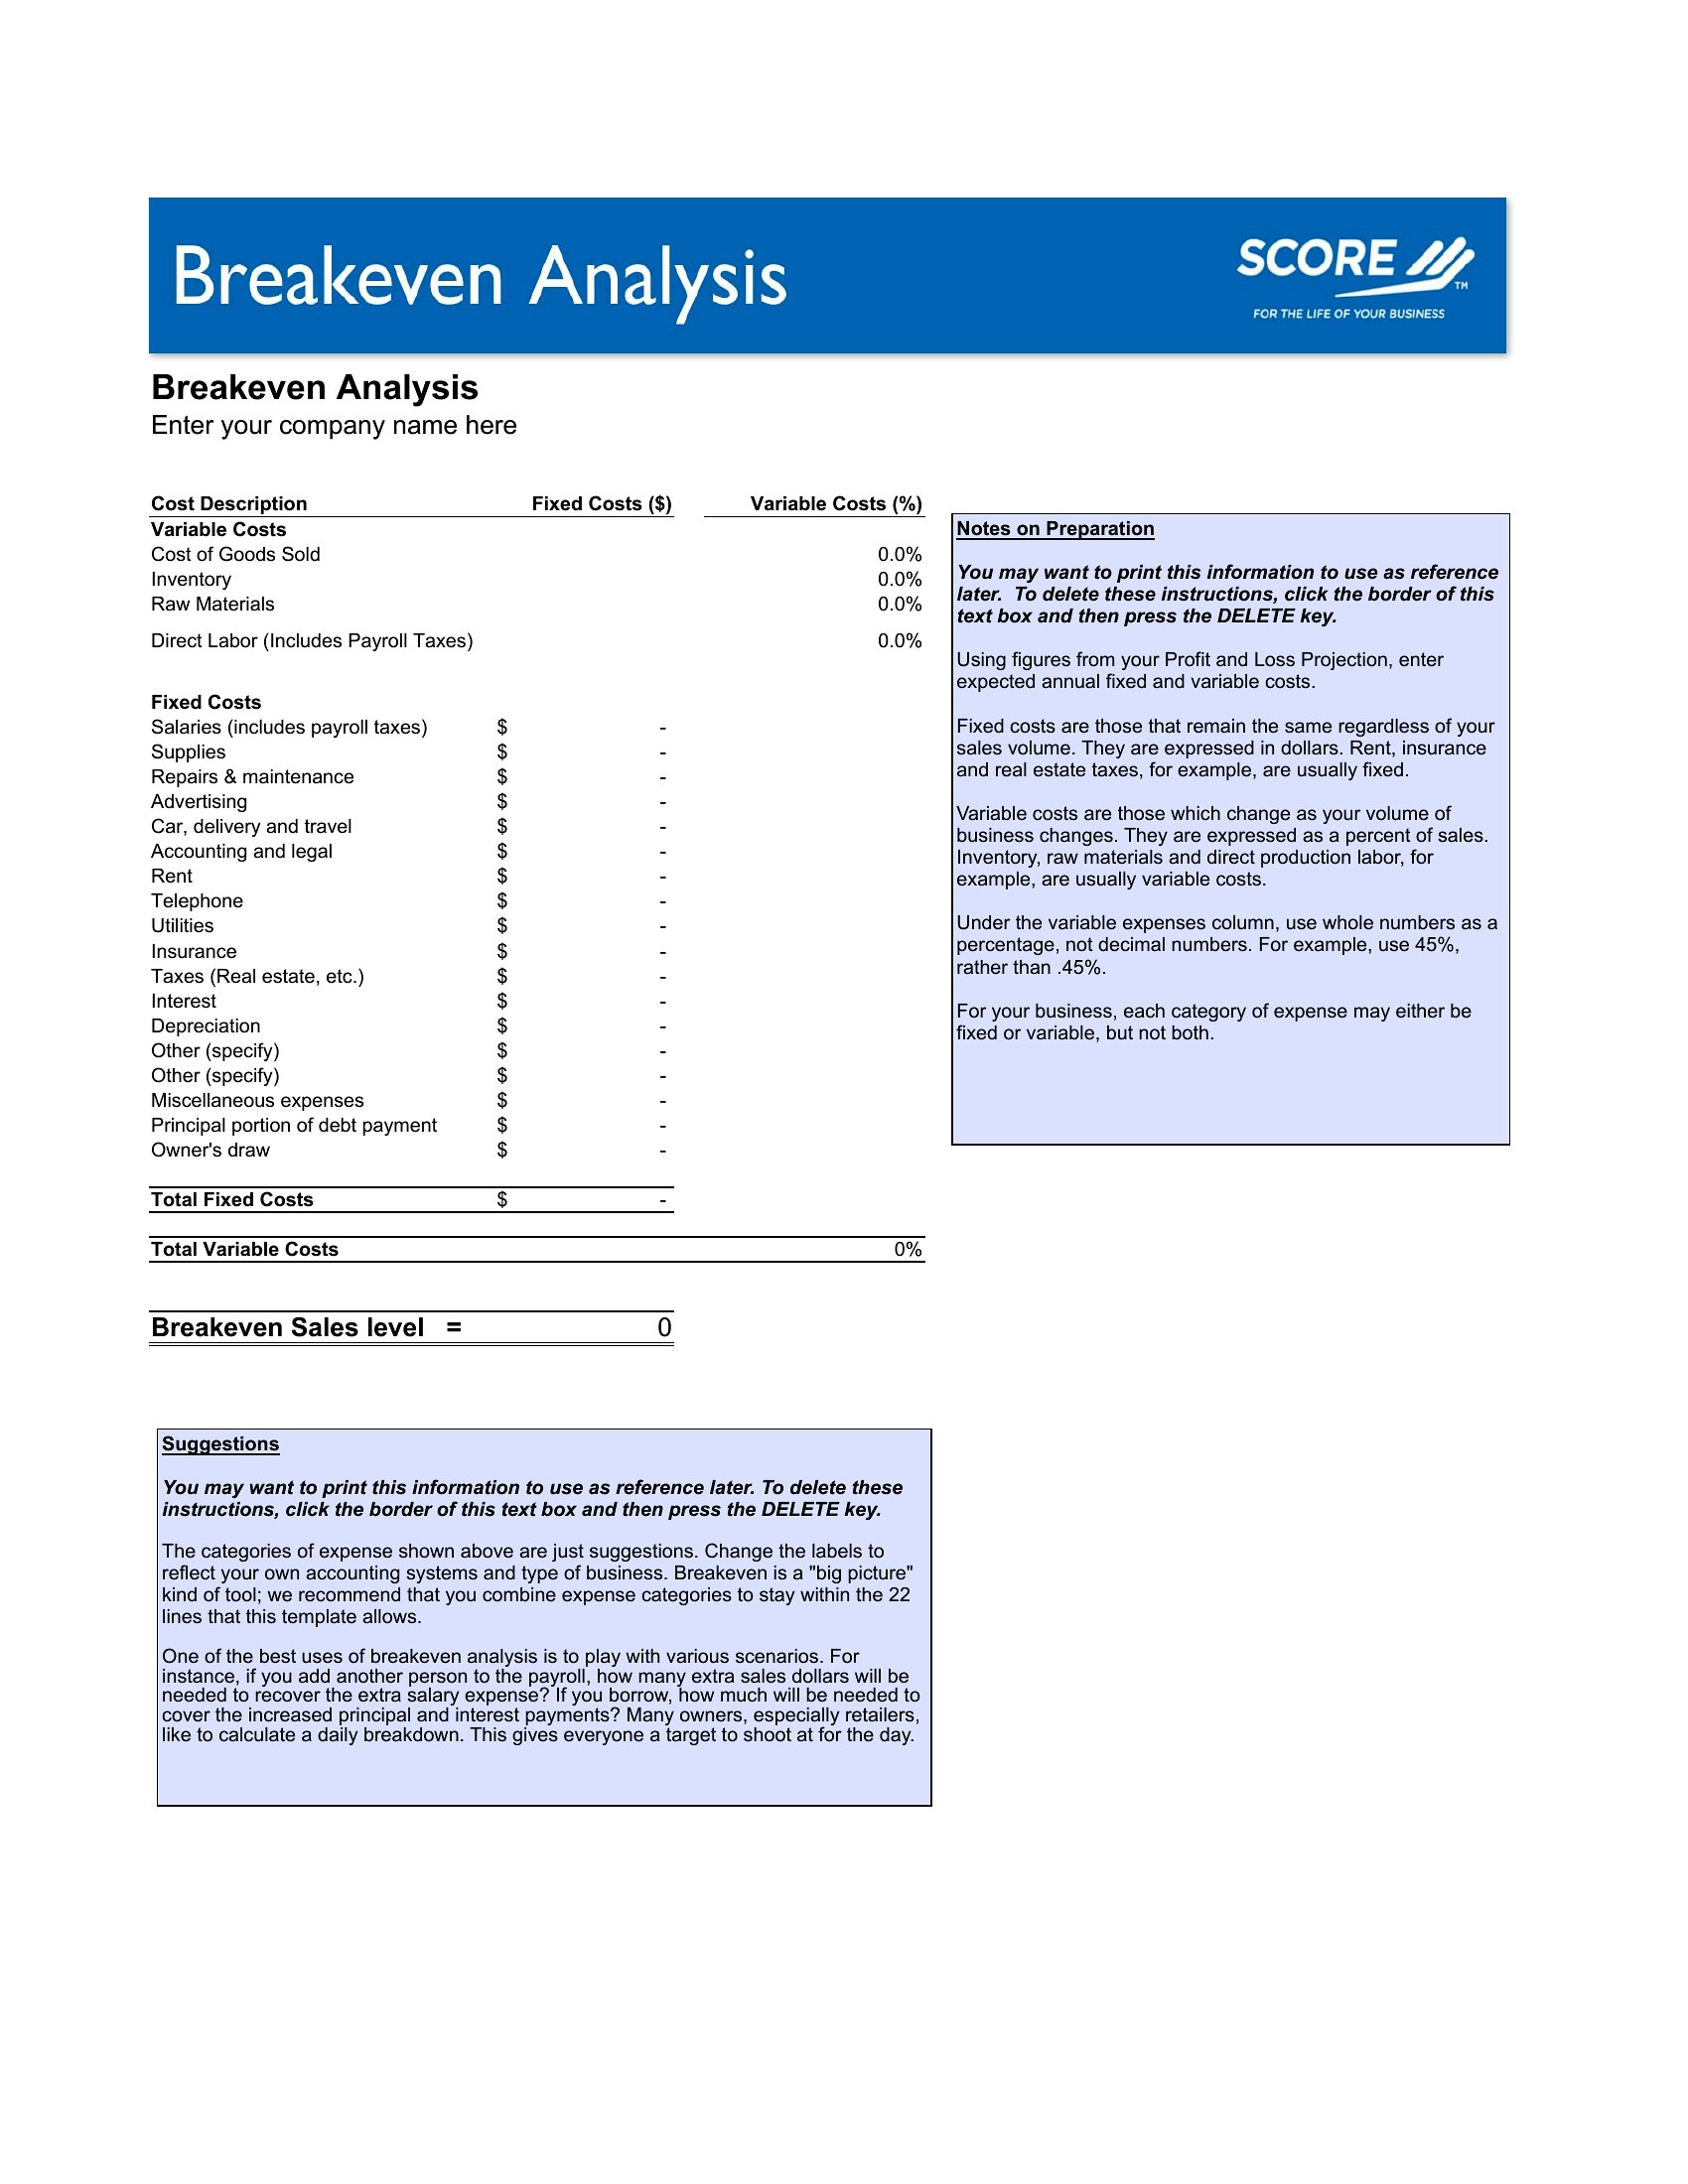
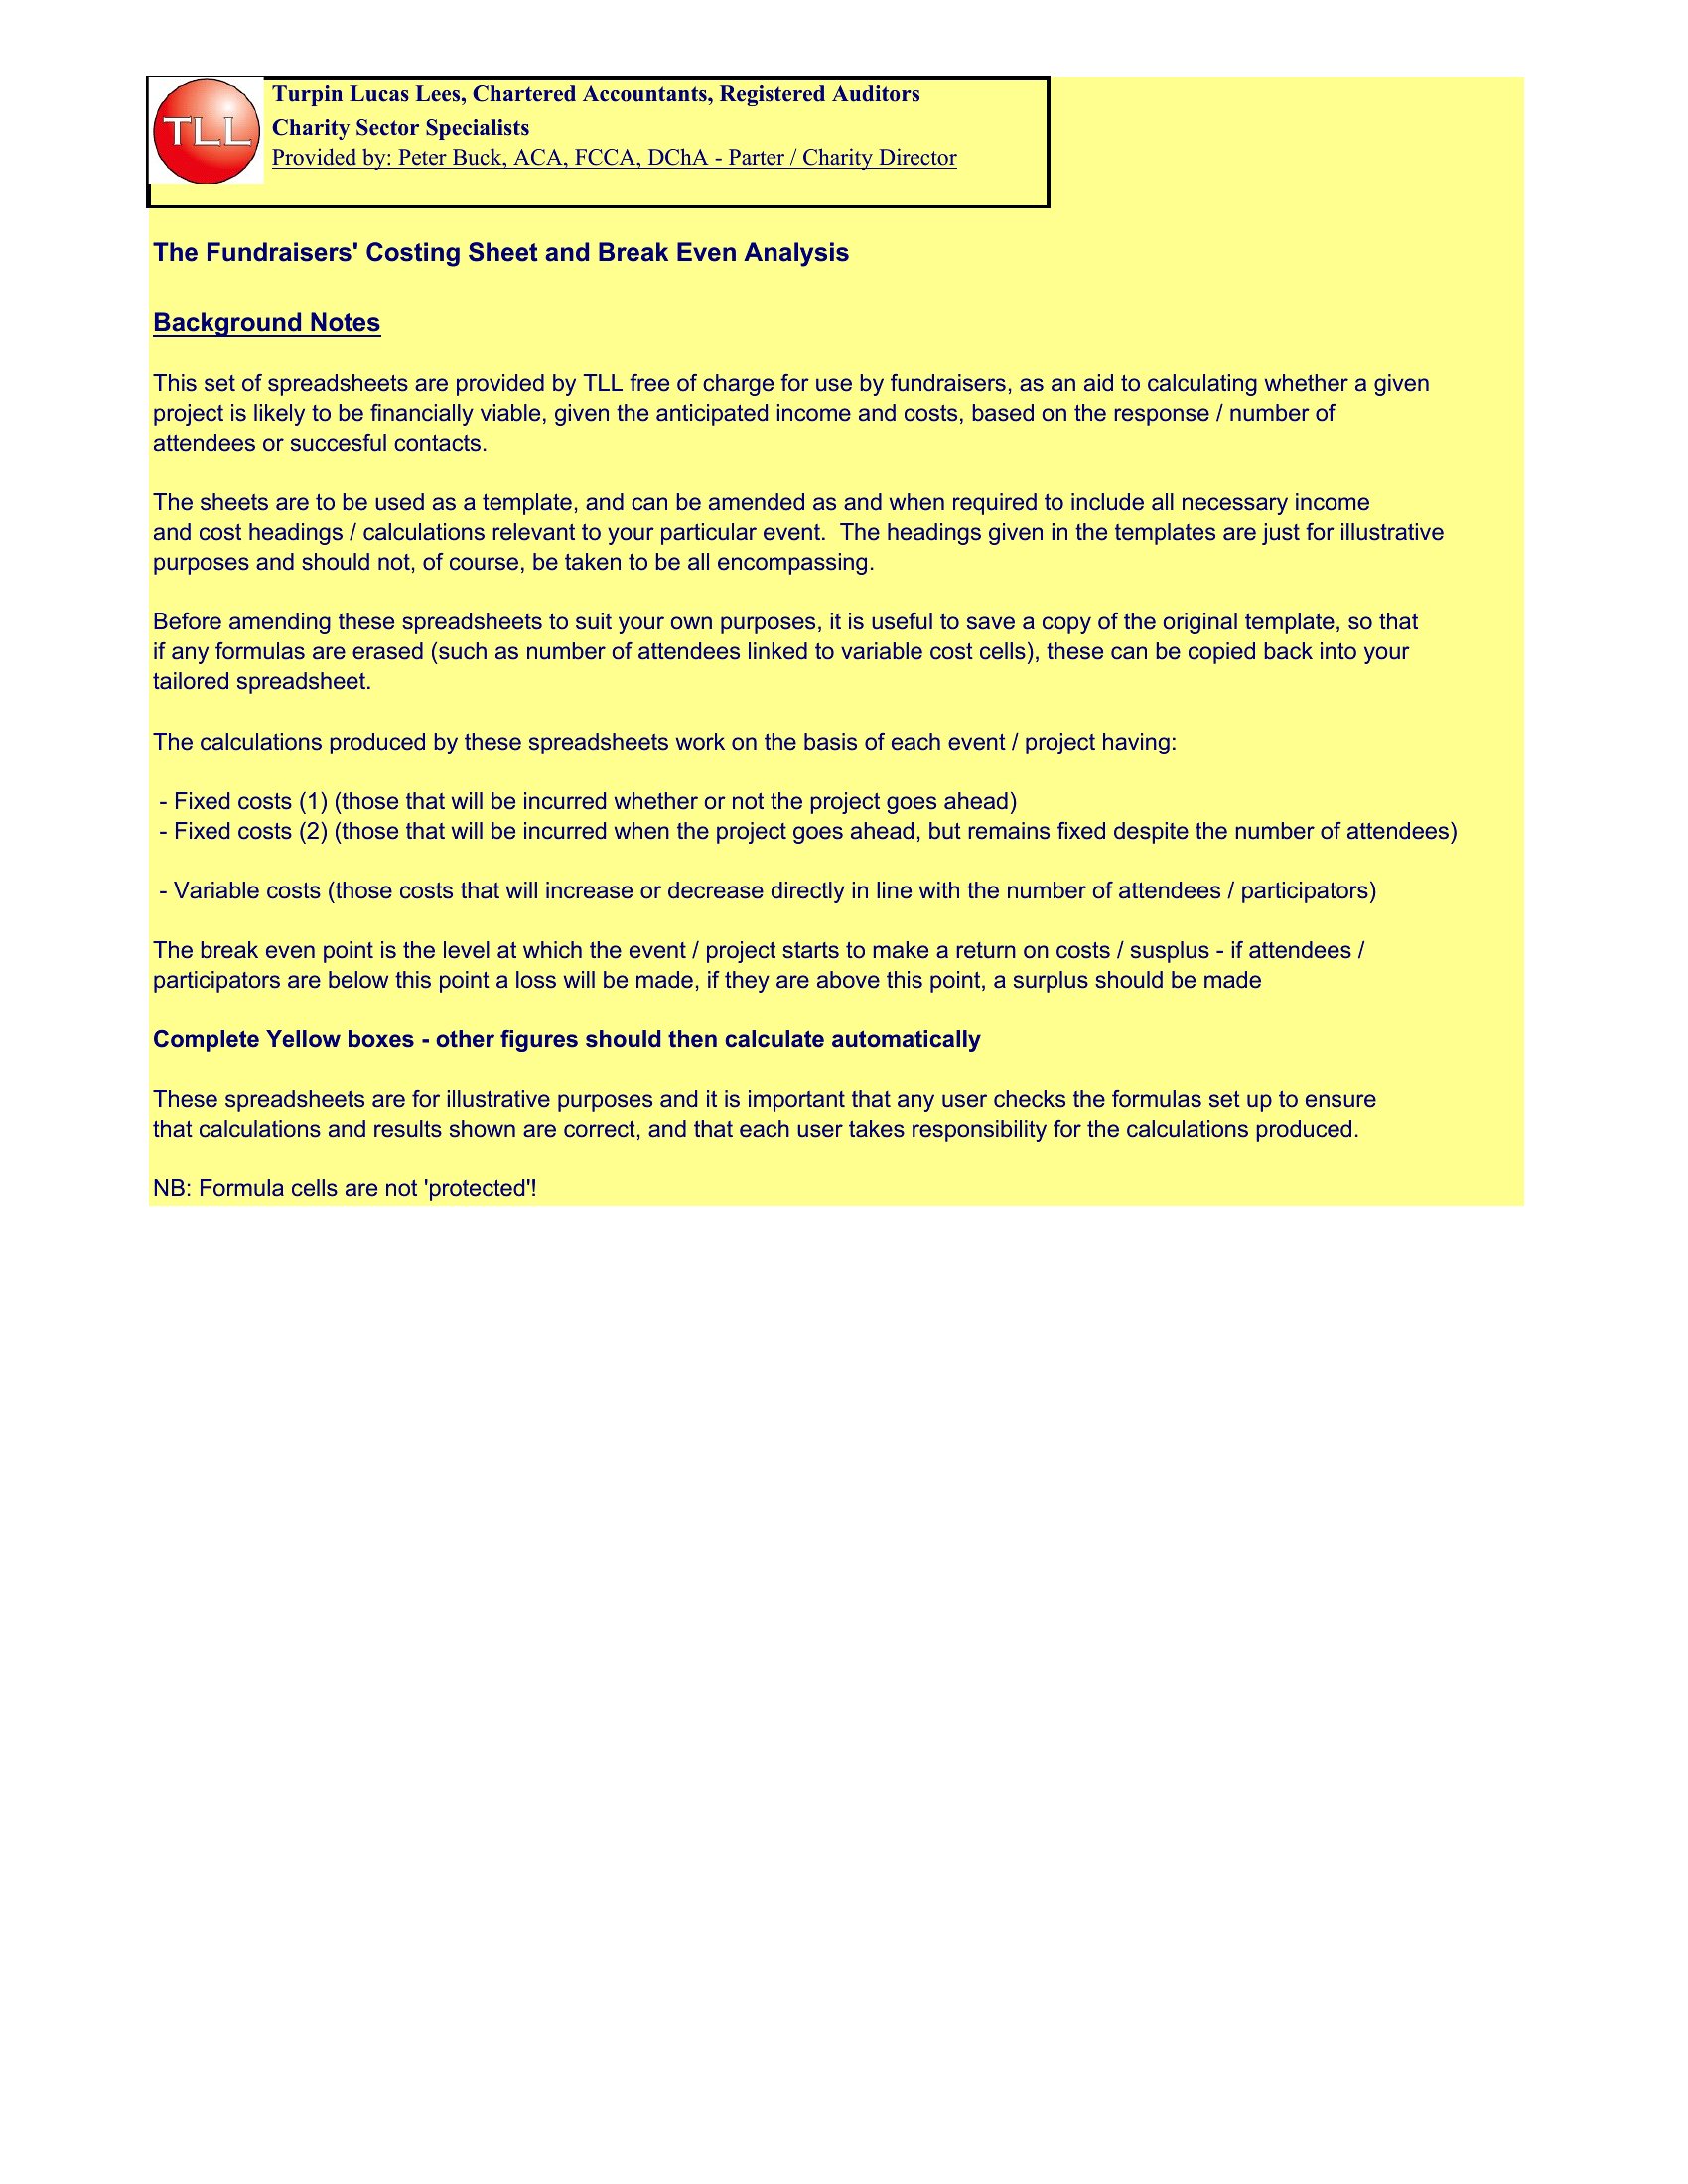
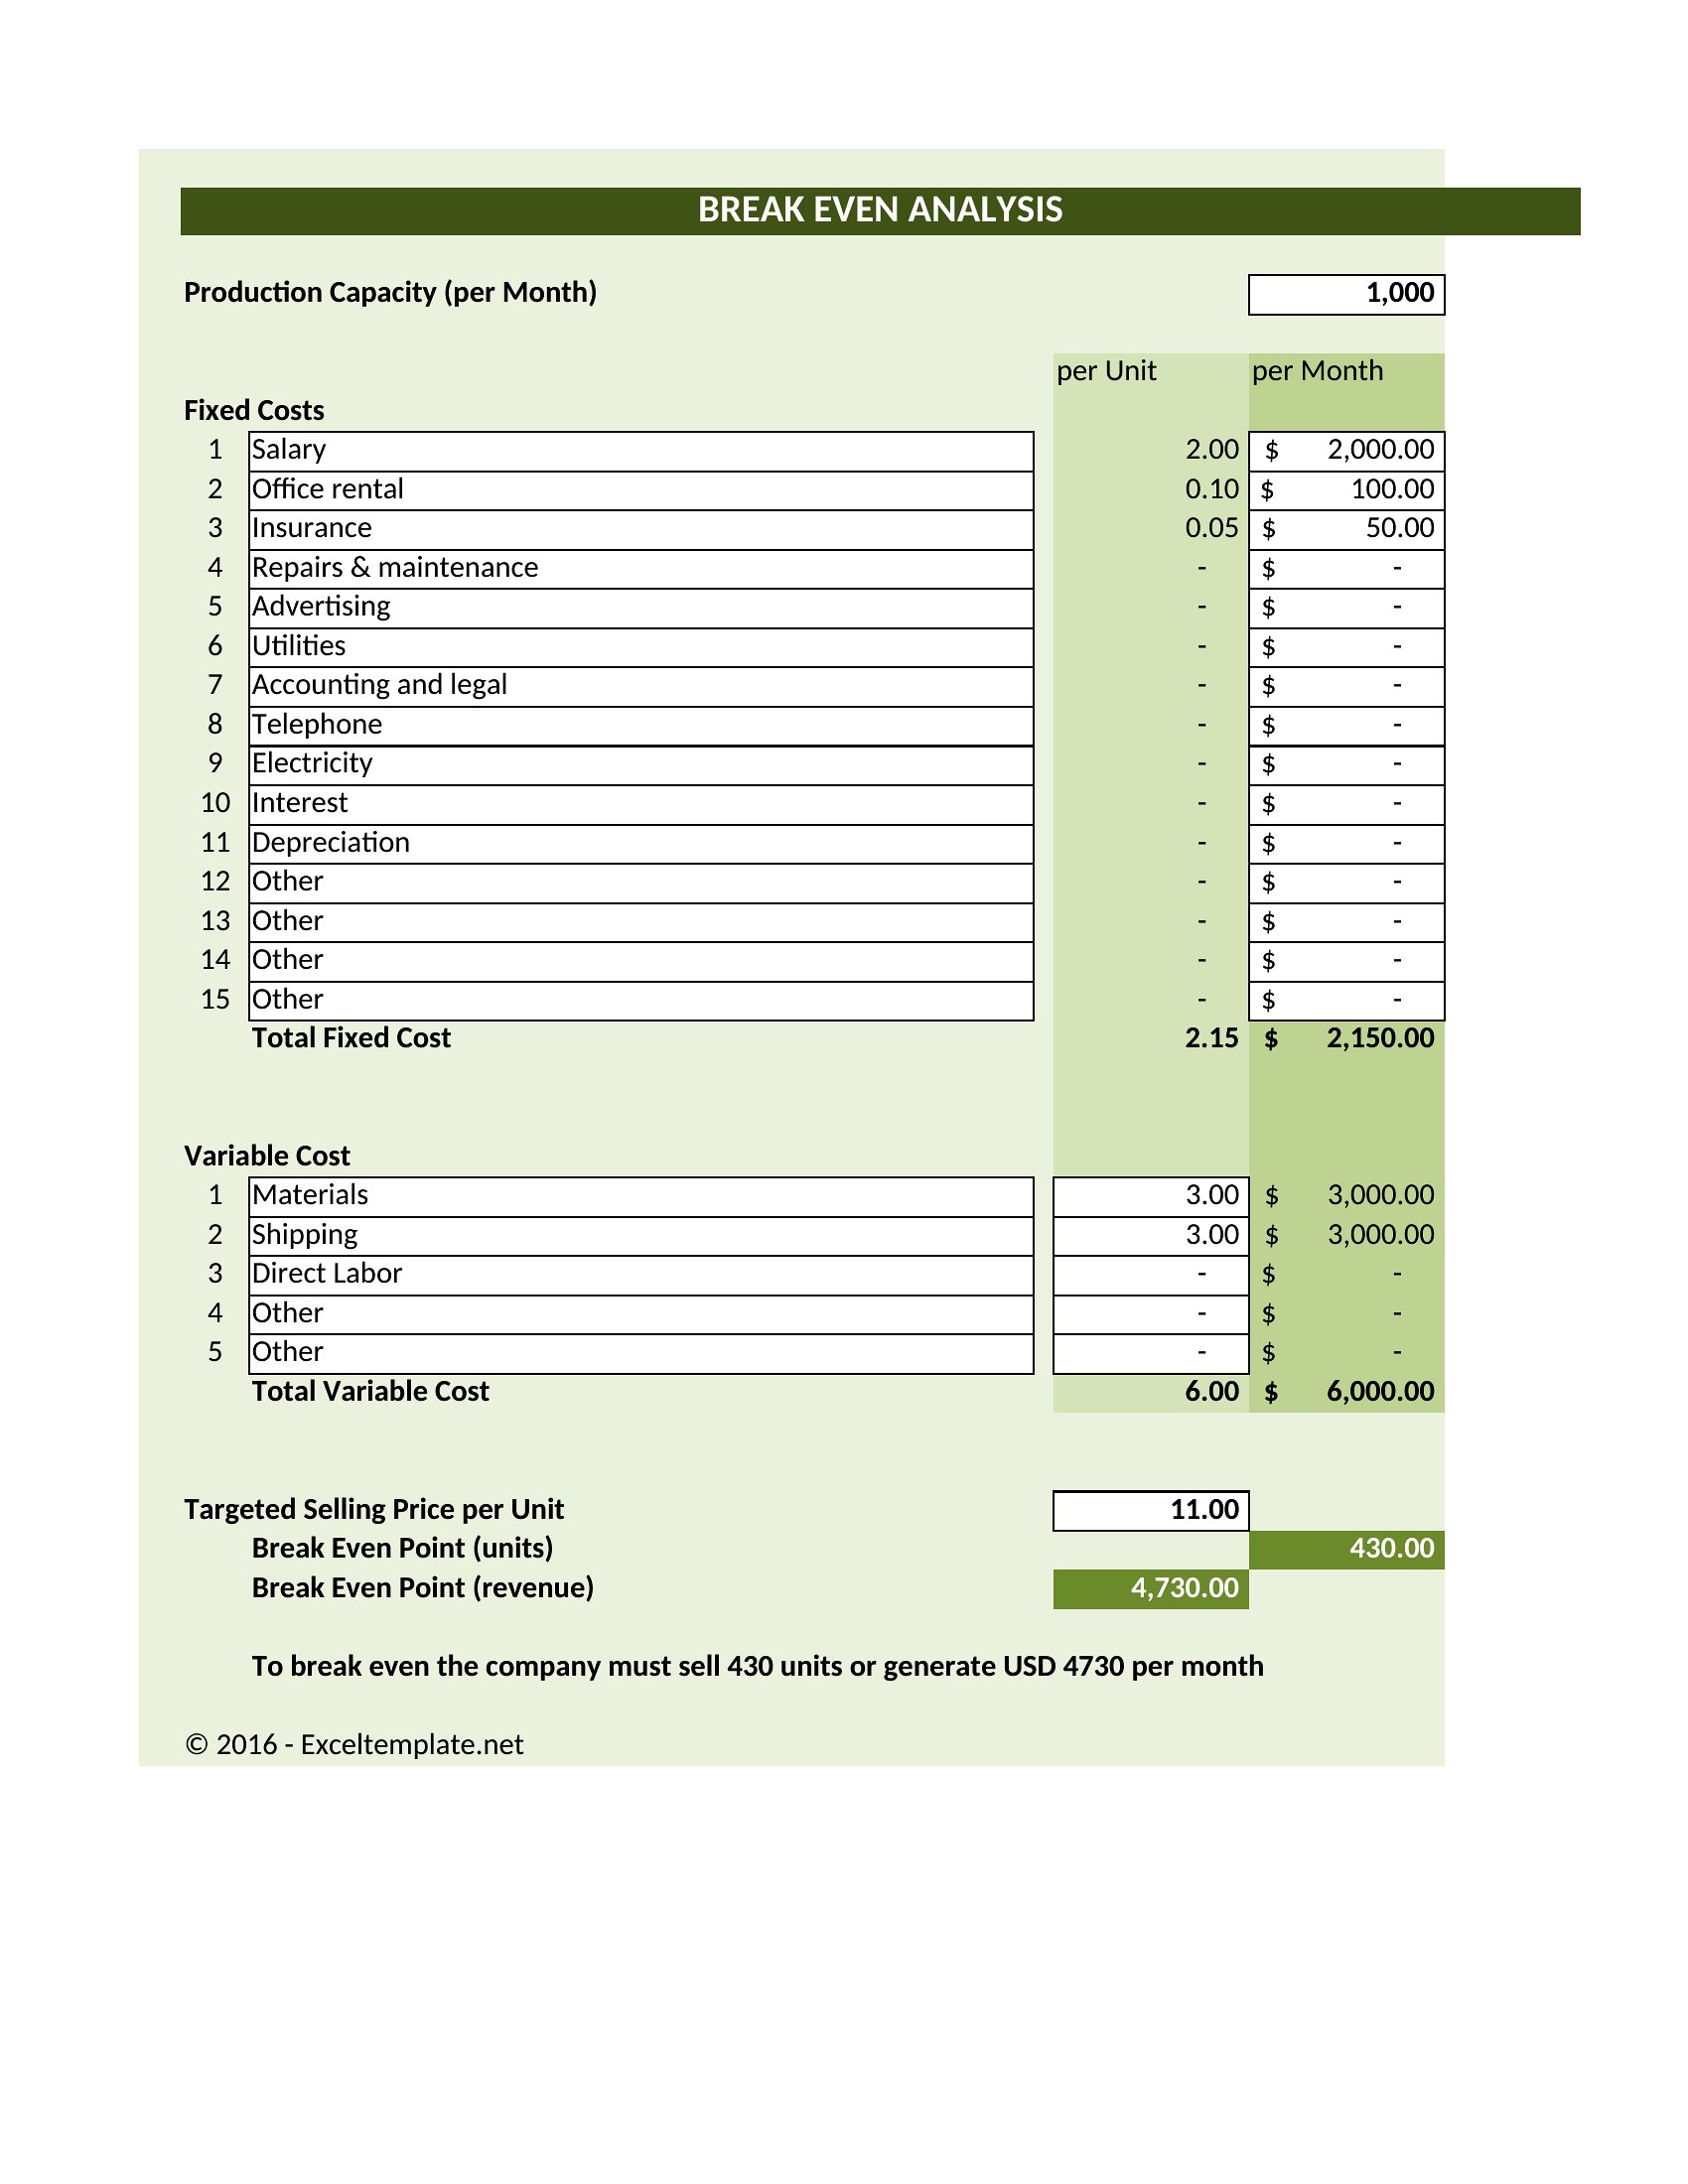
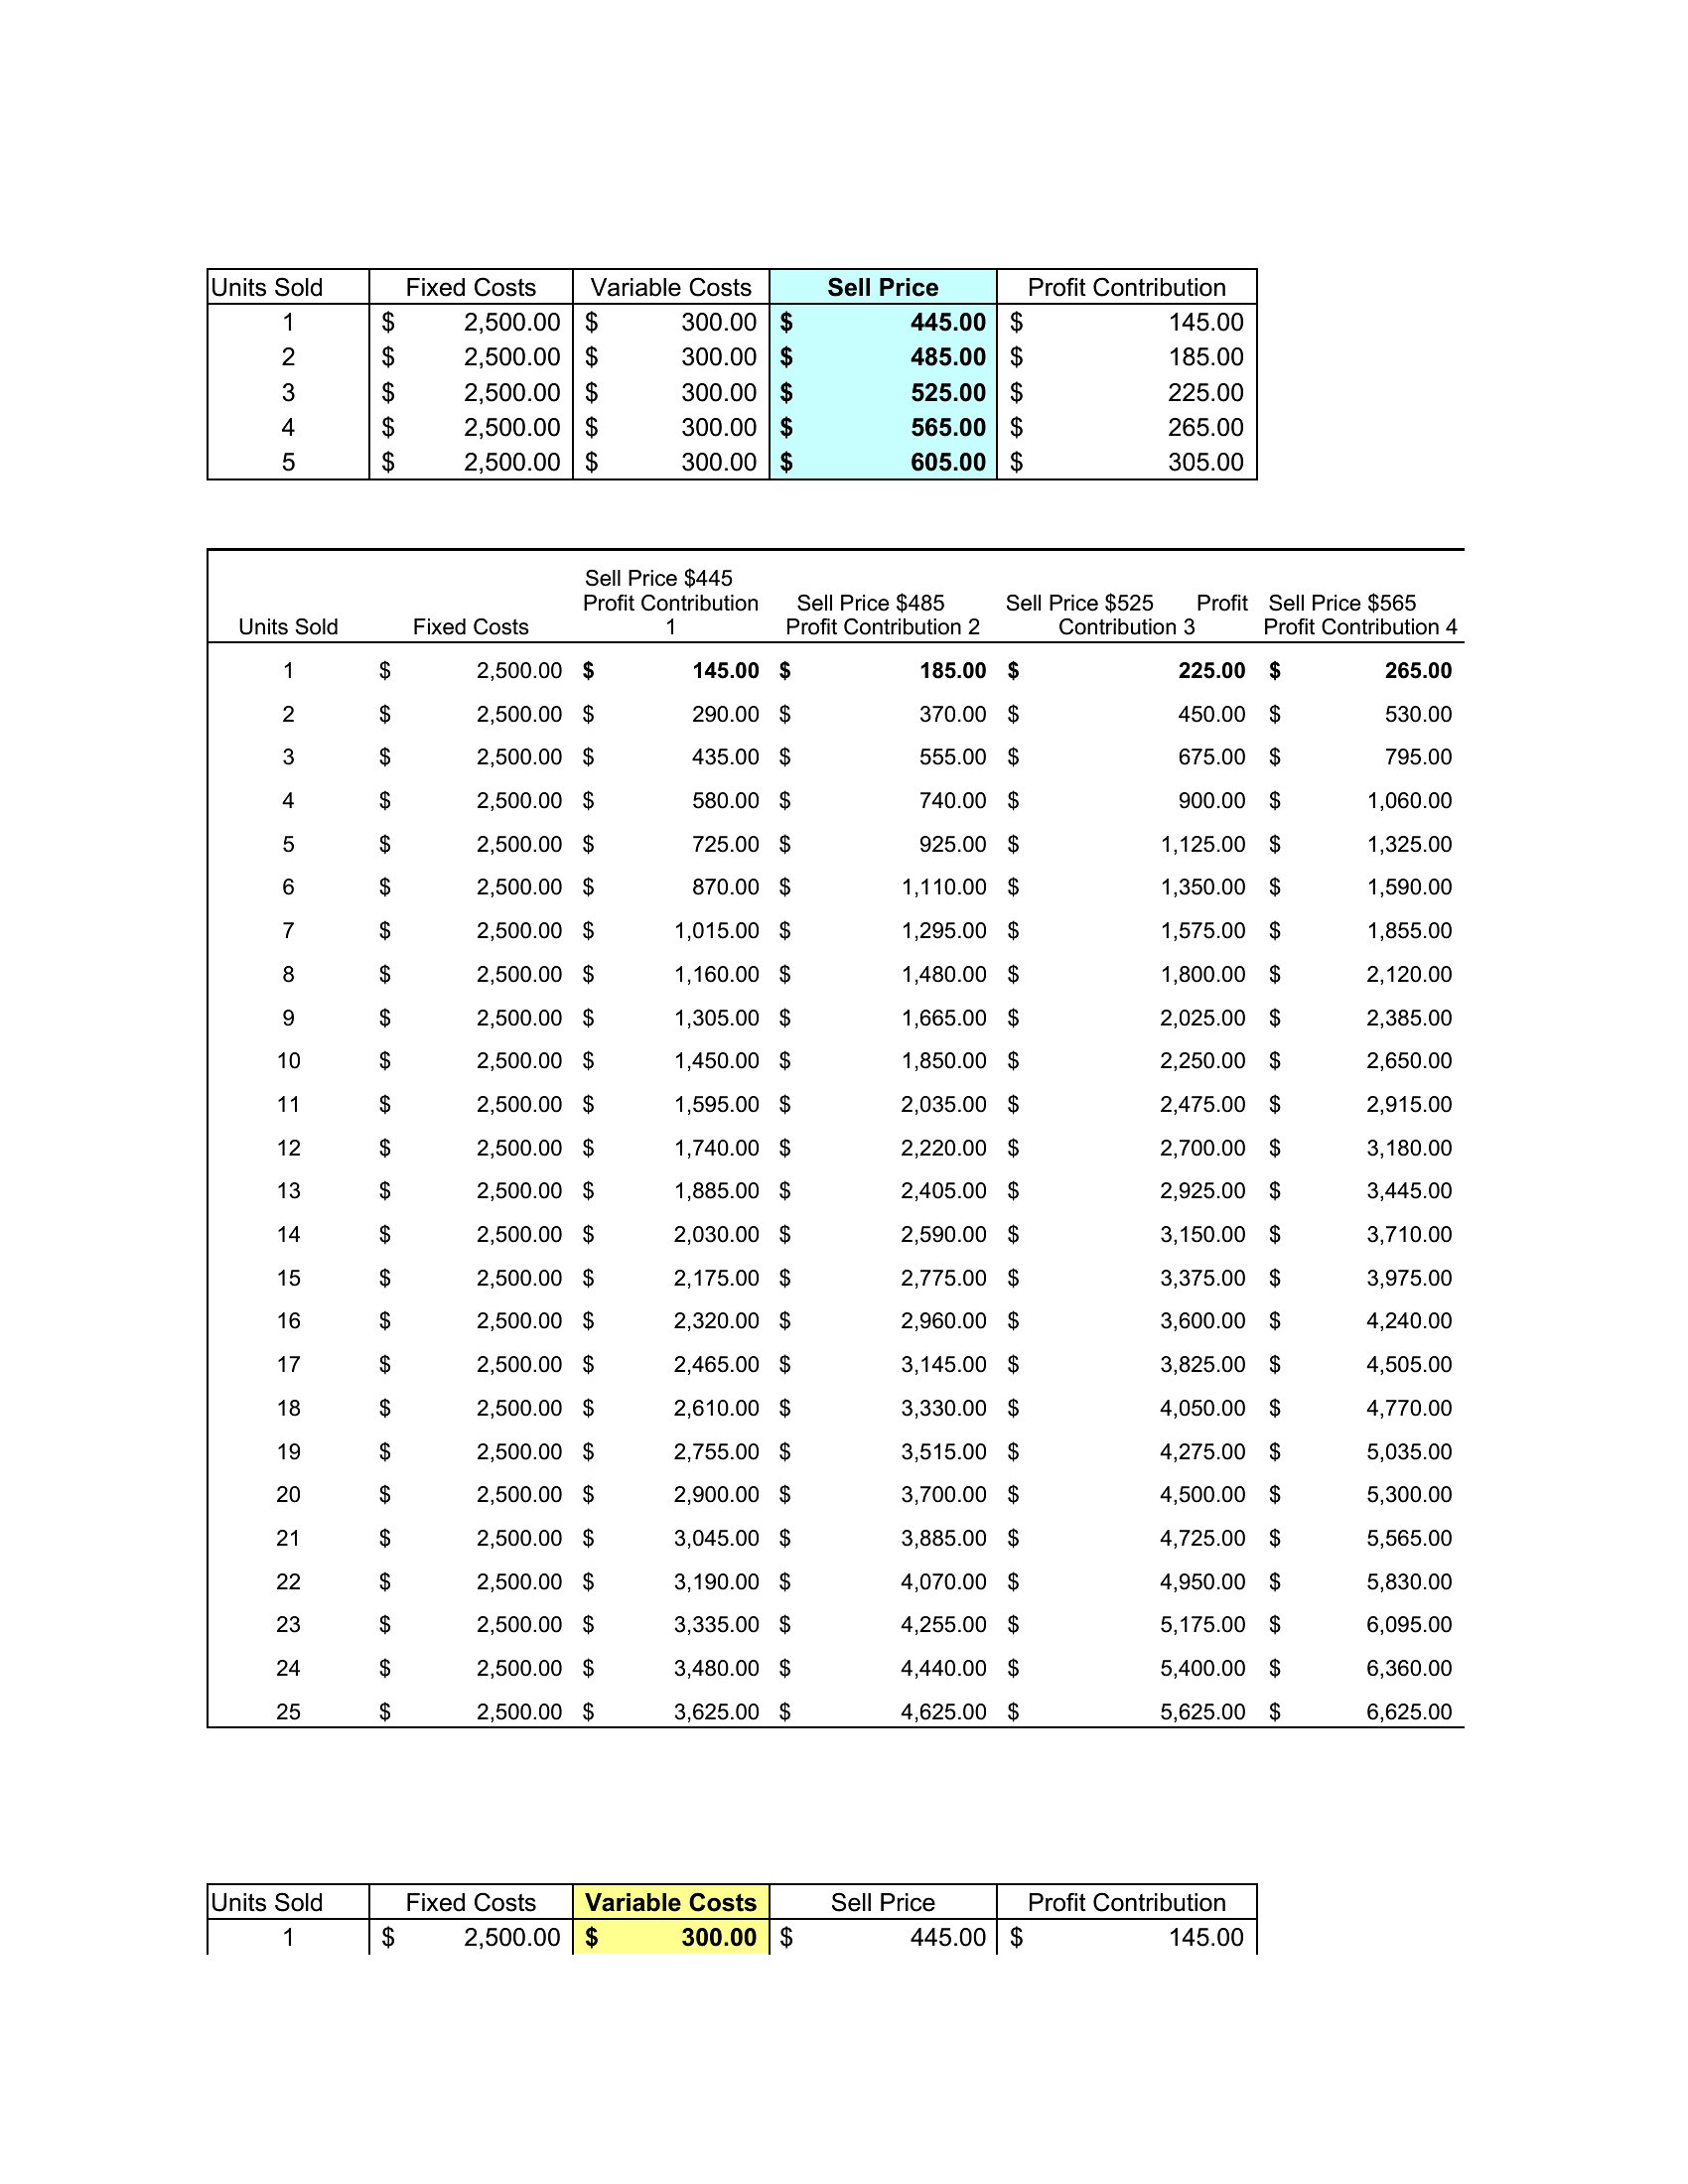
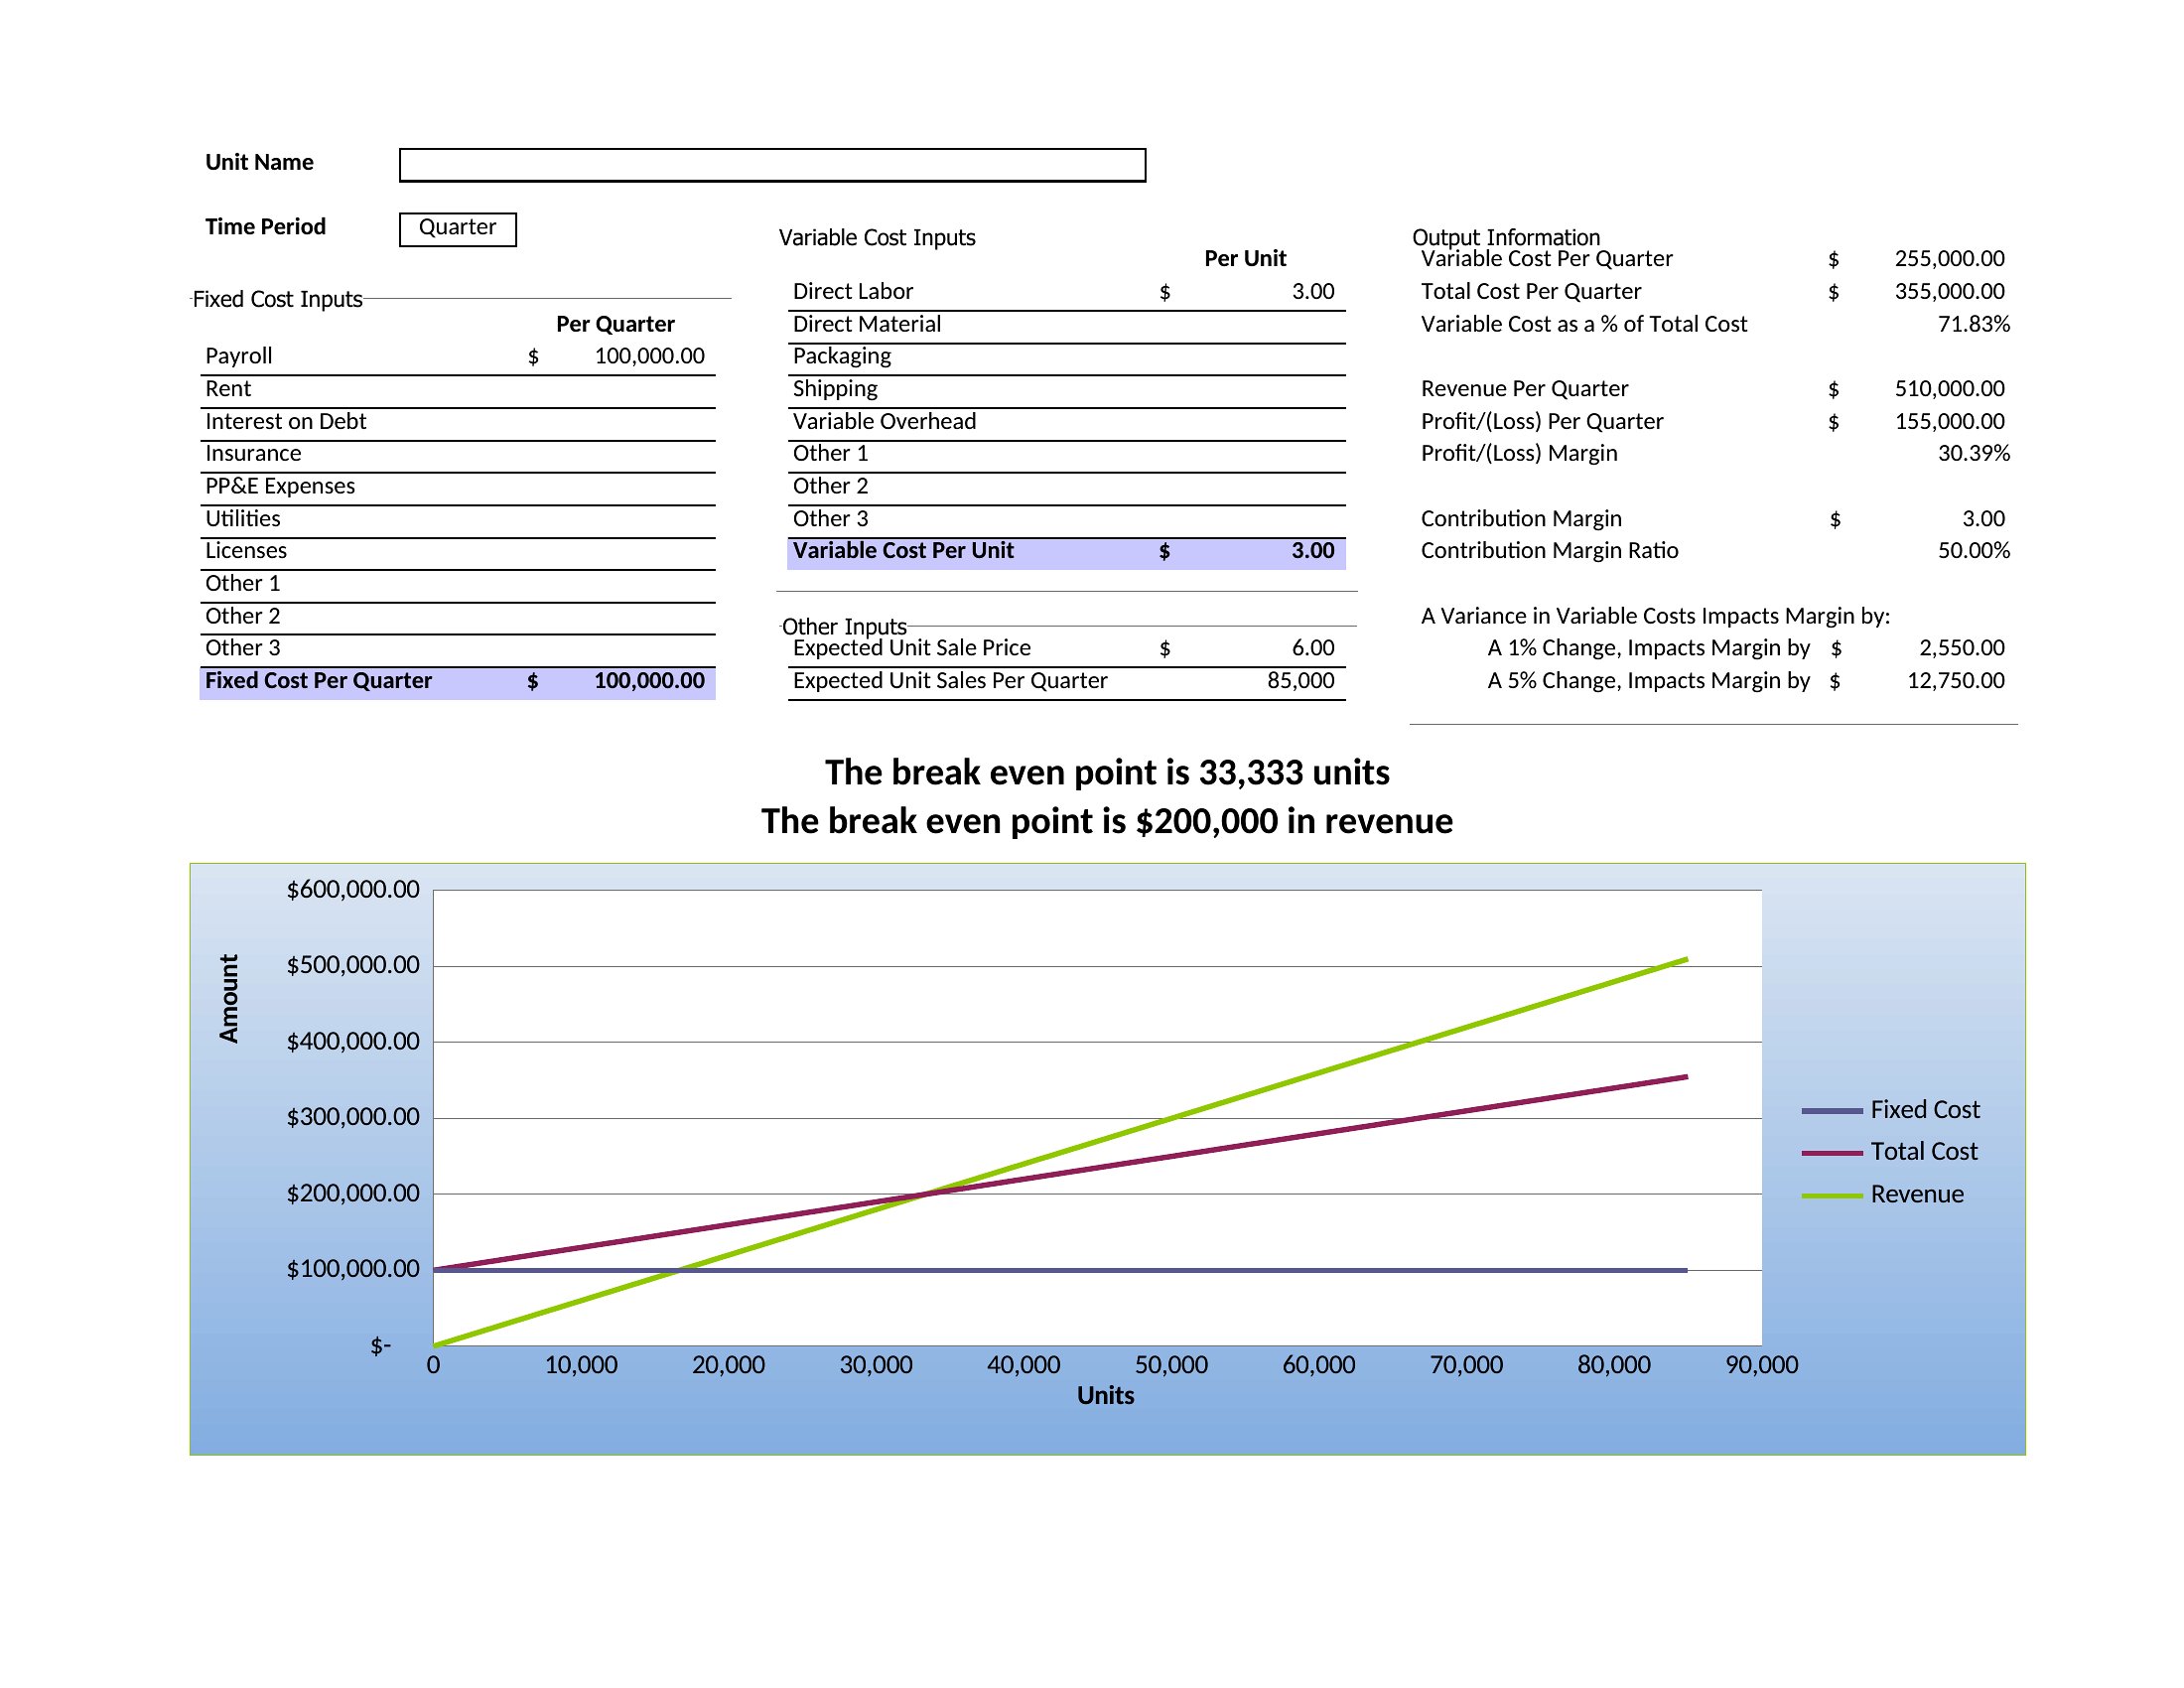
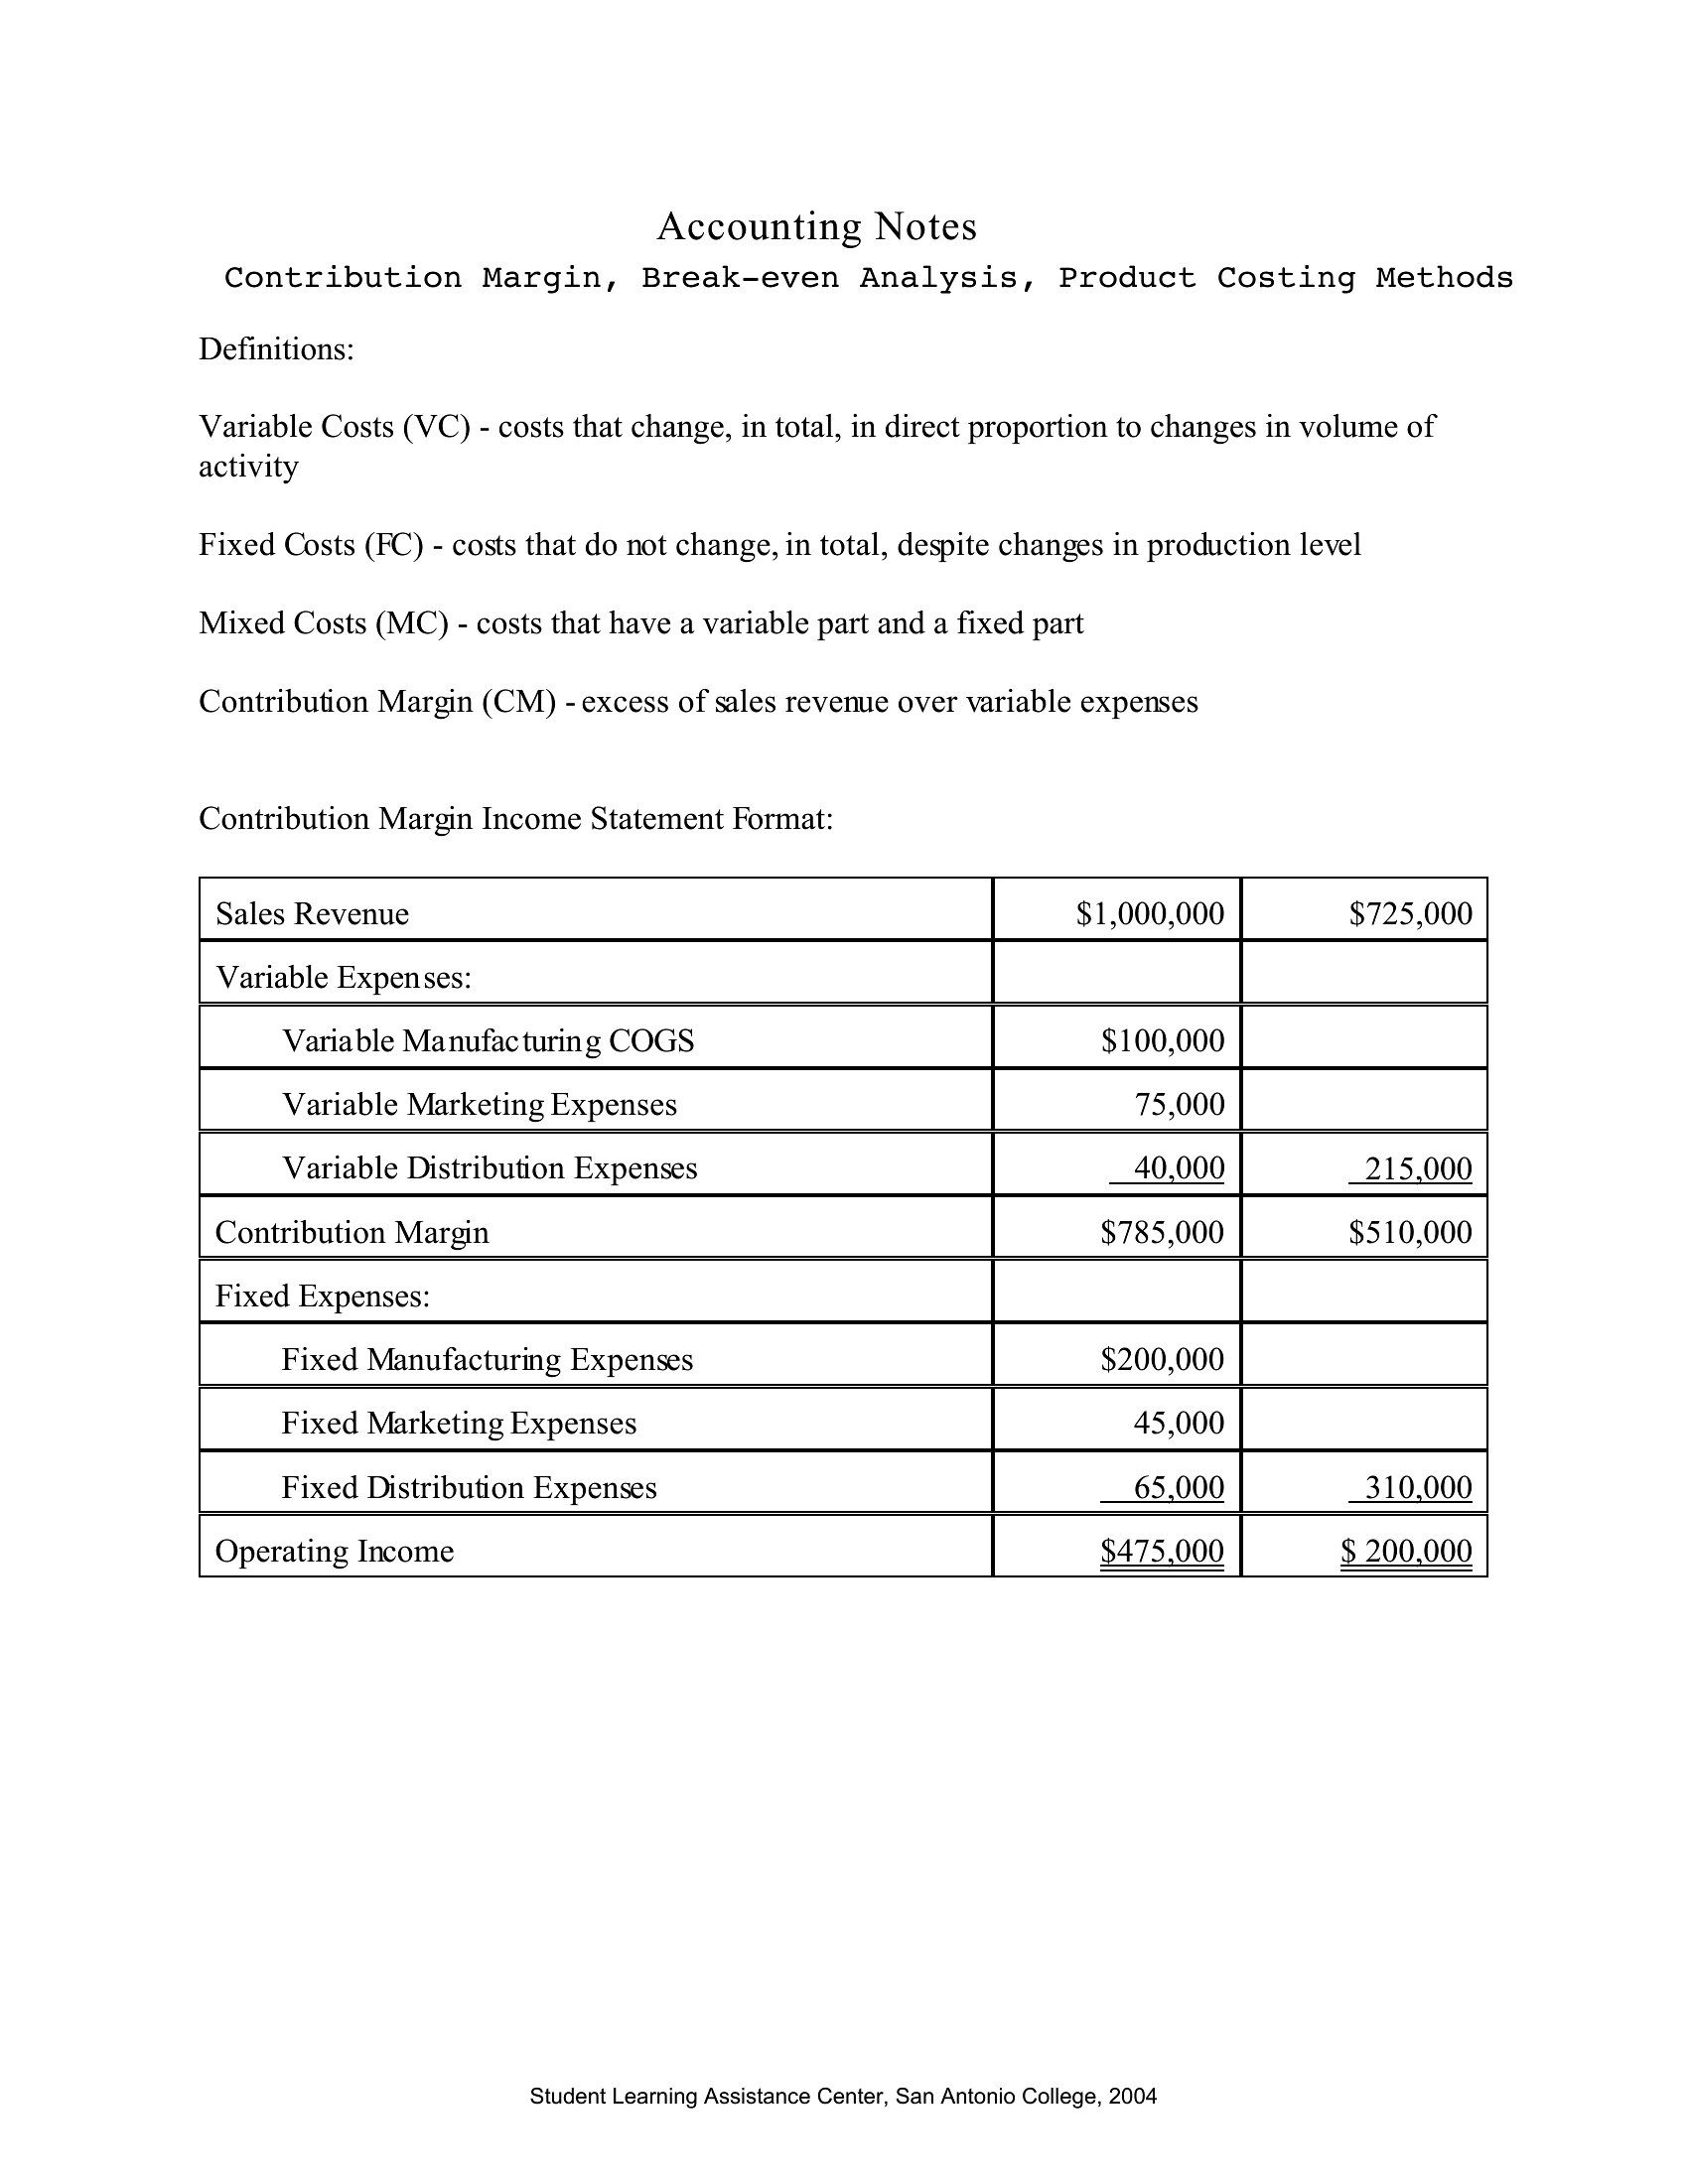
Most Excel-based templates include adjustable cells labeled for fixed costs (e.g., rent, salaries) and variable costs (e.g., materials, commissions). Simply update those figures, and the break-even point or profit graphs will recalculate automatically. Word templates require manual adjustments, but the formulas remain the same. For recurring reviews, save the Excel version and reuse it.
What’s the difference between a break-even analysis calculator and a graph-based template?
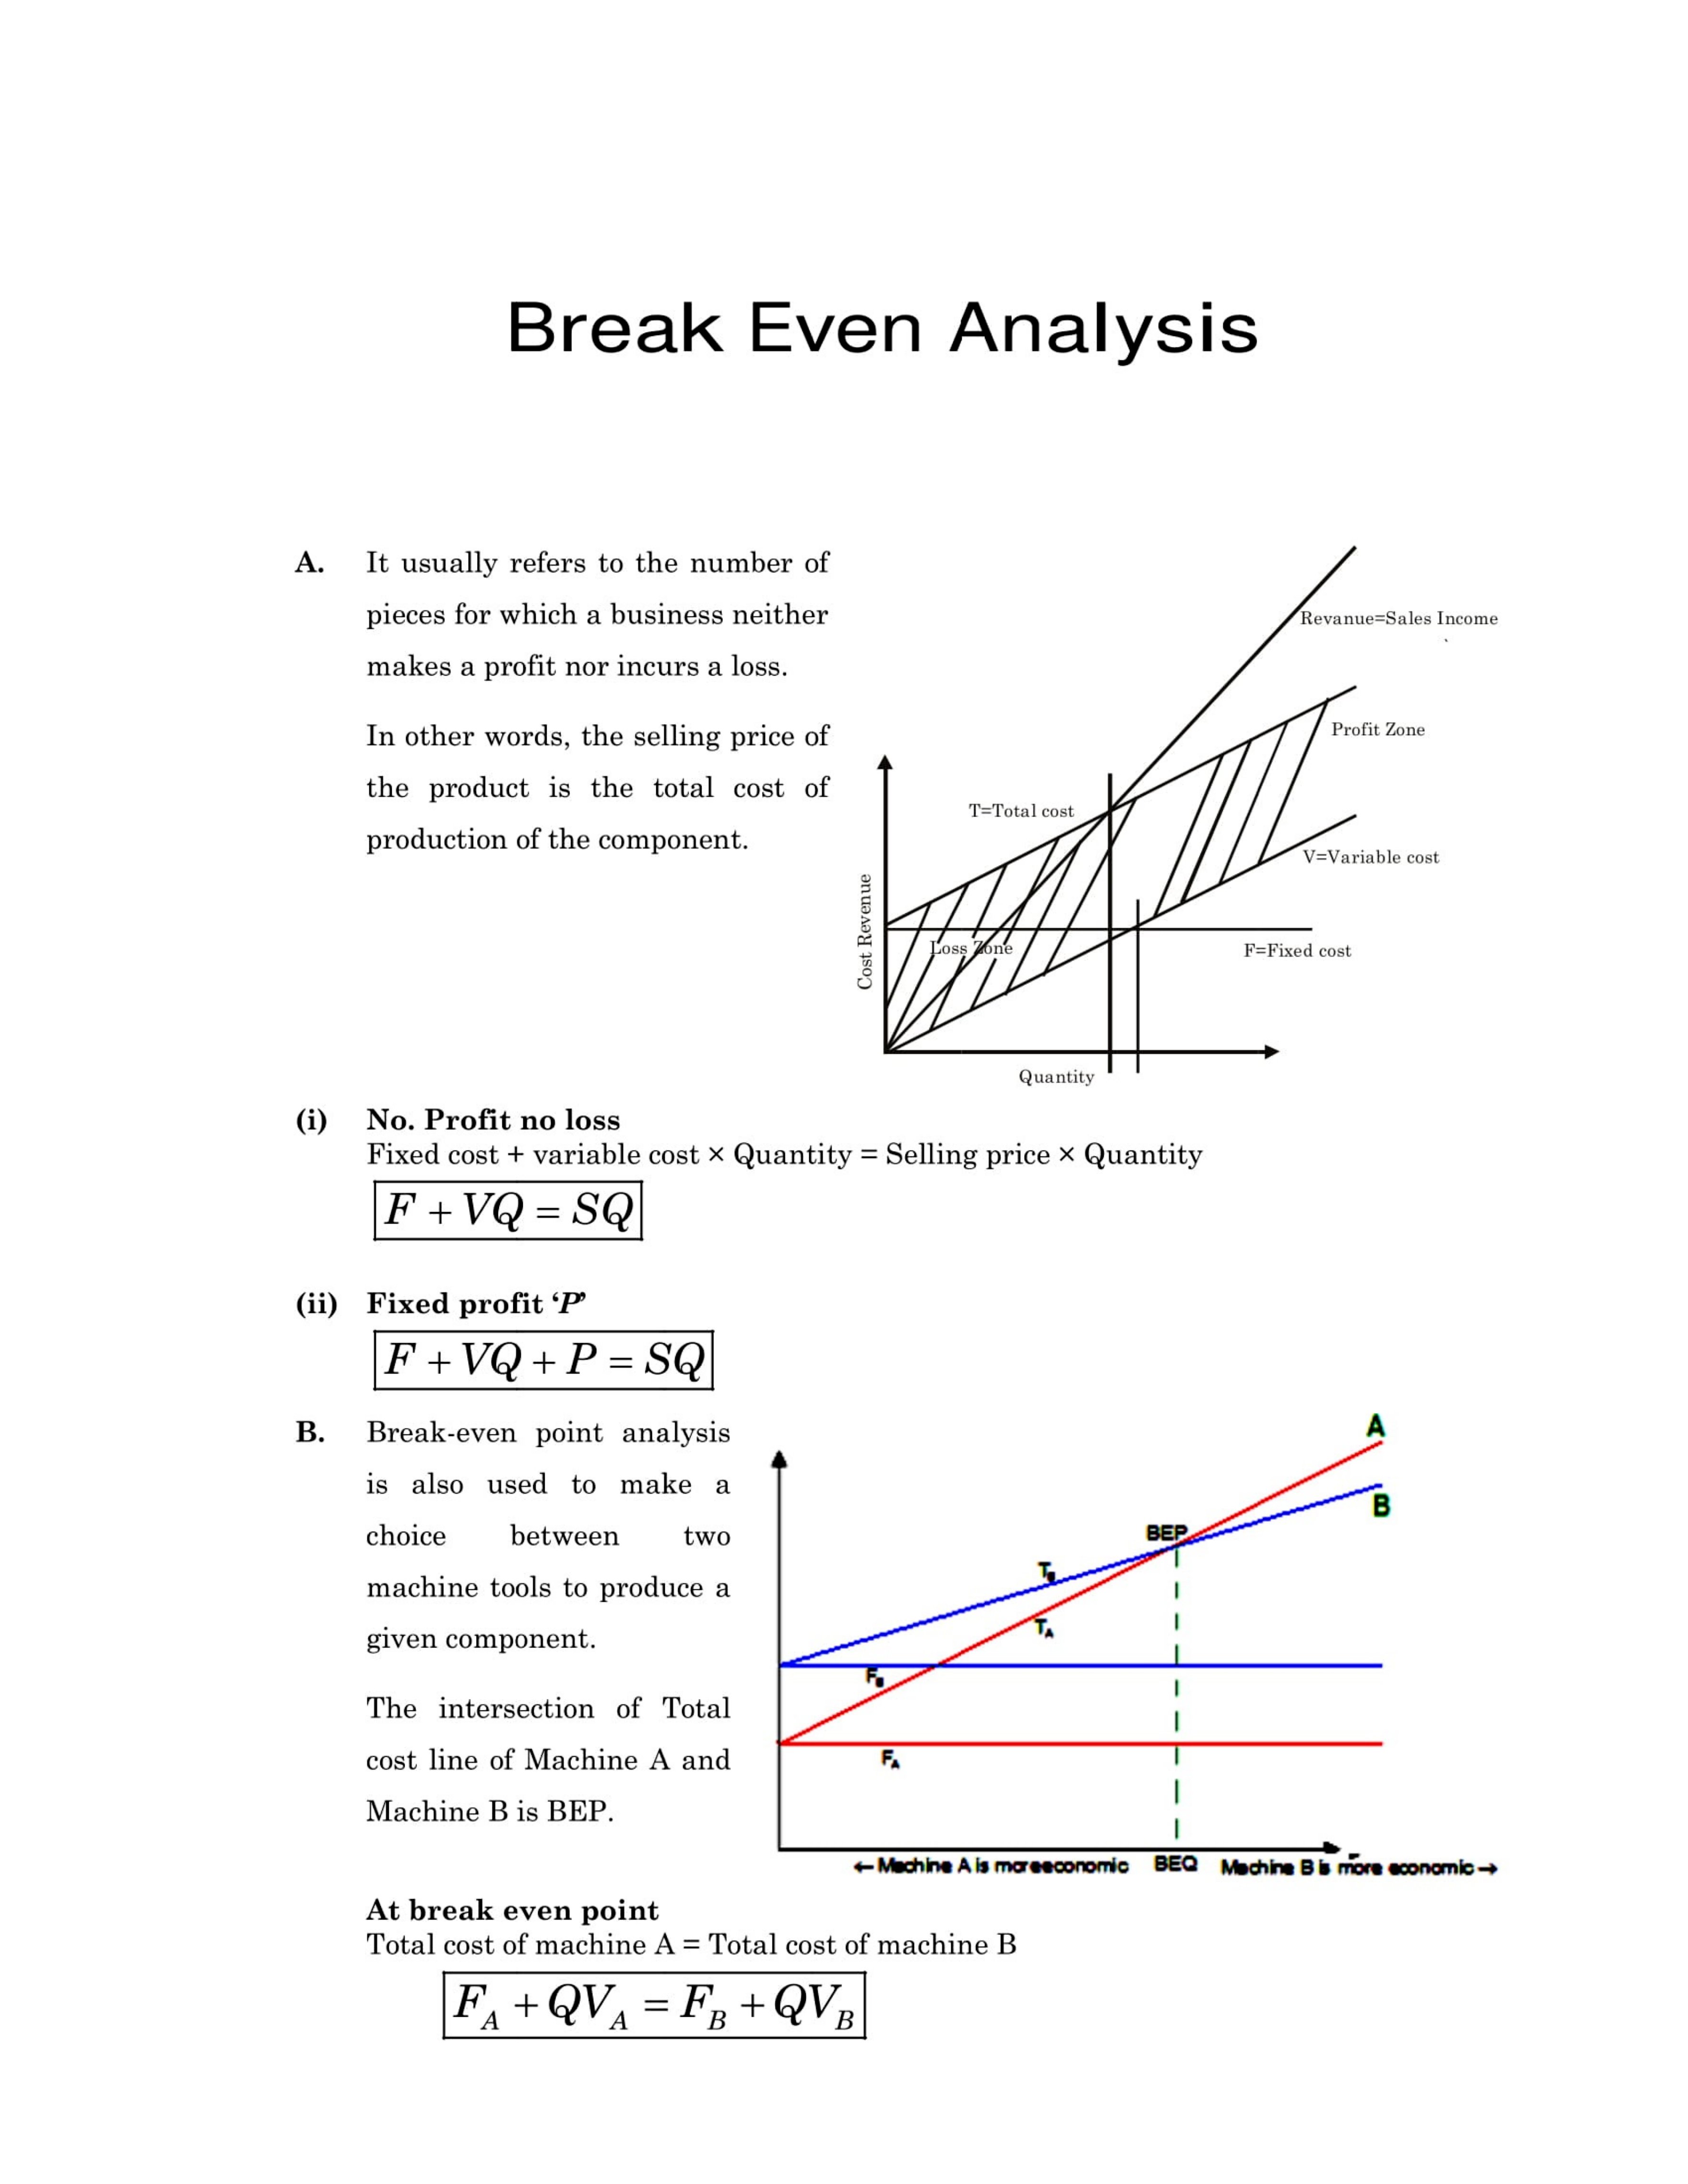
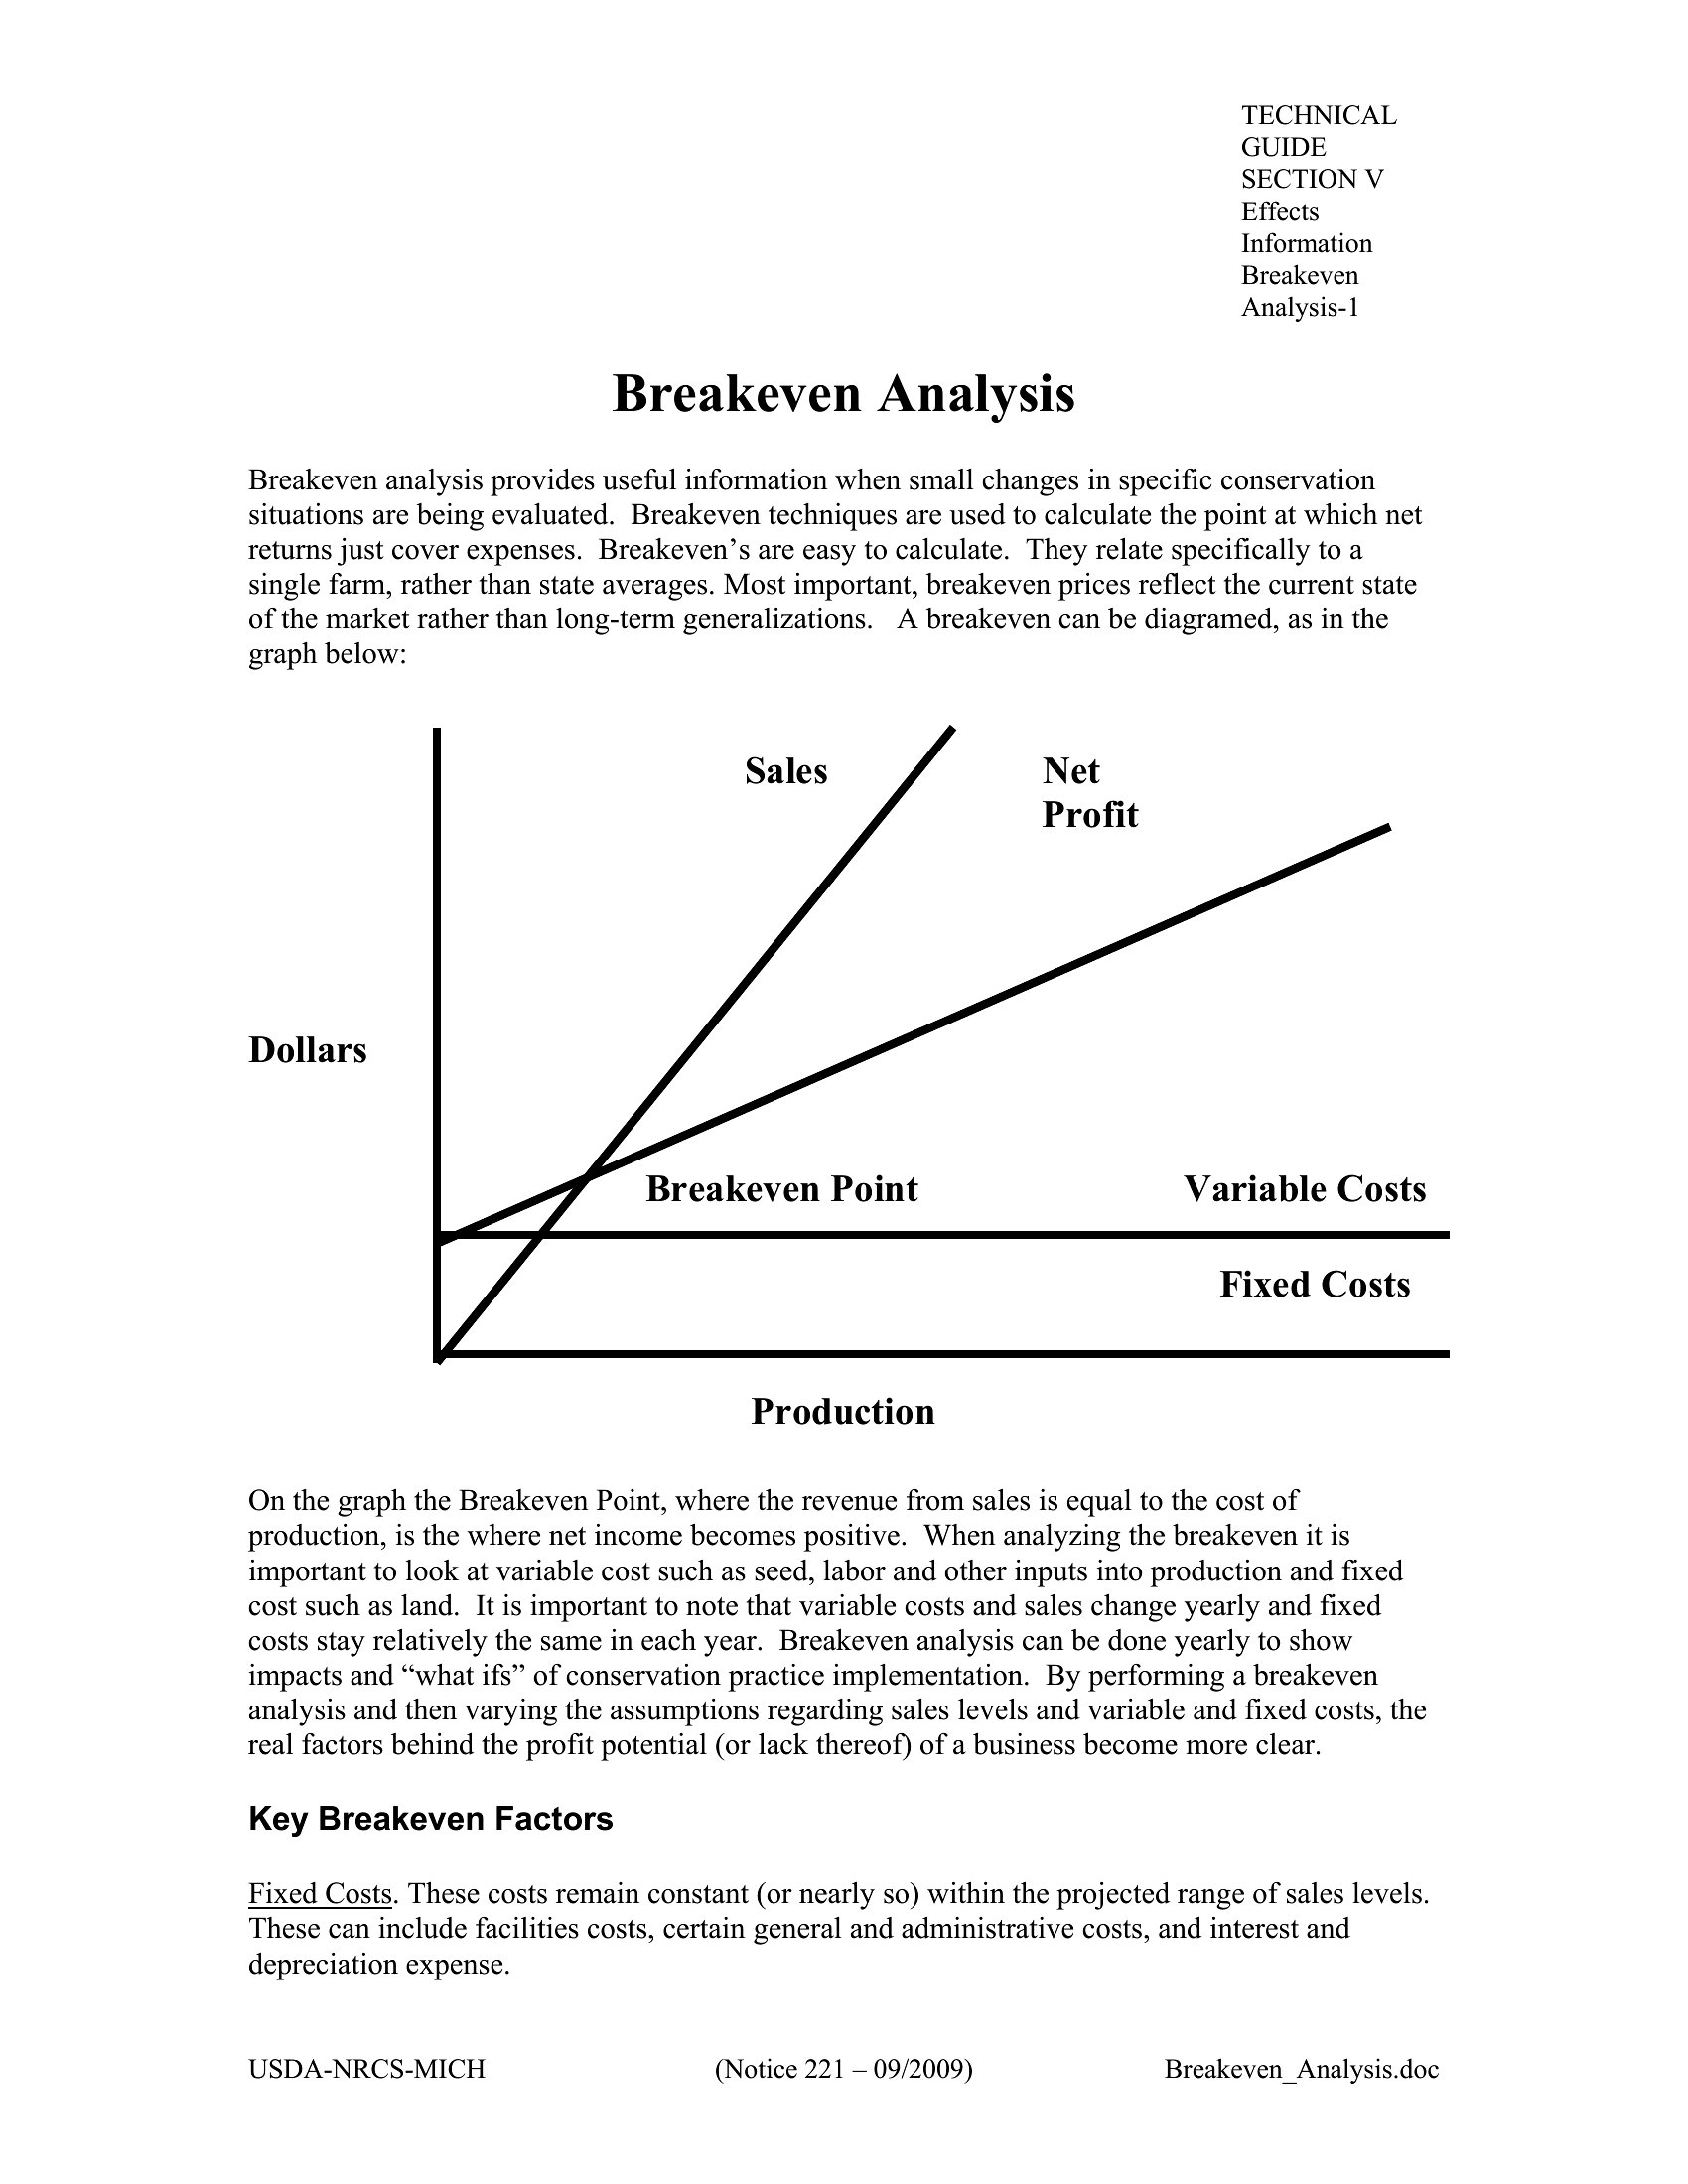
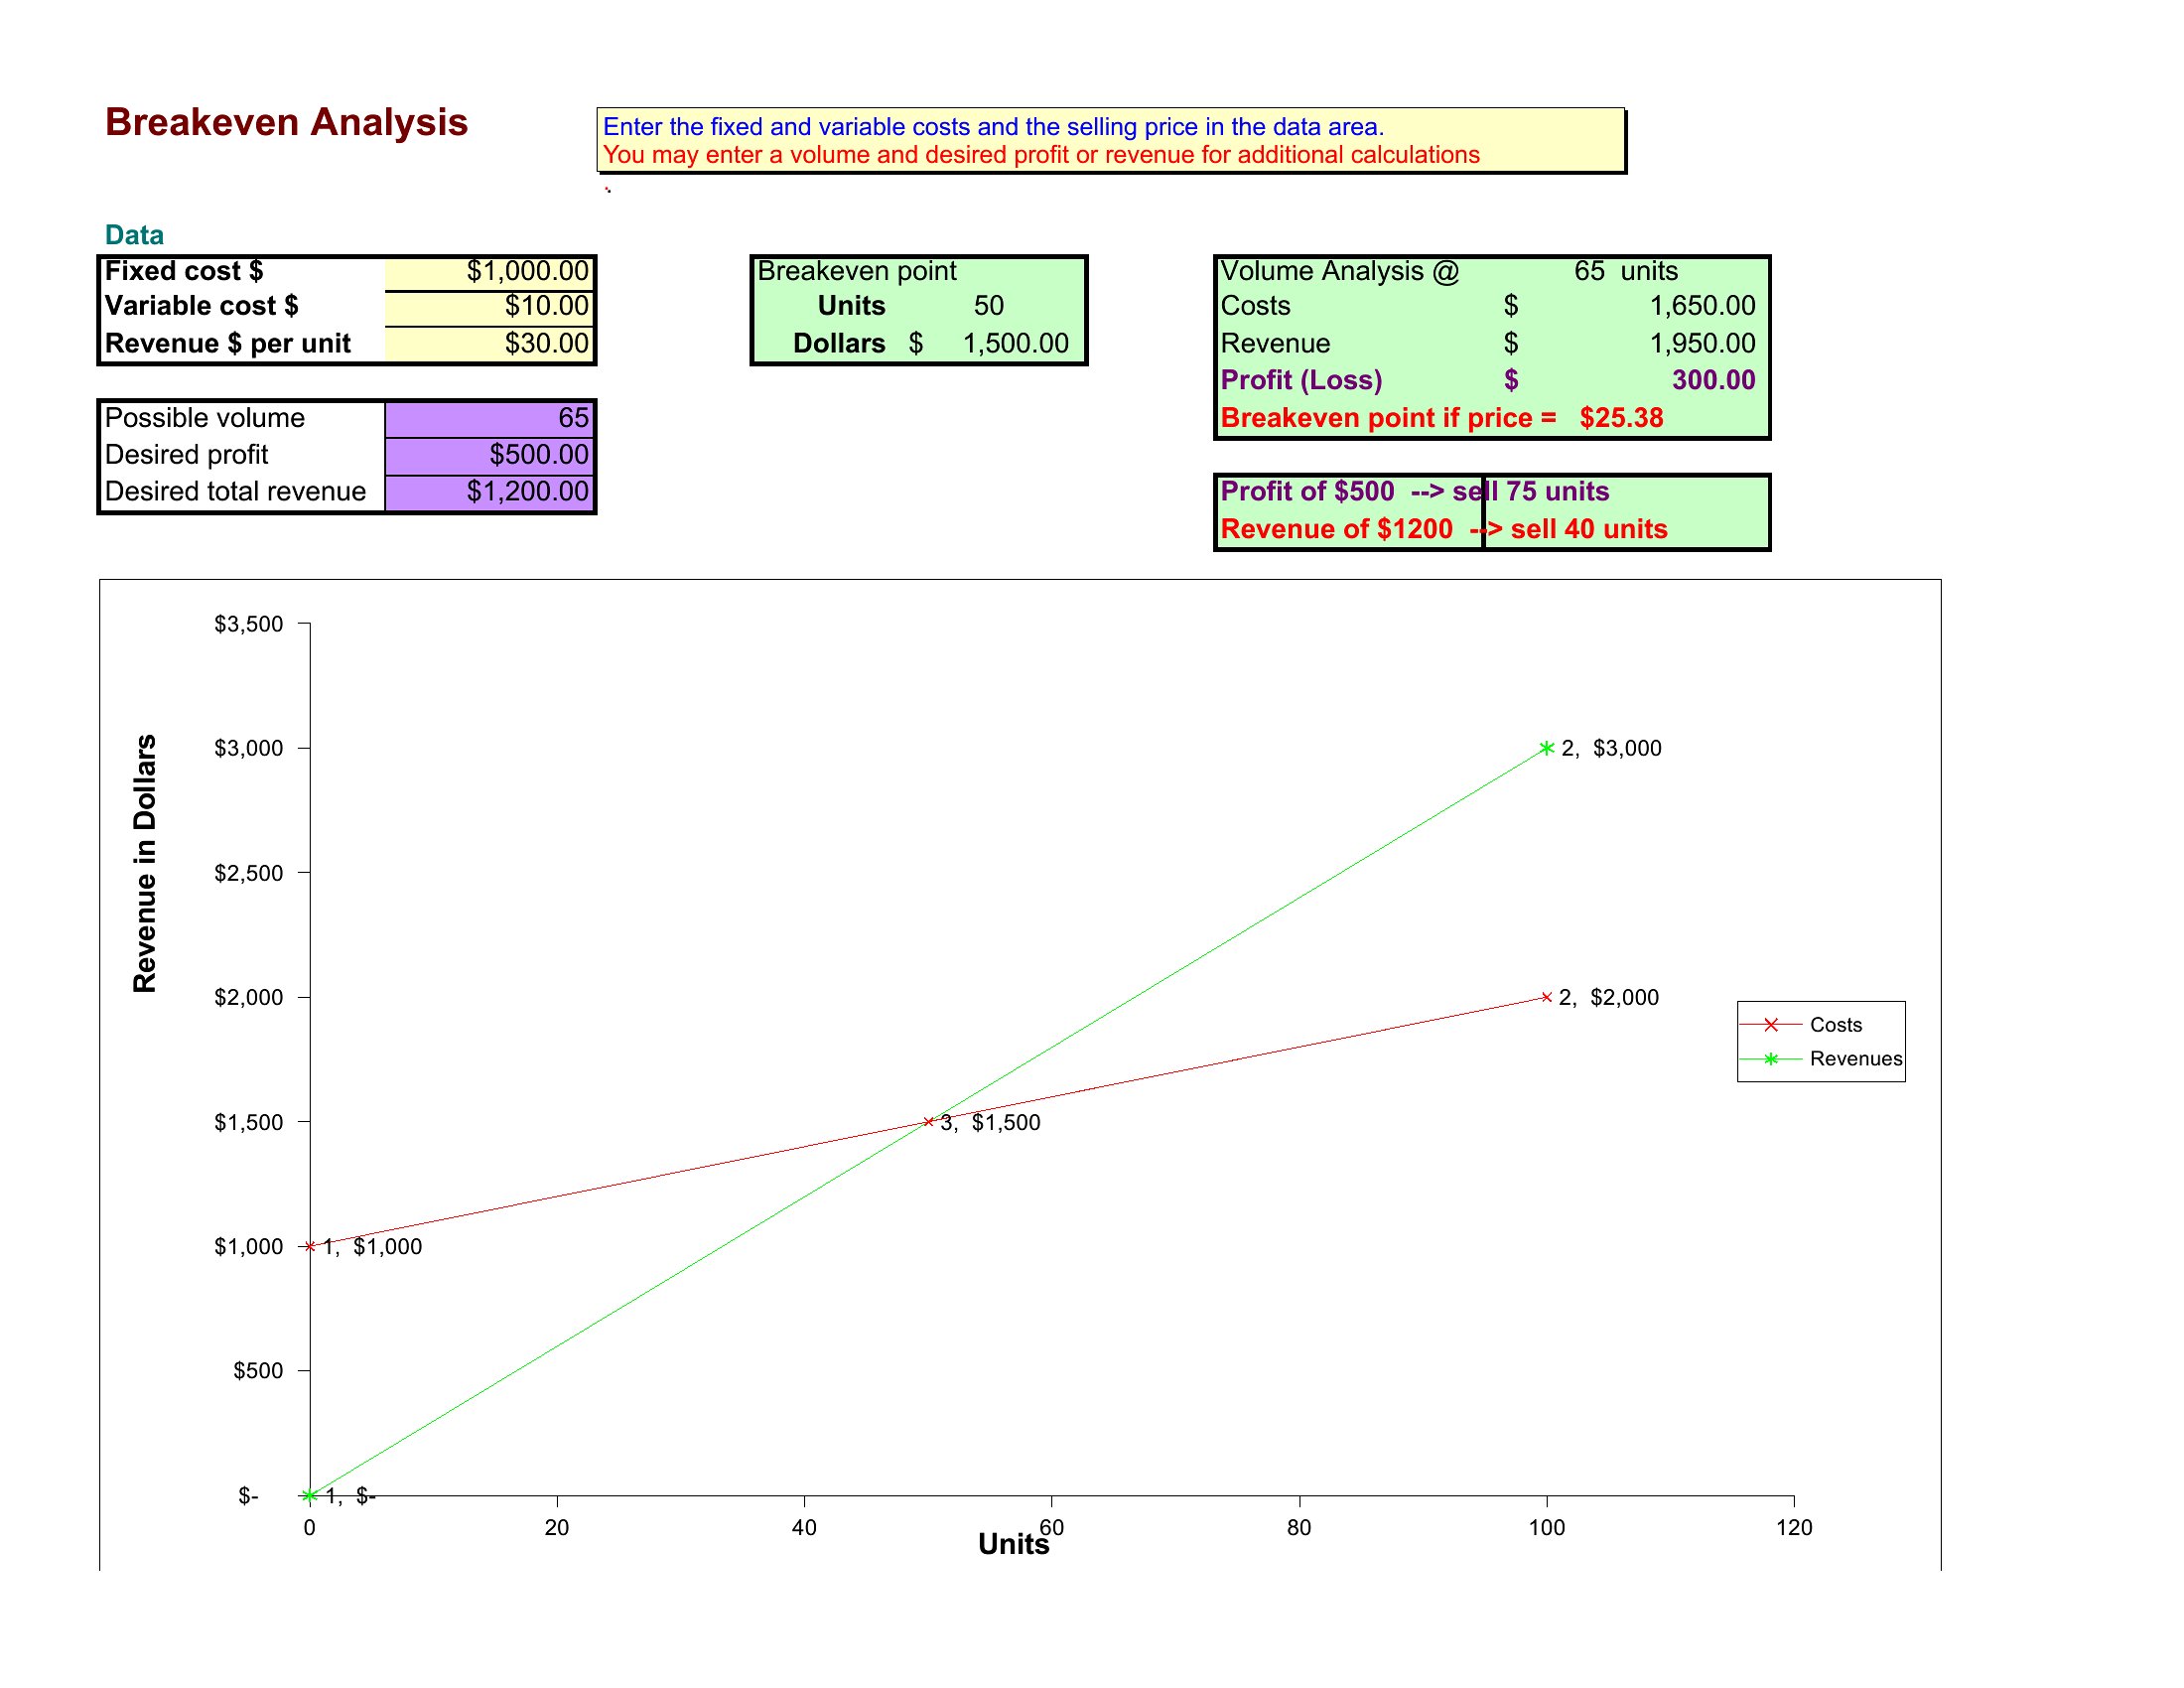
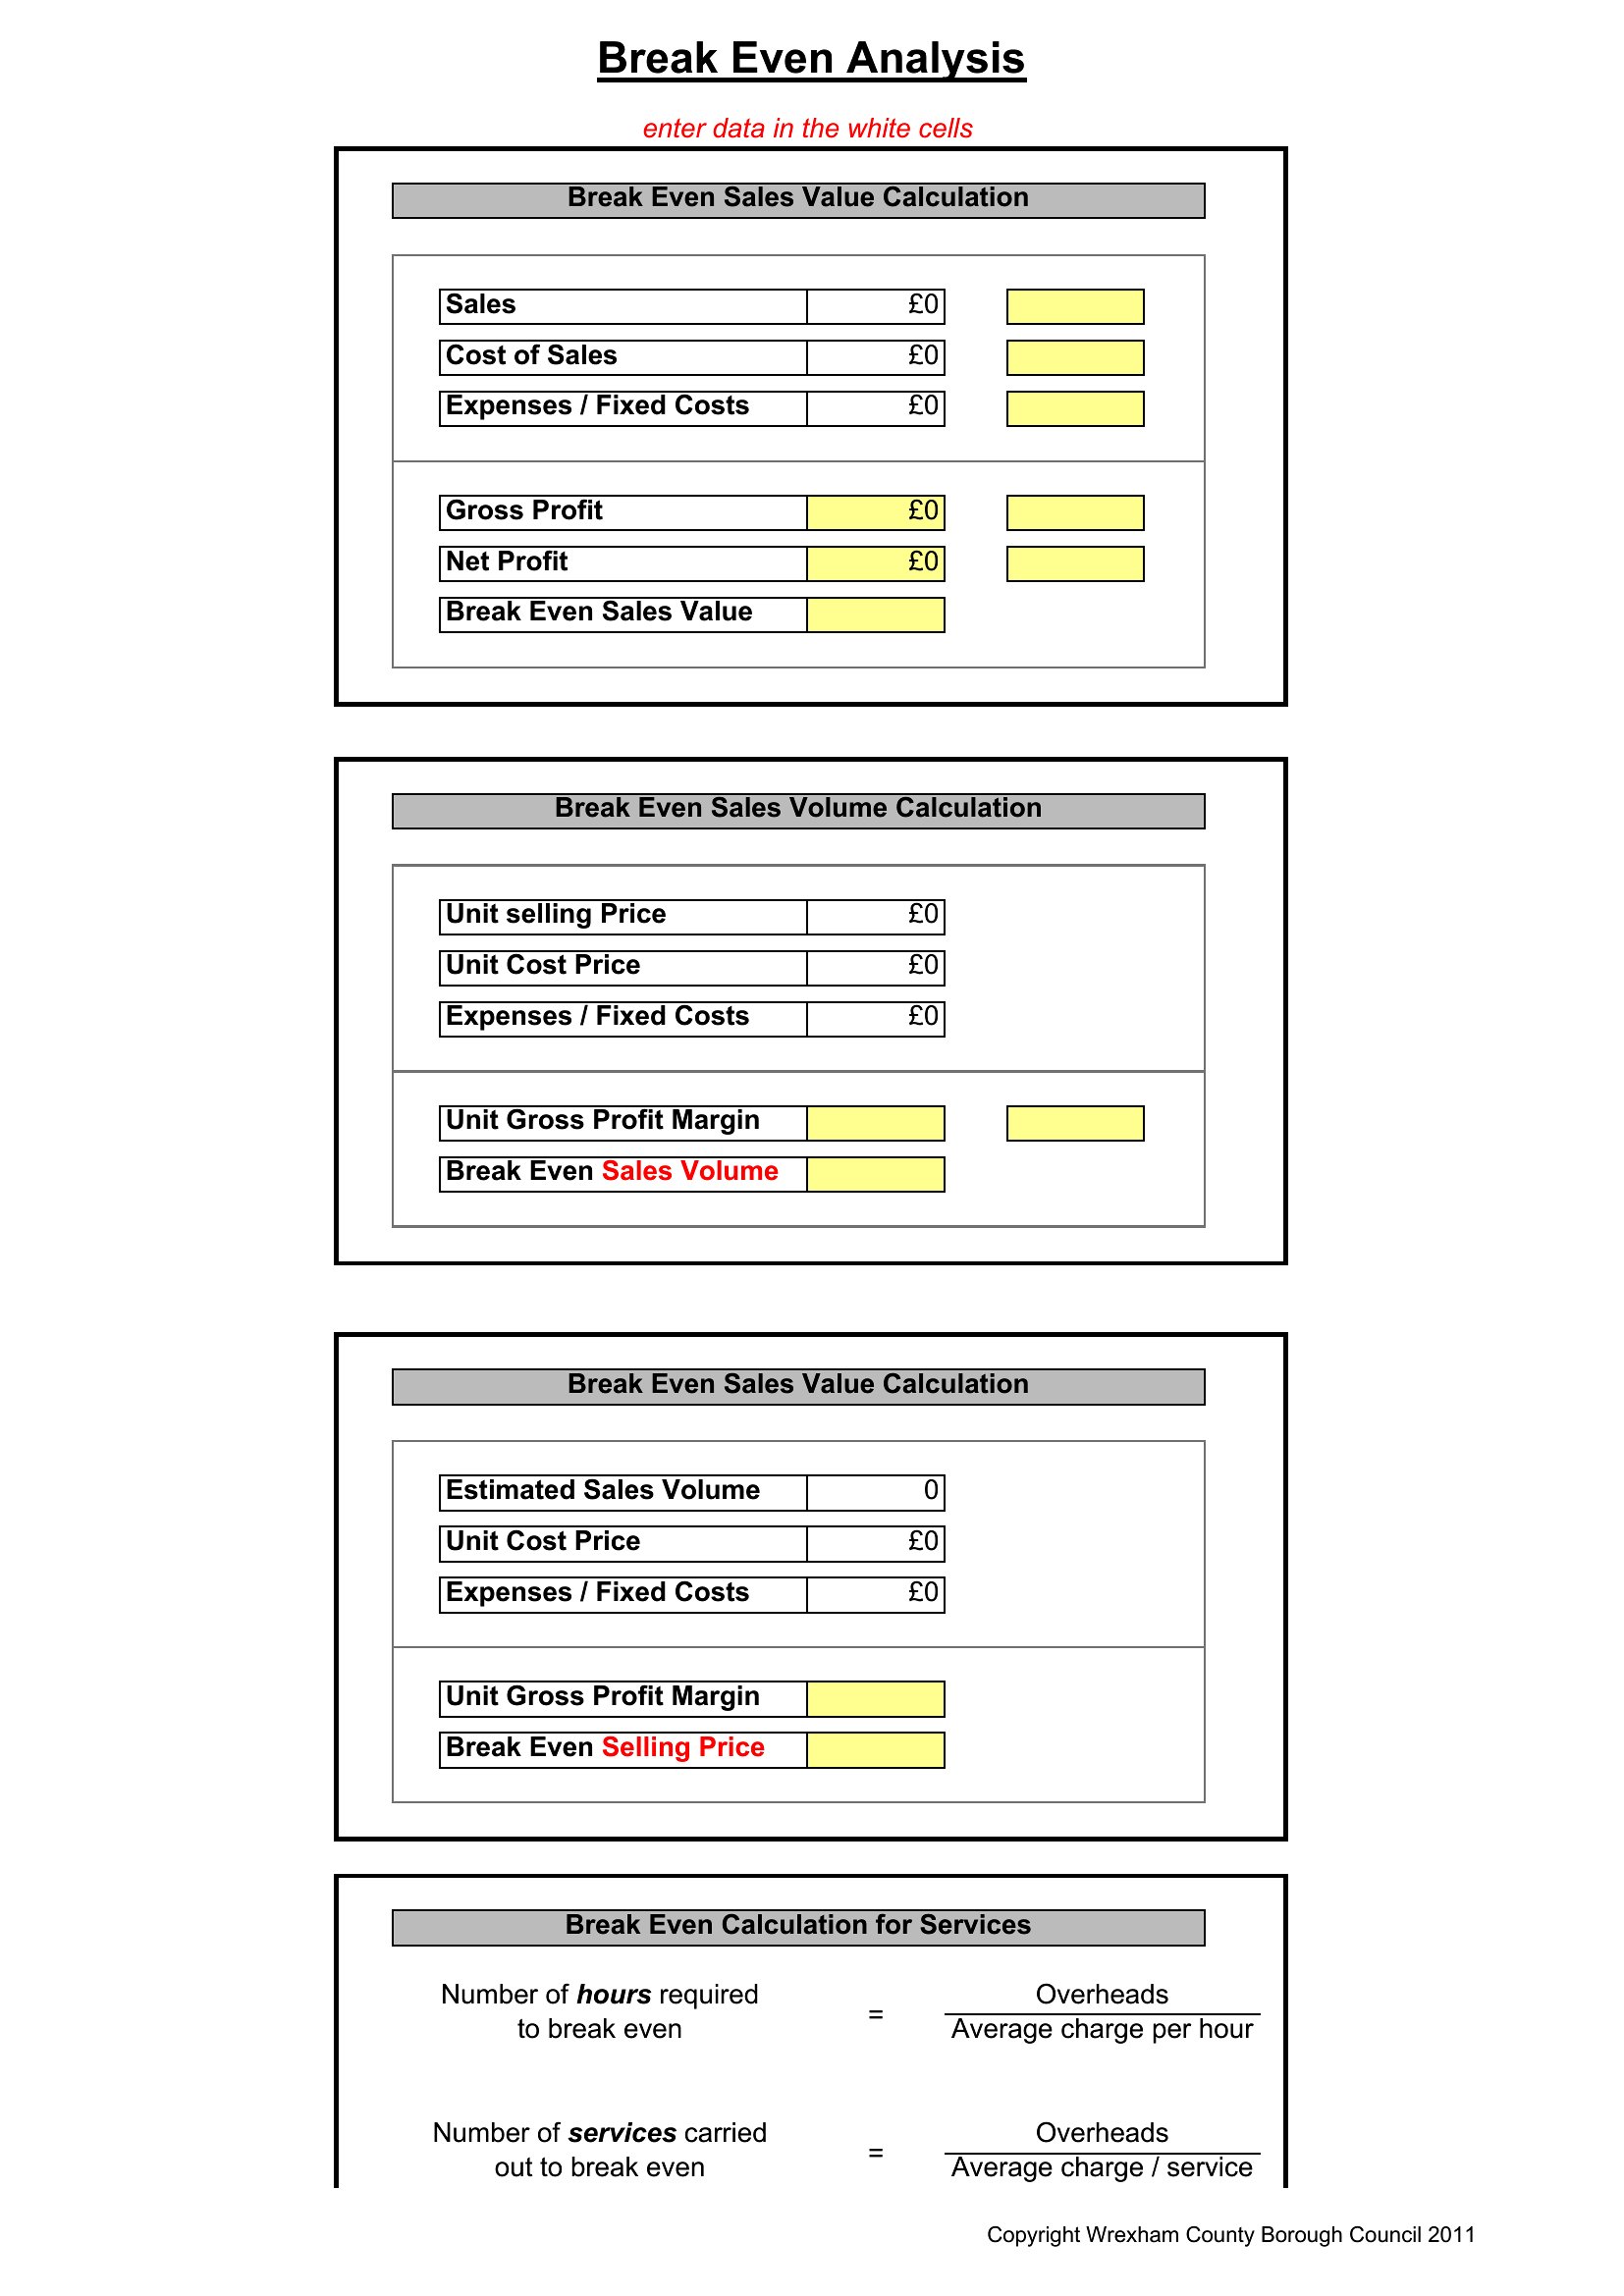
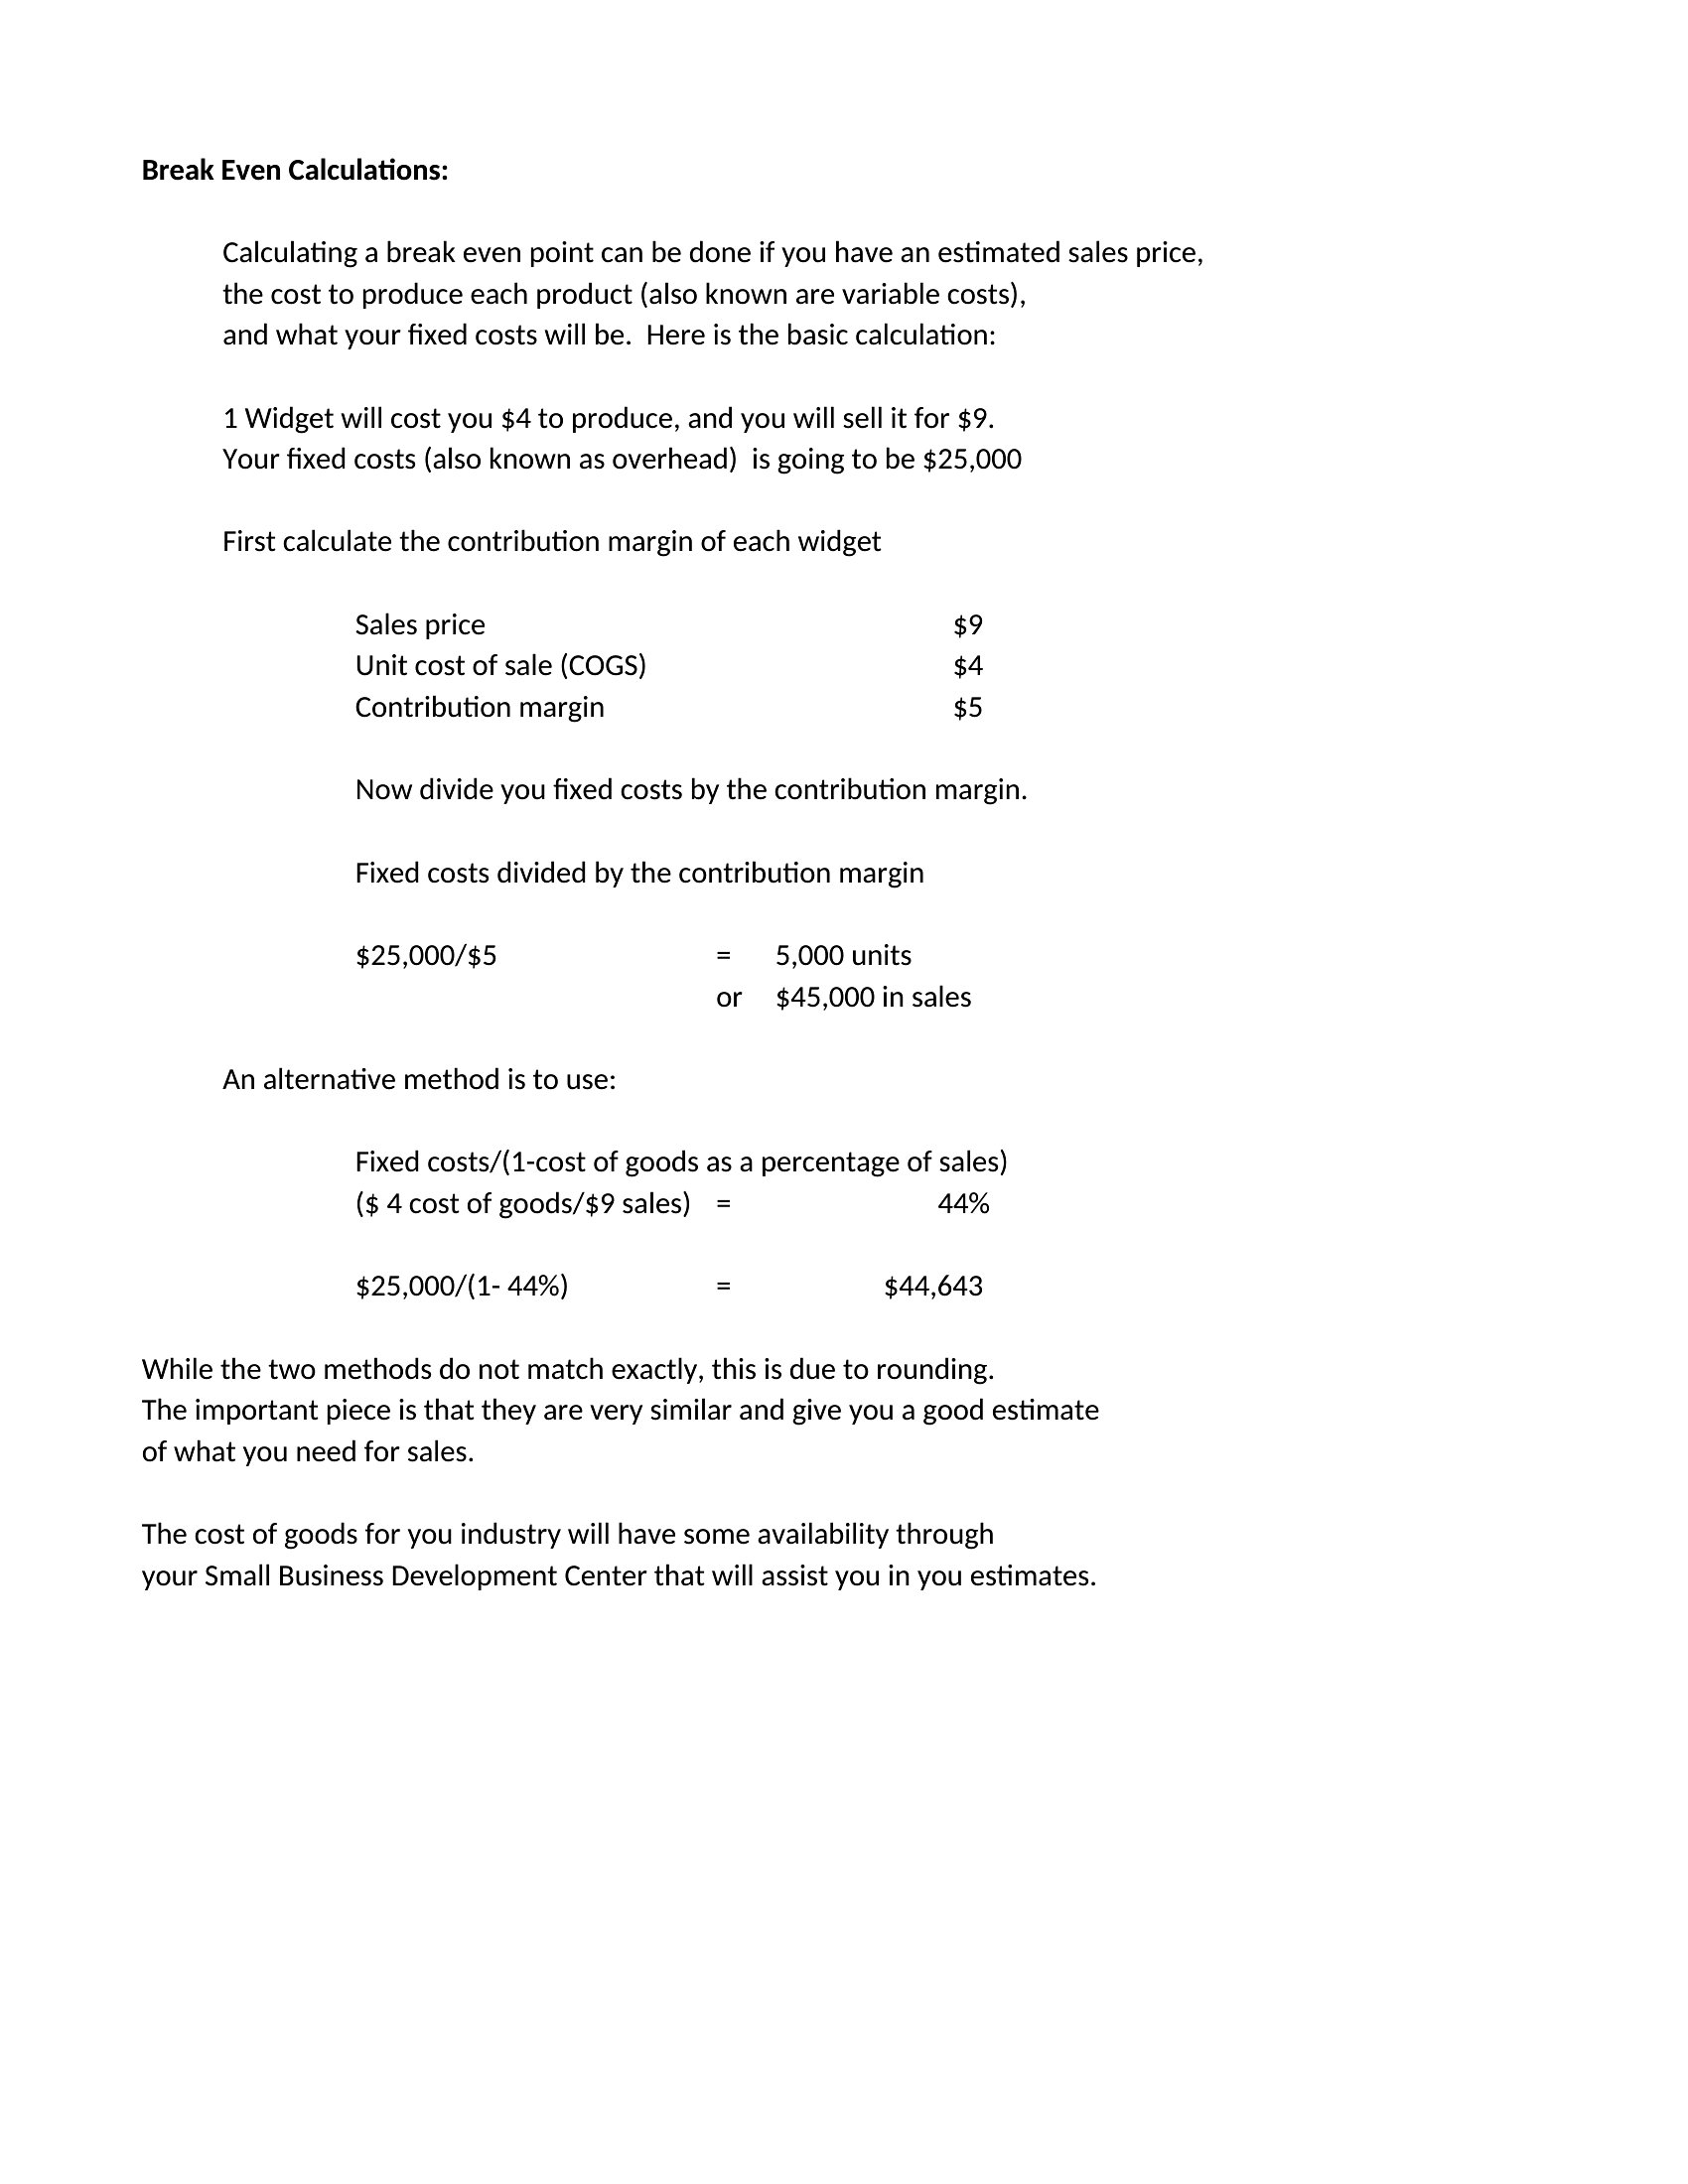
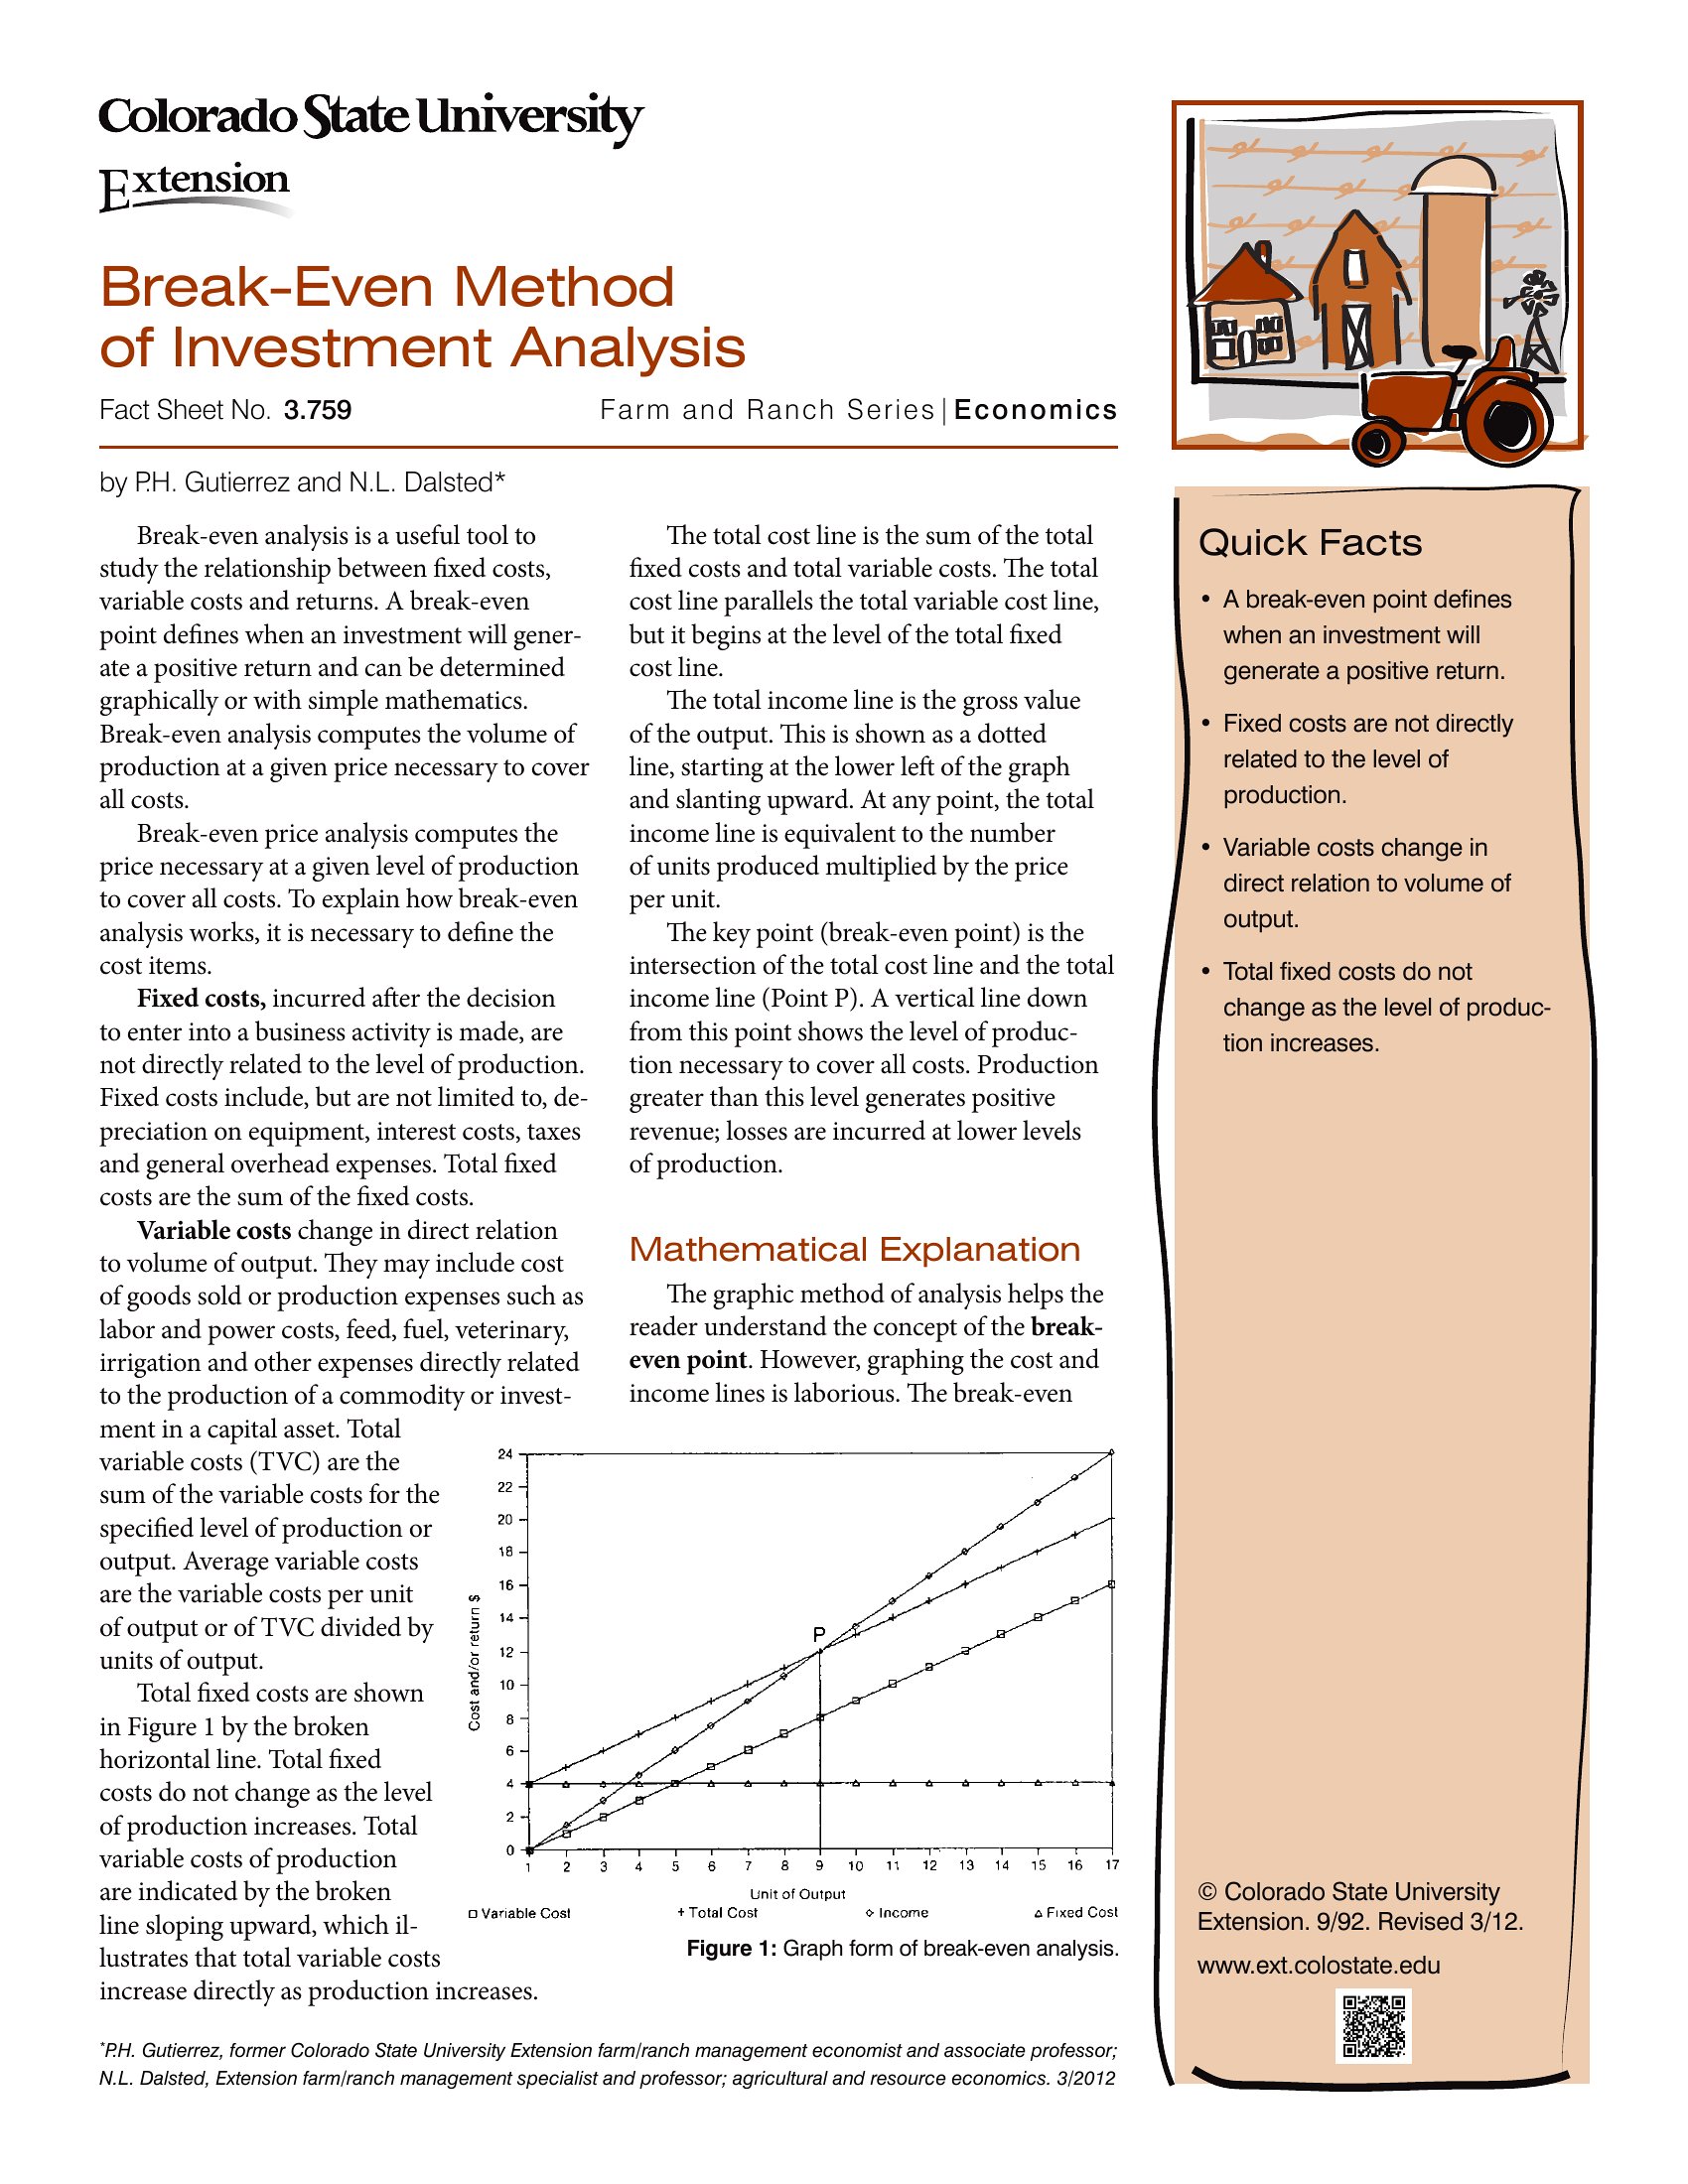
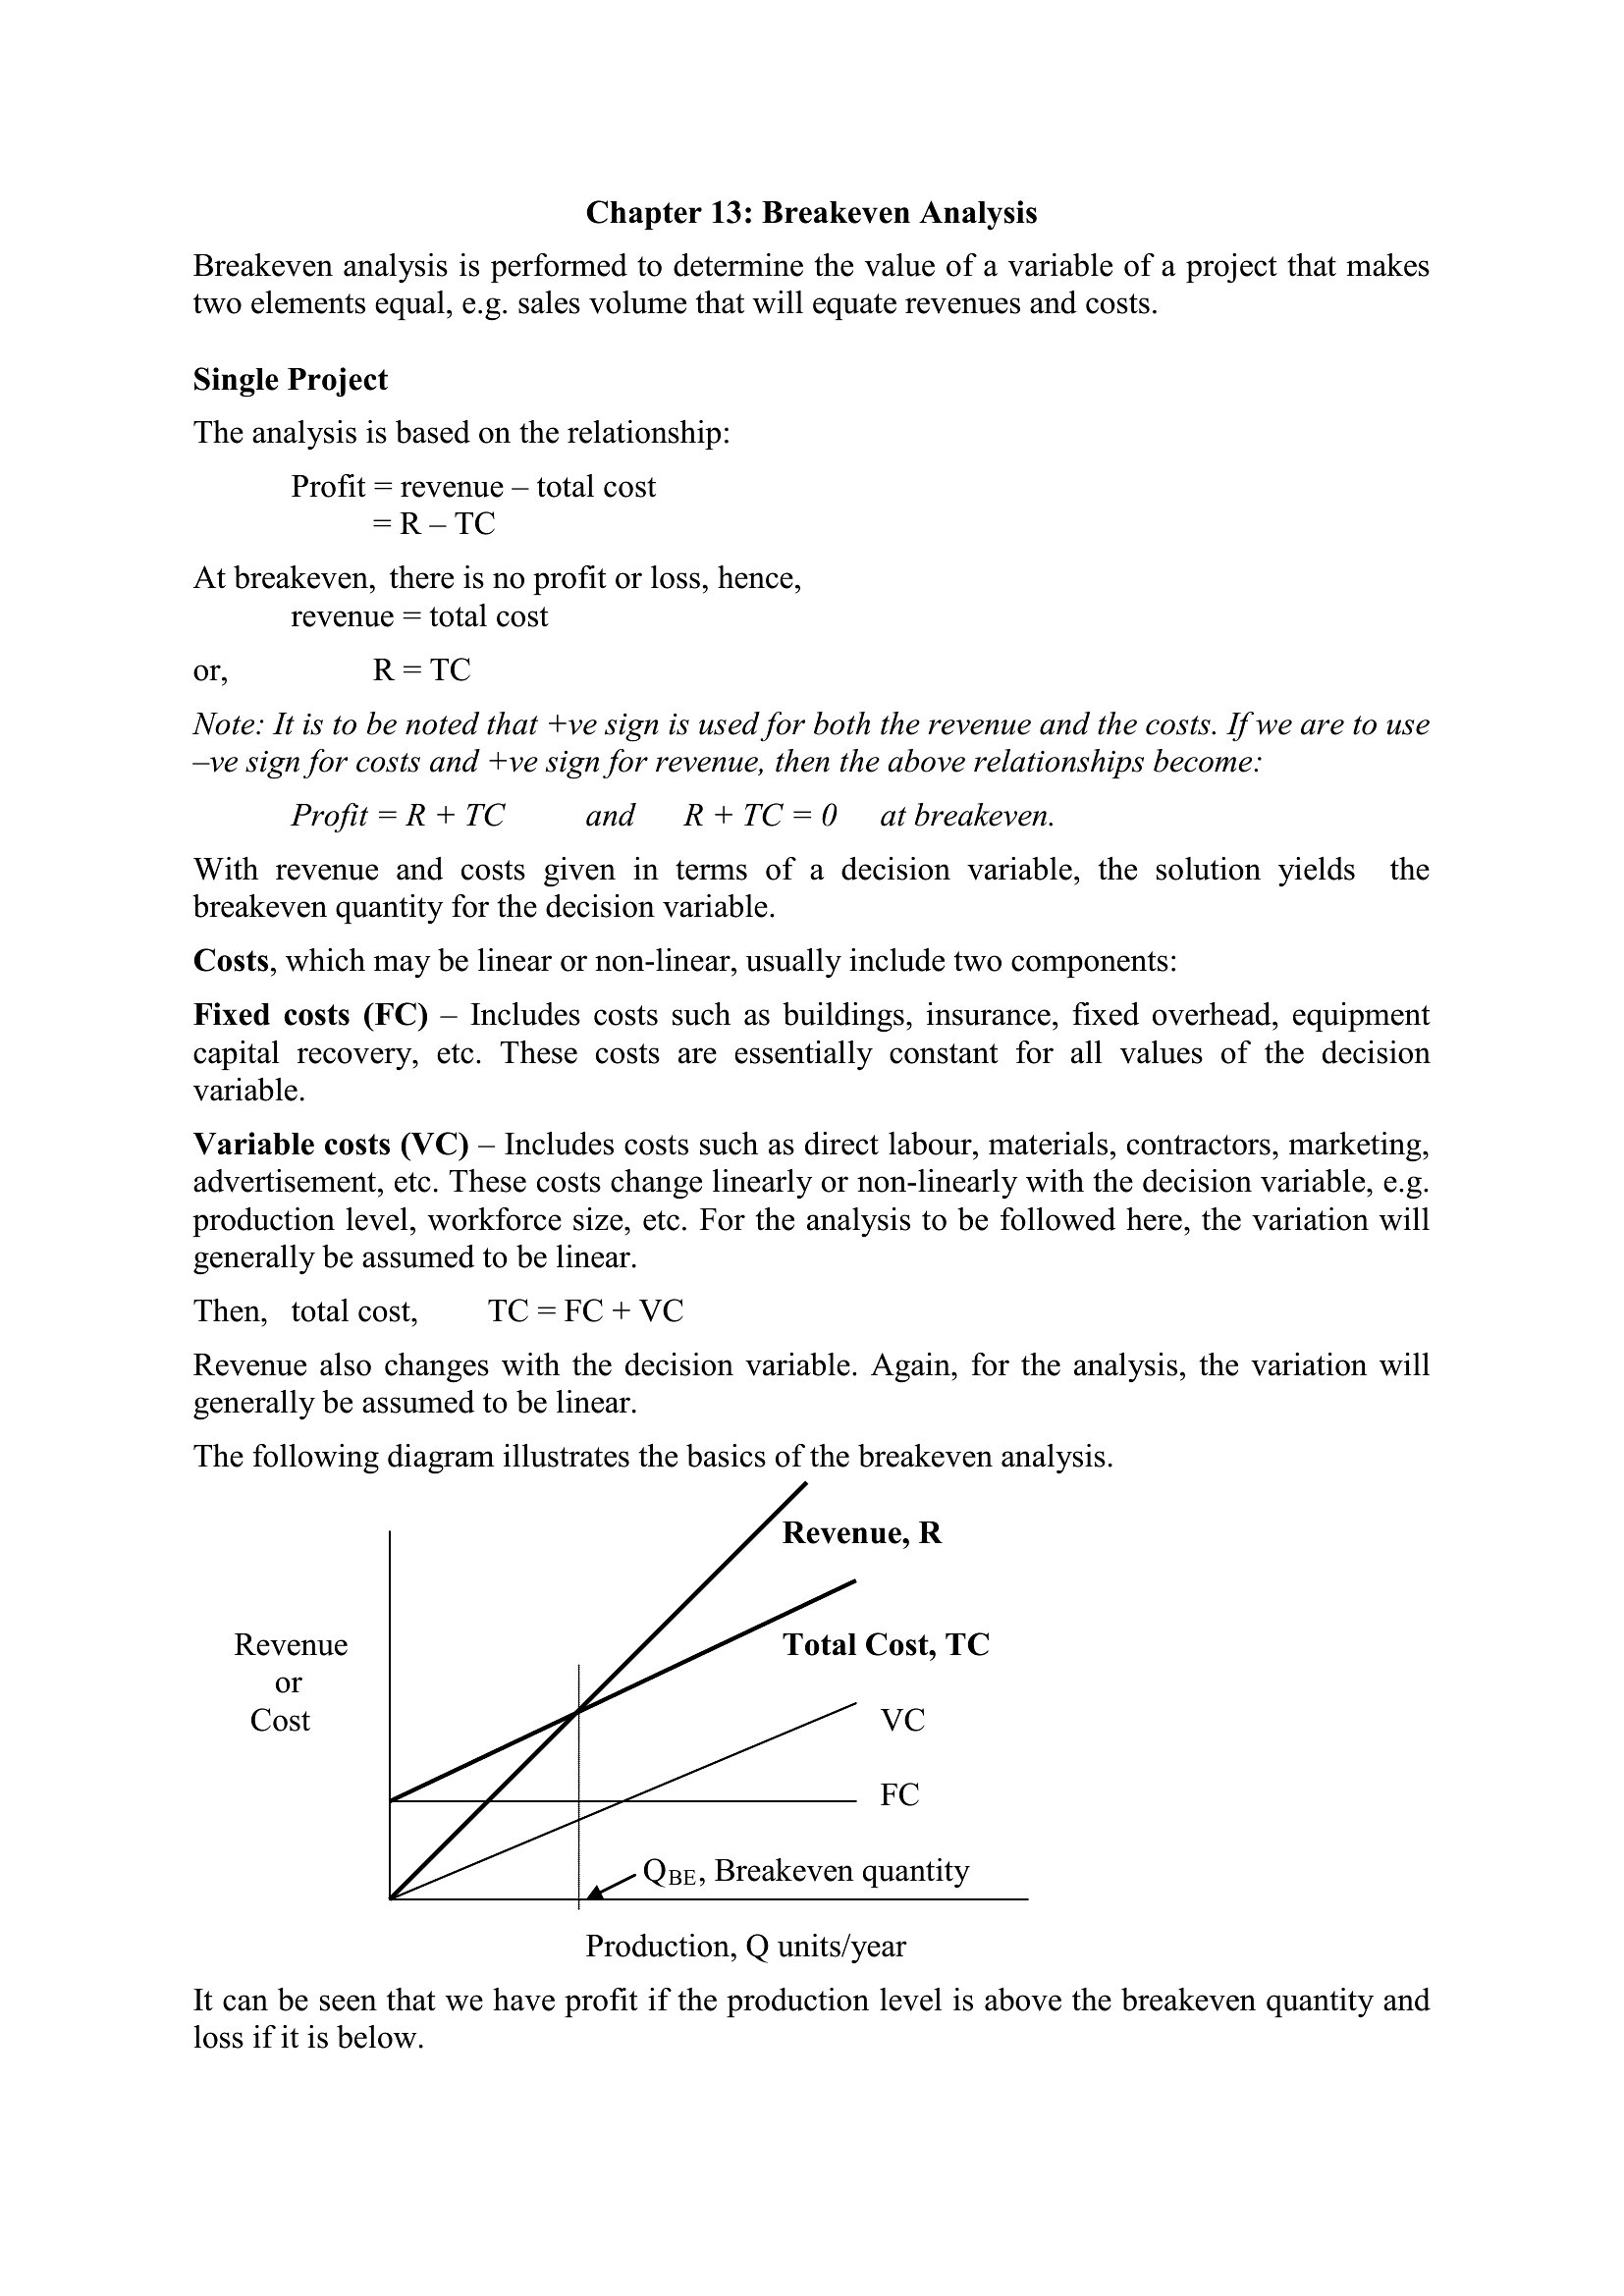
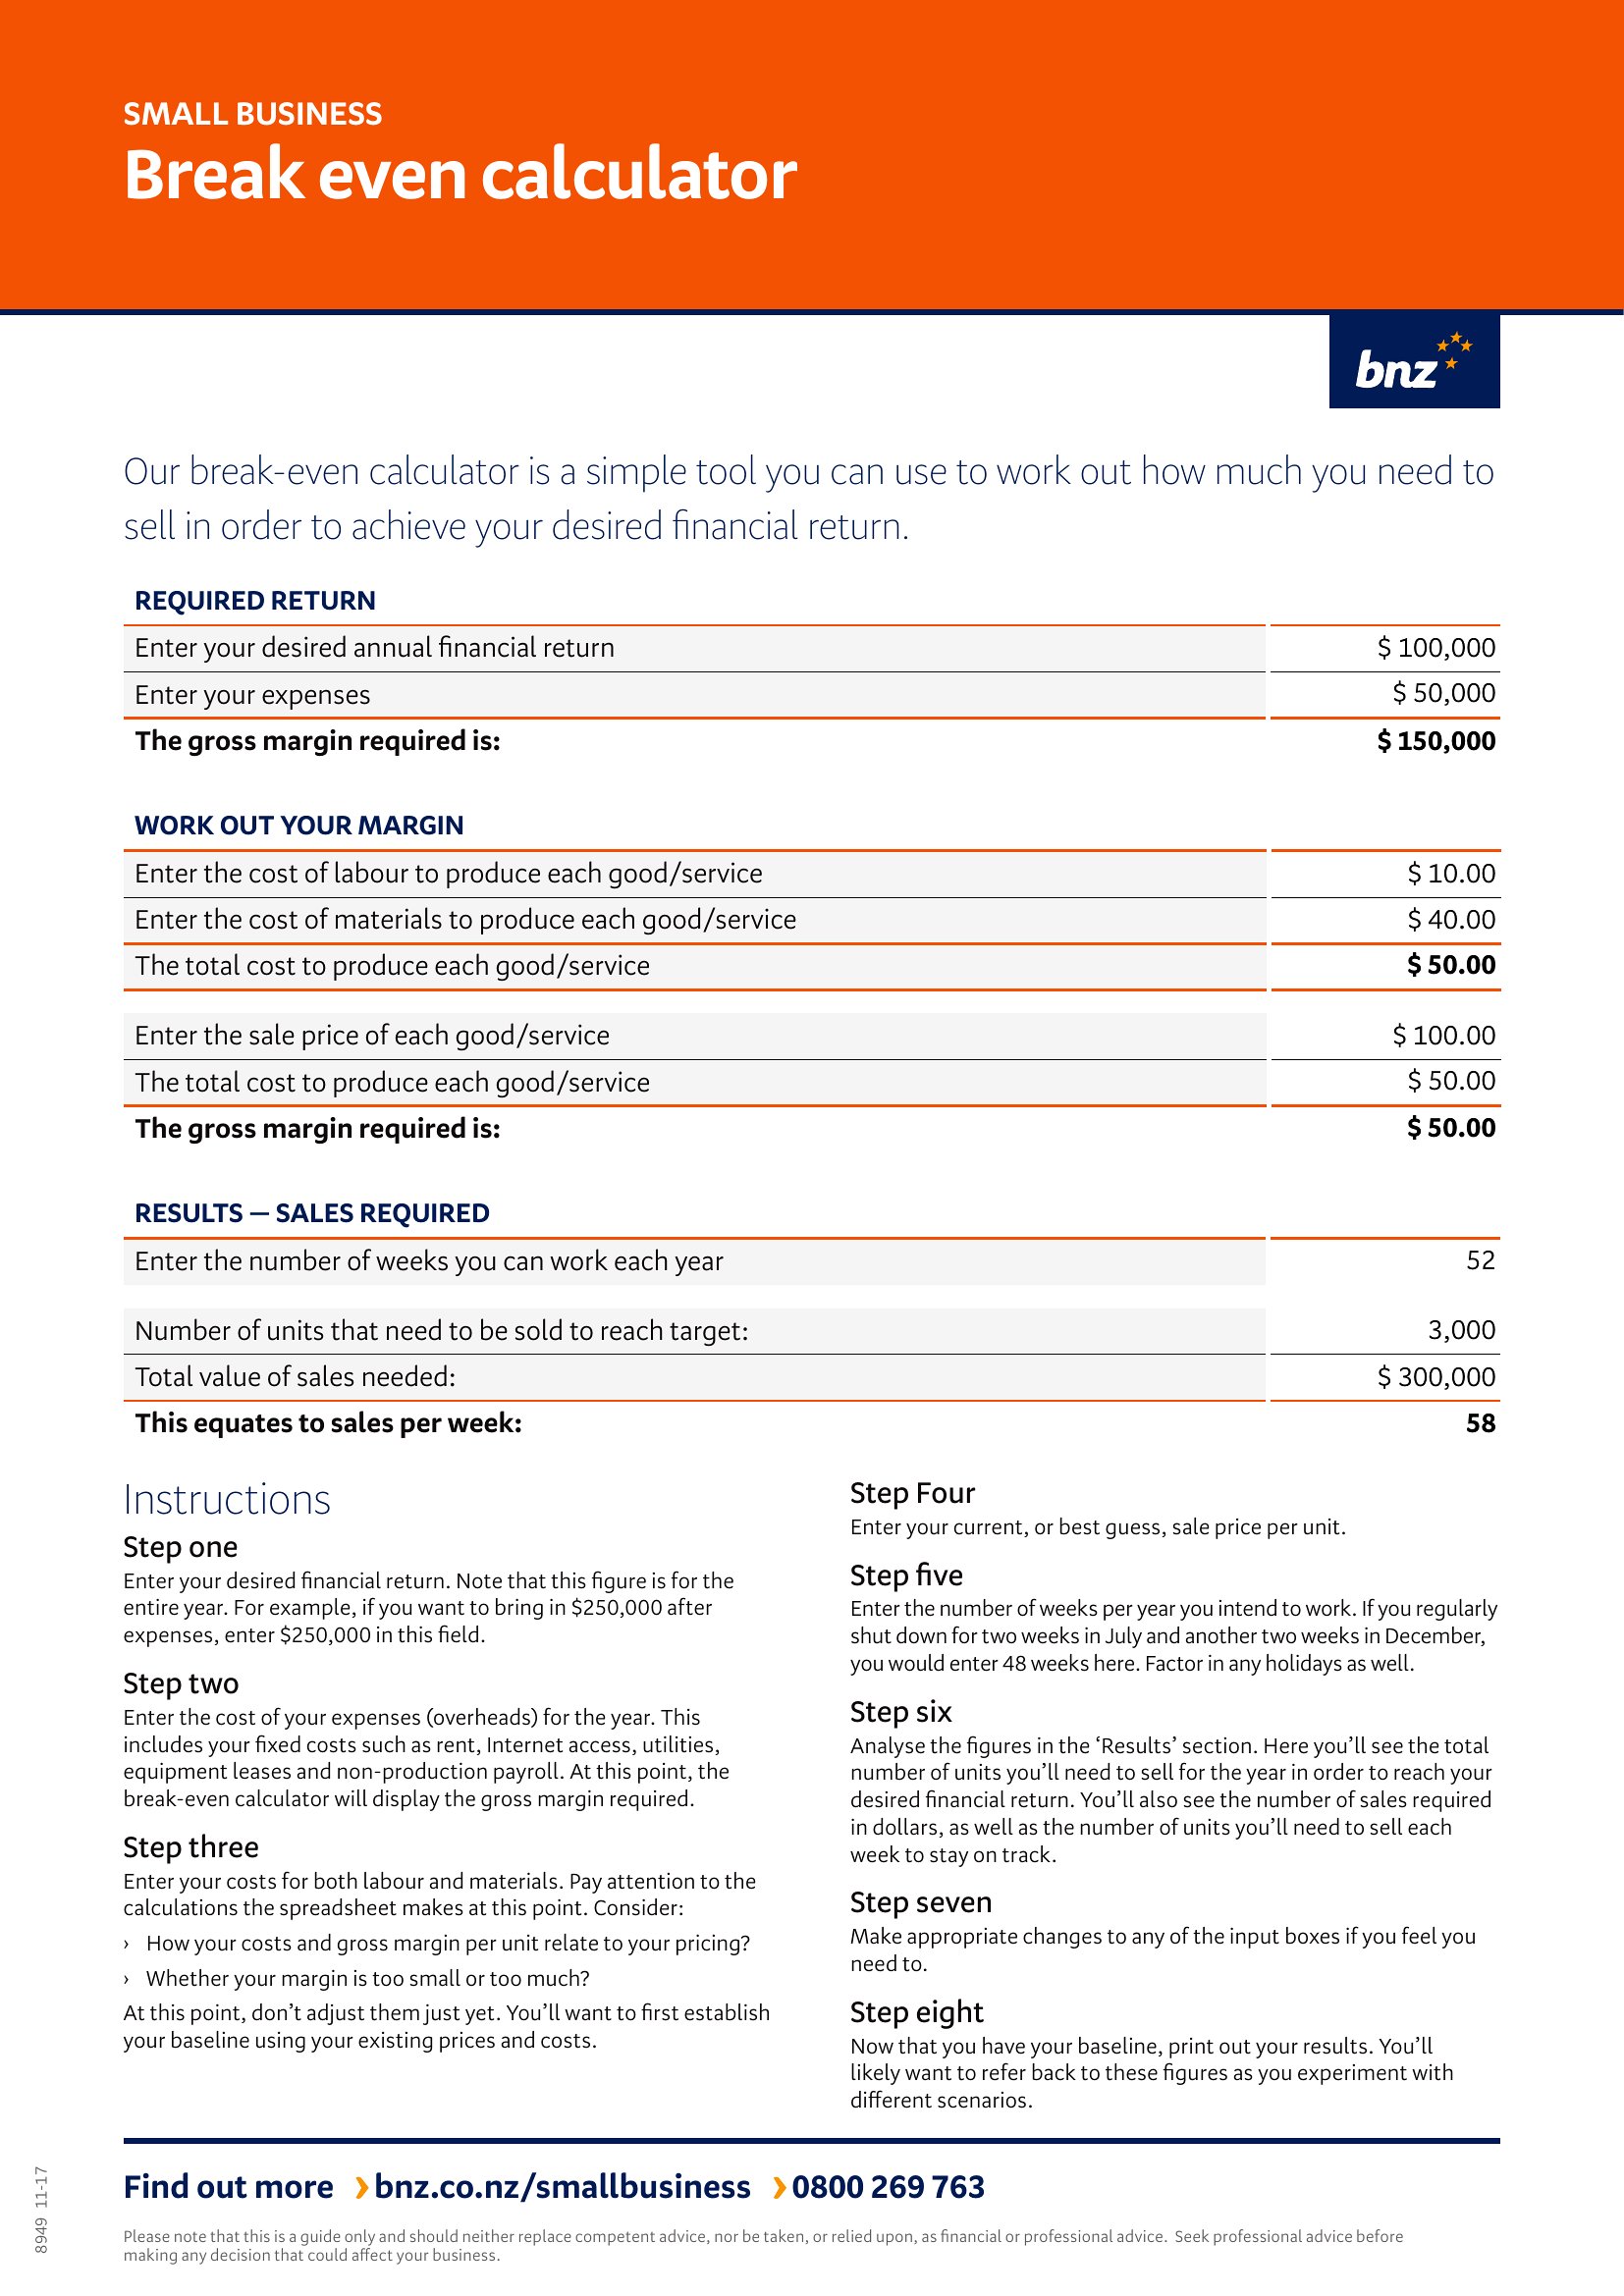
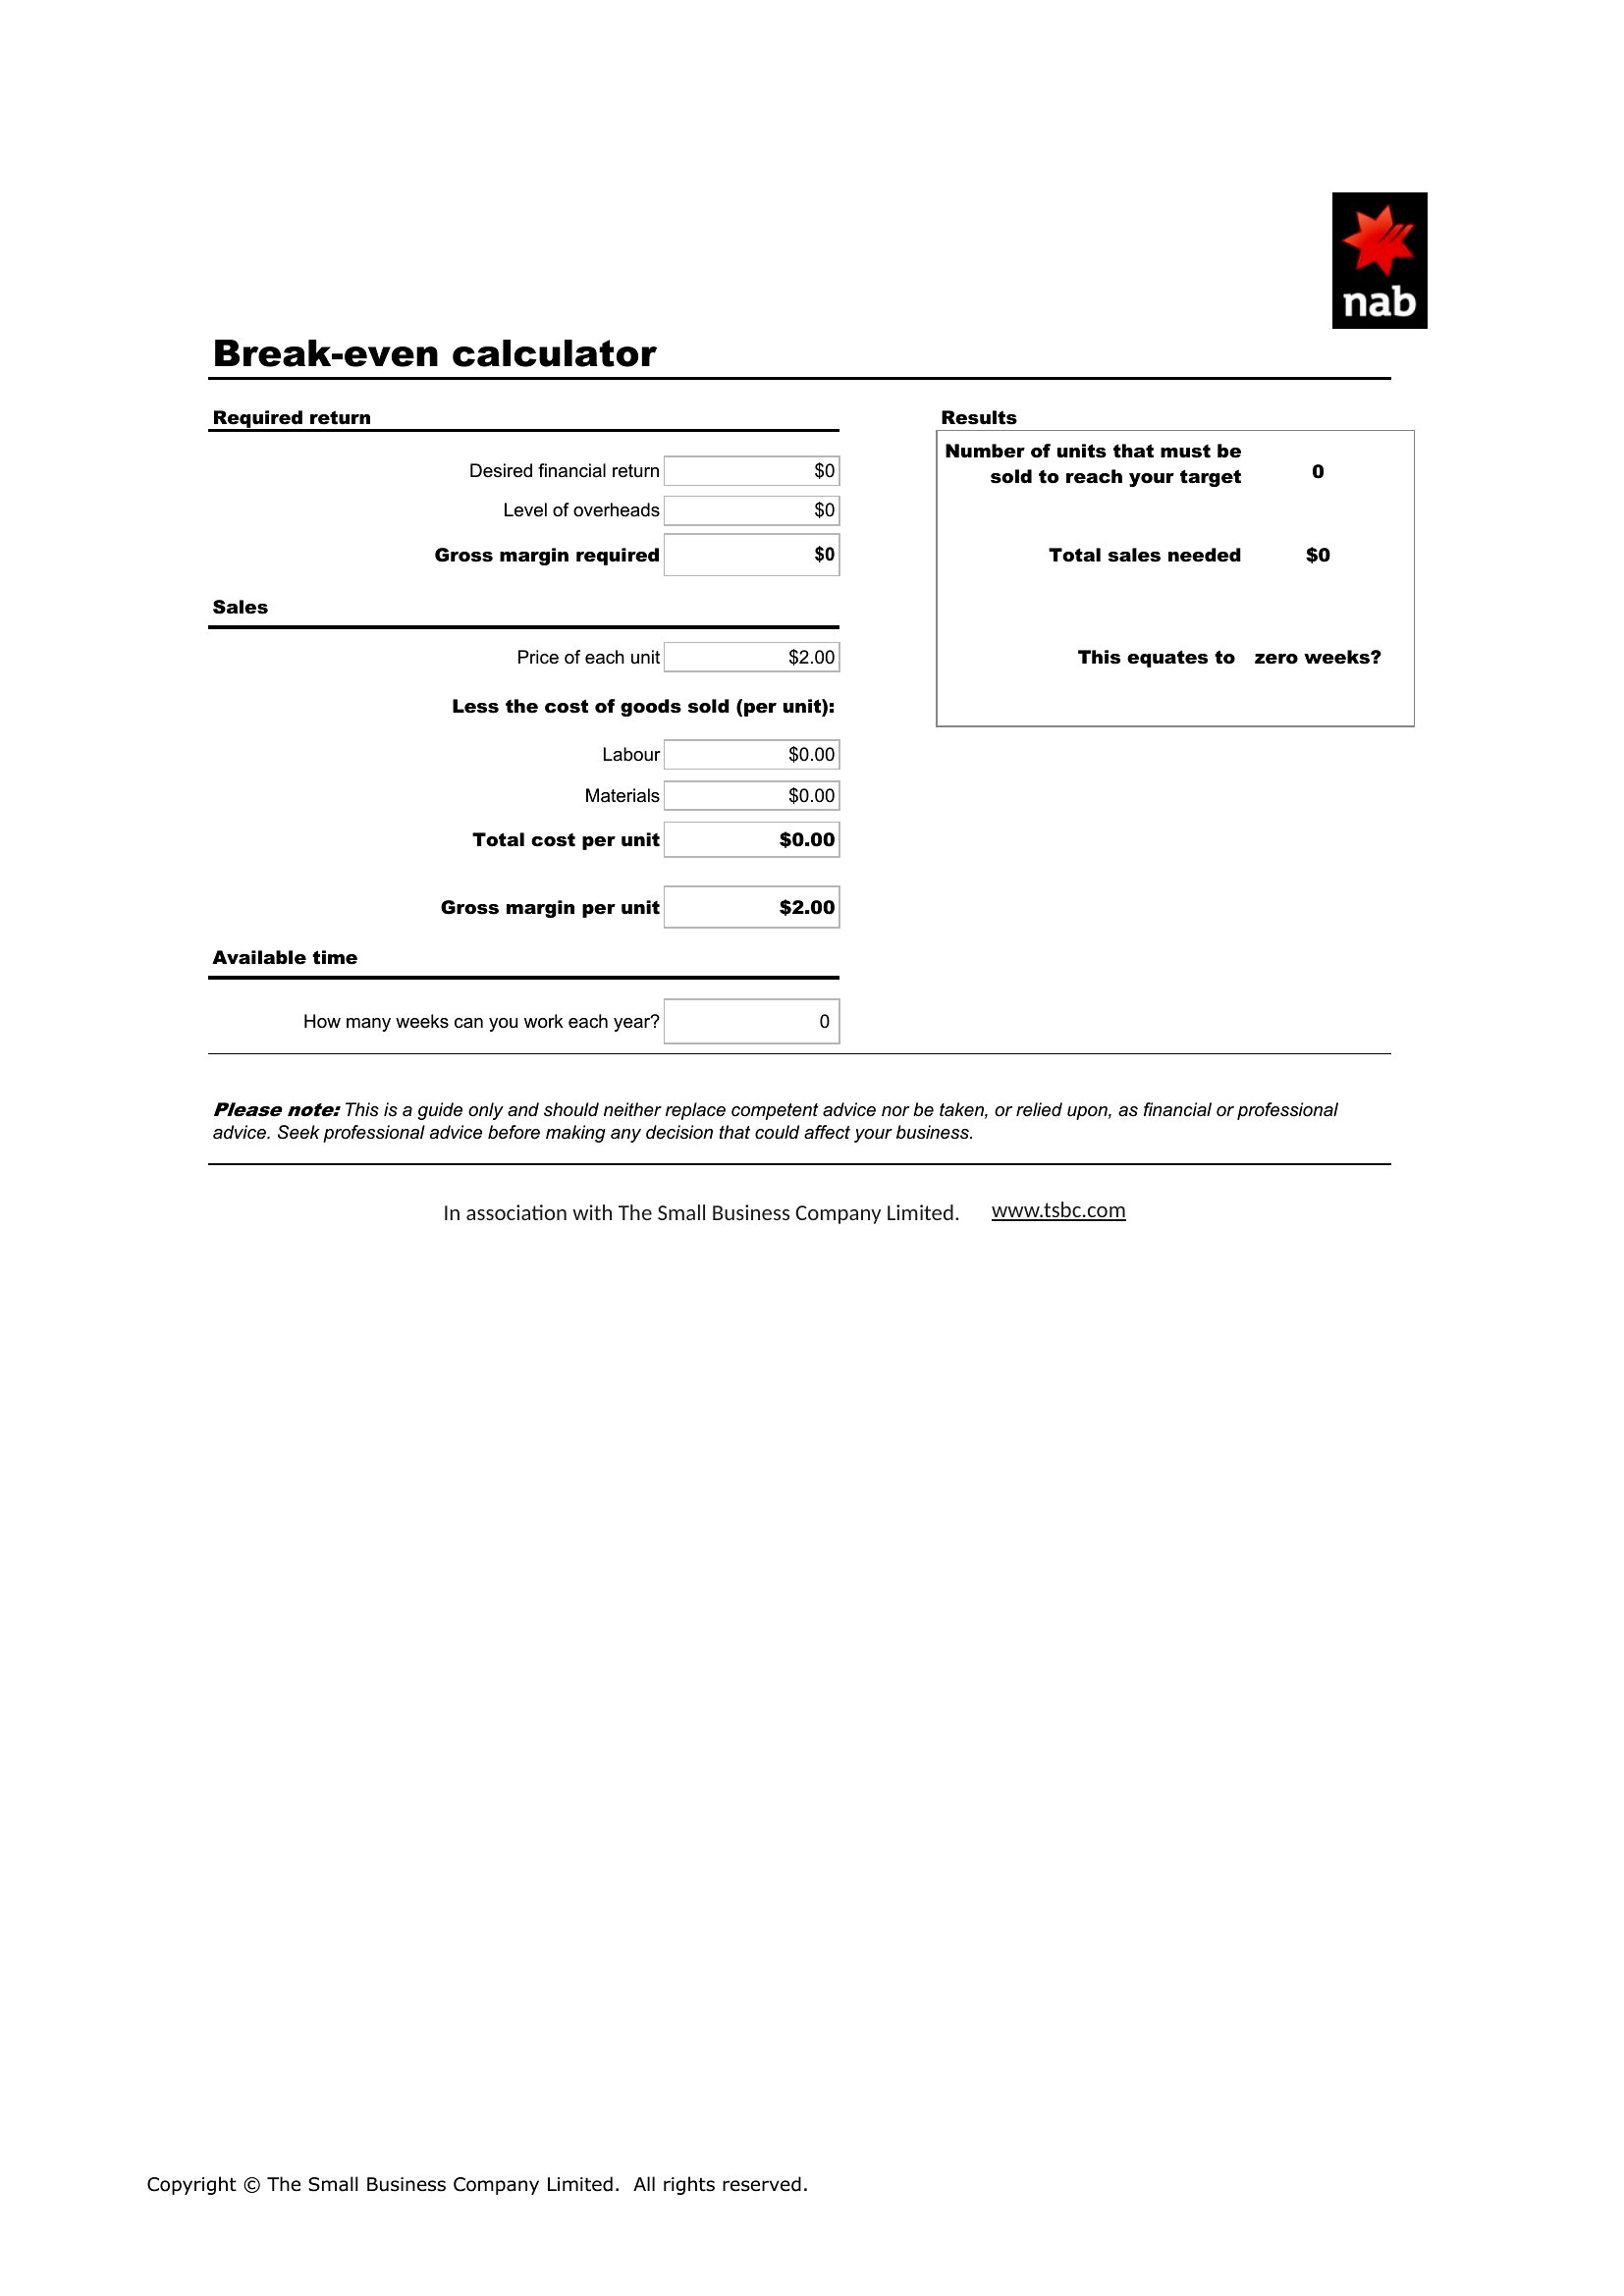
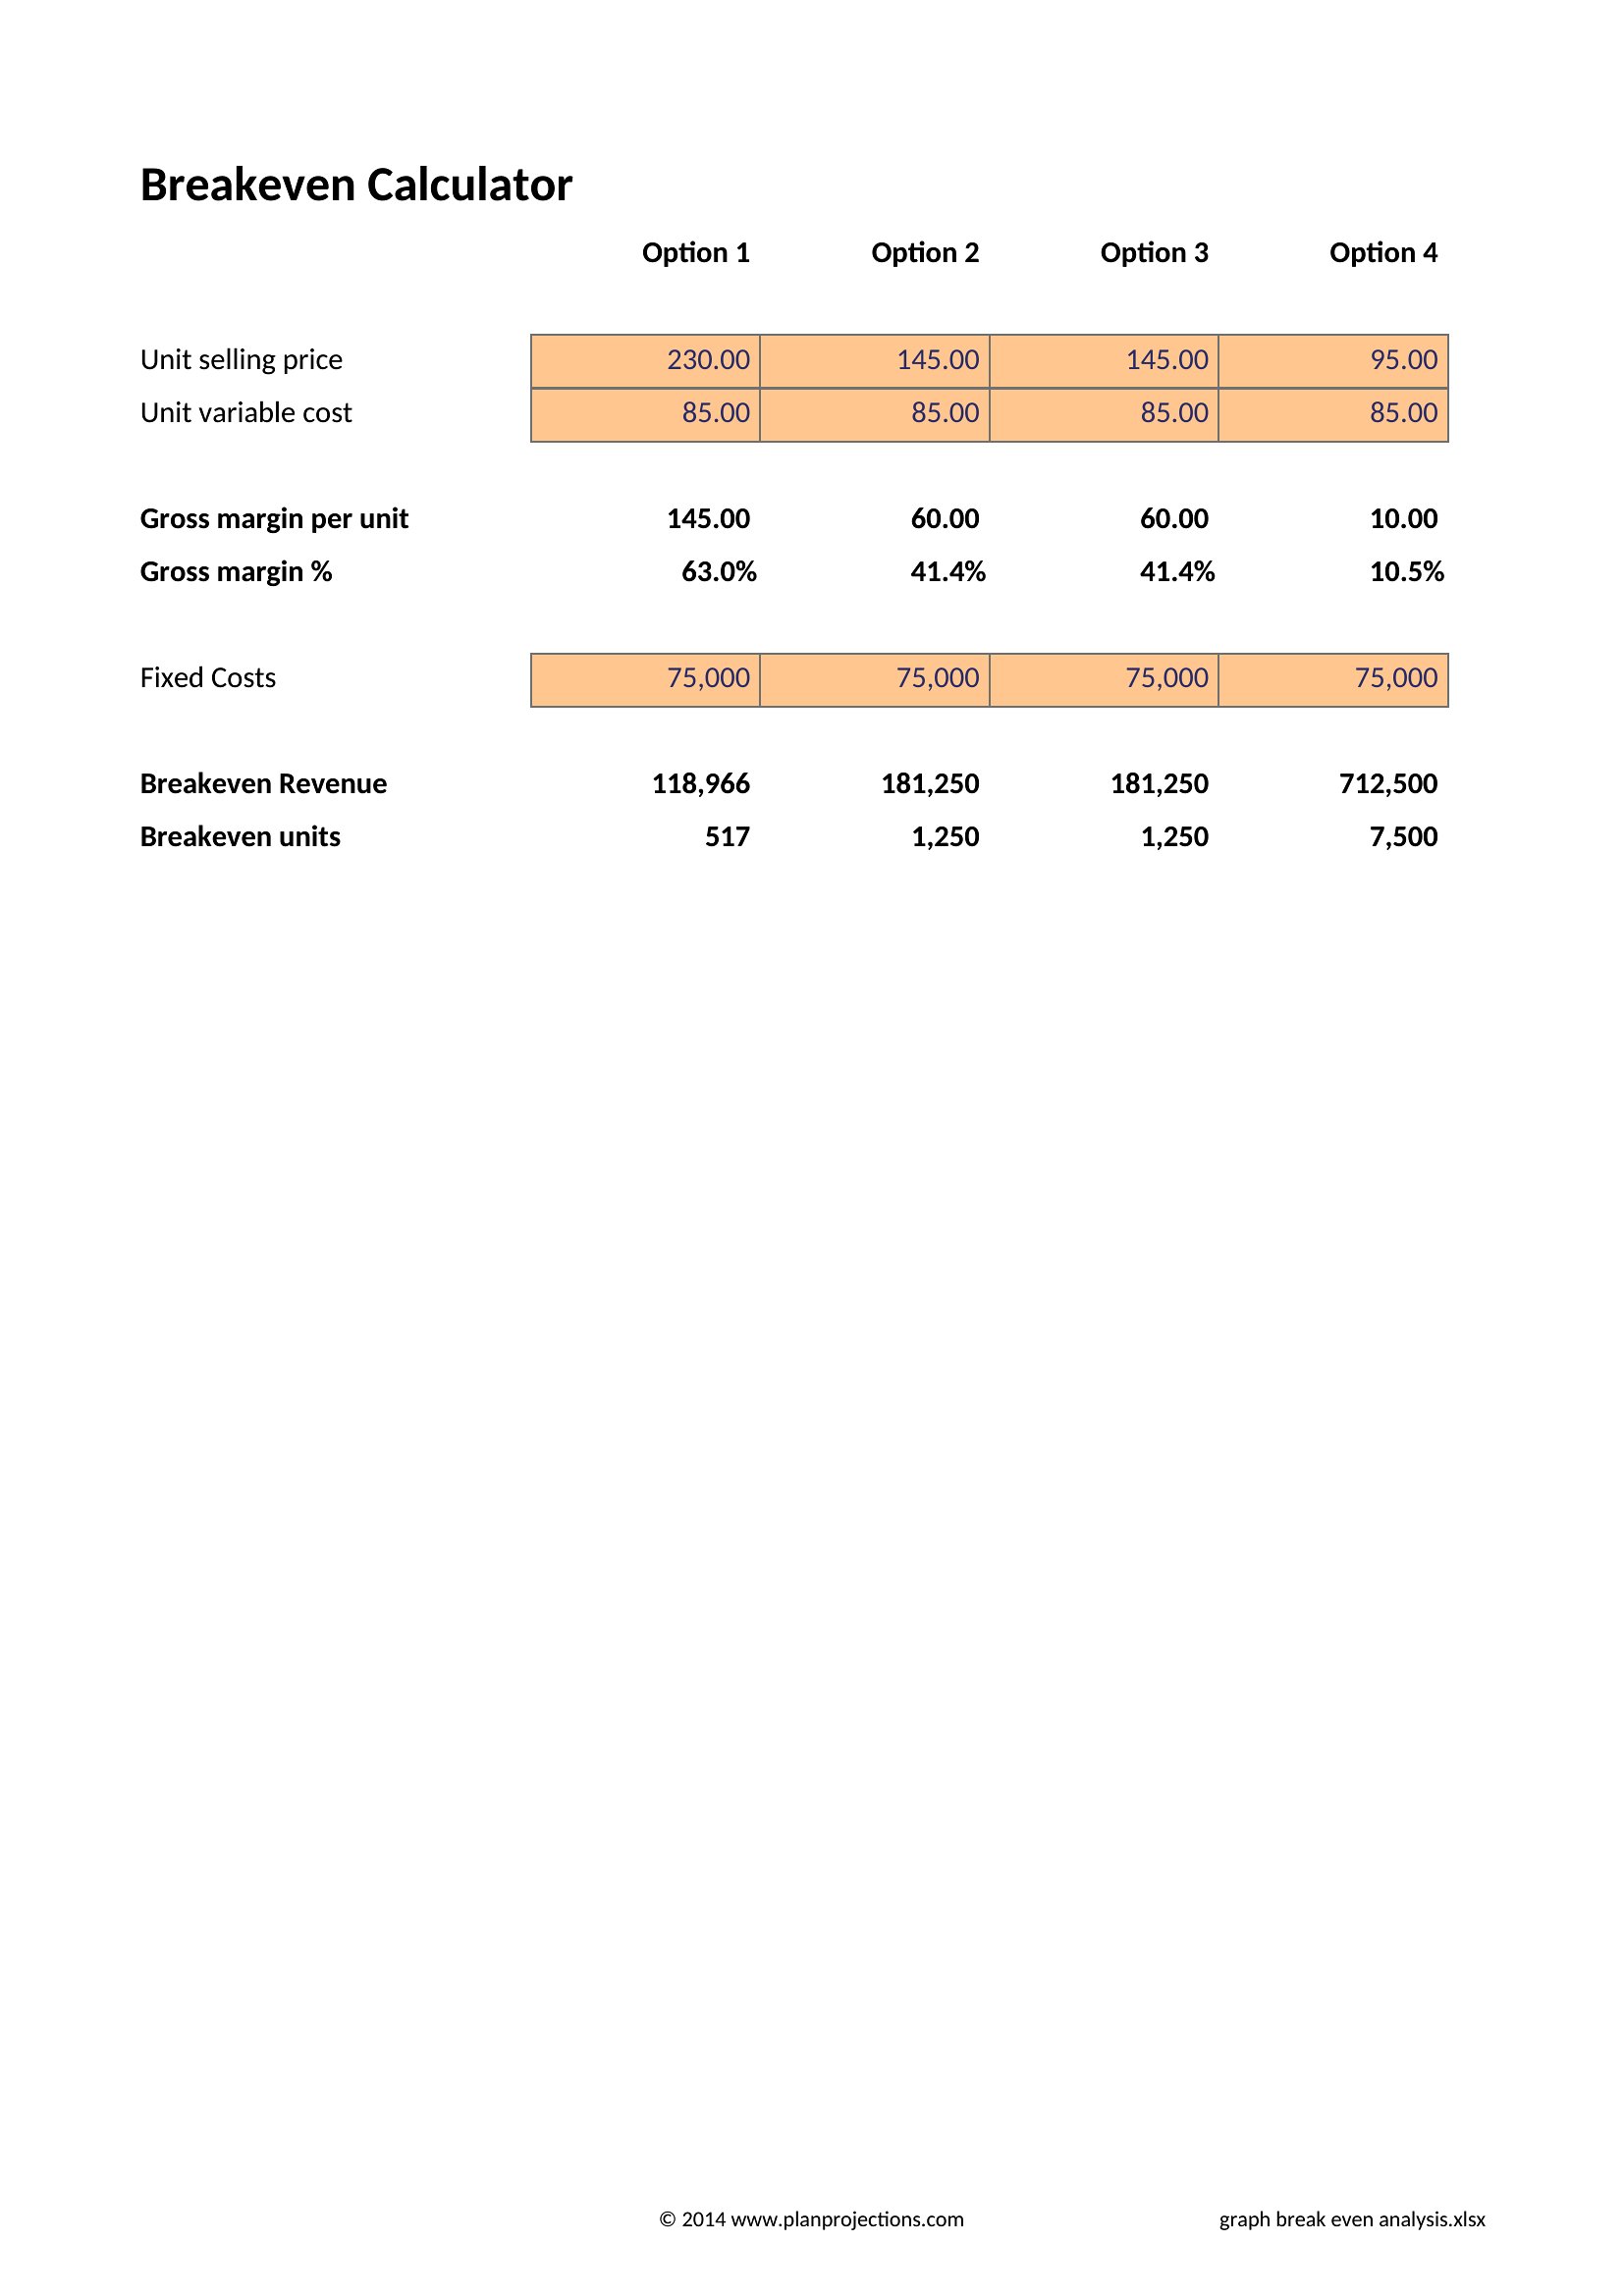
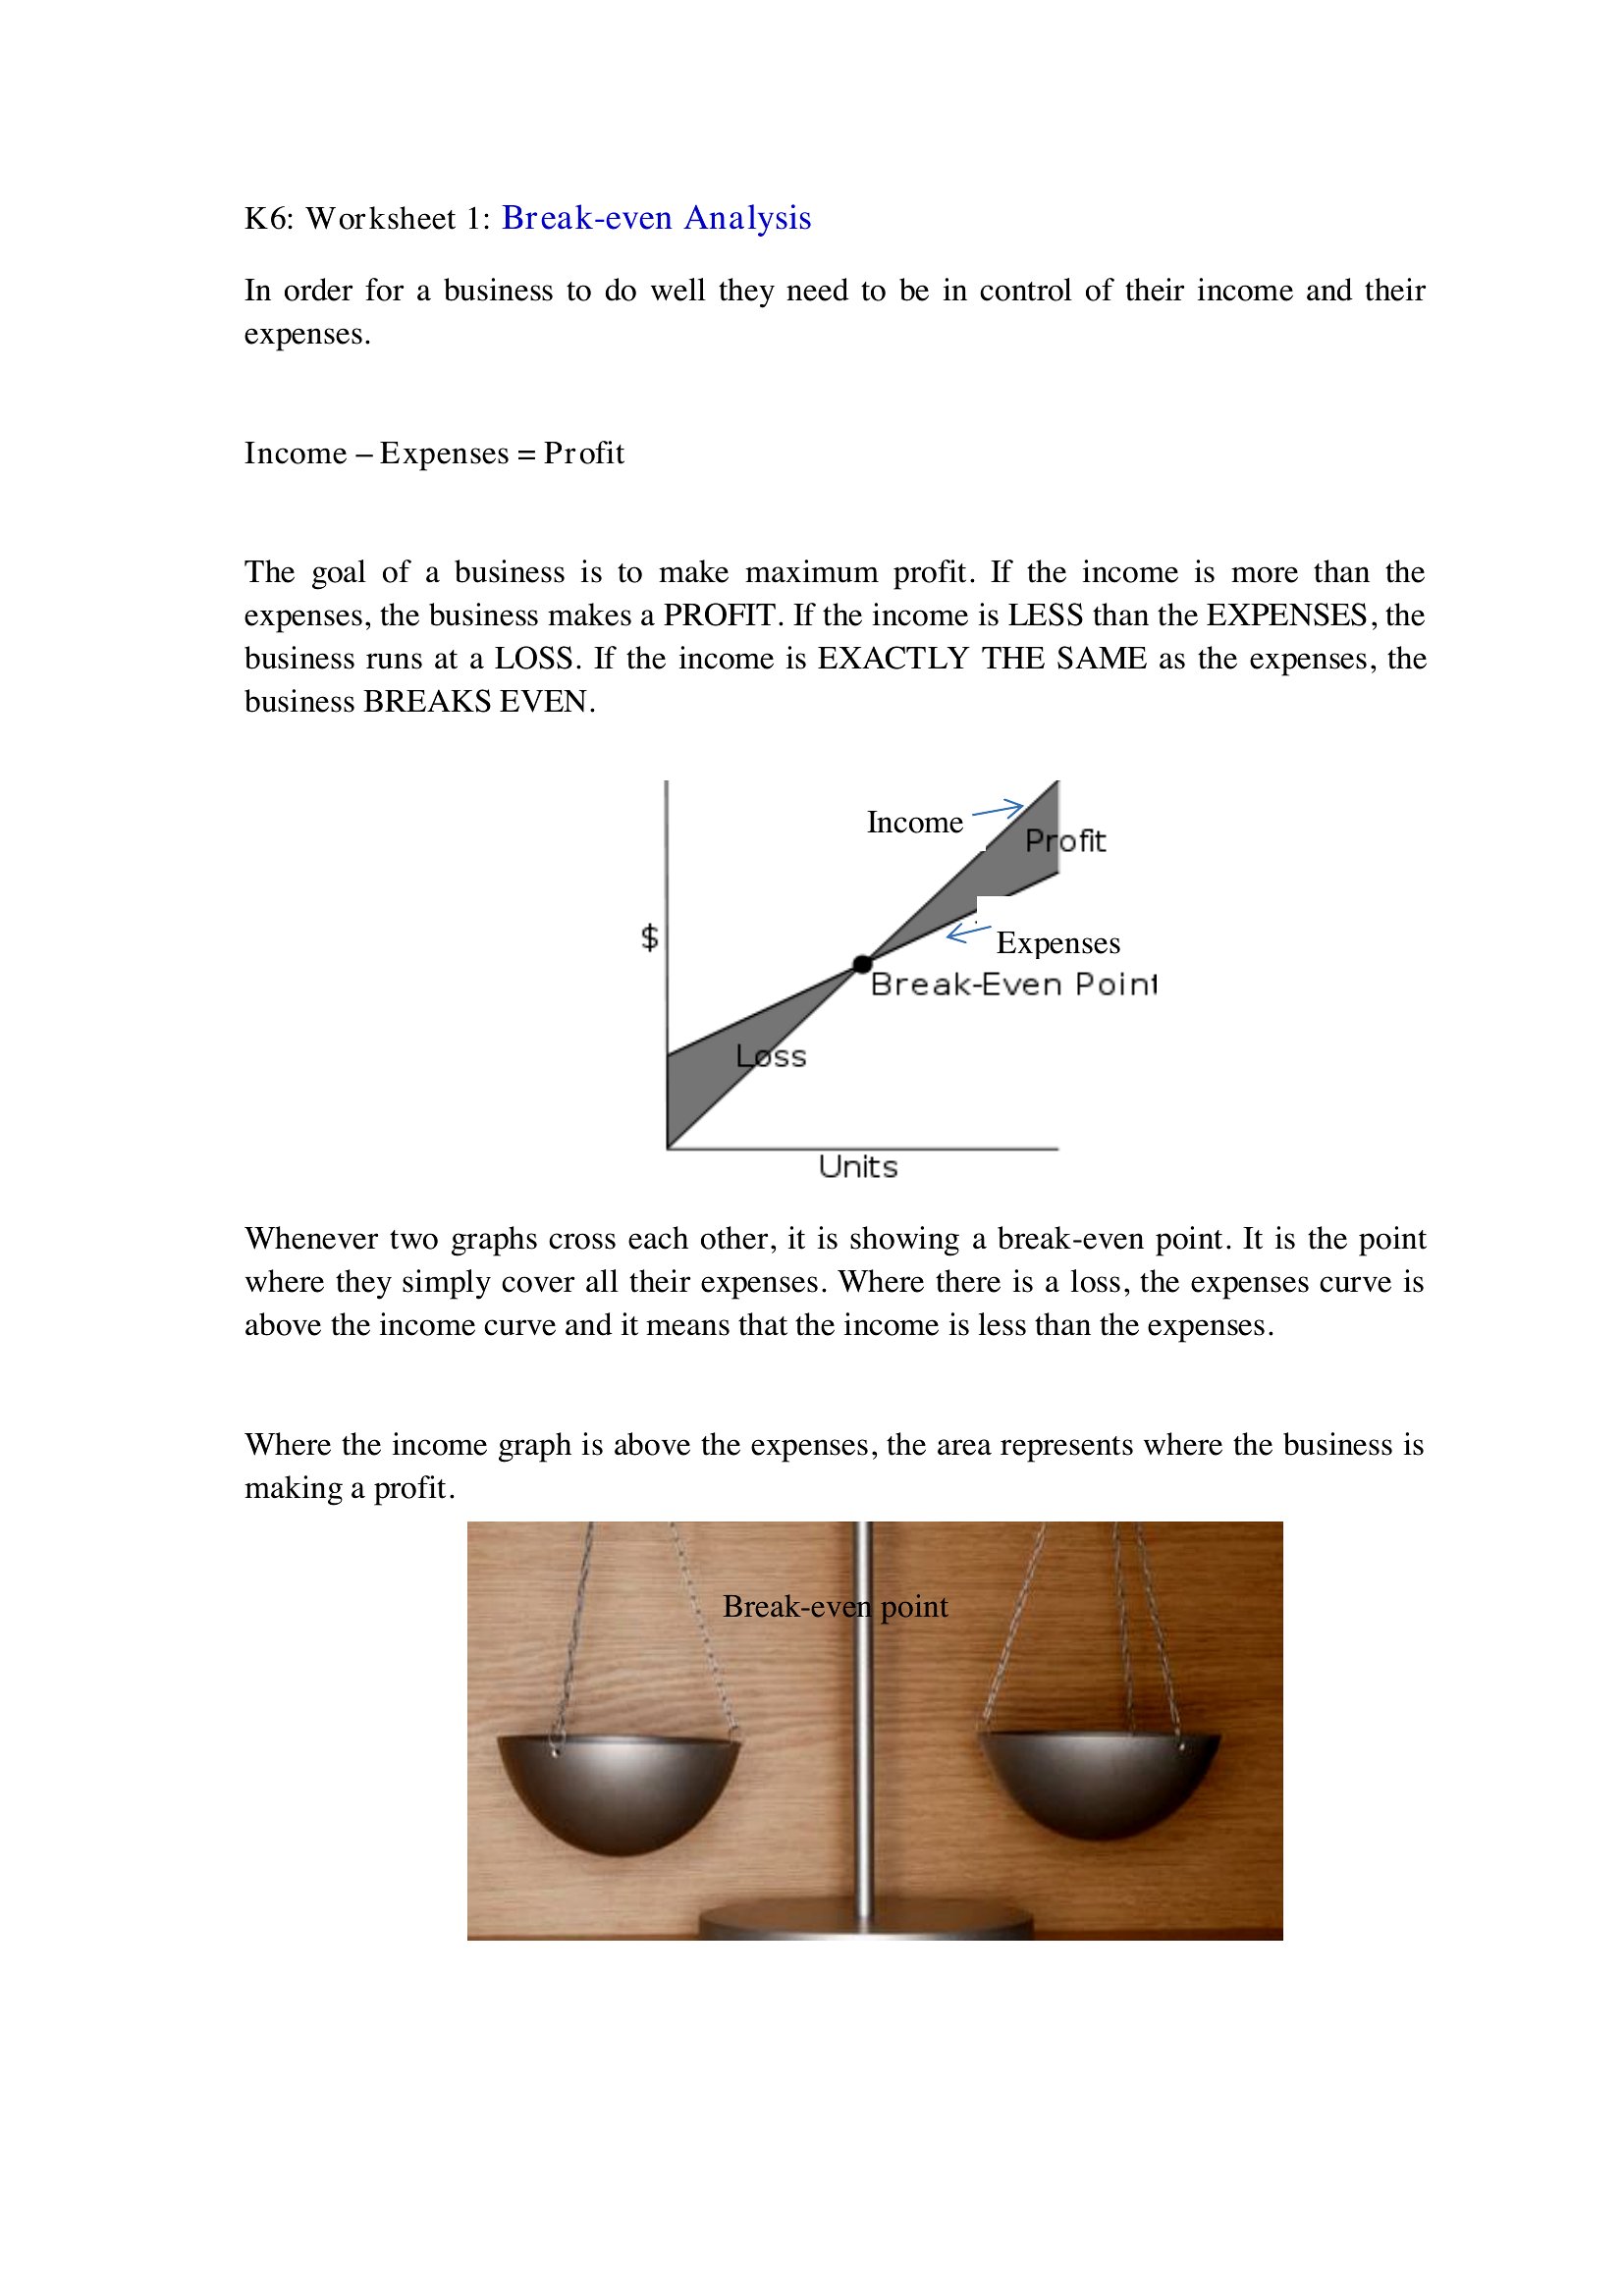
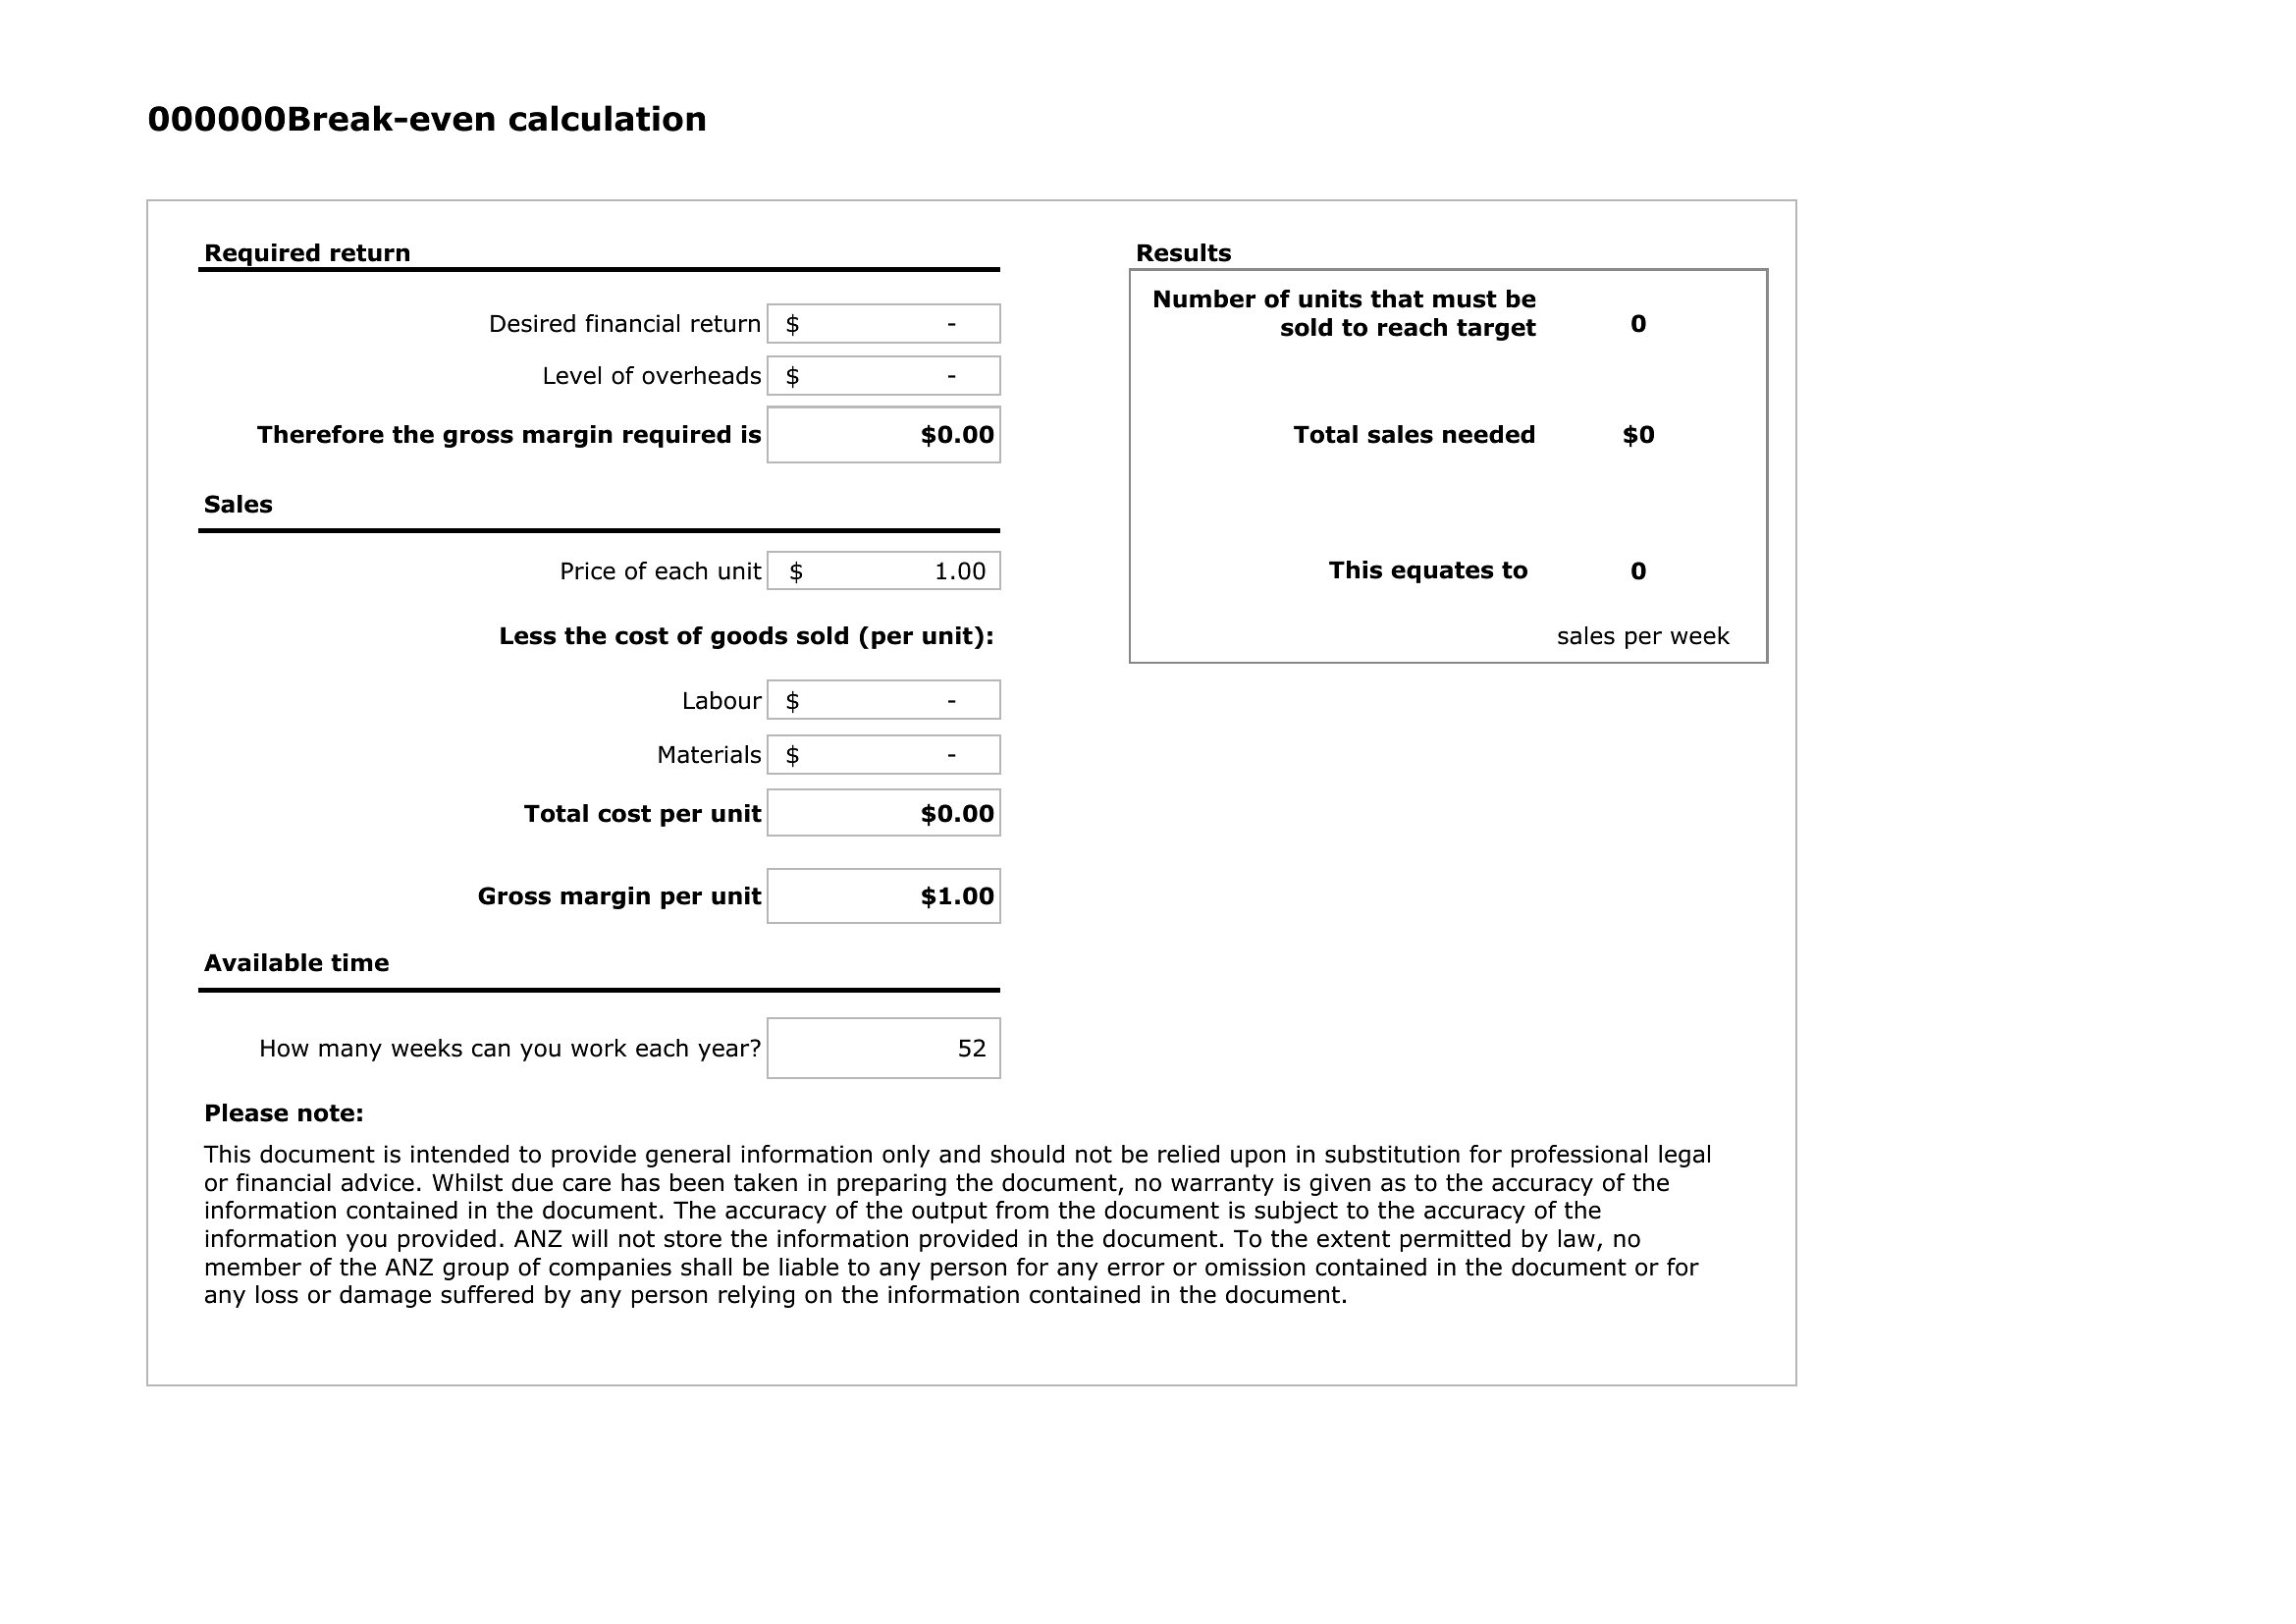
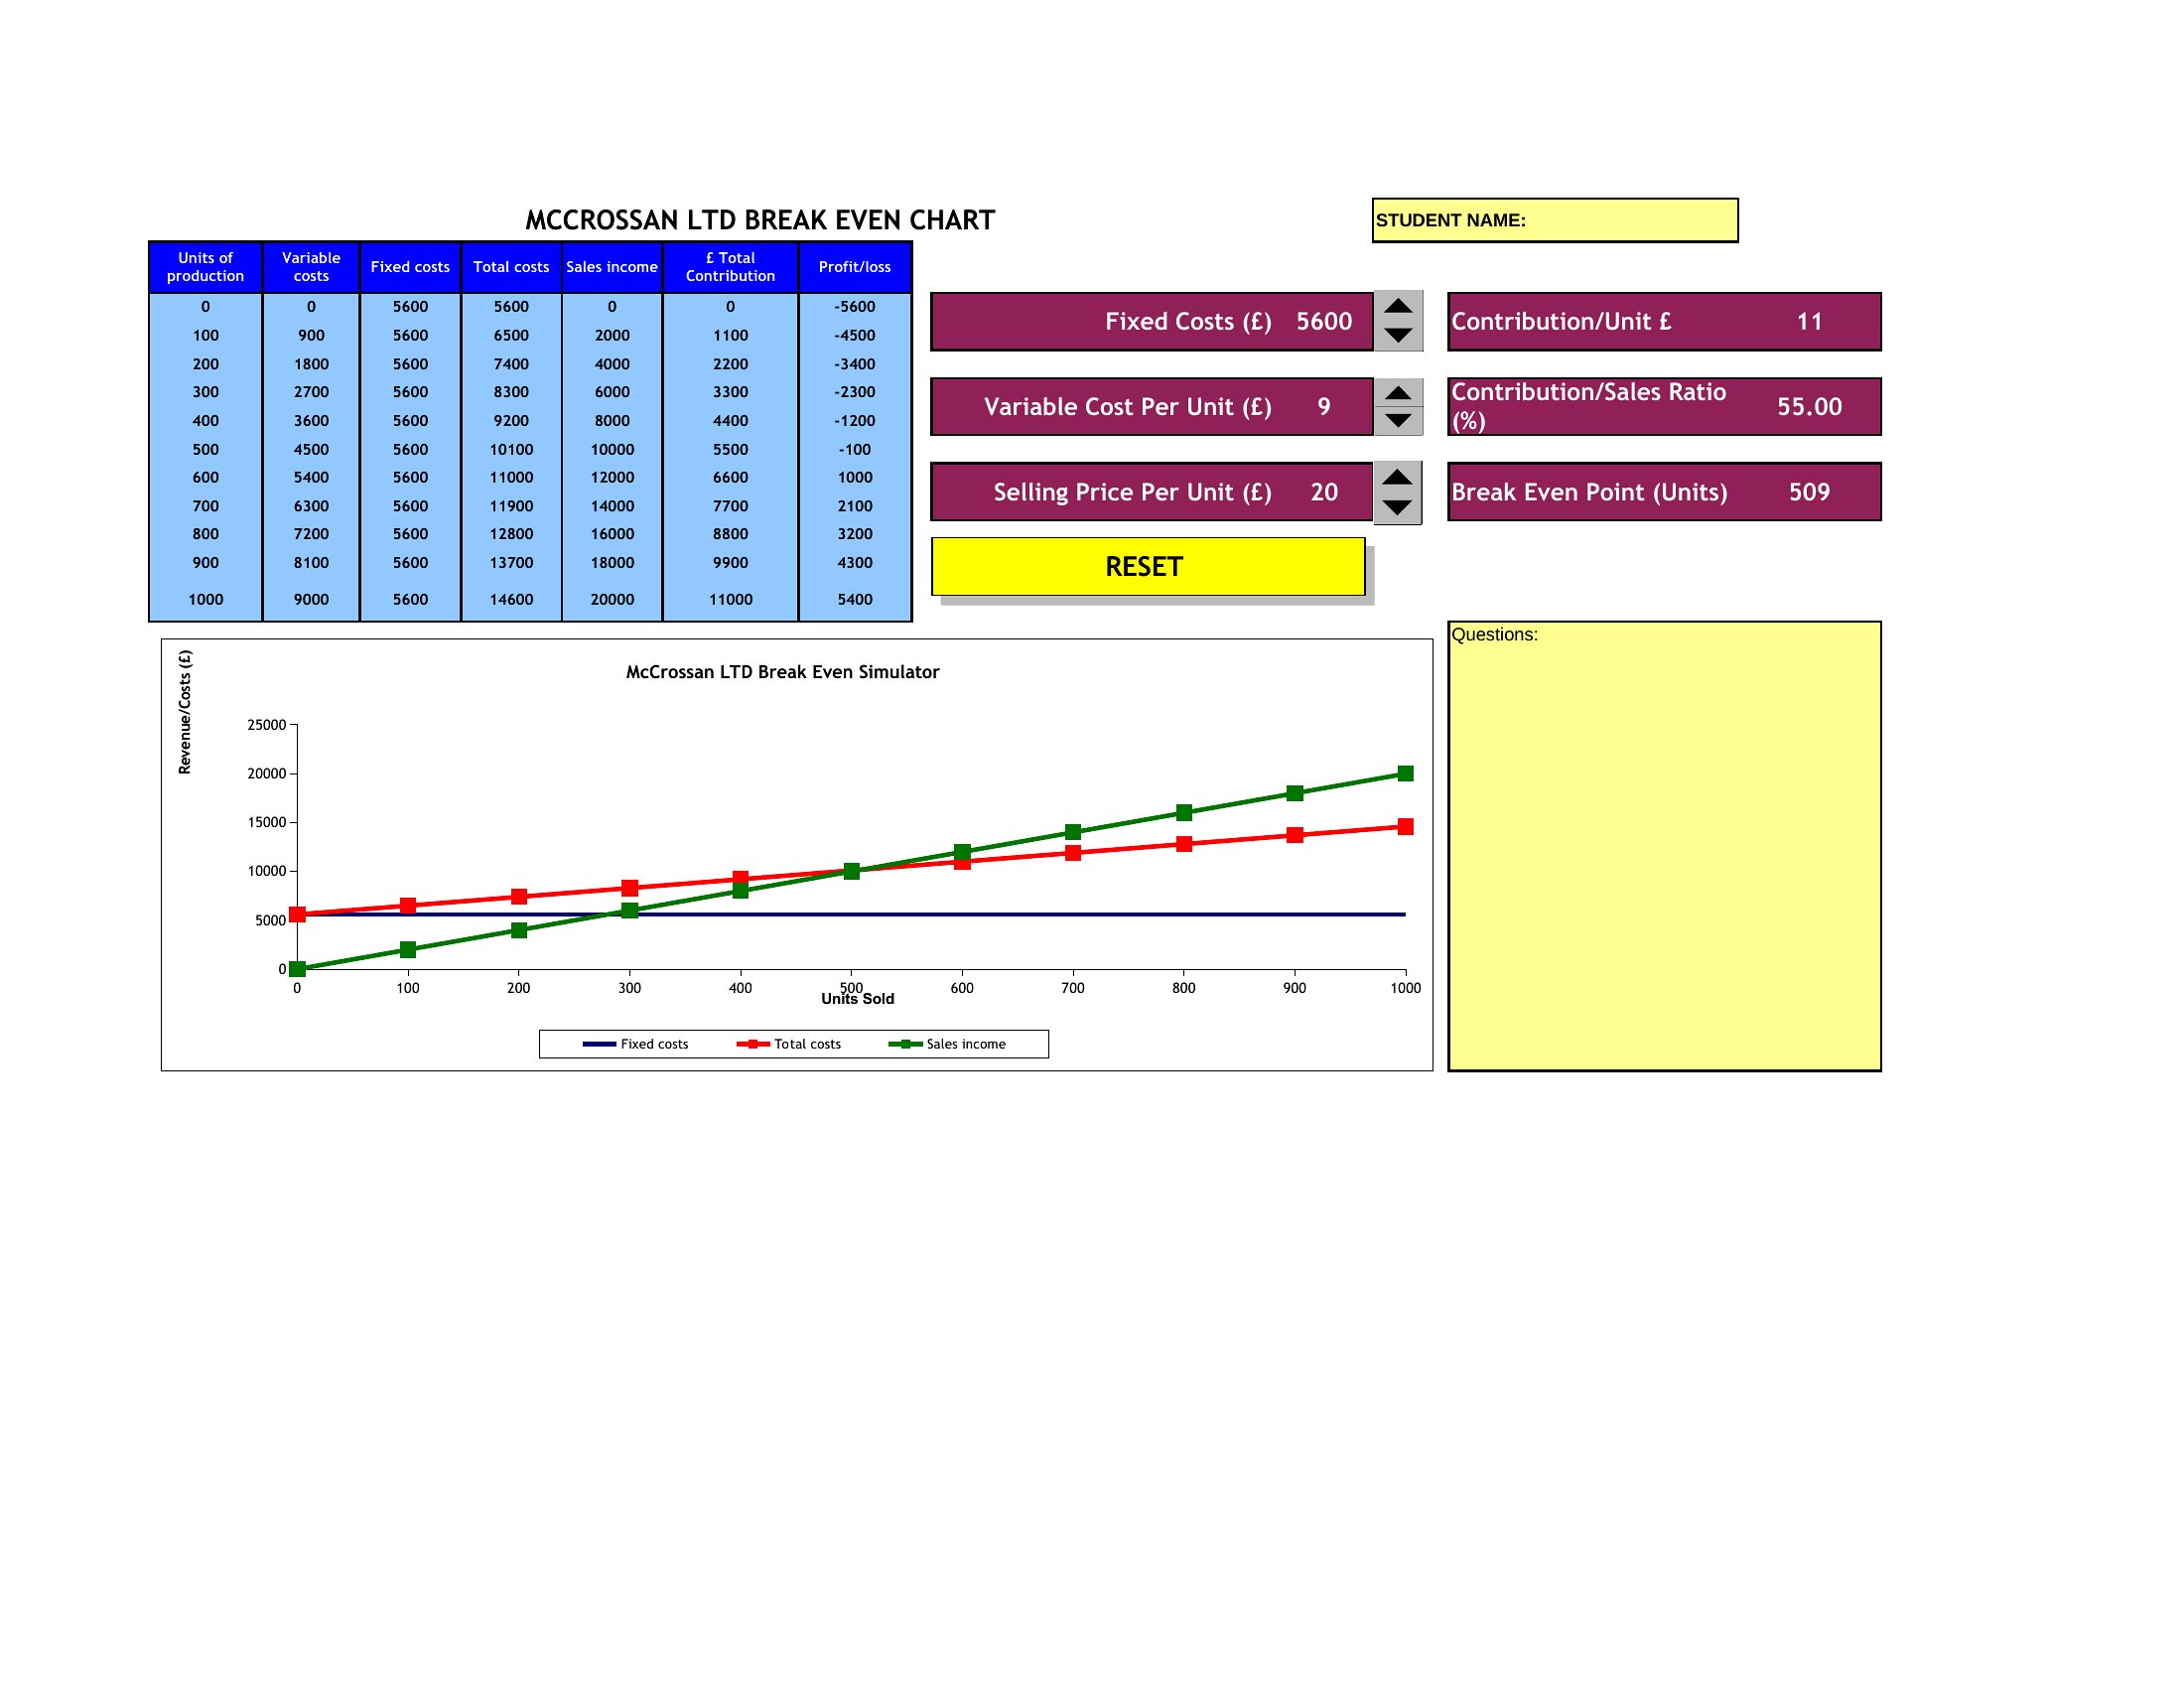
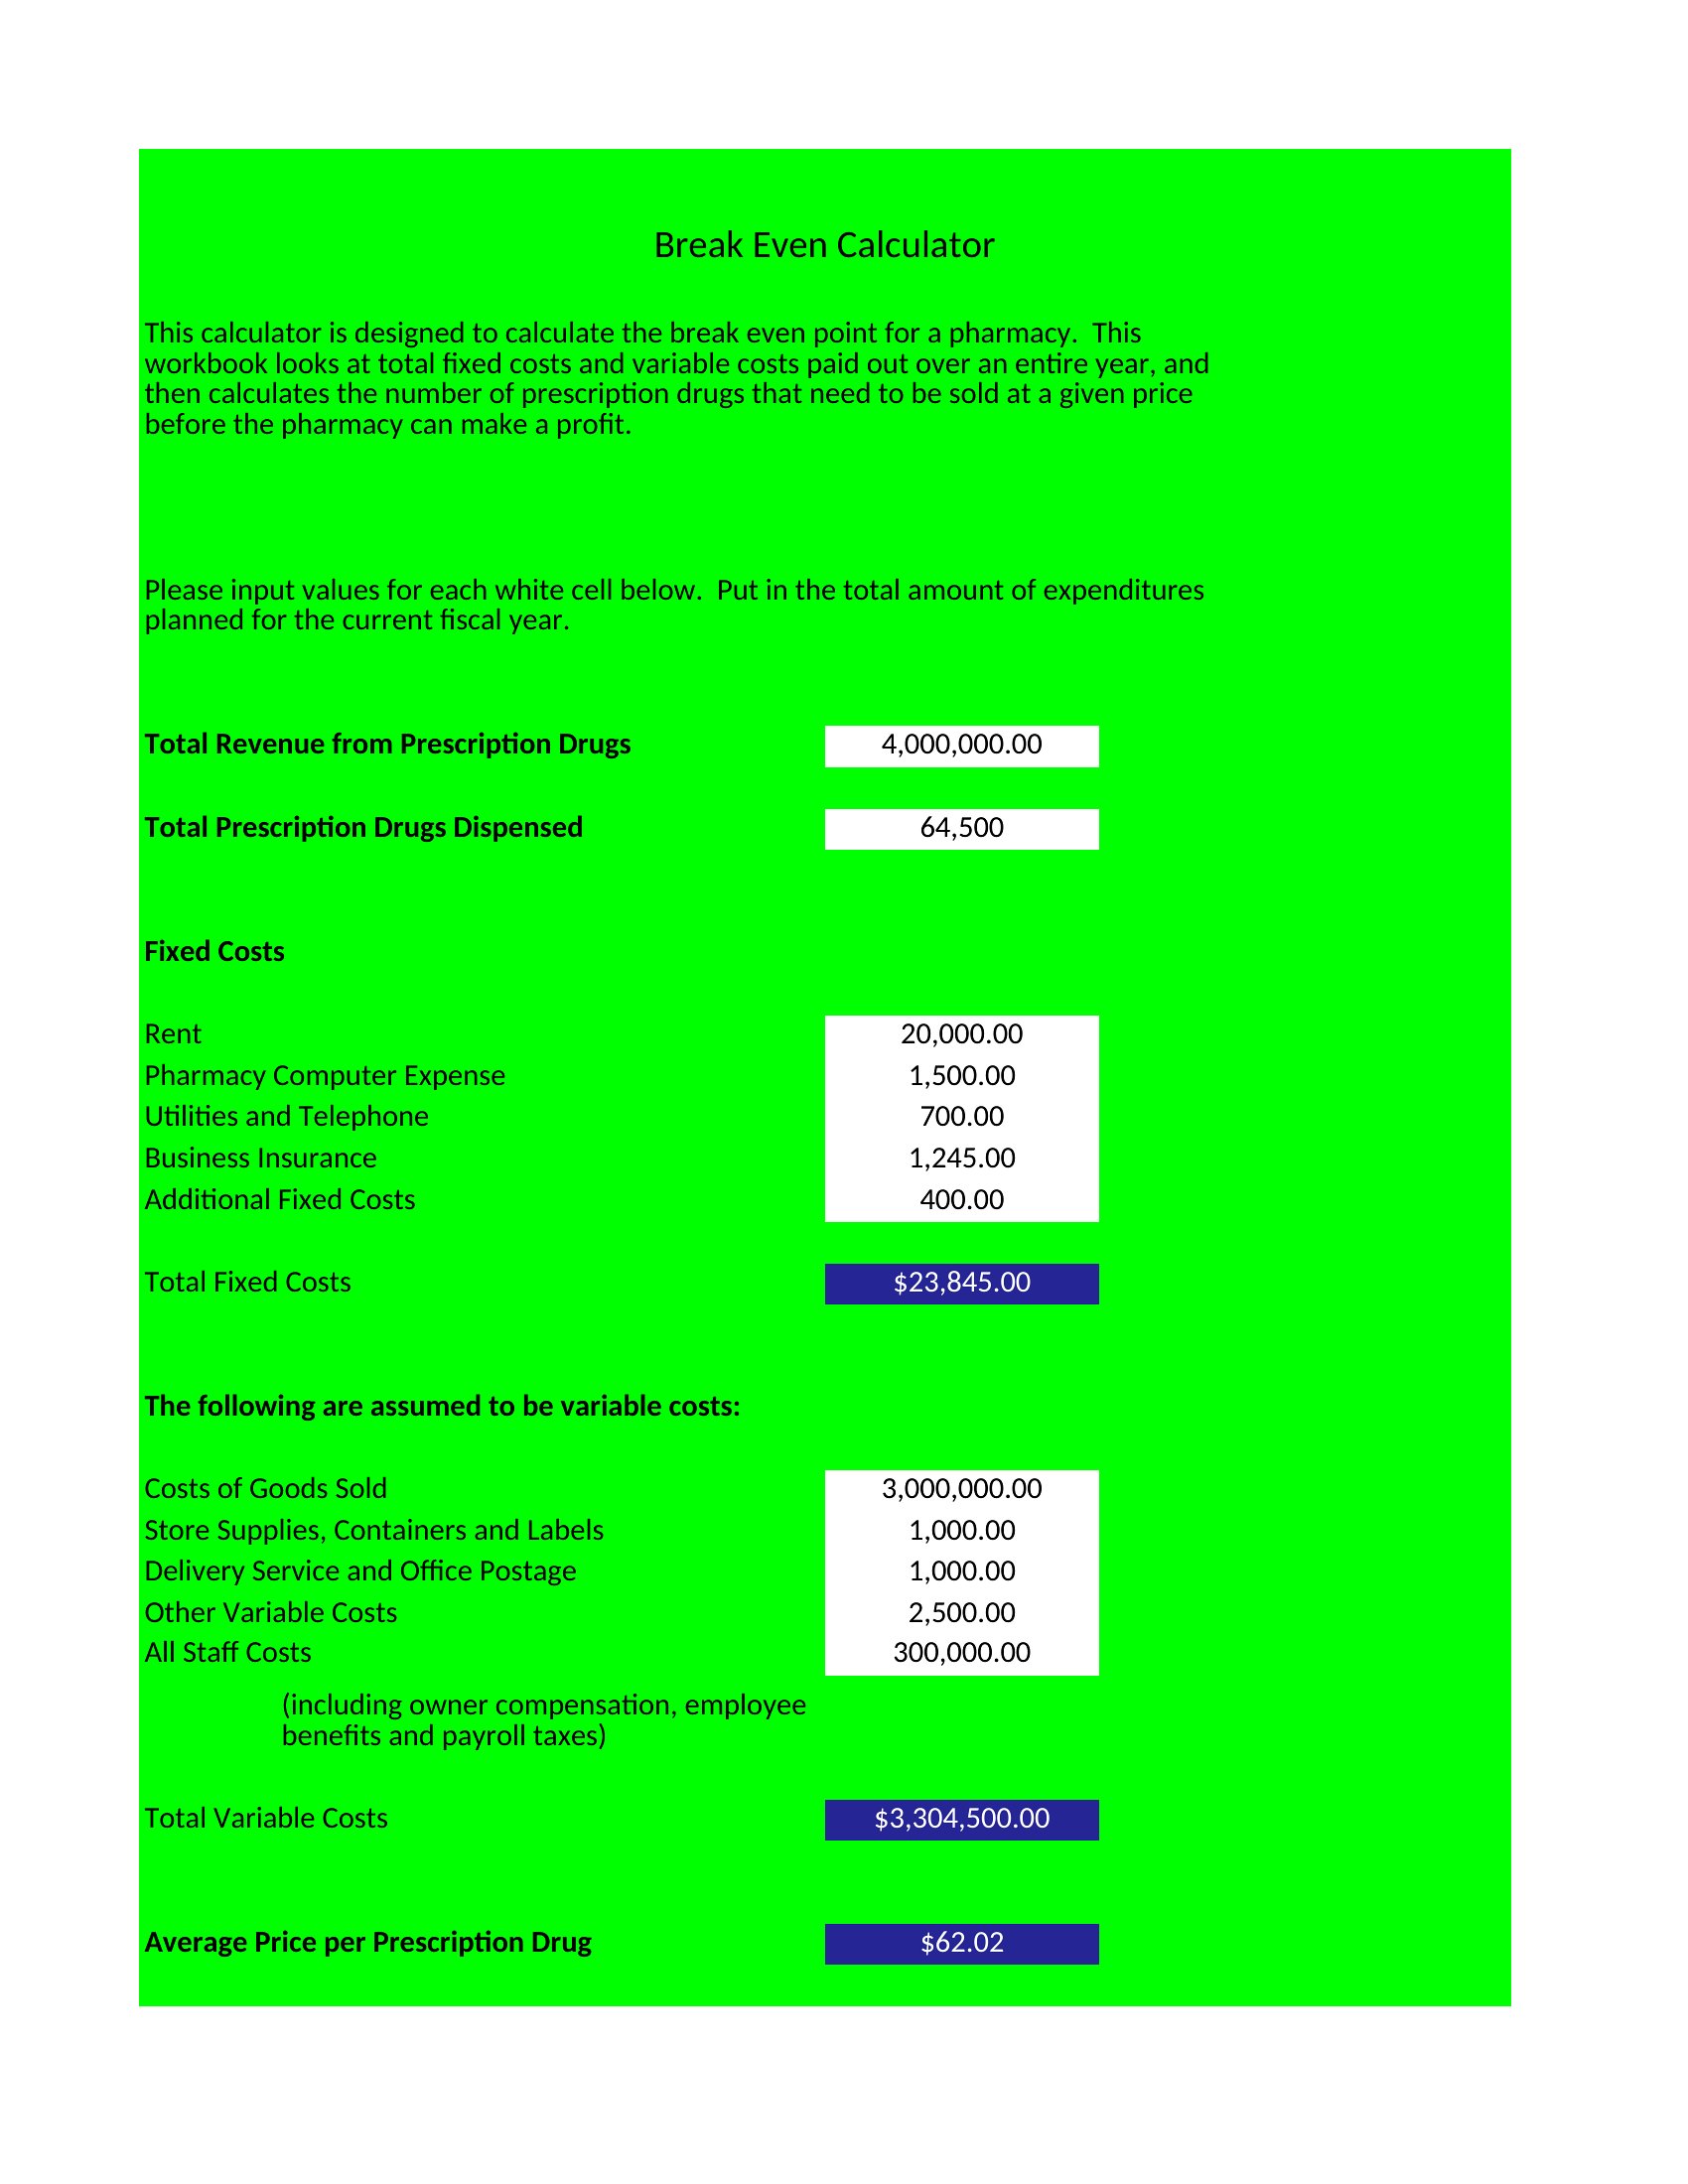
A calculator (like *Break Even Analysis Calculator Excel*) provides a numerical answer to how many units you need to sell, while graph-based templates (*Break Even Analysis Graph*) visually plot your costs, revenue, and break-even point on a chart. Use calculators for quick internal checks, and graphs when presenting to investors or teams who benefit from seeing trends at a glance.
Comments
Join the conversation
Sign in to share your thoughts and leave a comment on this resource.