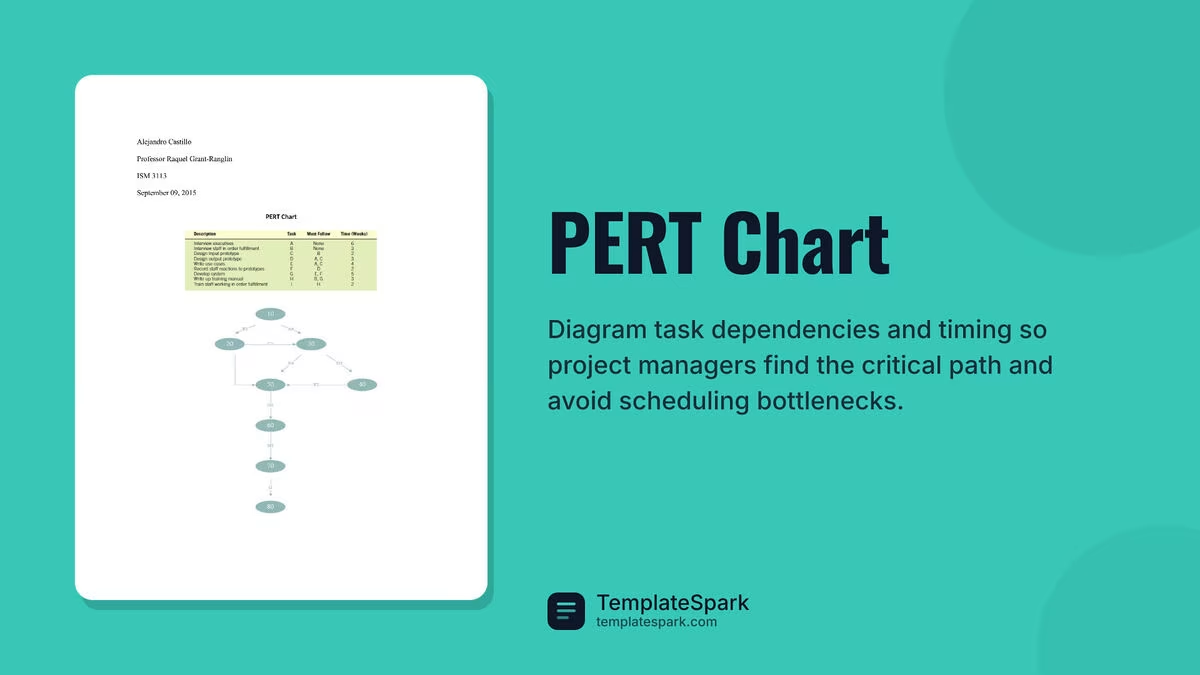
Free PERT Chart Templates (Word, Excel, PDF)
Diagrams by veroniquemohle
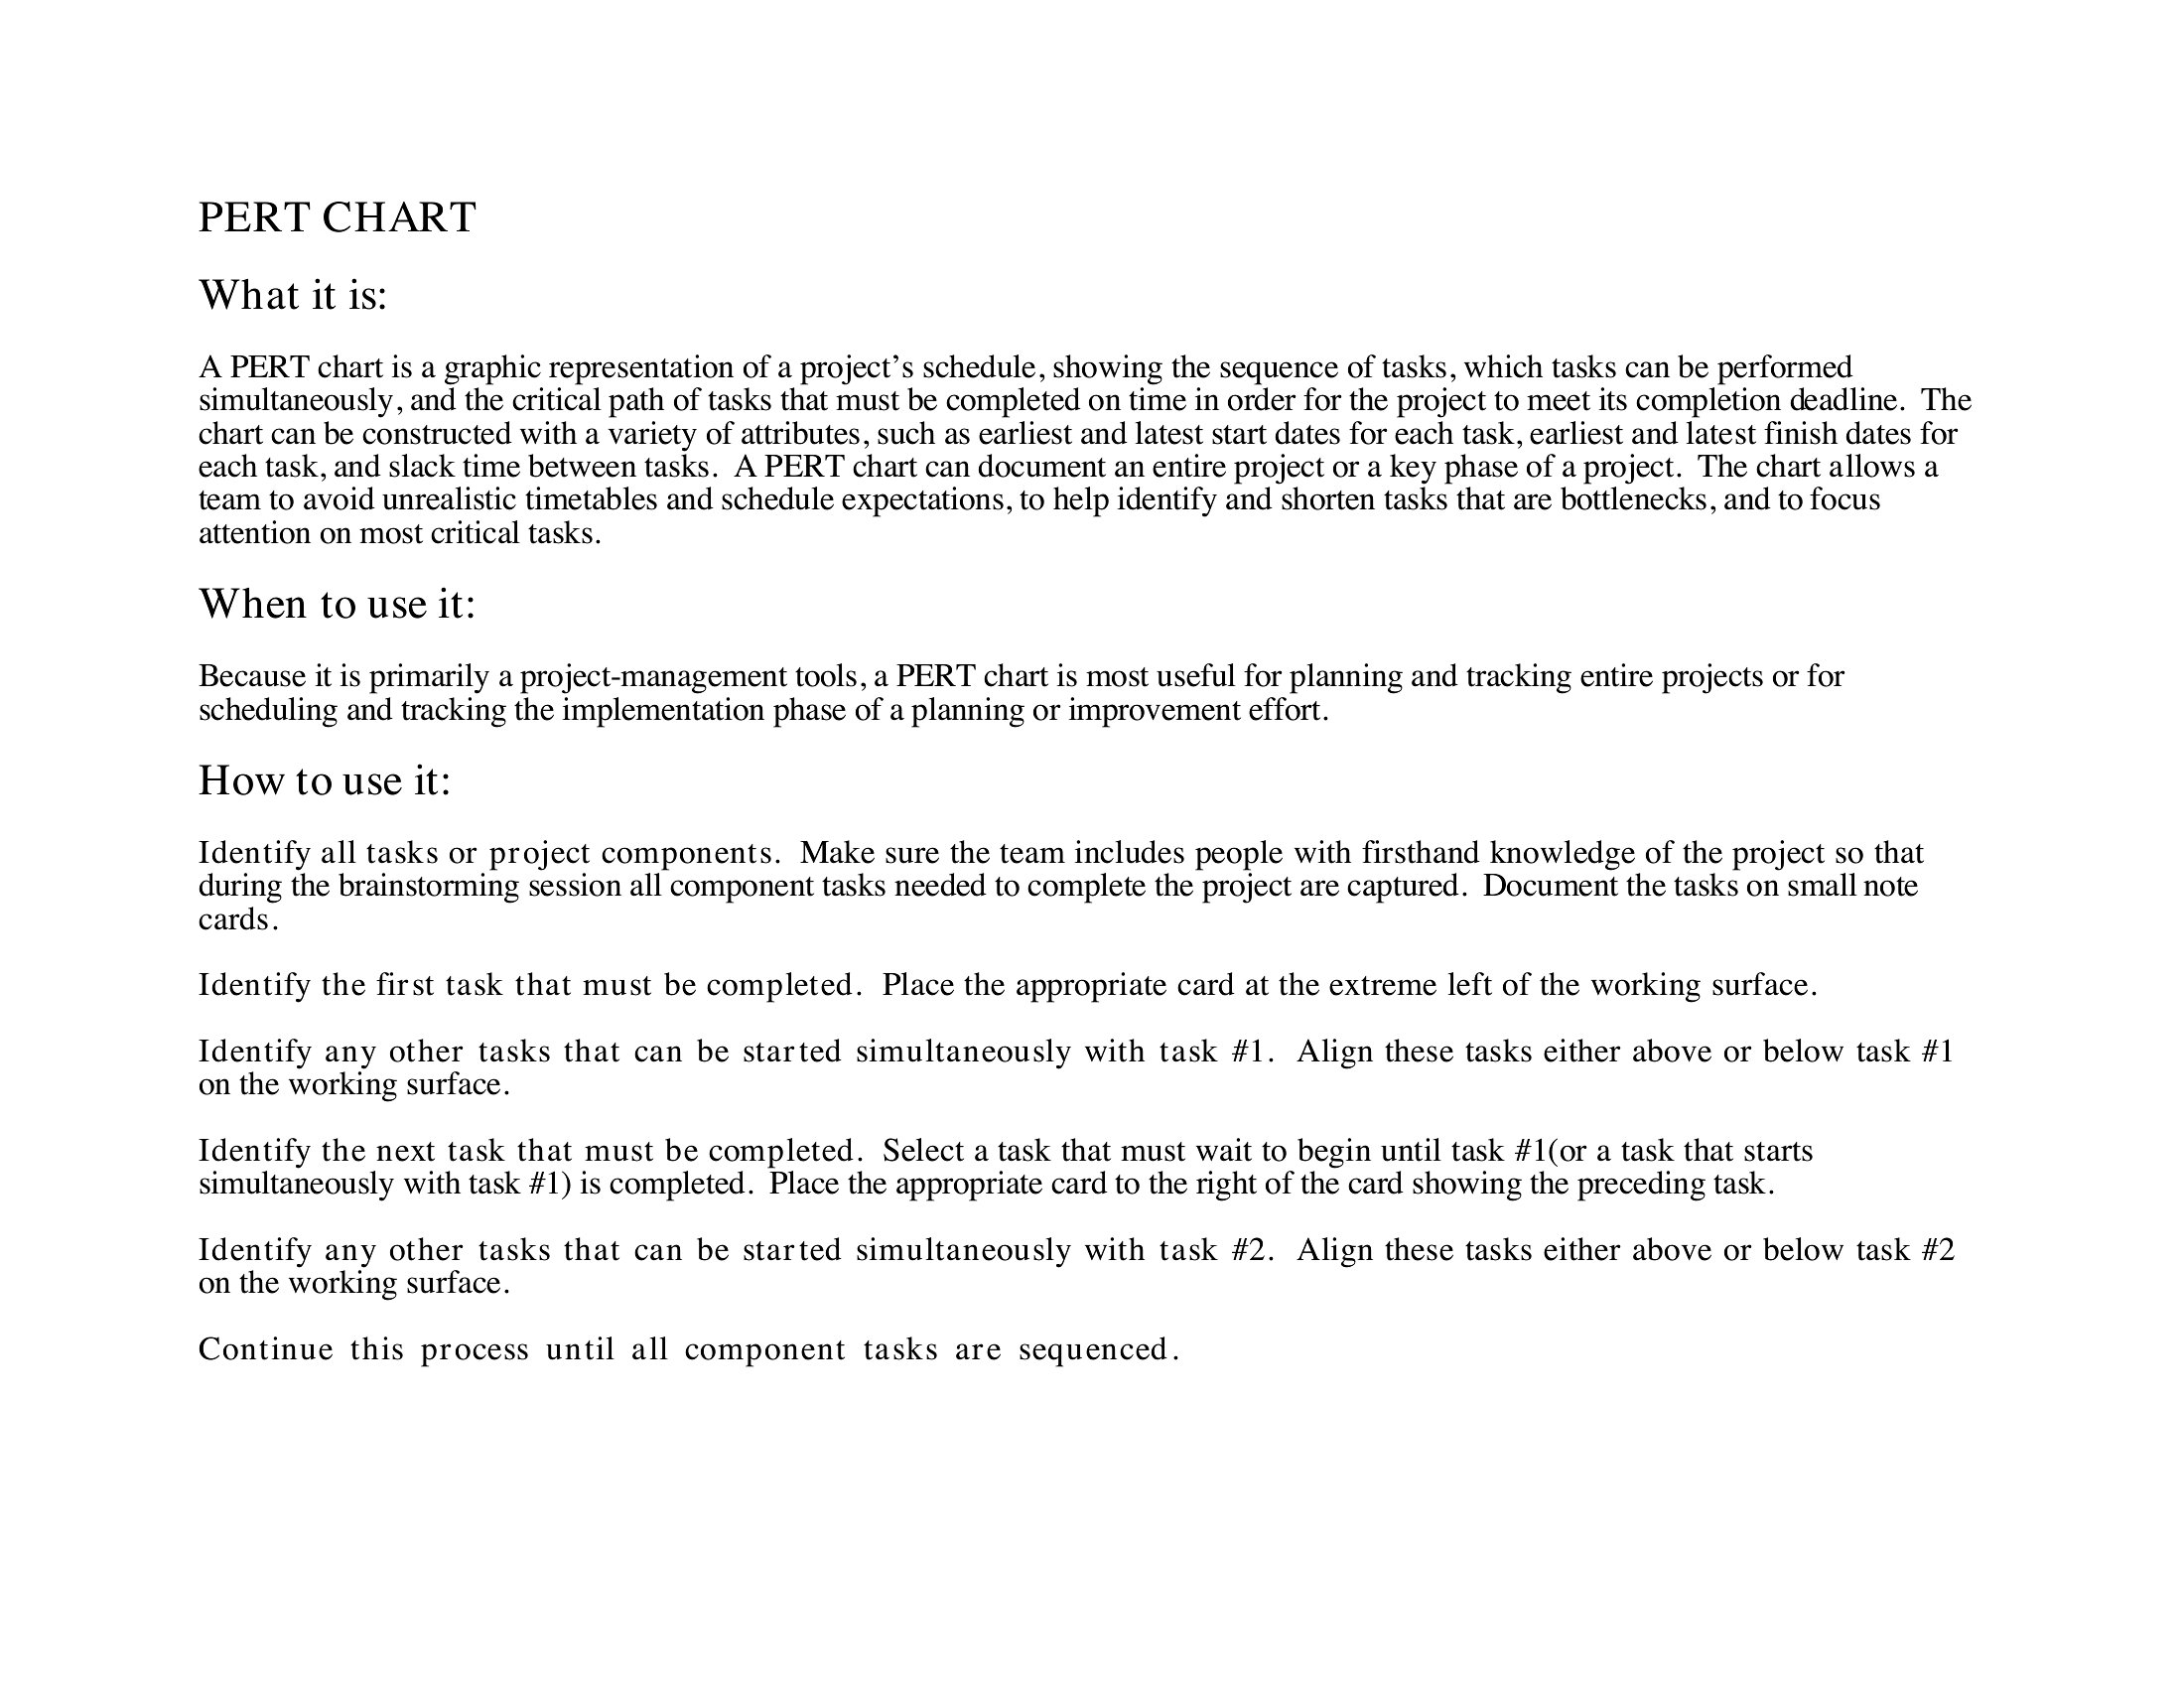
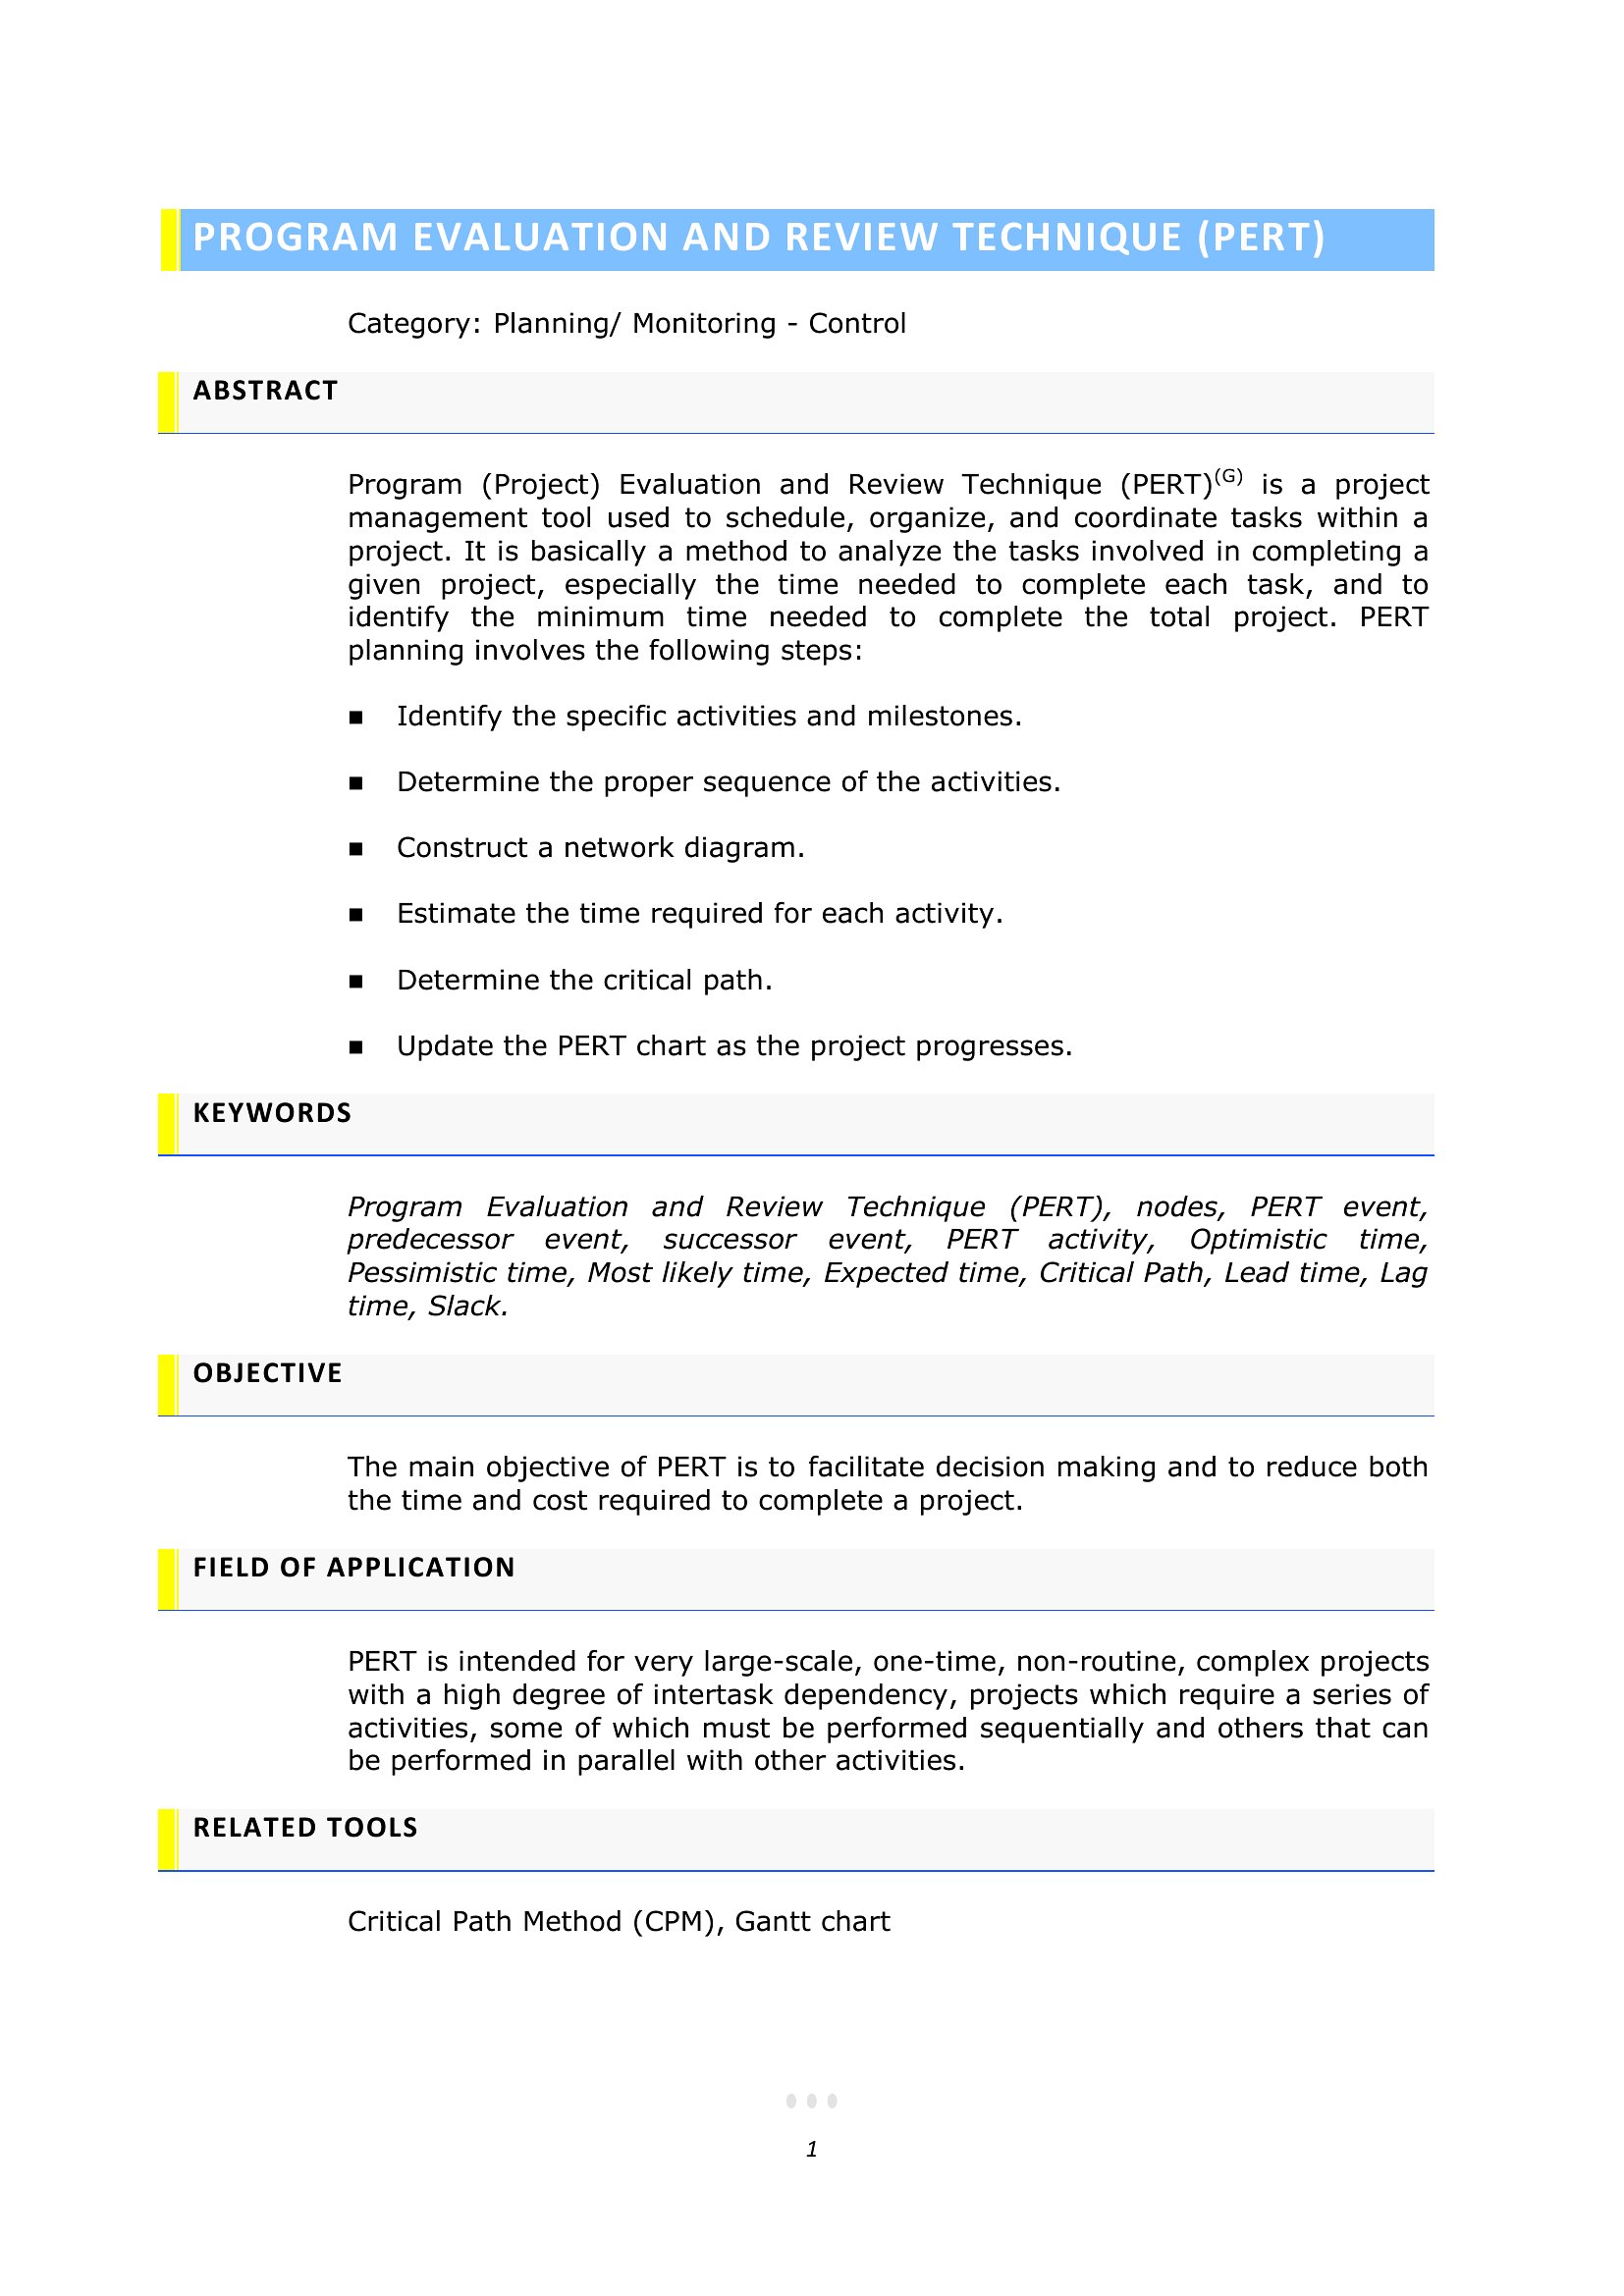
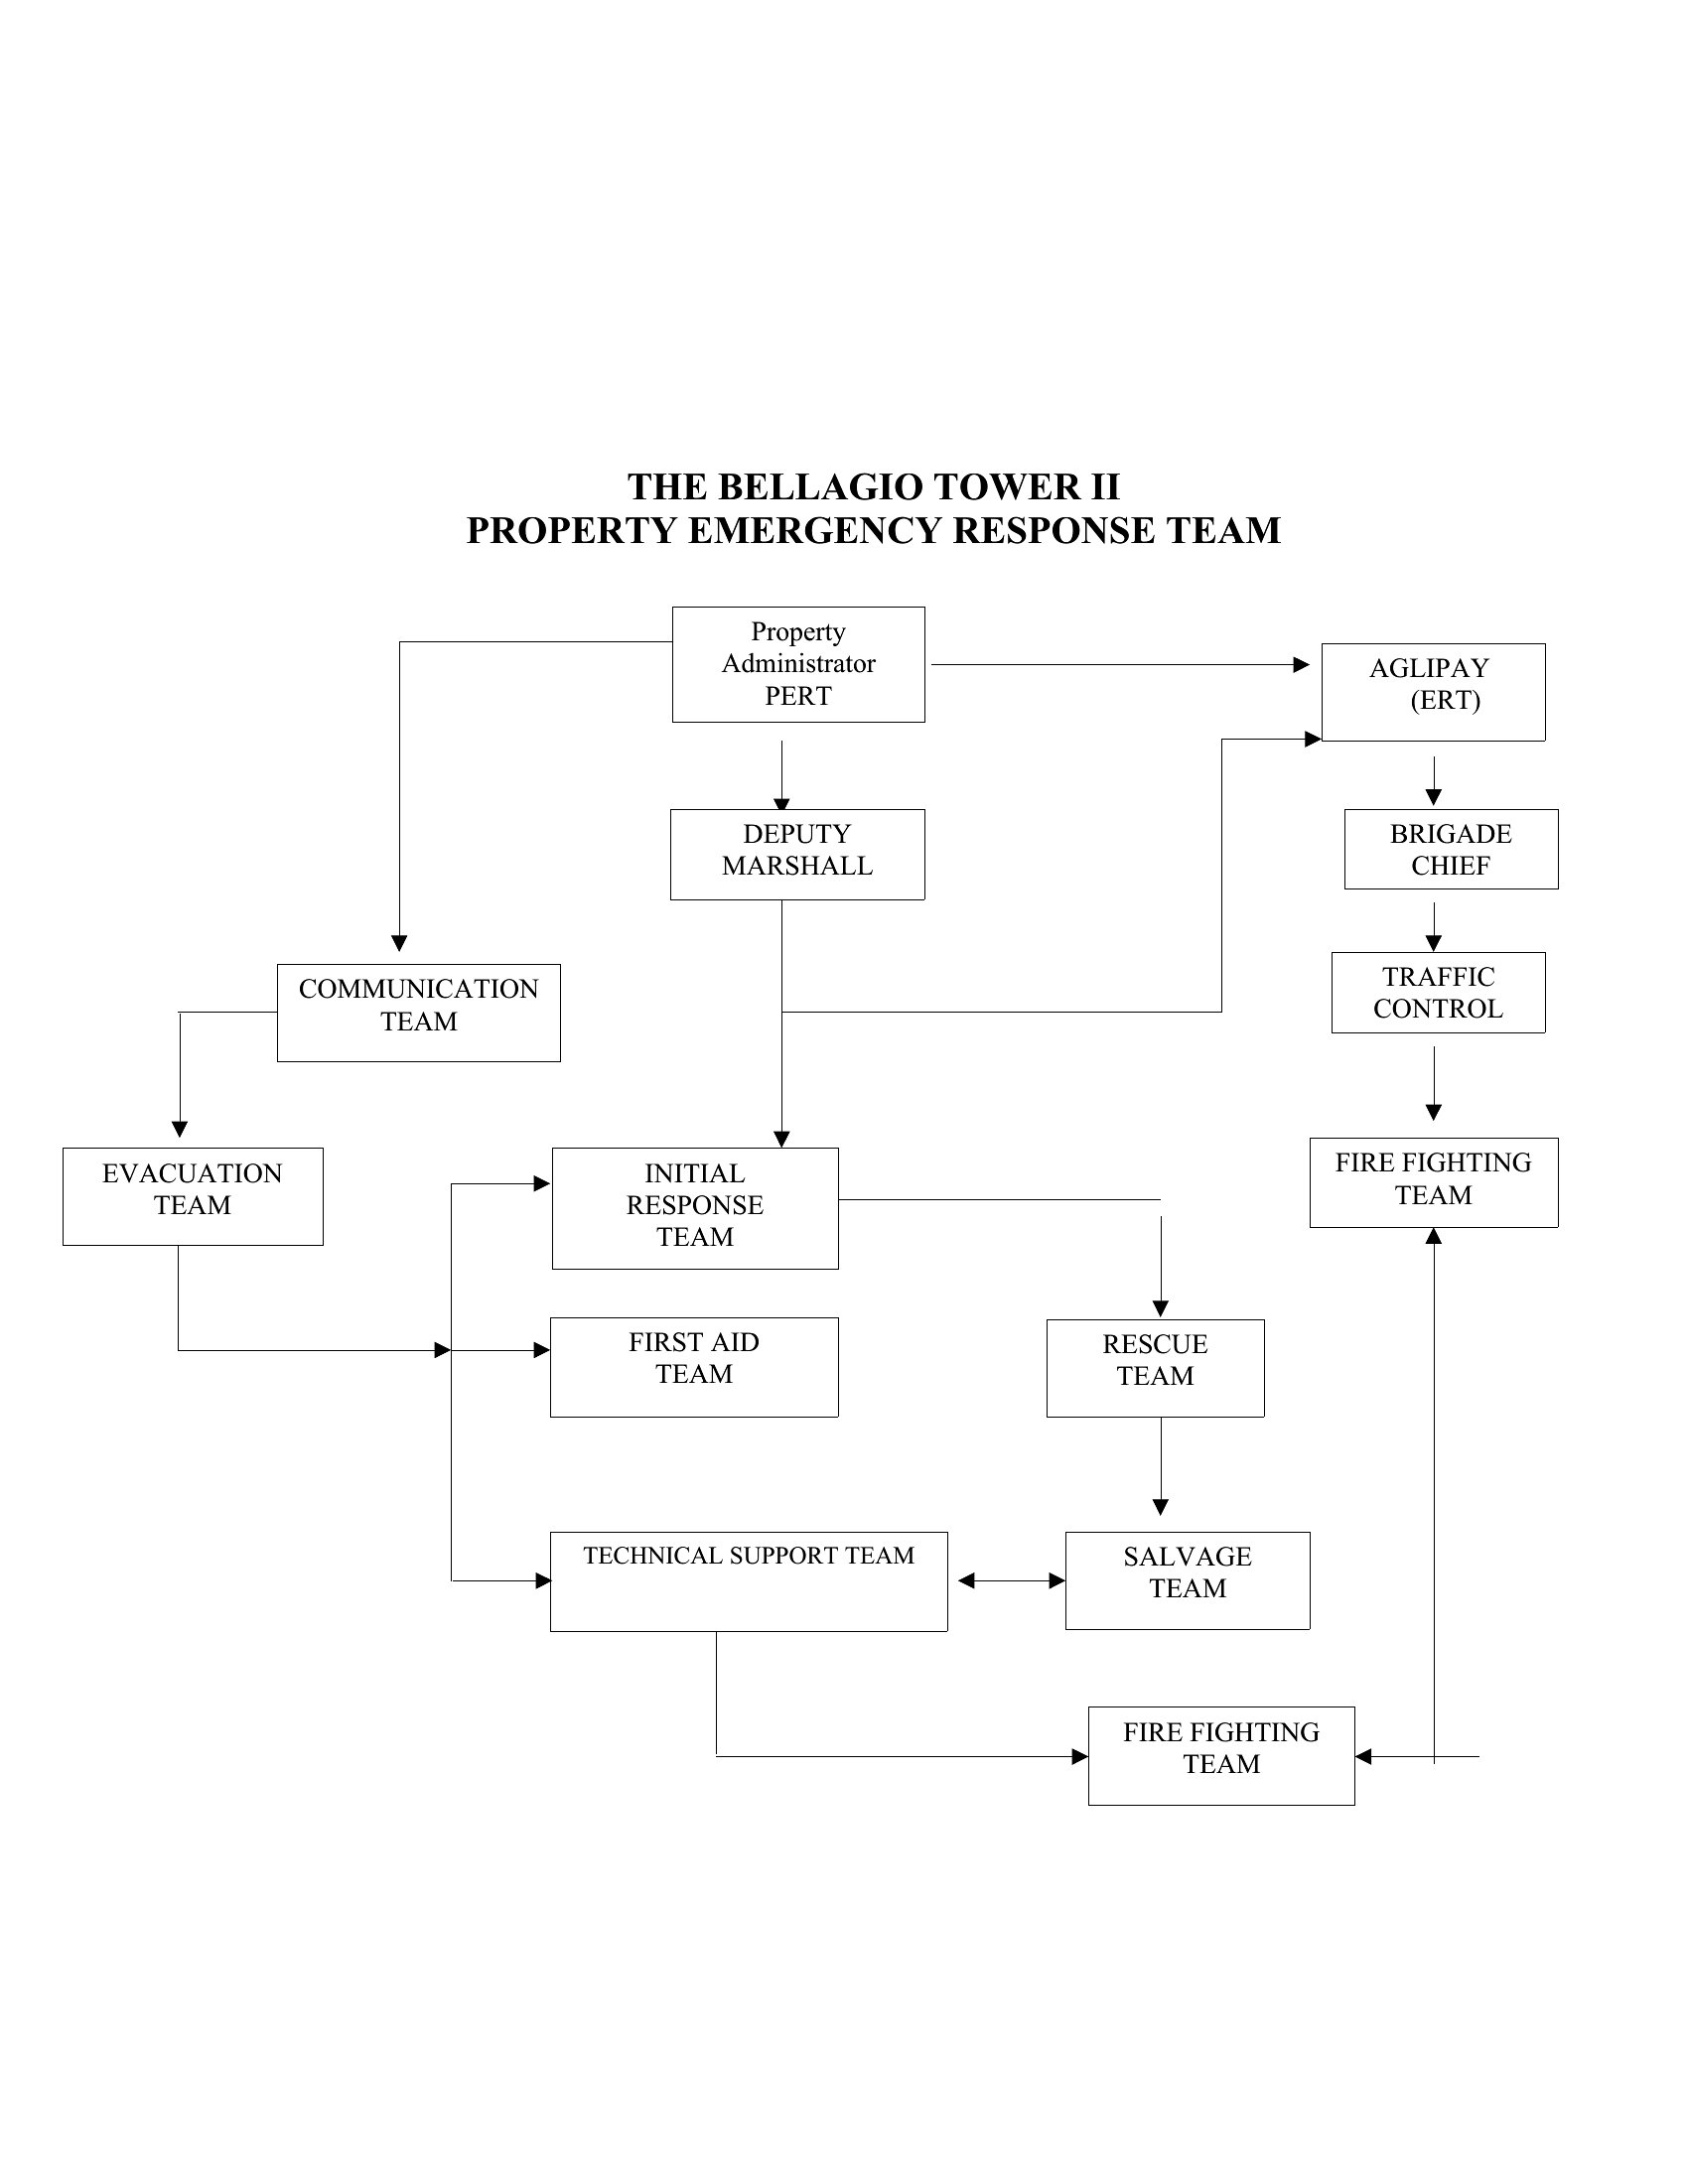
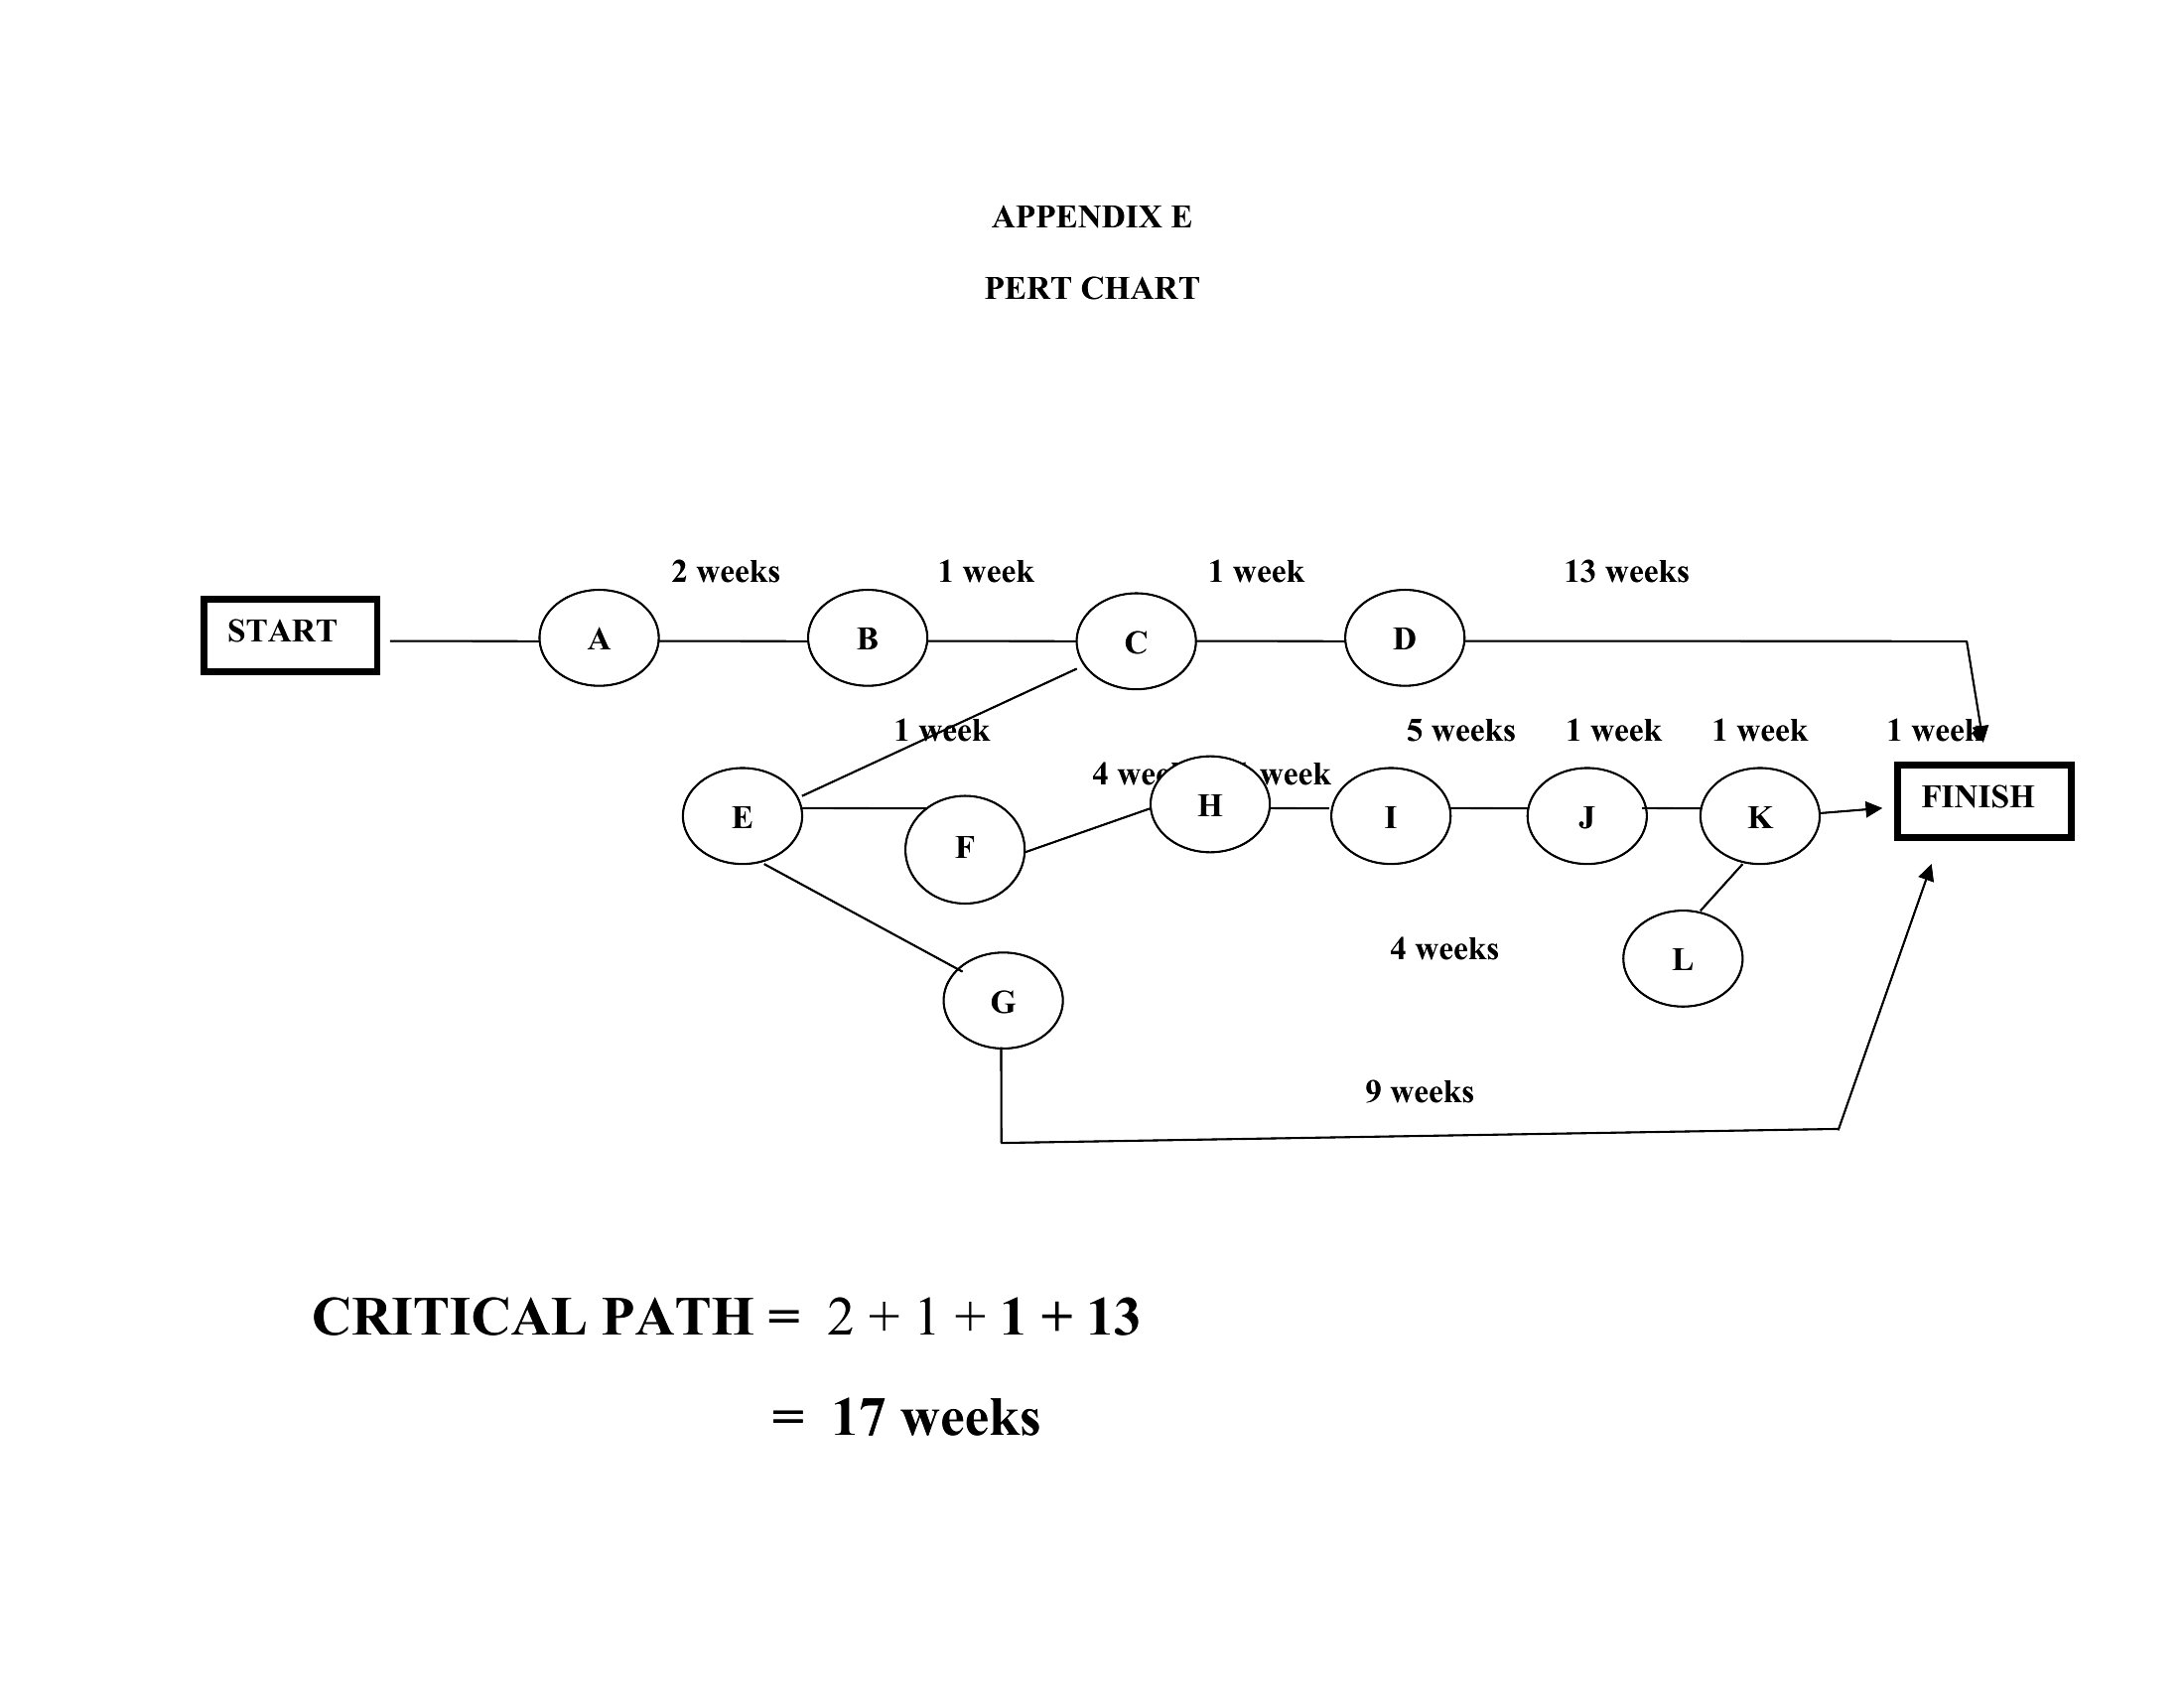
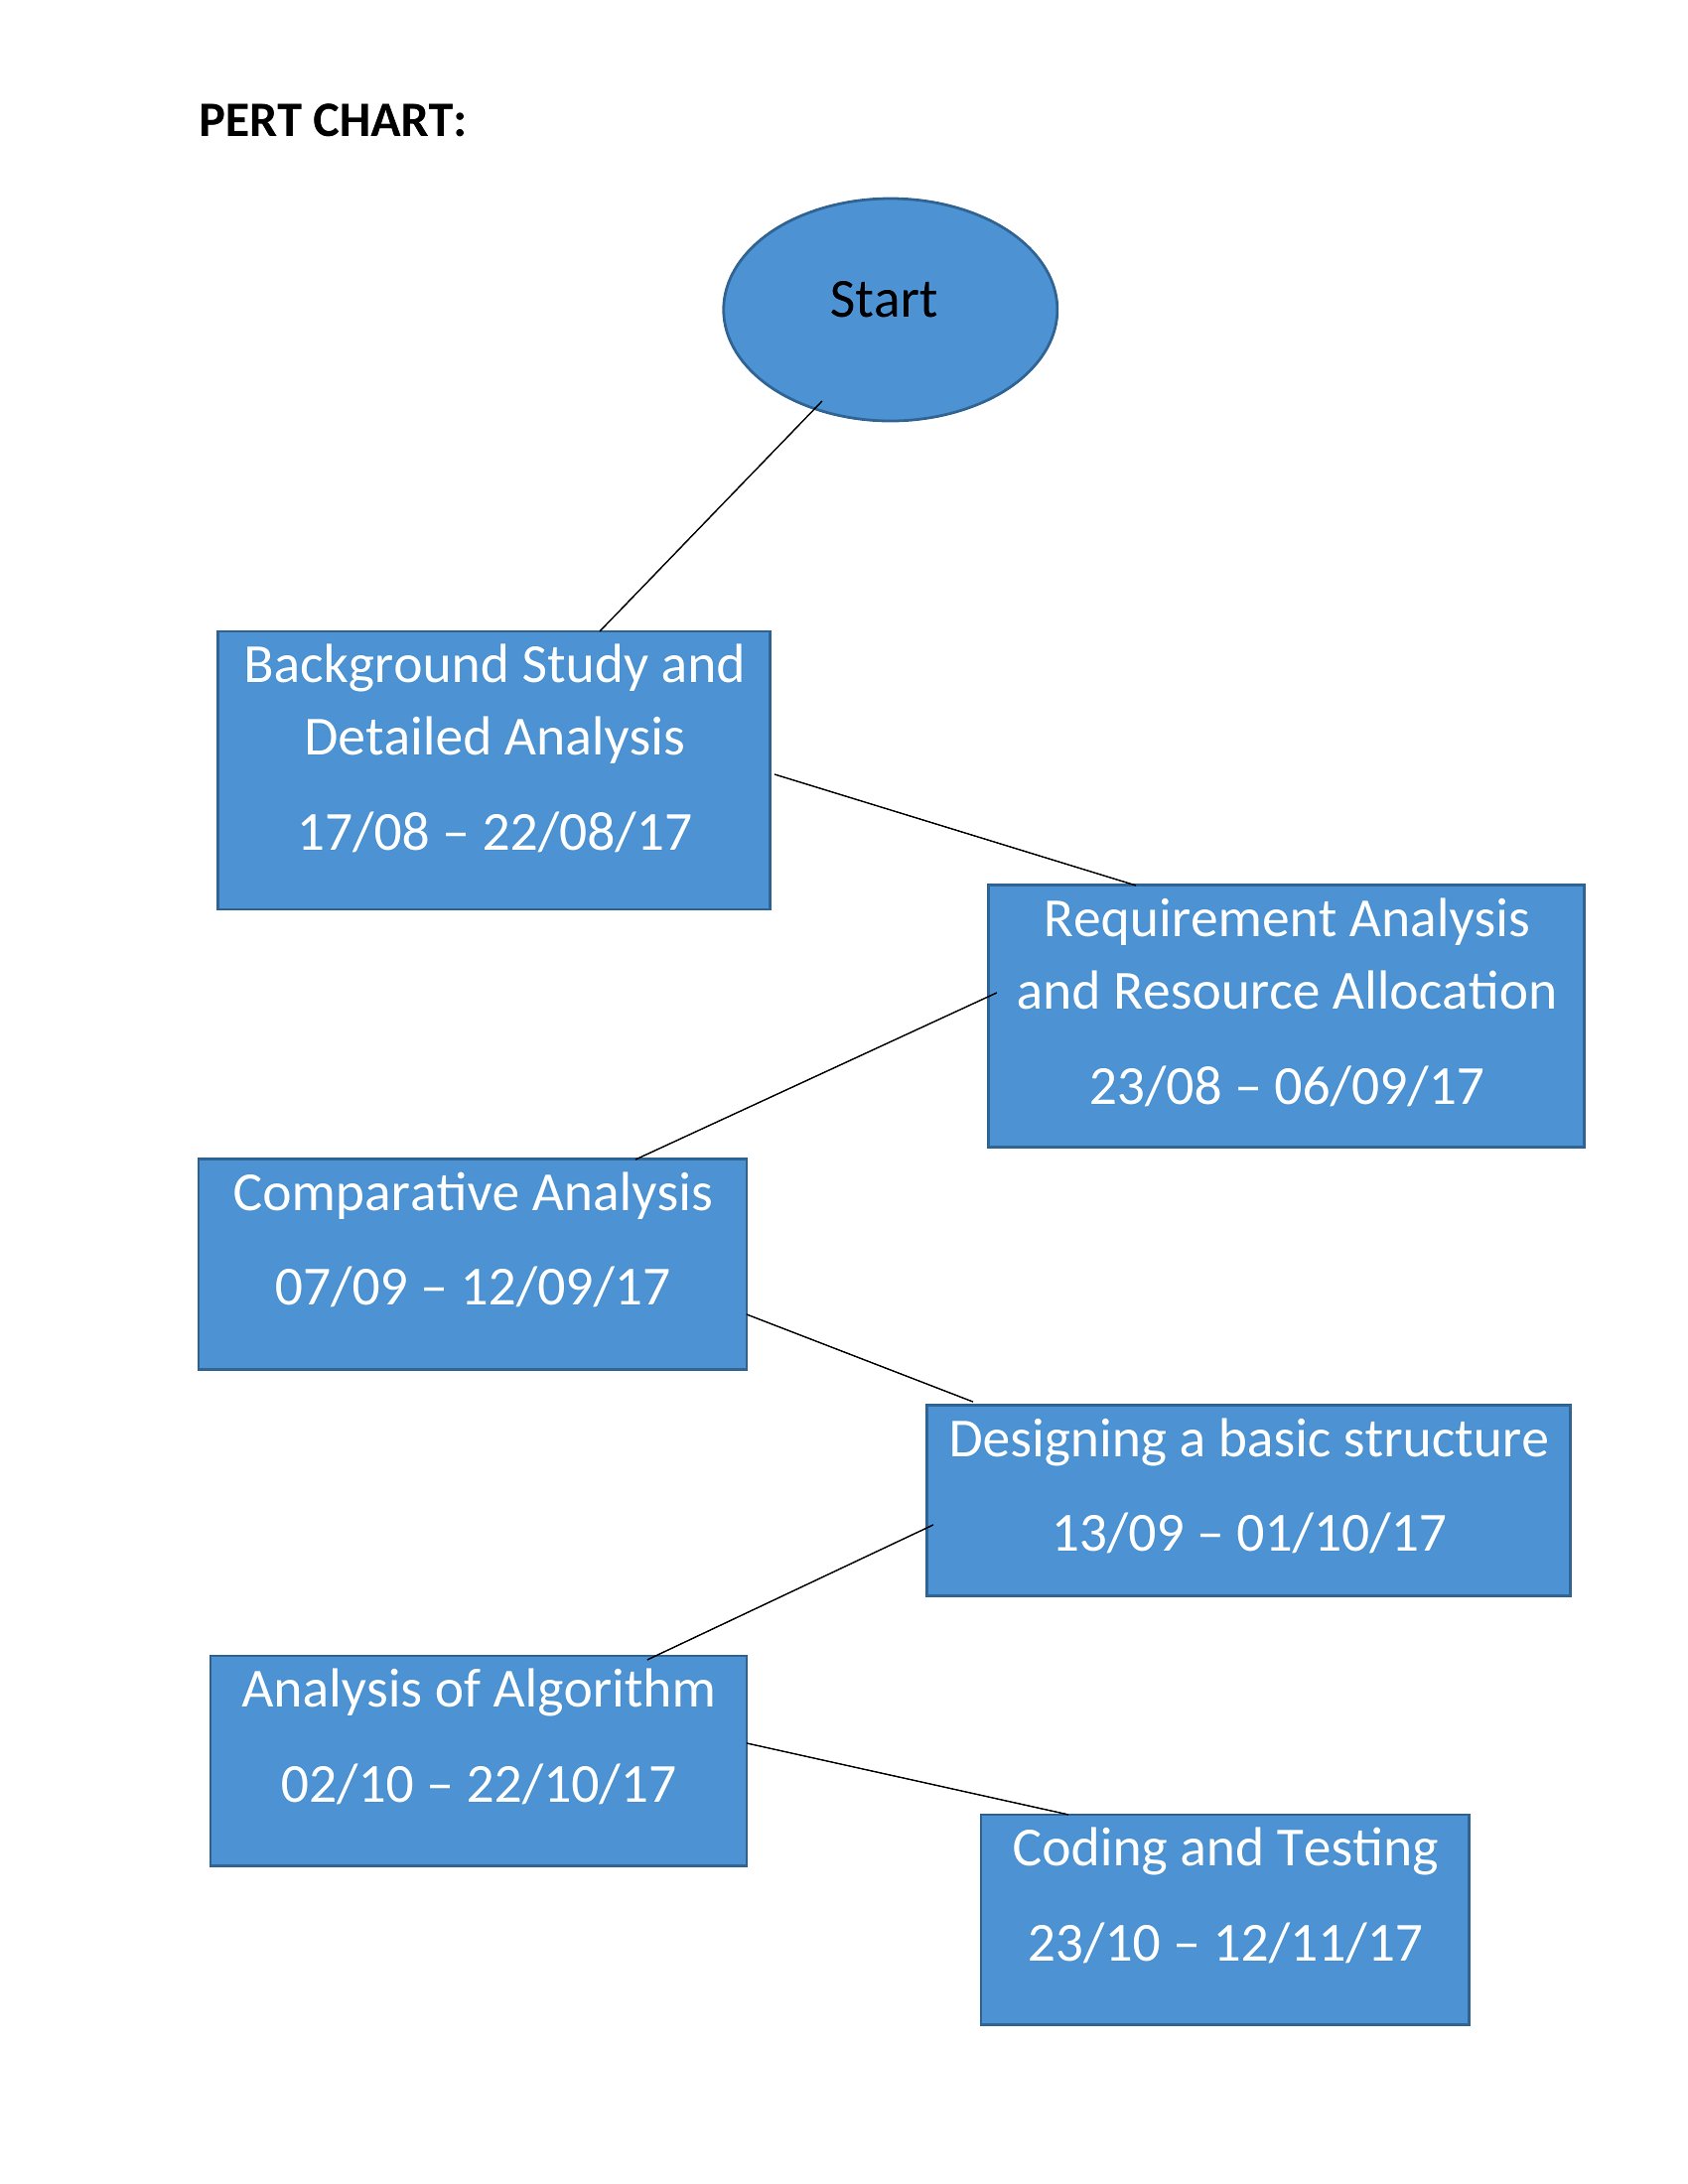
A PERT chart maps the tasks in a project and how they depend on one another, making it easier to spot the critical path and plan around it. This set of 26 templates helps you lay out activities, durations, and sequences without drawing boxes by hand. Project managers, engineers, and students use them to schedule work and estimate timelines.
You'll find editable Word and Excel versions plus print-ready PDFs, so you can add tasks, link dependencies, and adjust estimates as the plan firms up. Fill in your activities, connect the nodes, and read off the longest path to completion. Pick the format that fits your project and start charting the workflow.
Choose from 26 PERT Chart Templates
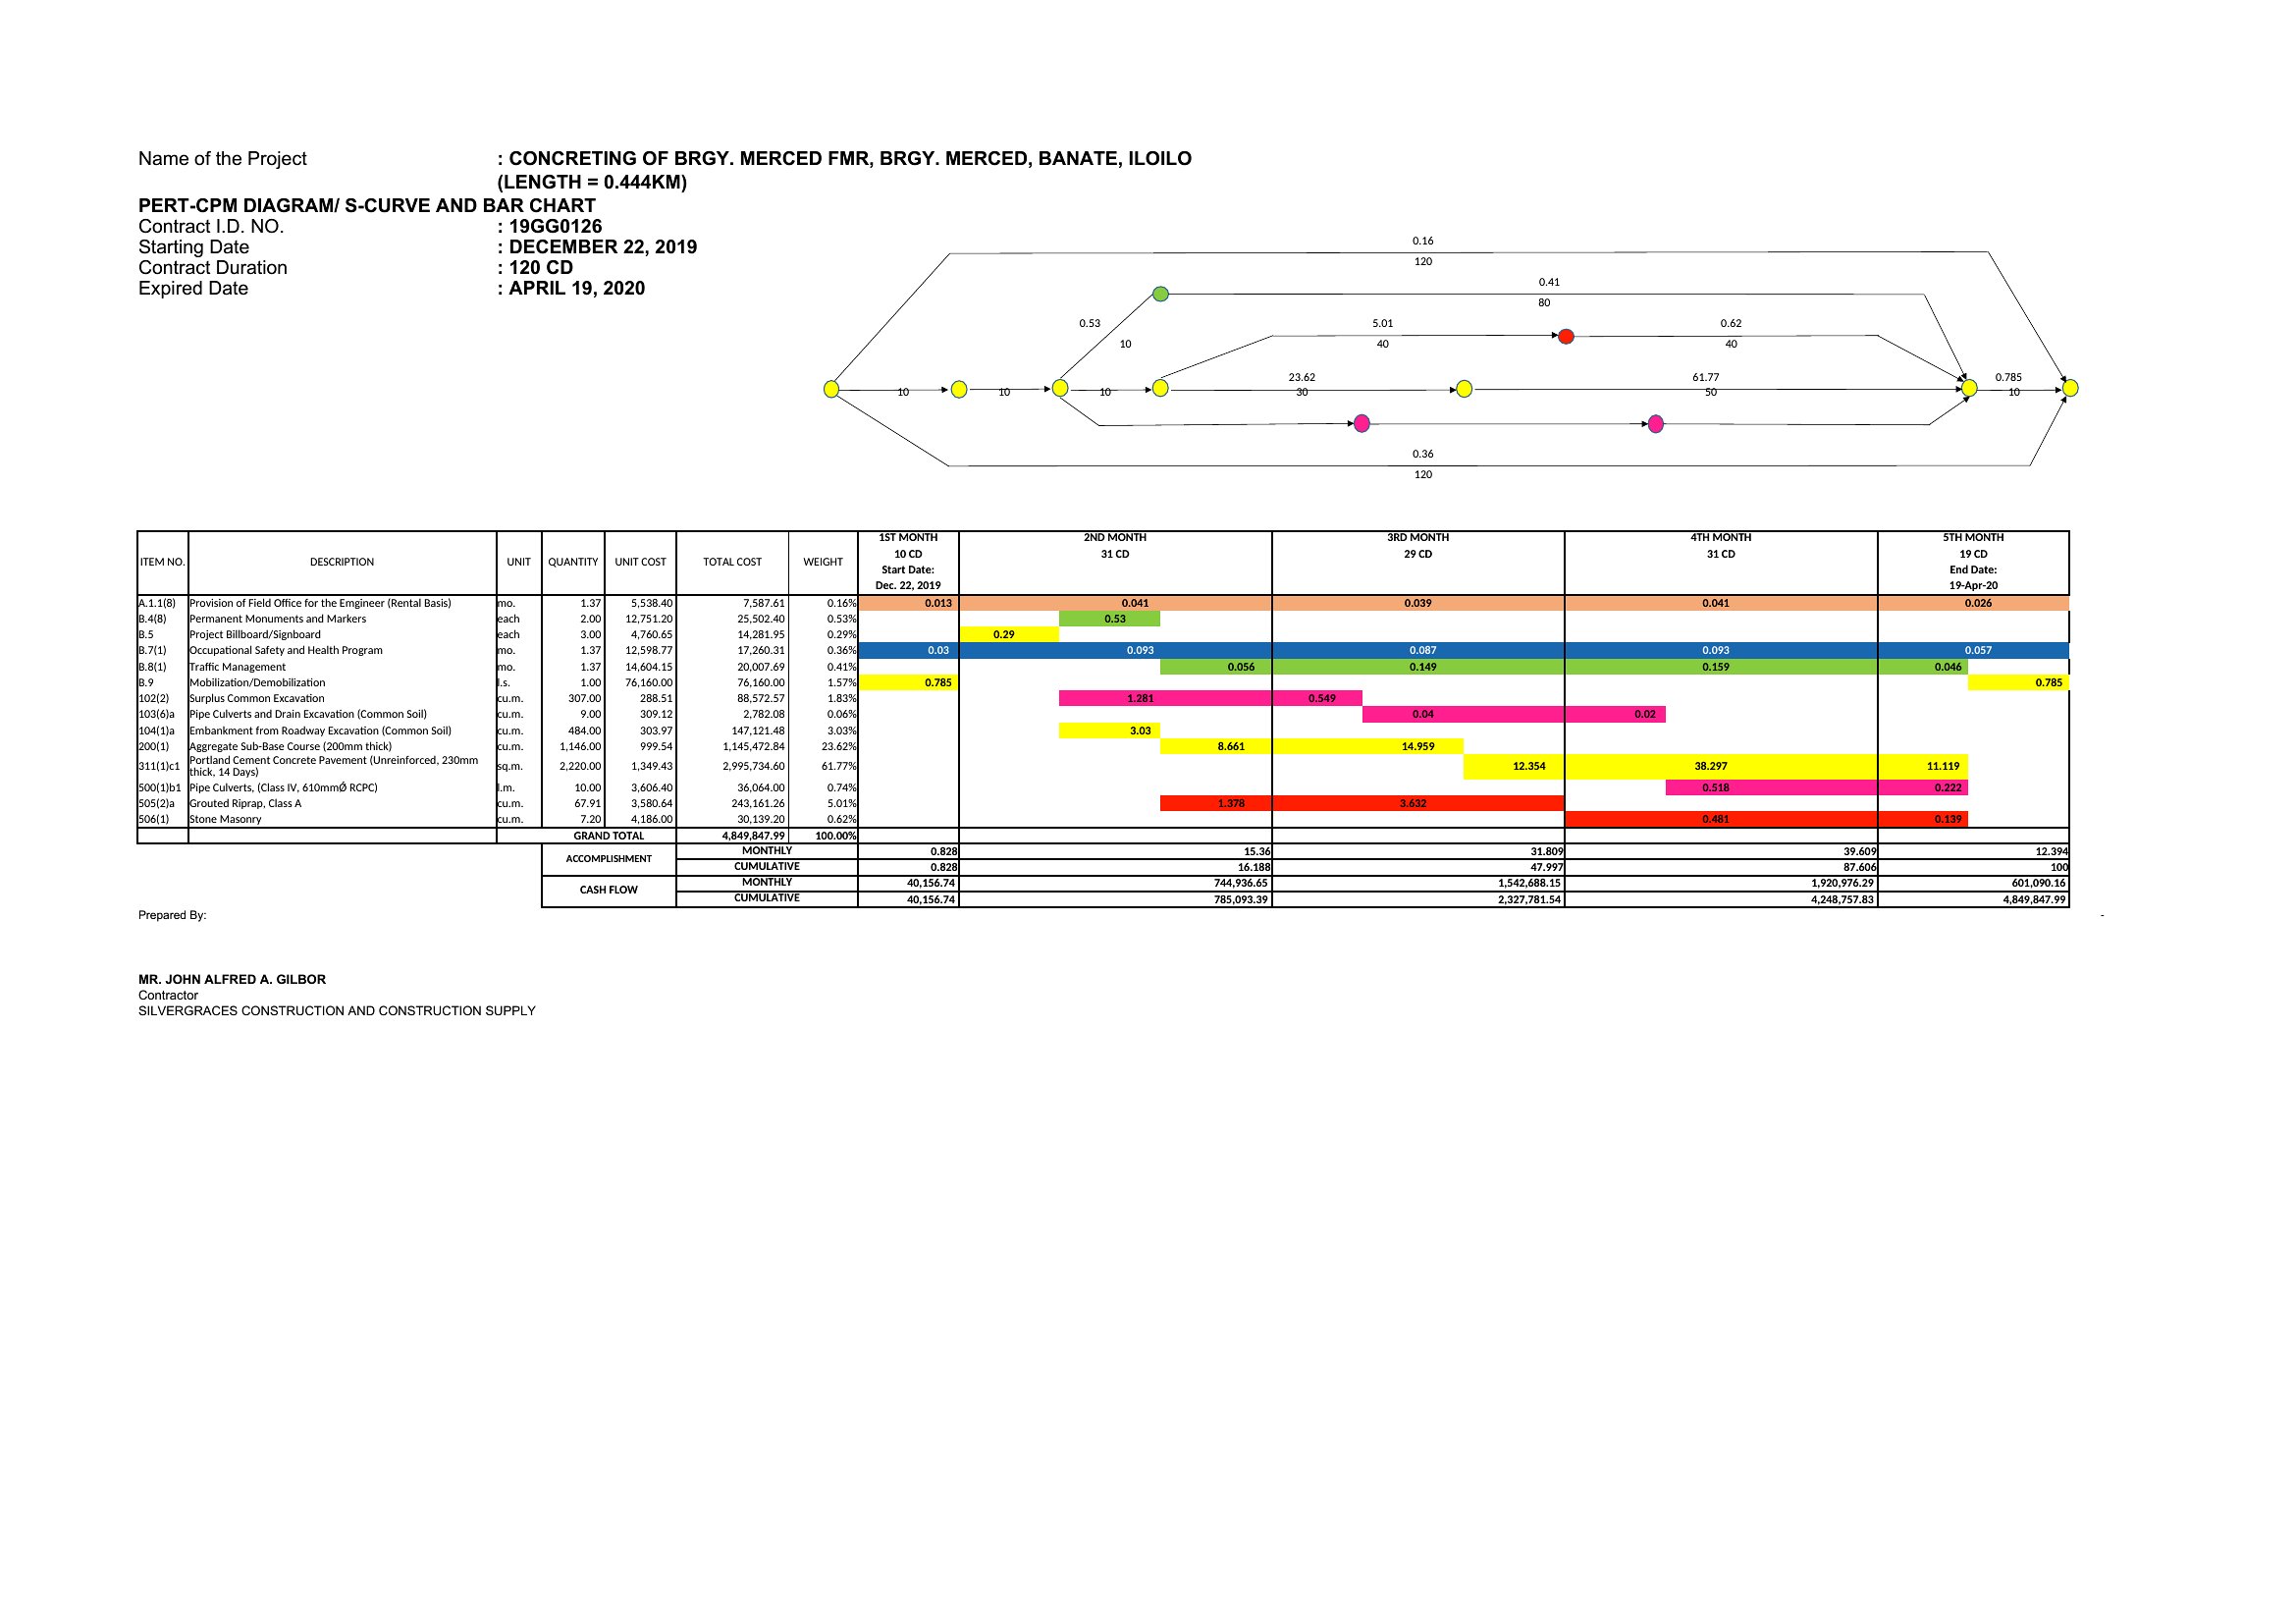
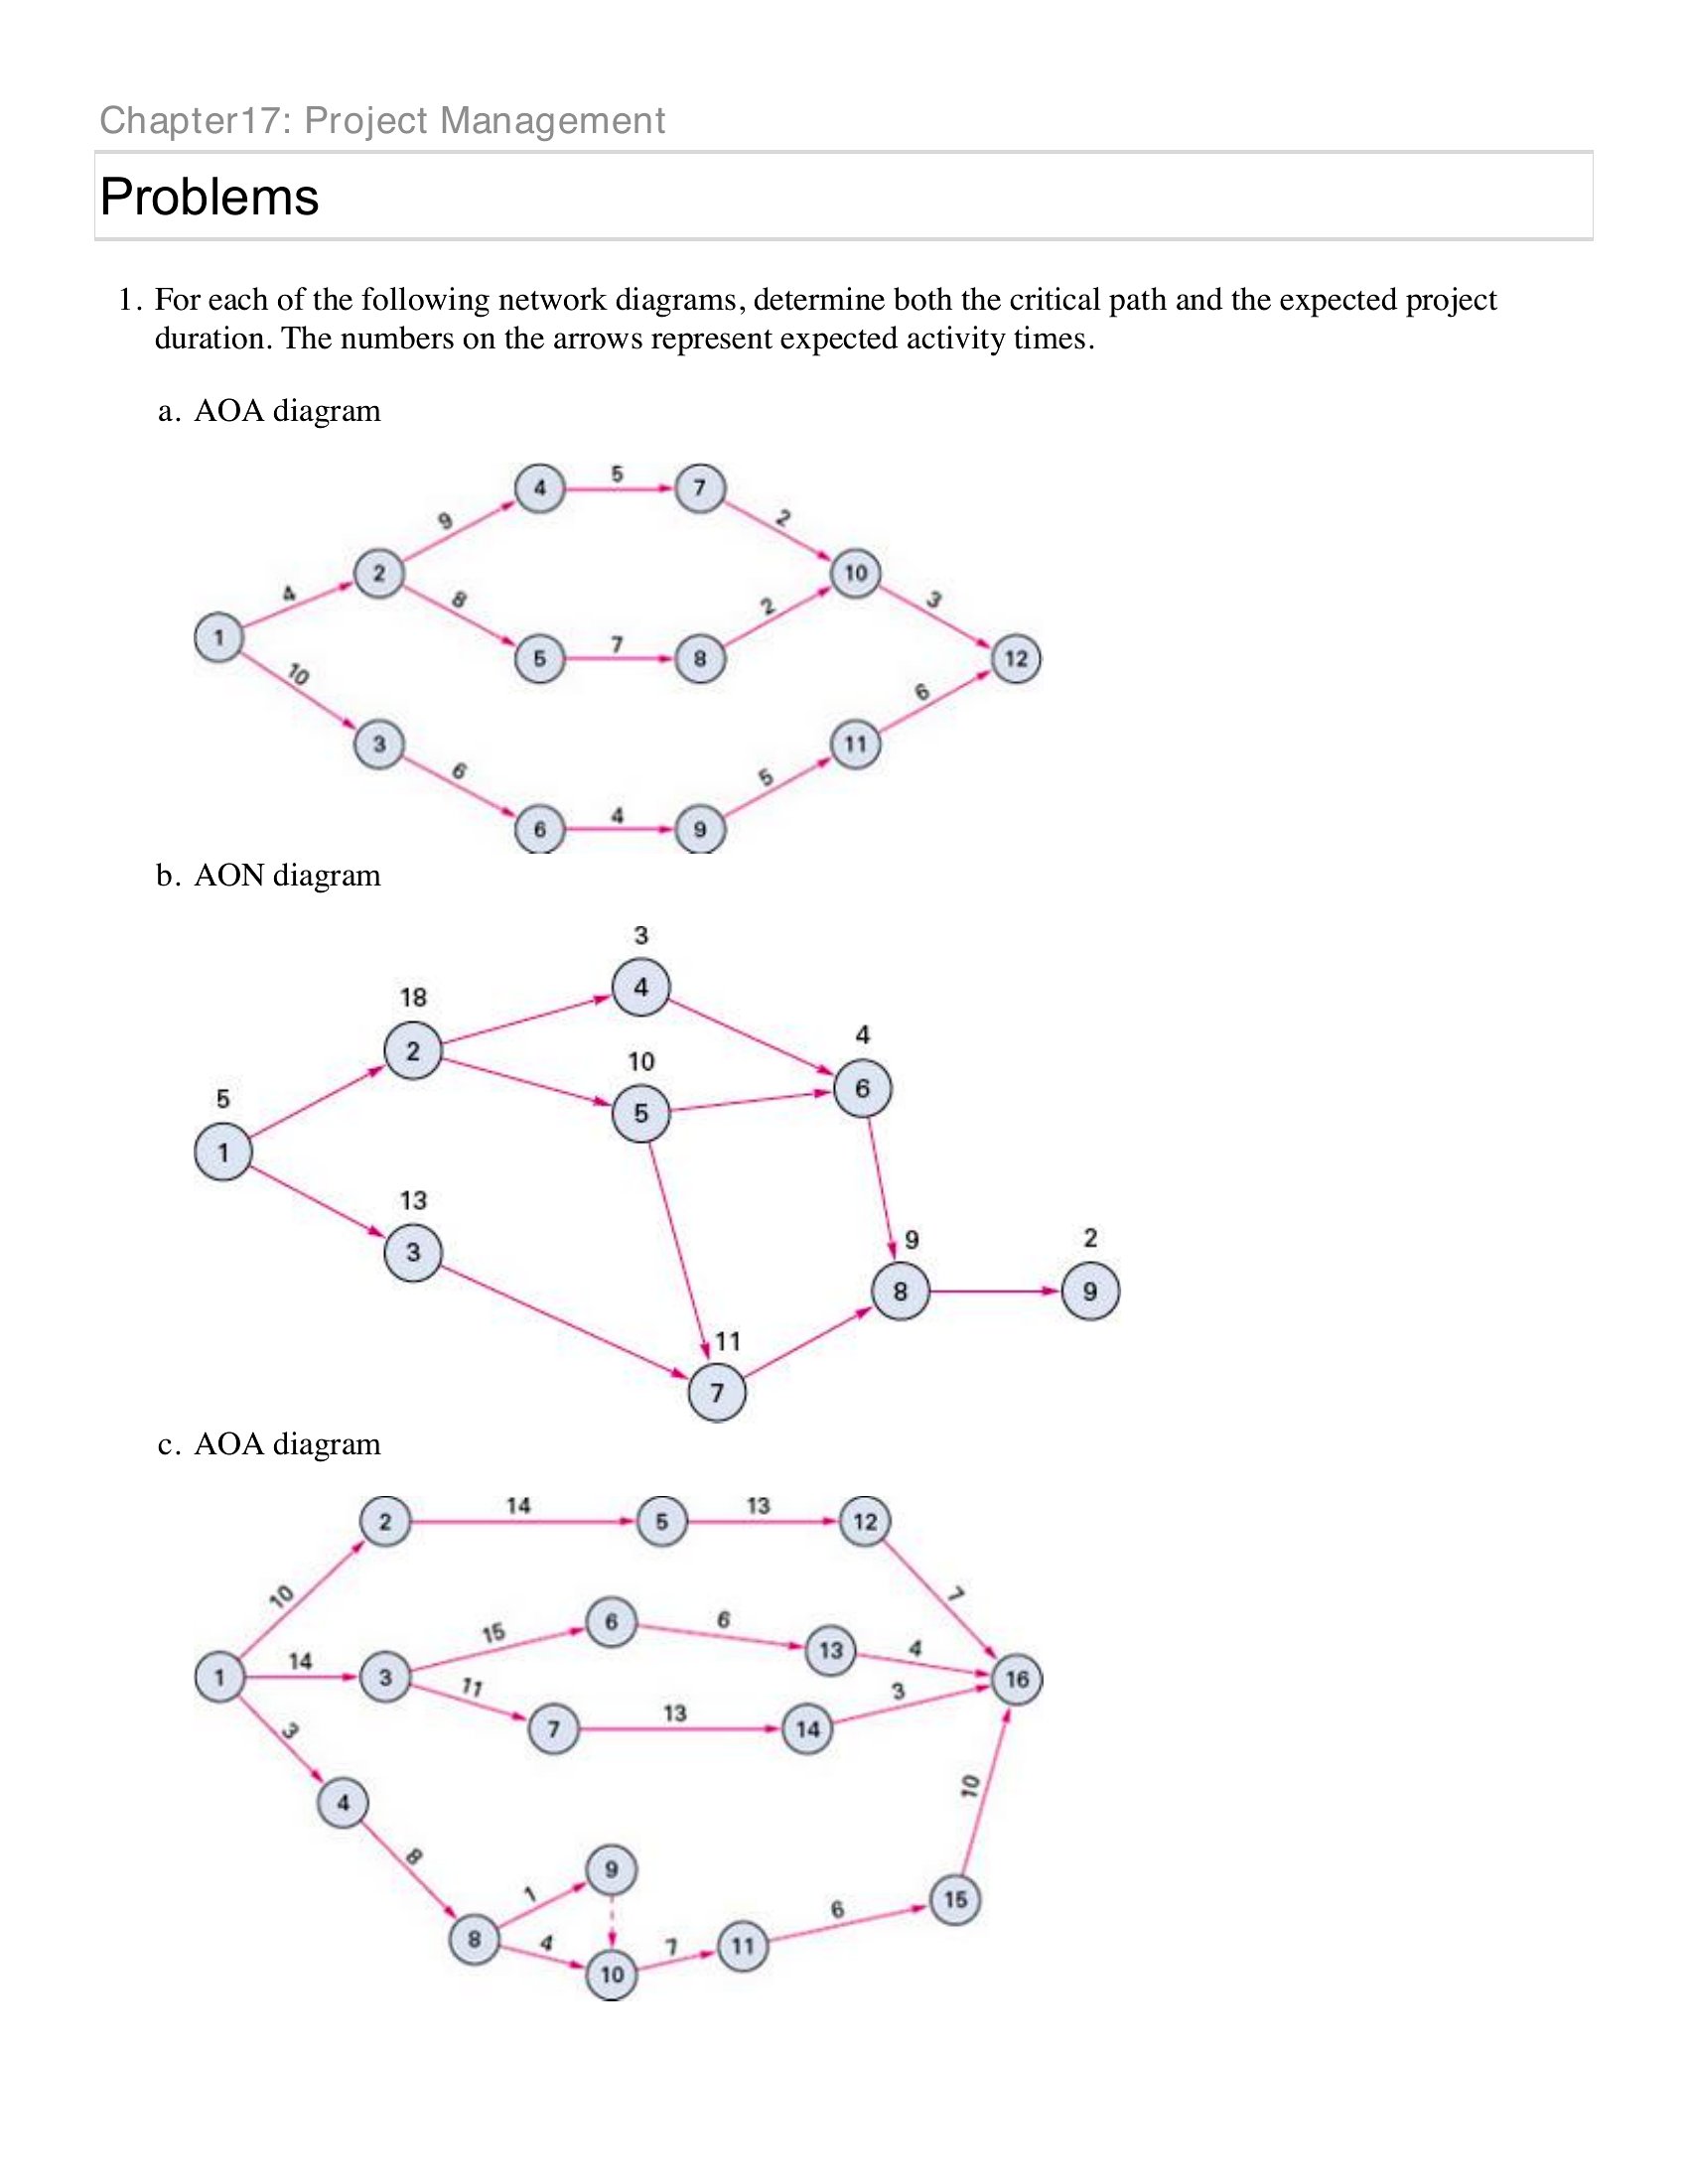
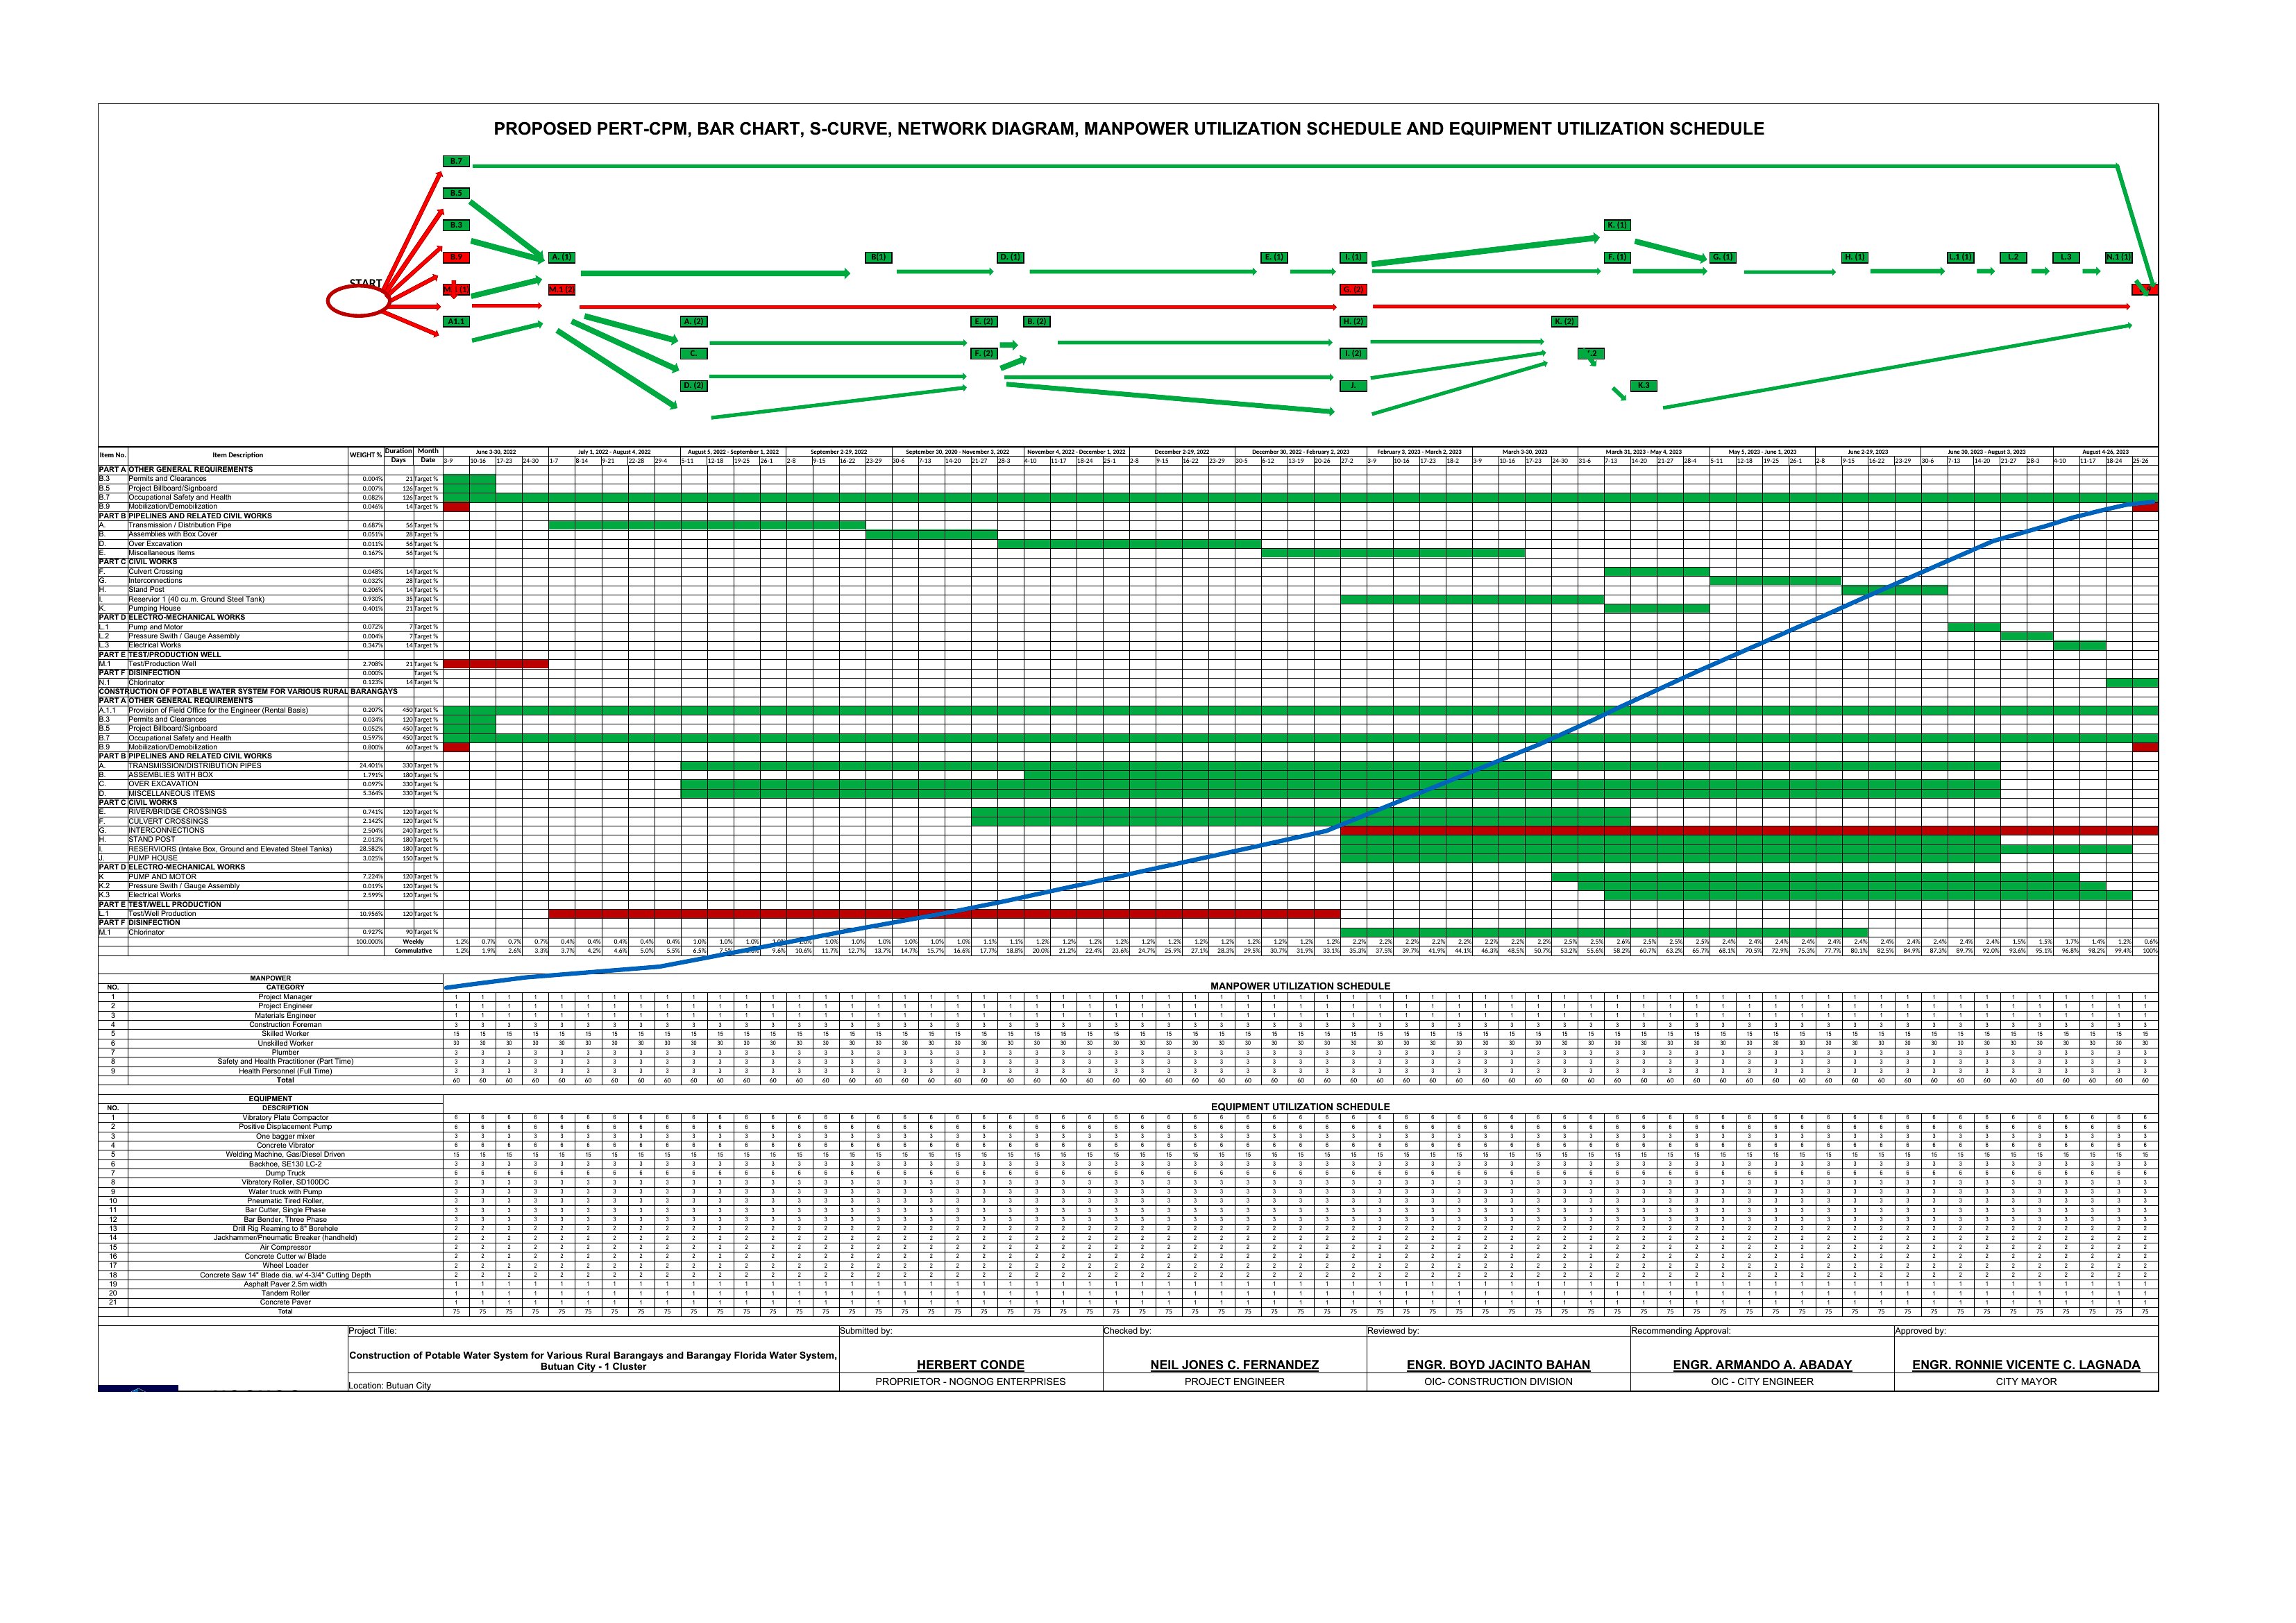
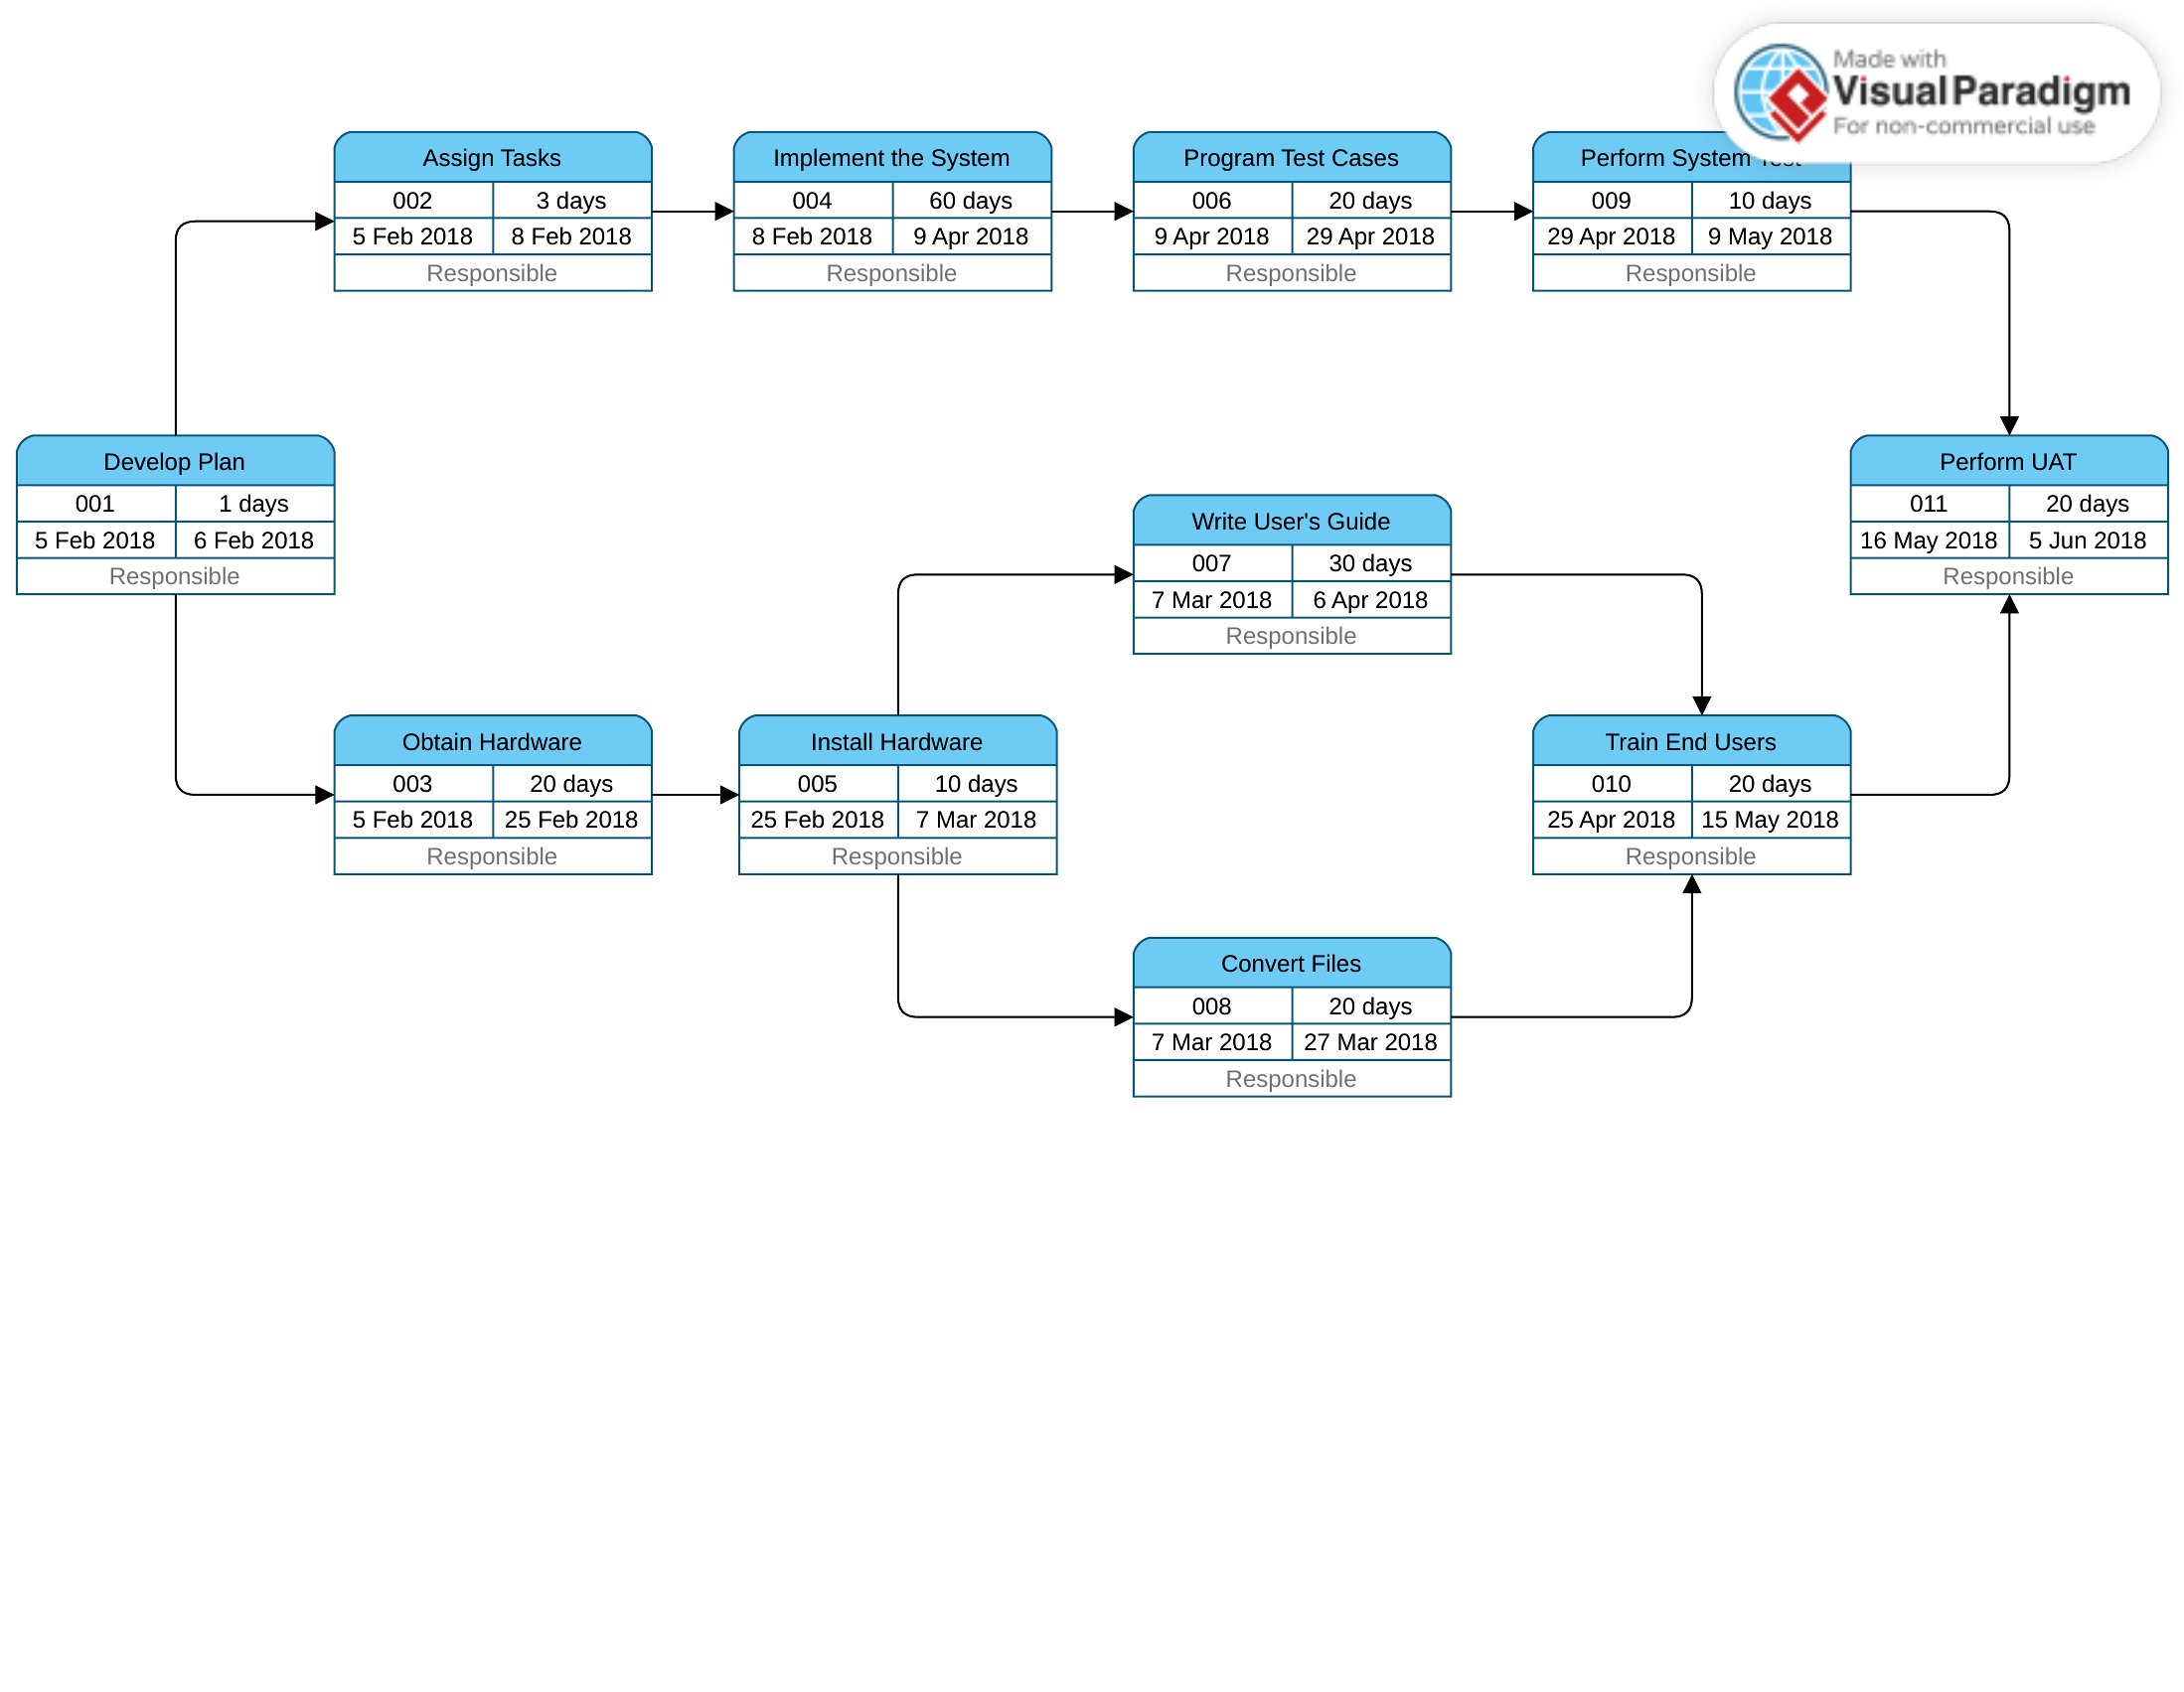
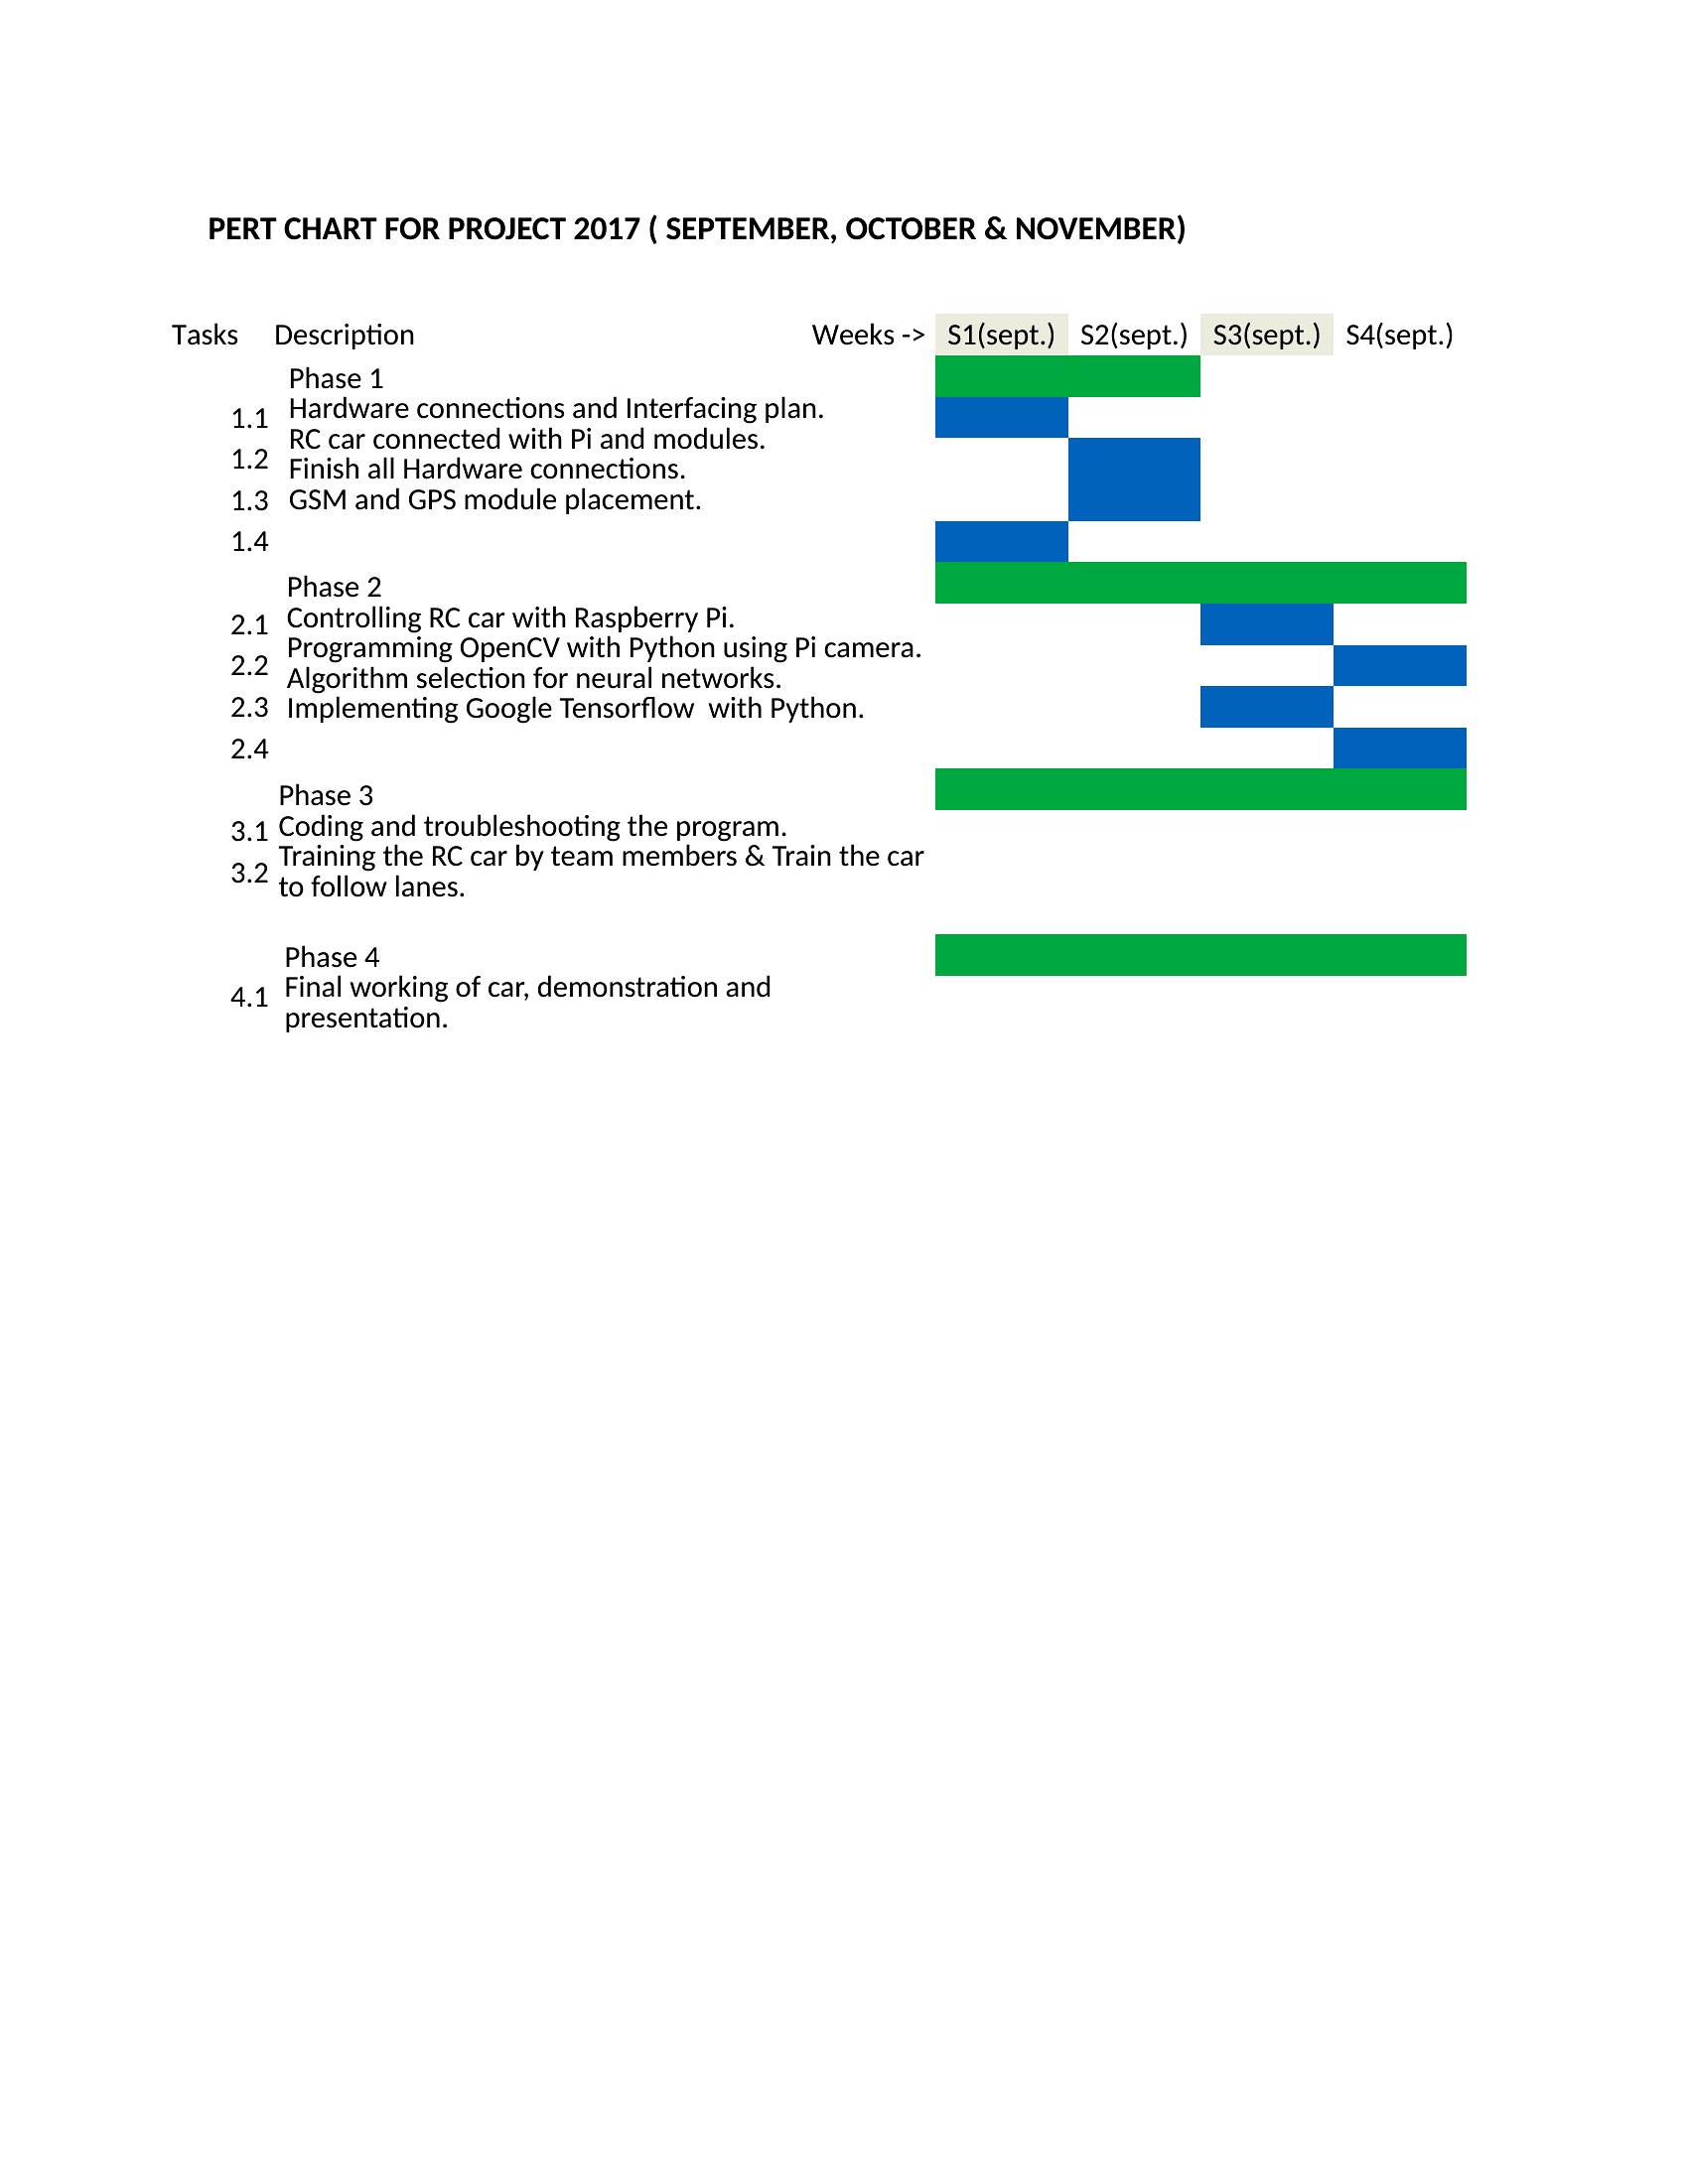
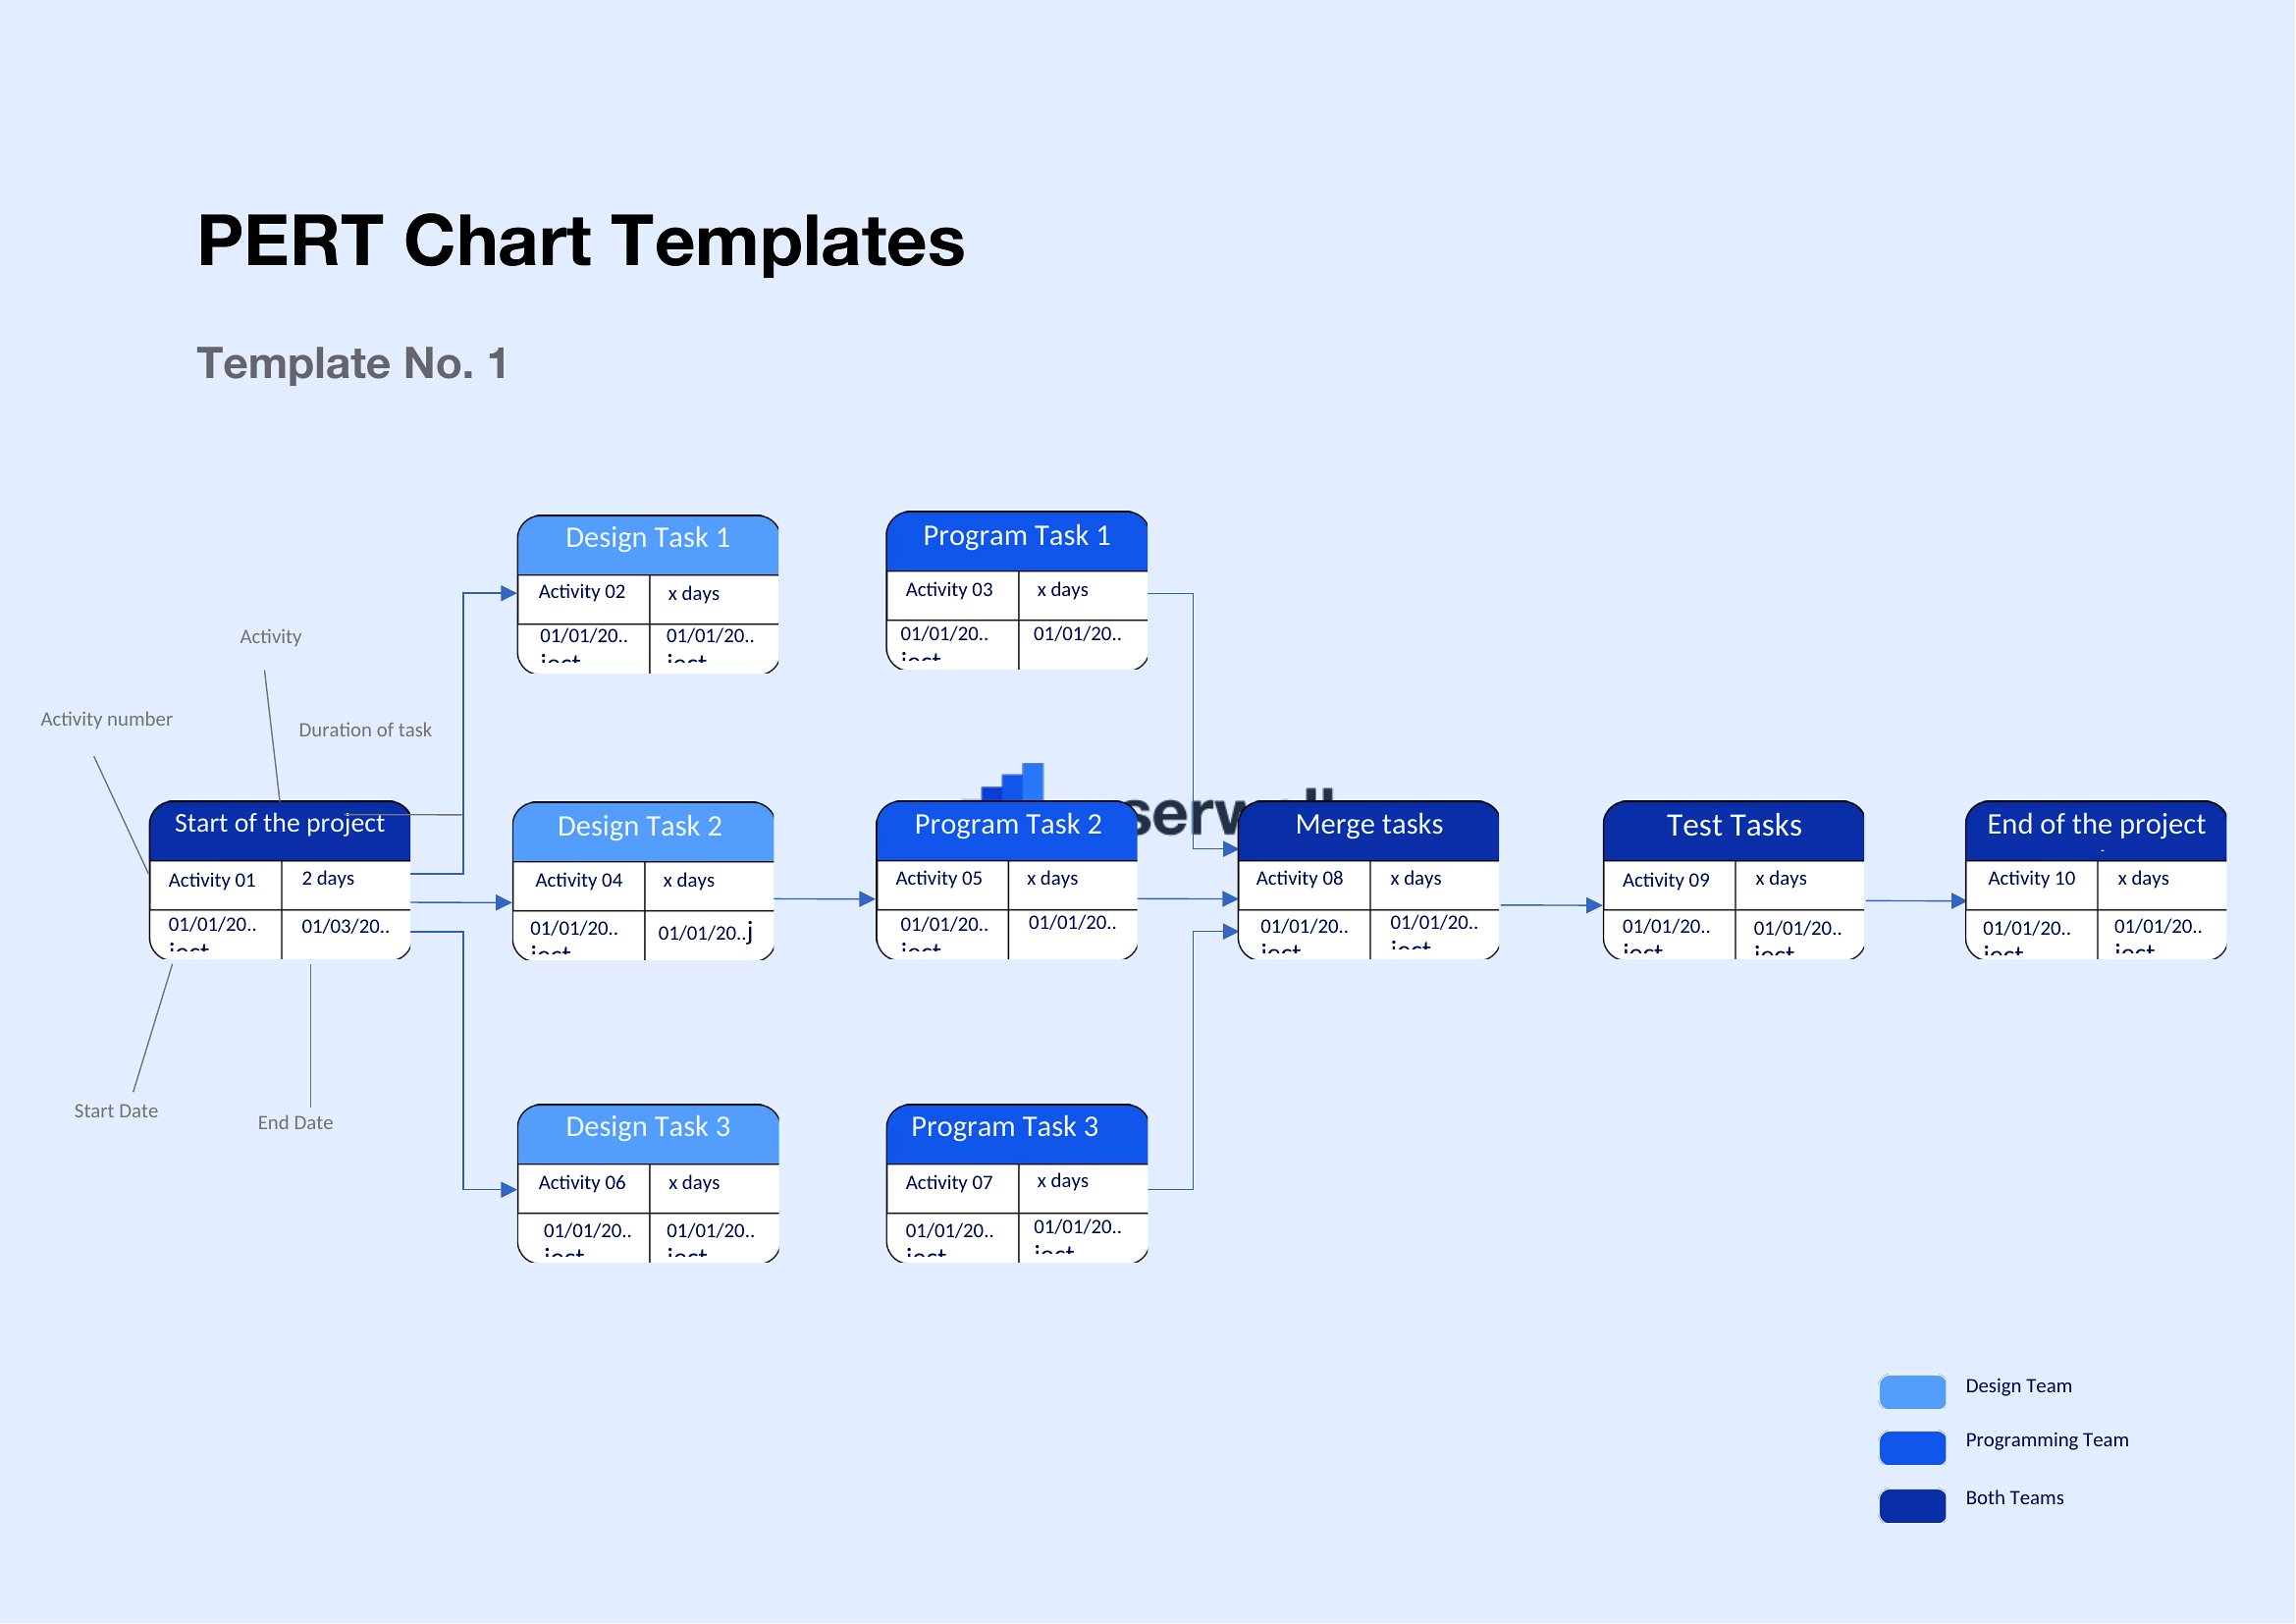
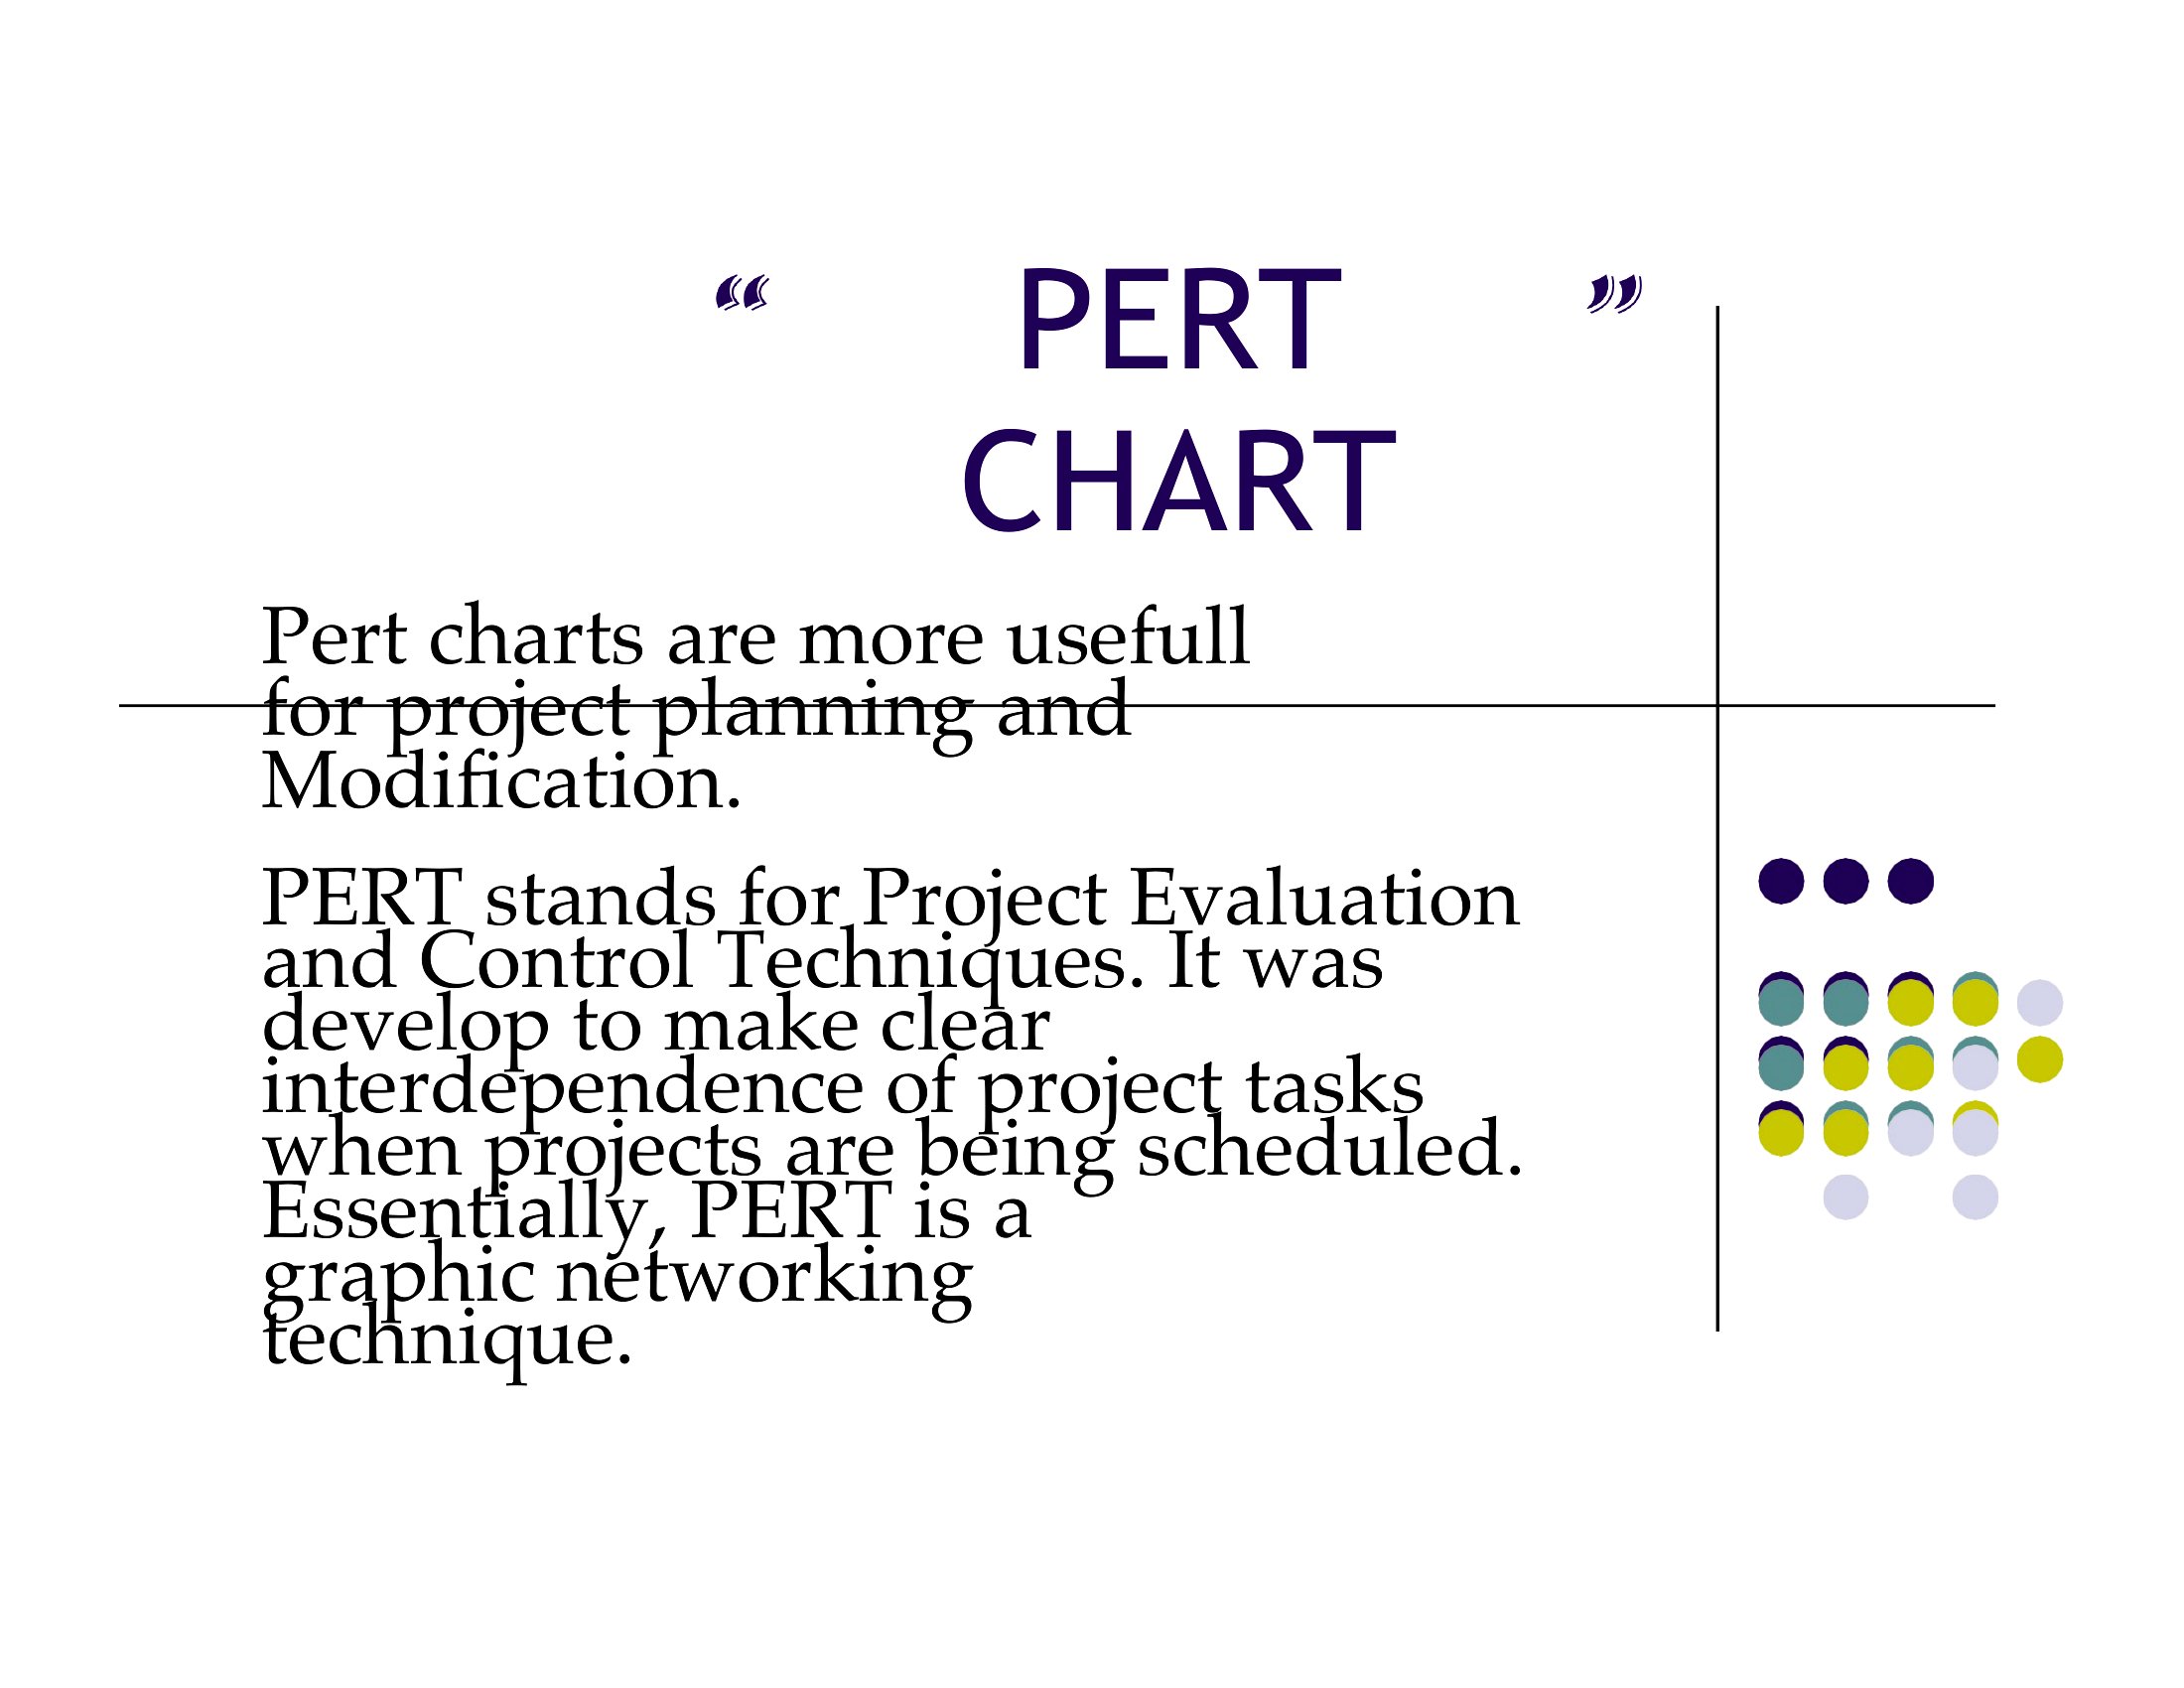
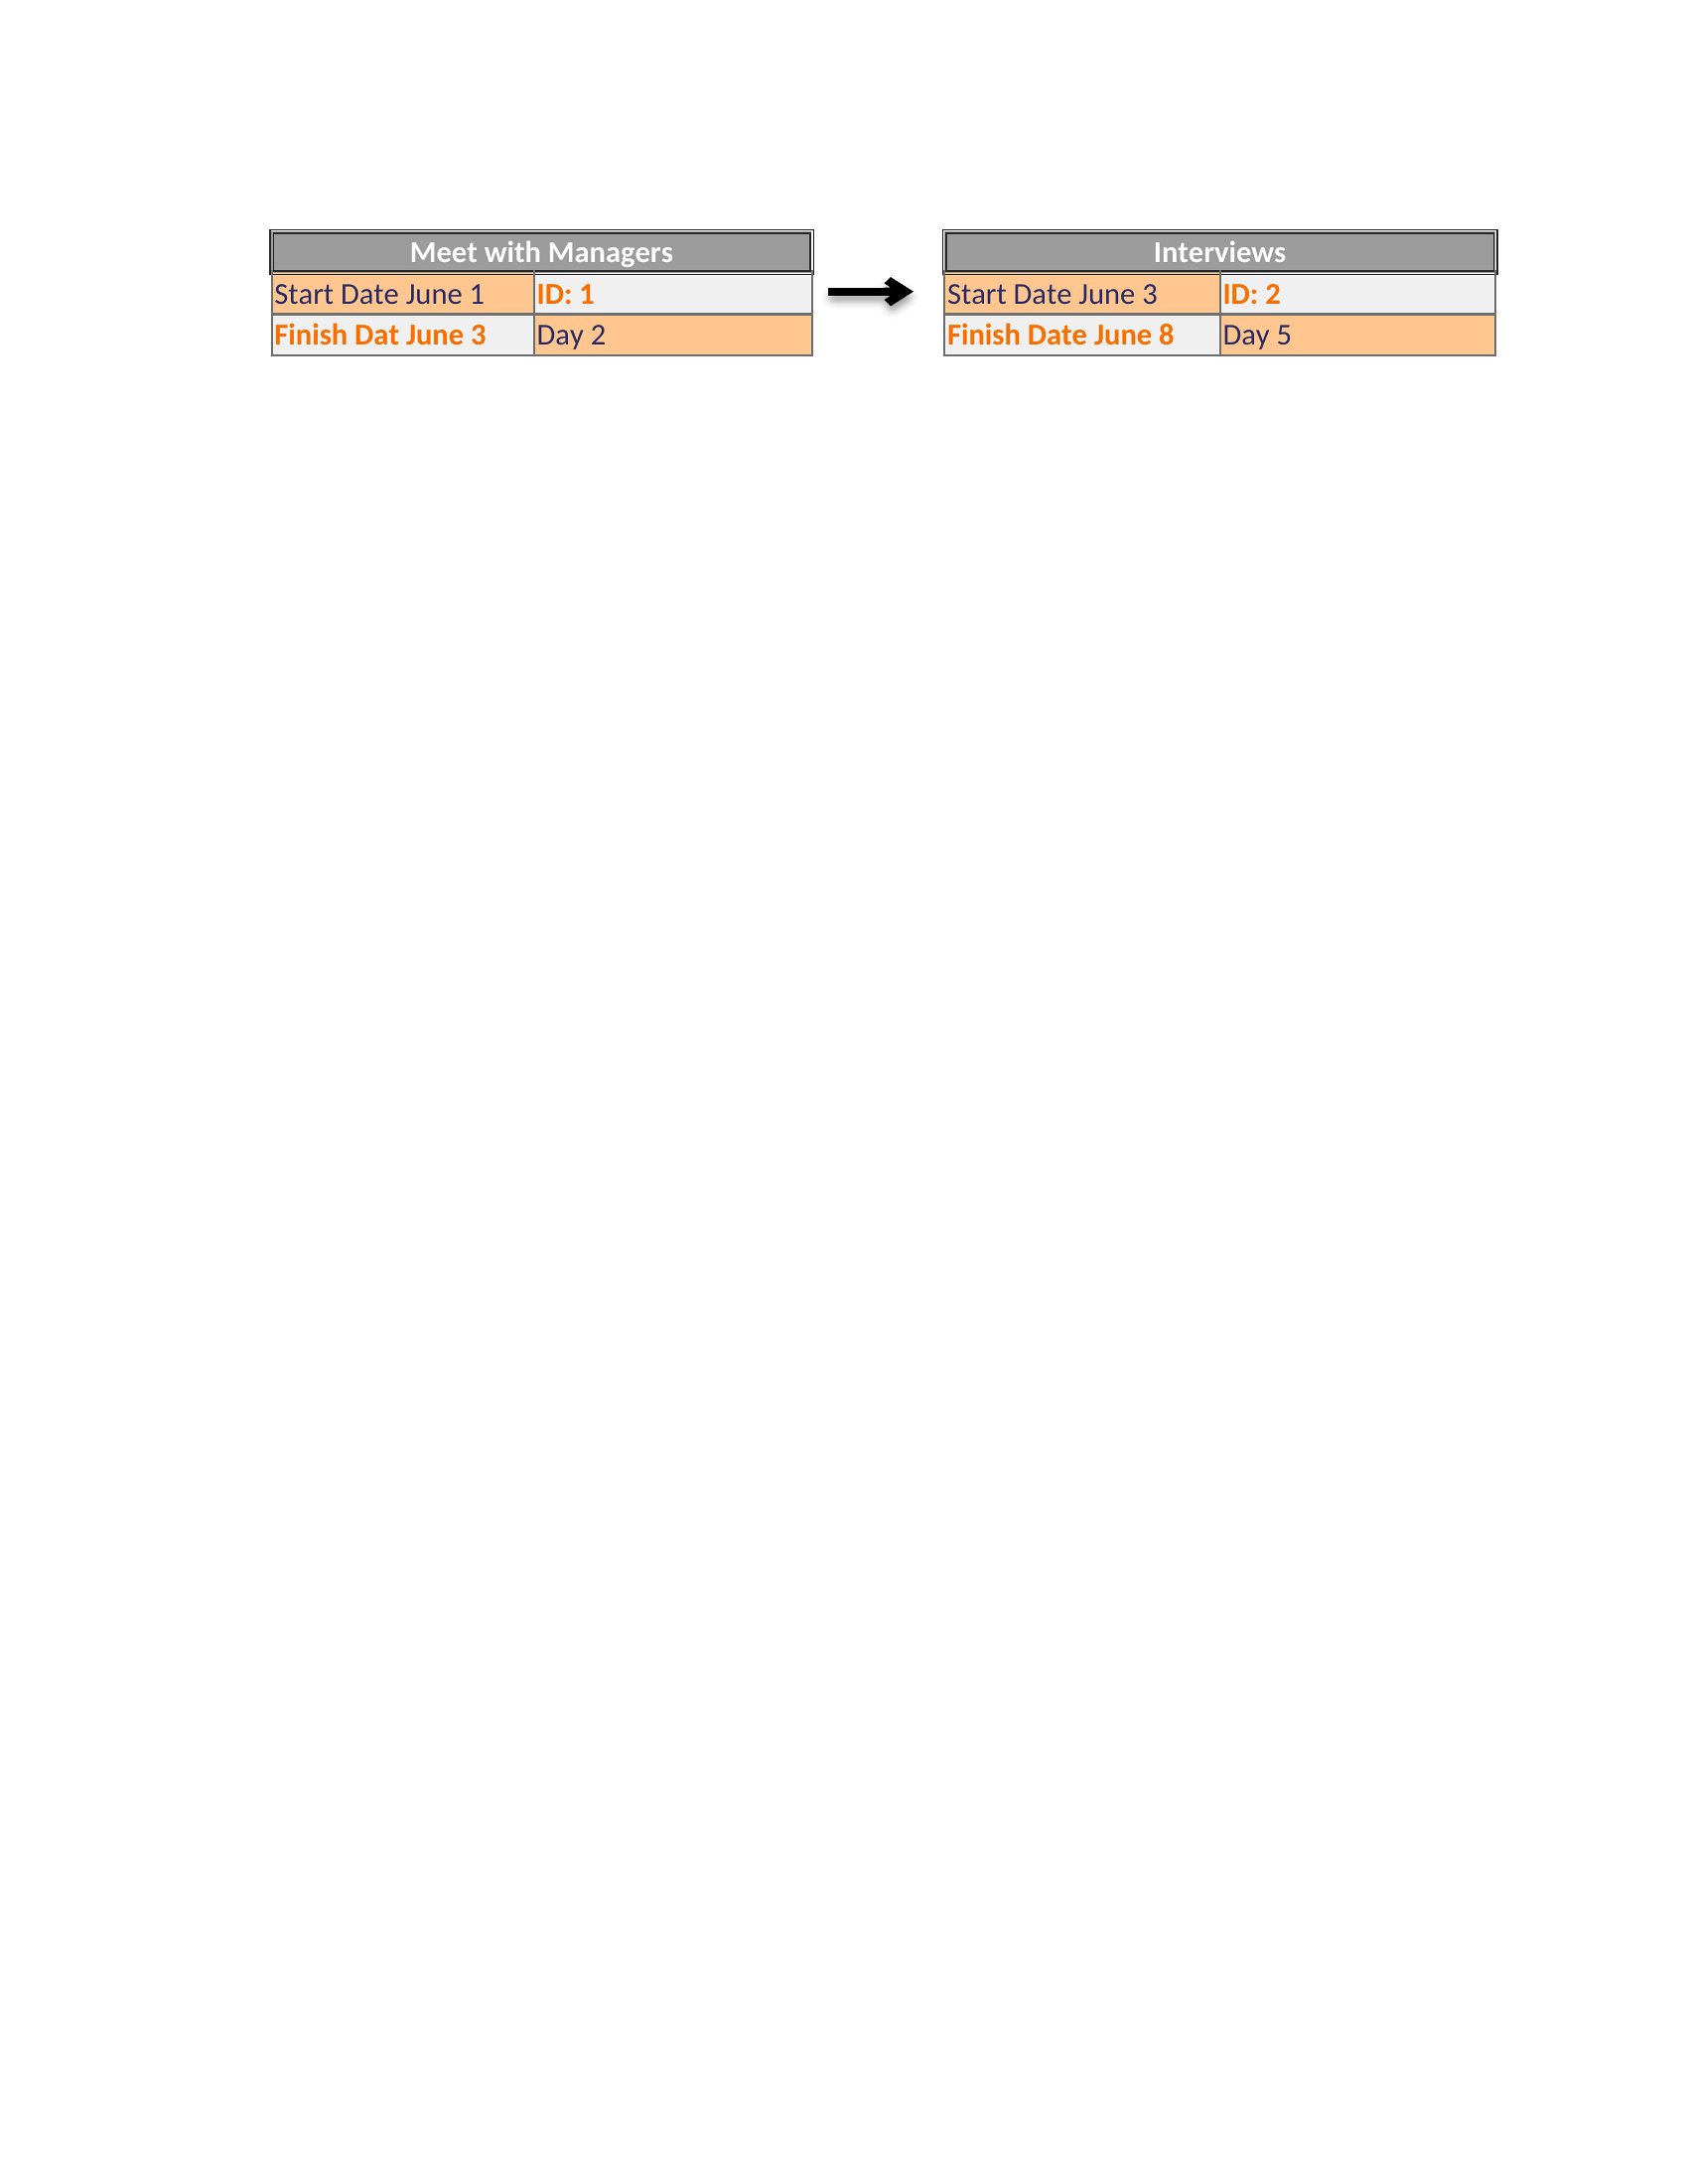
Editable Pert Chart
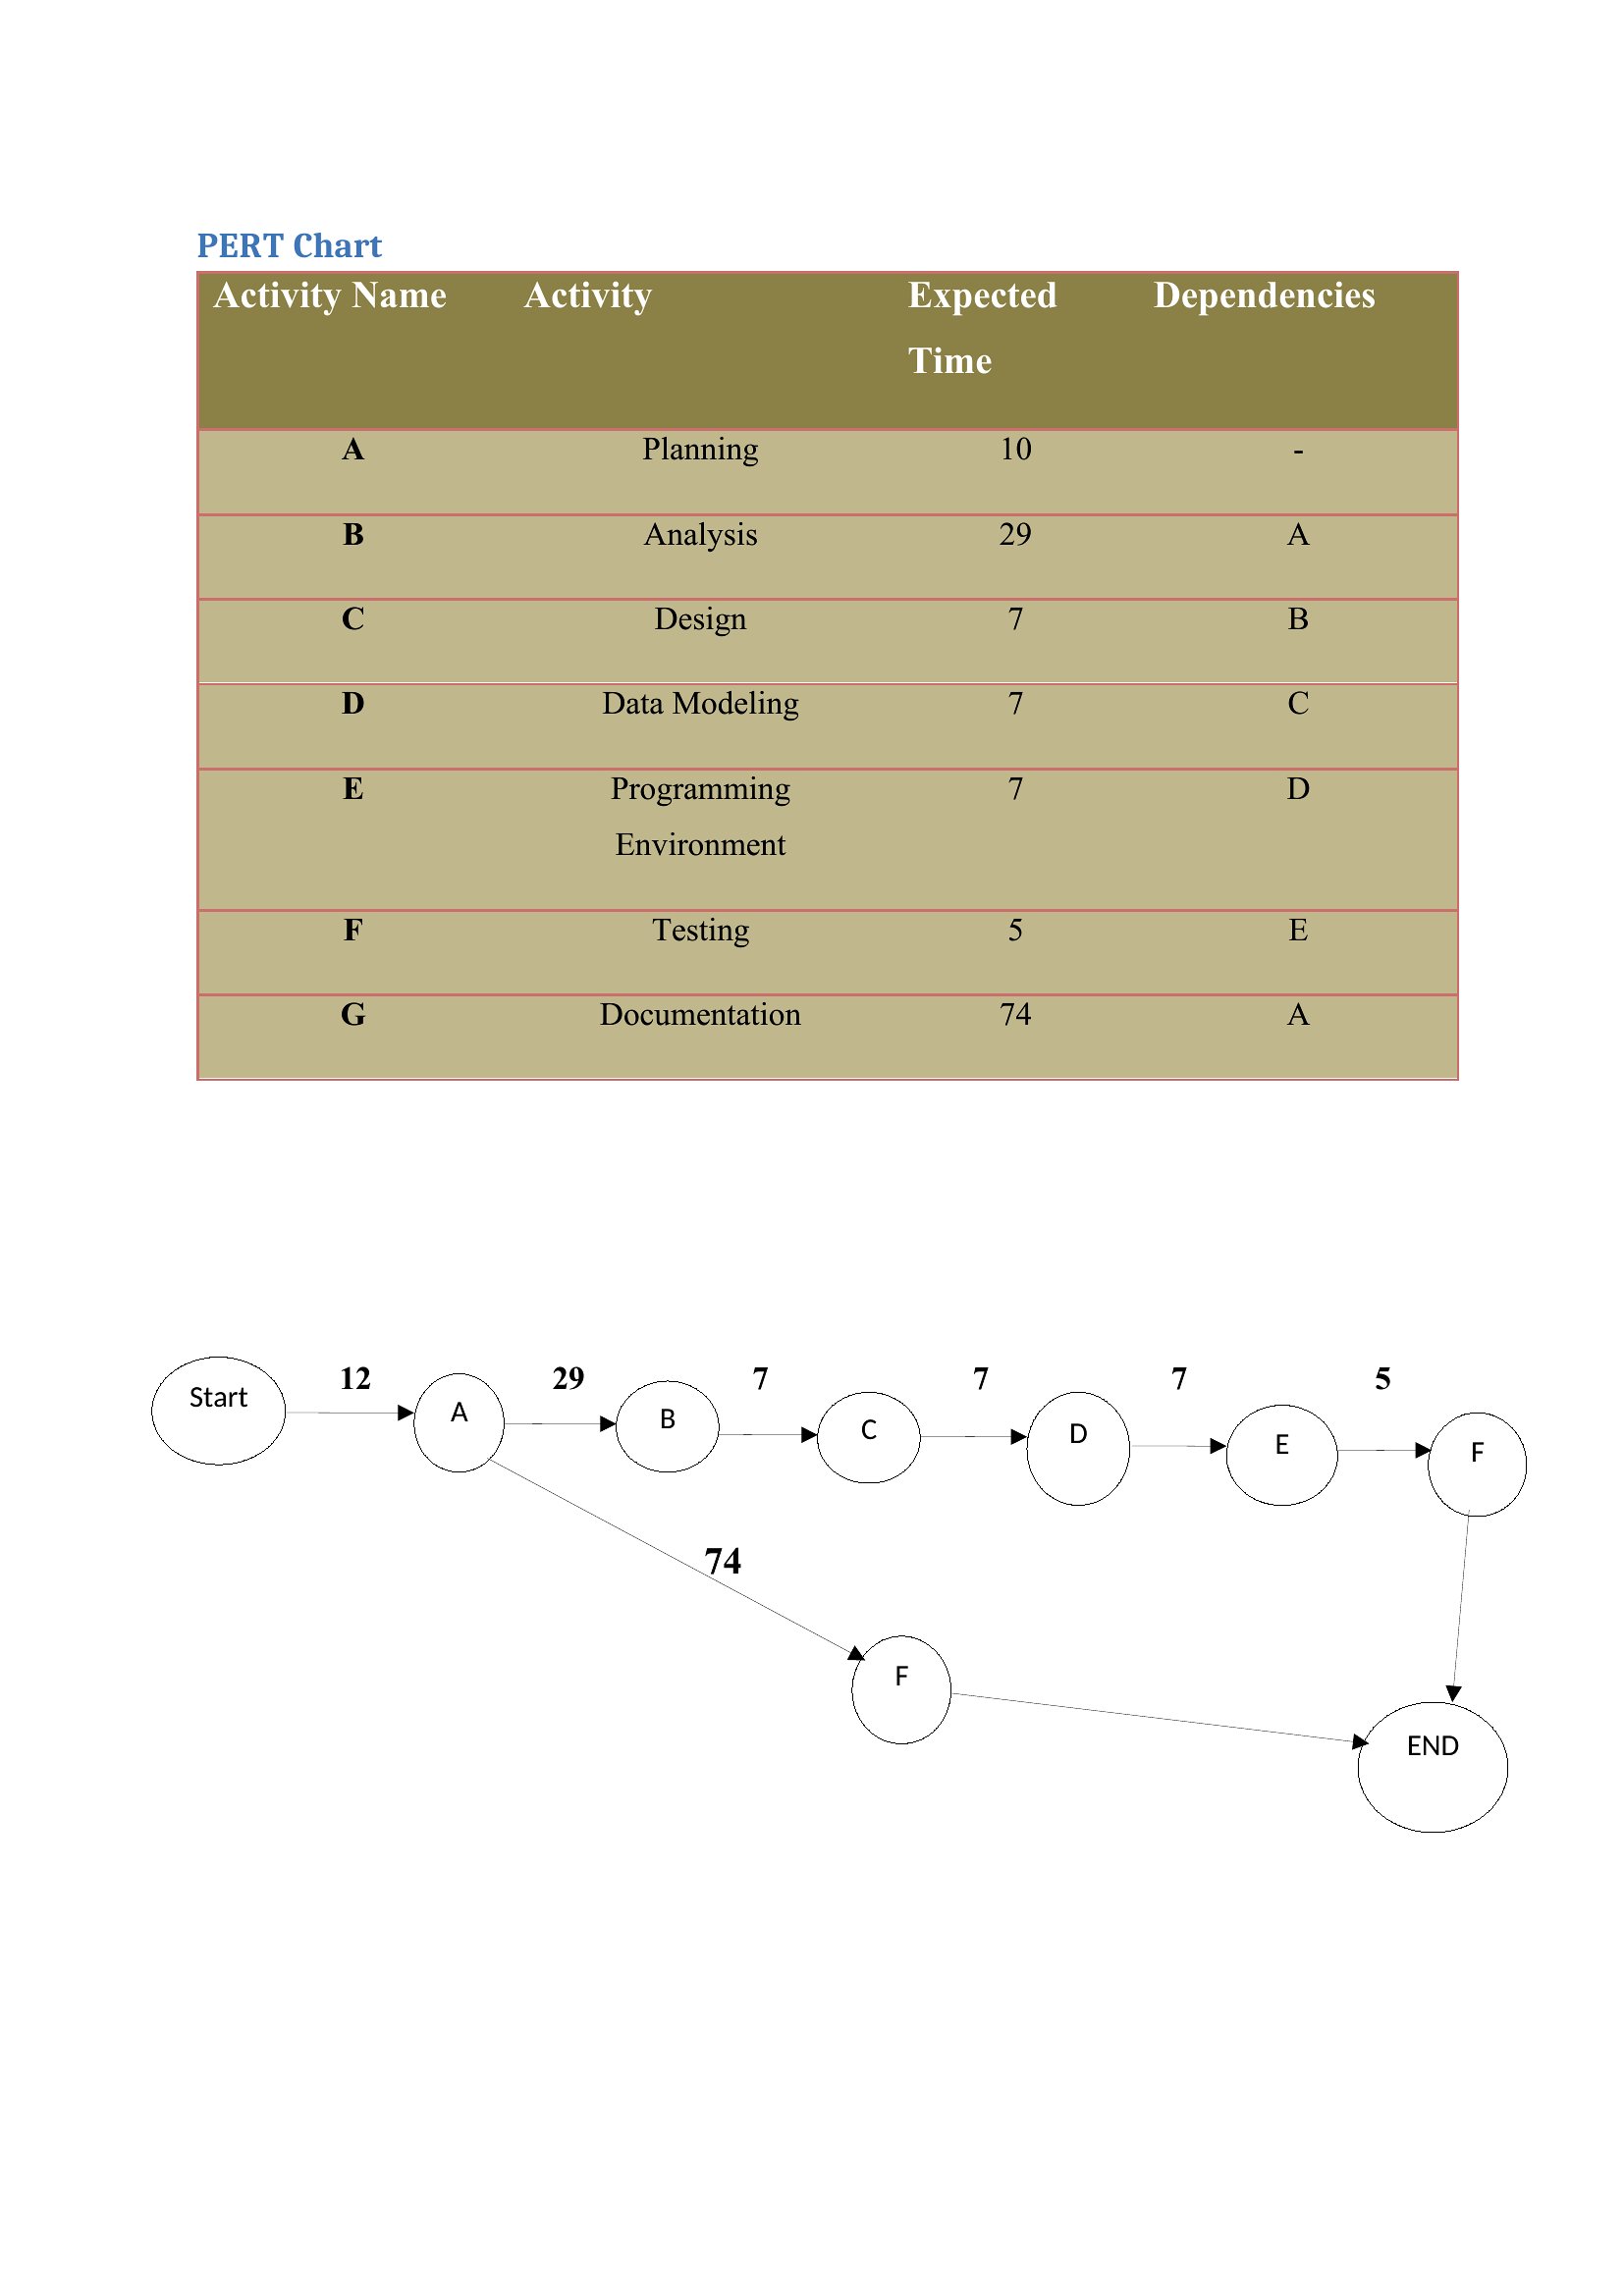
Pert Chart Example
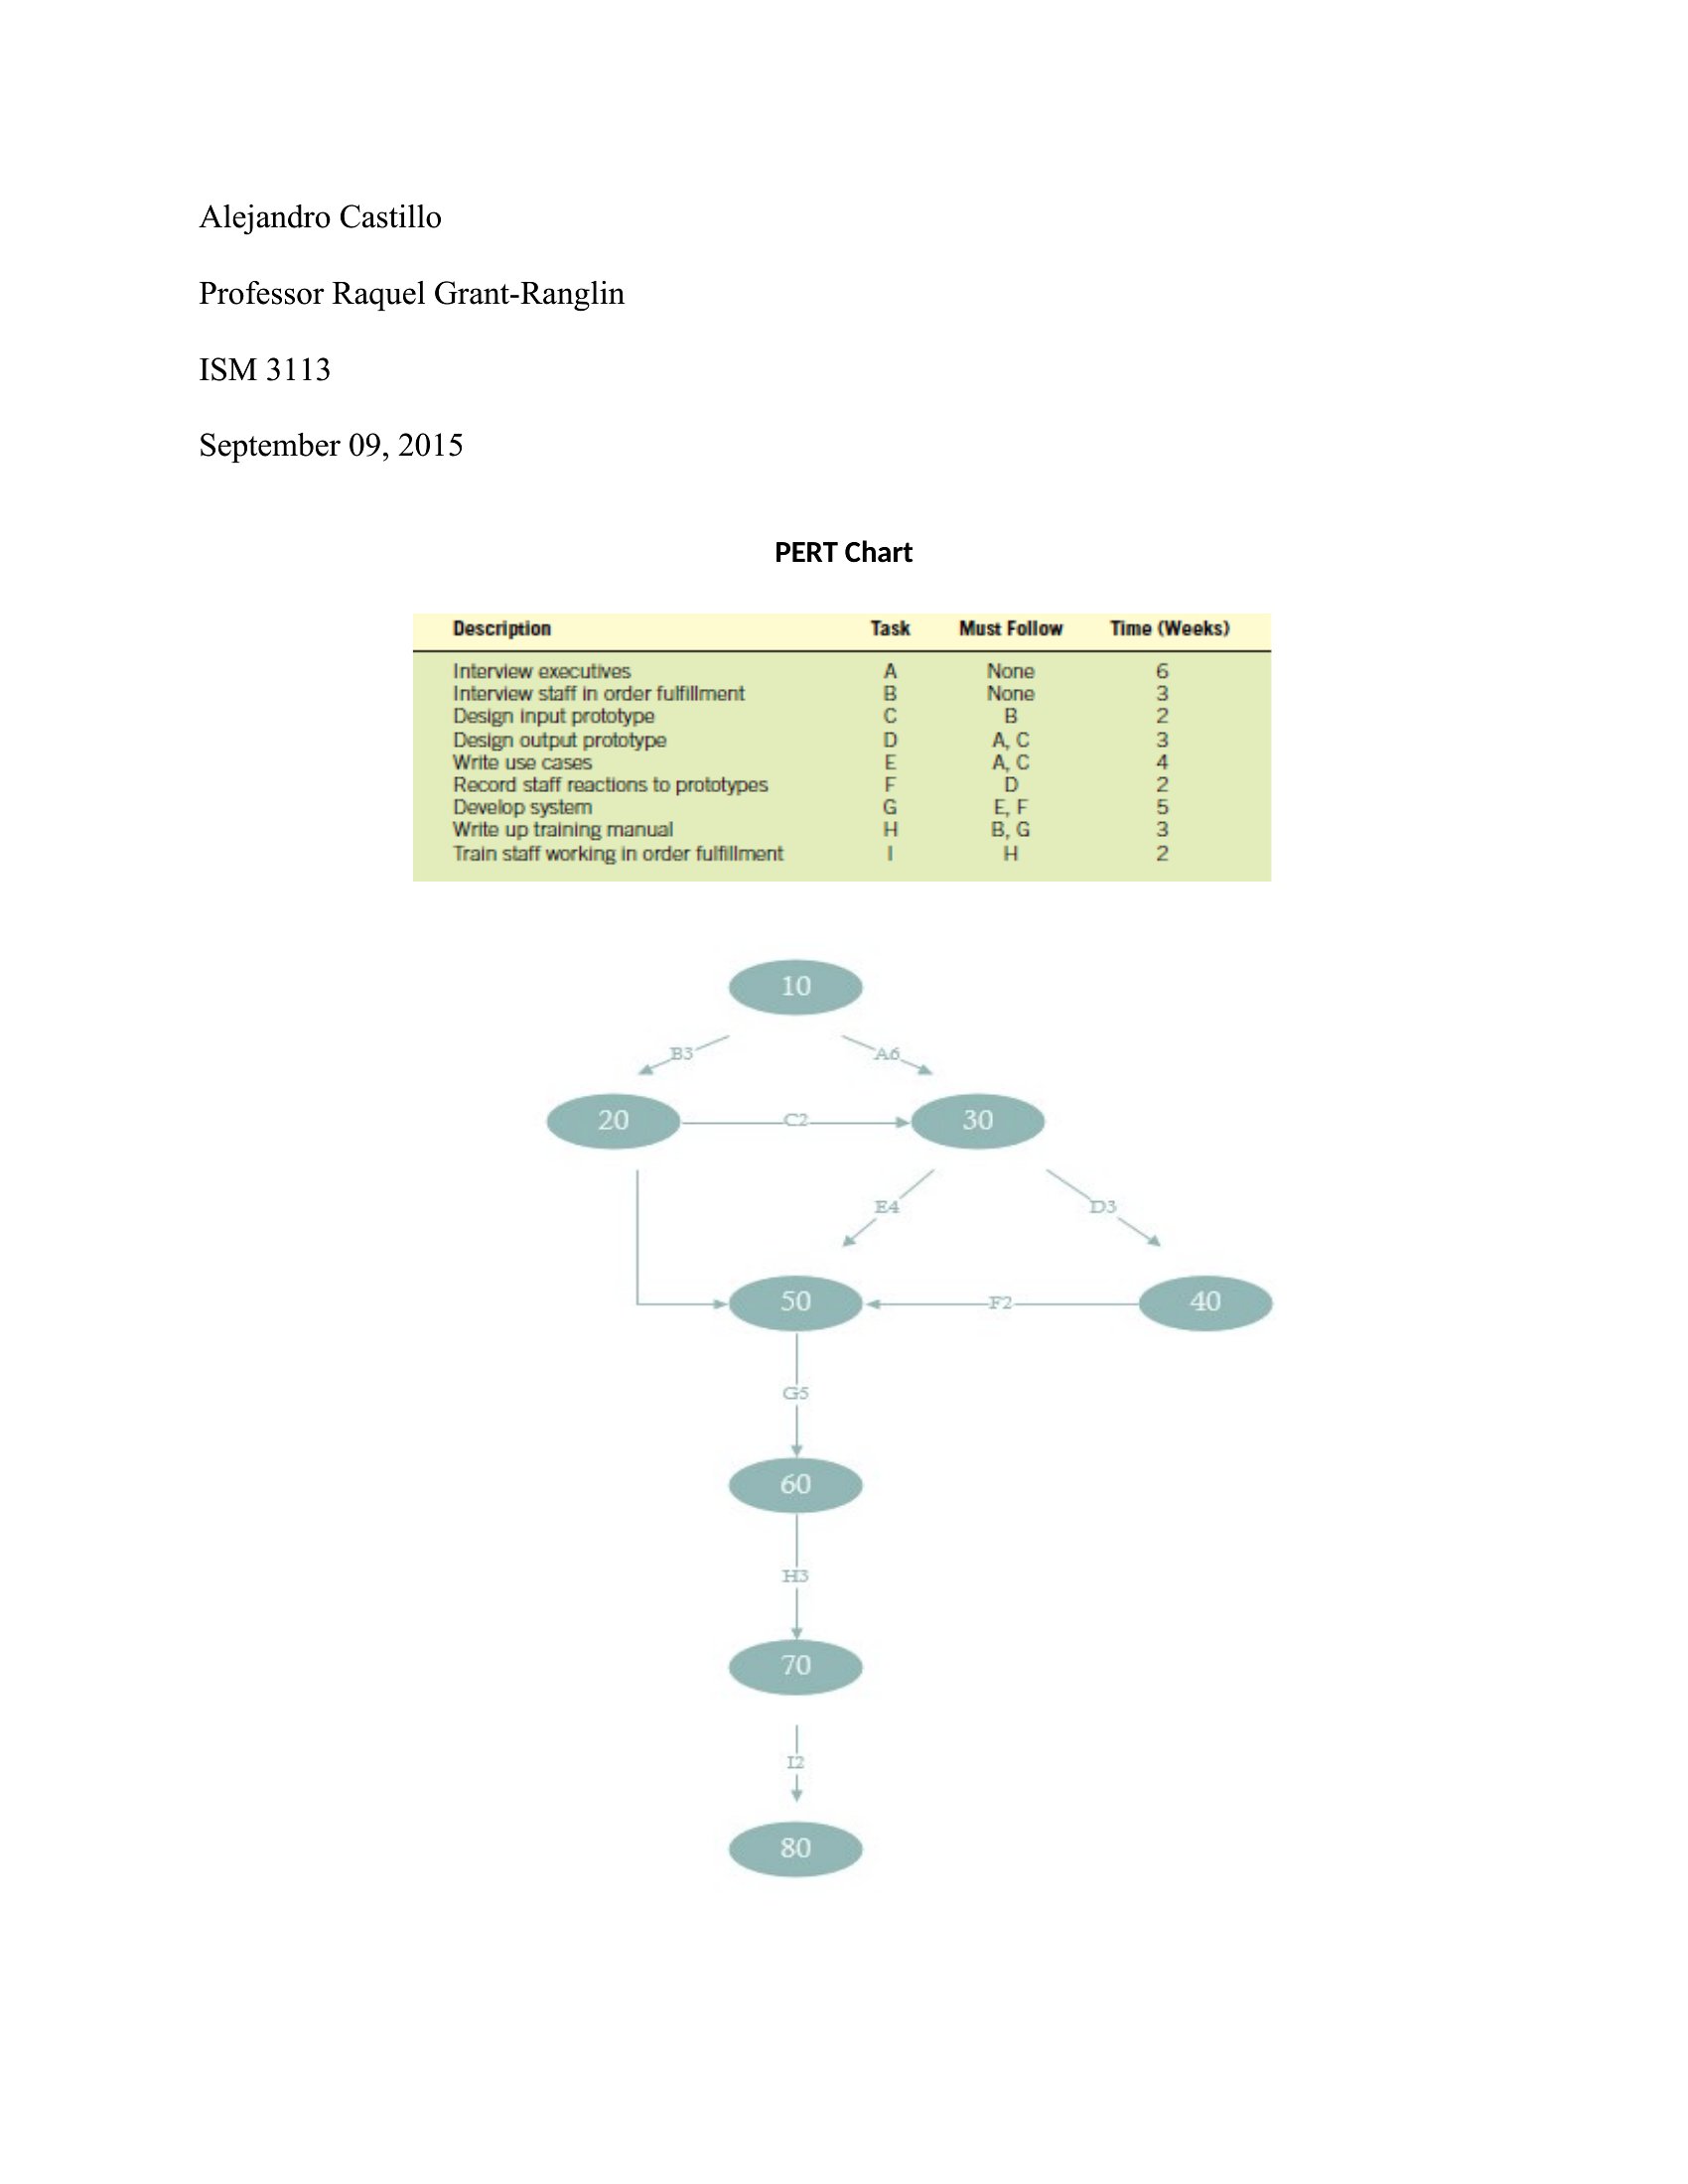
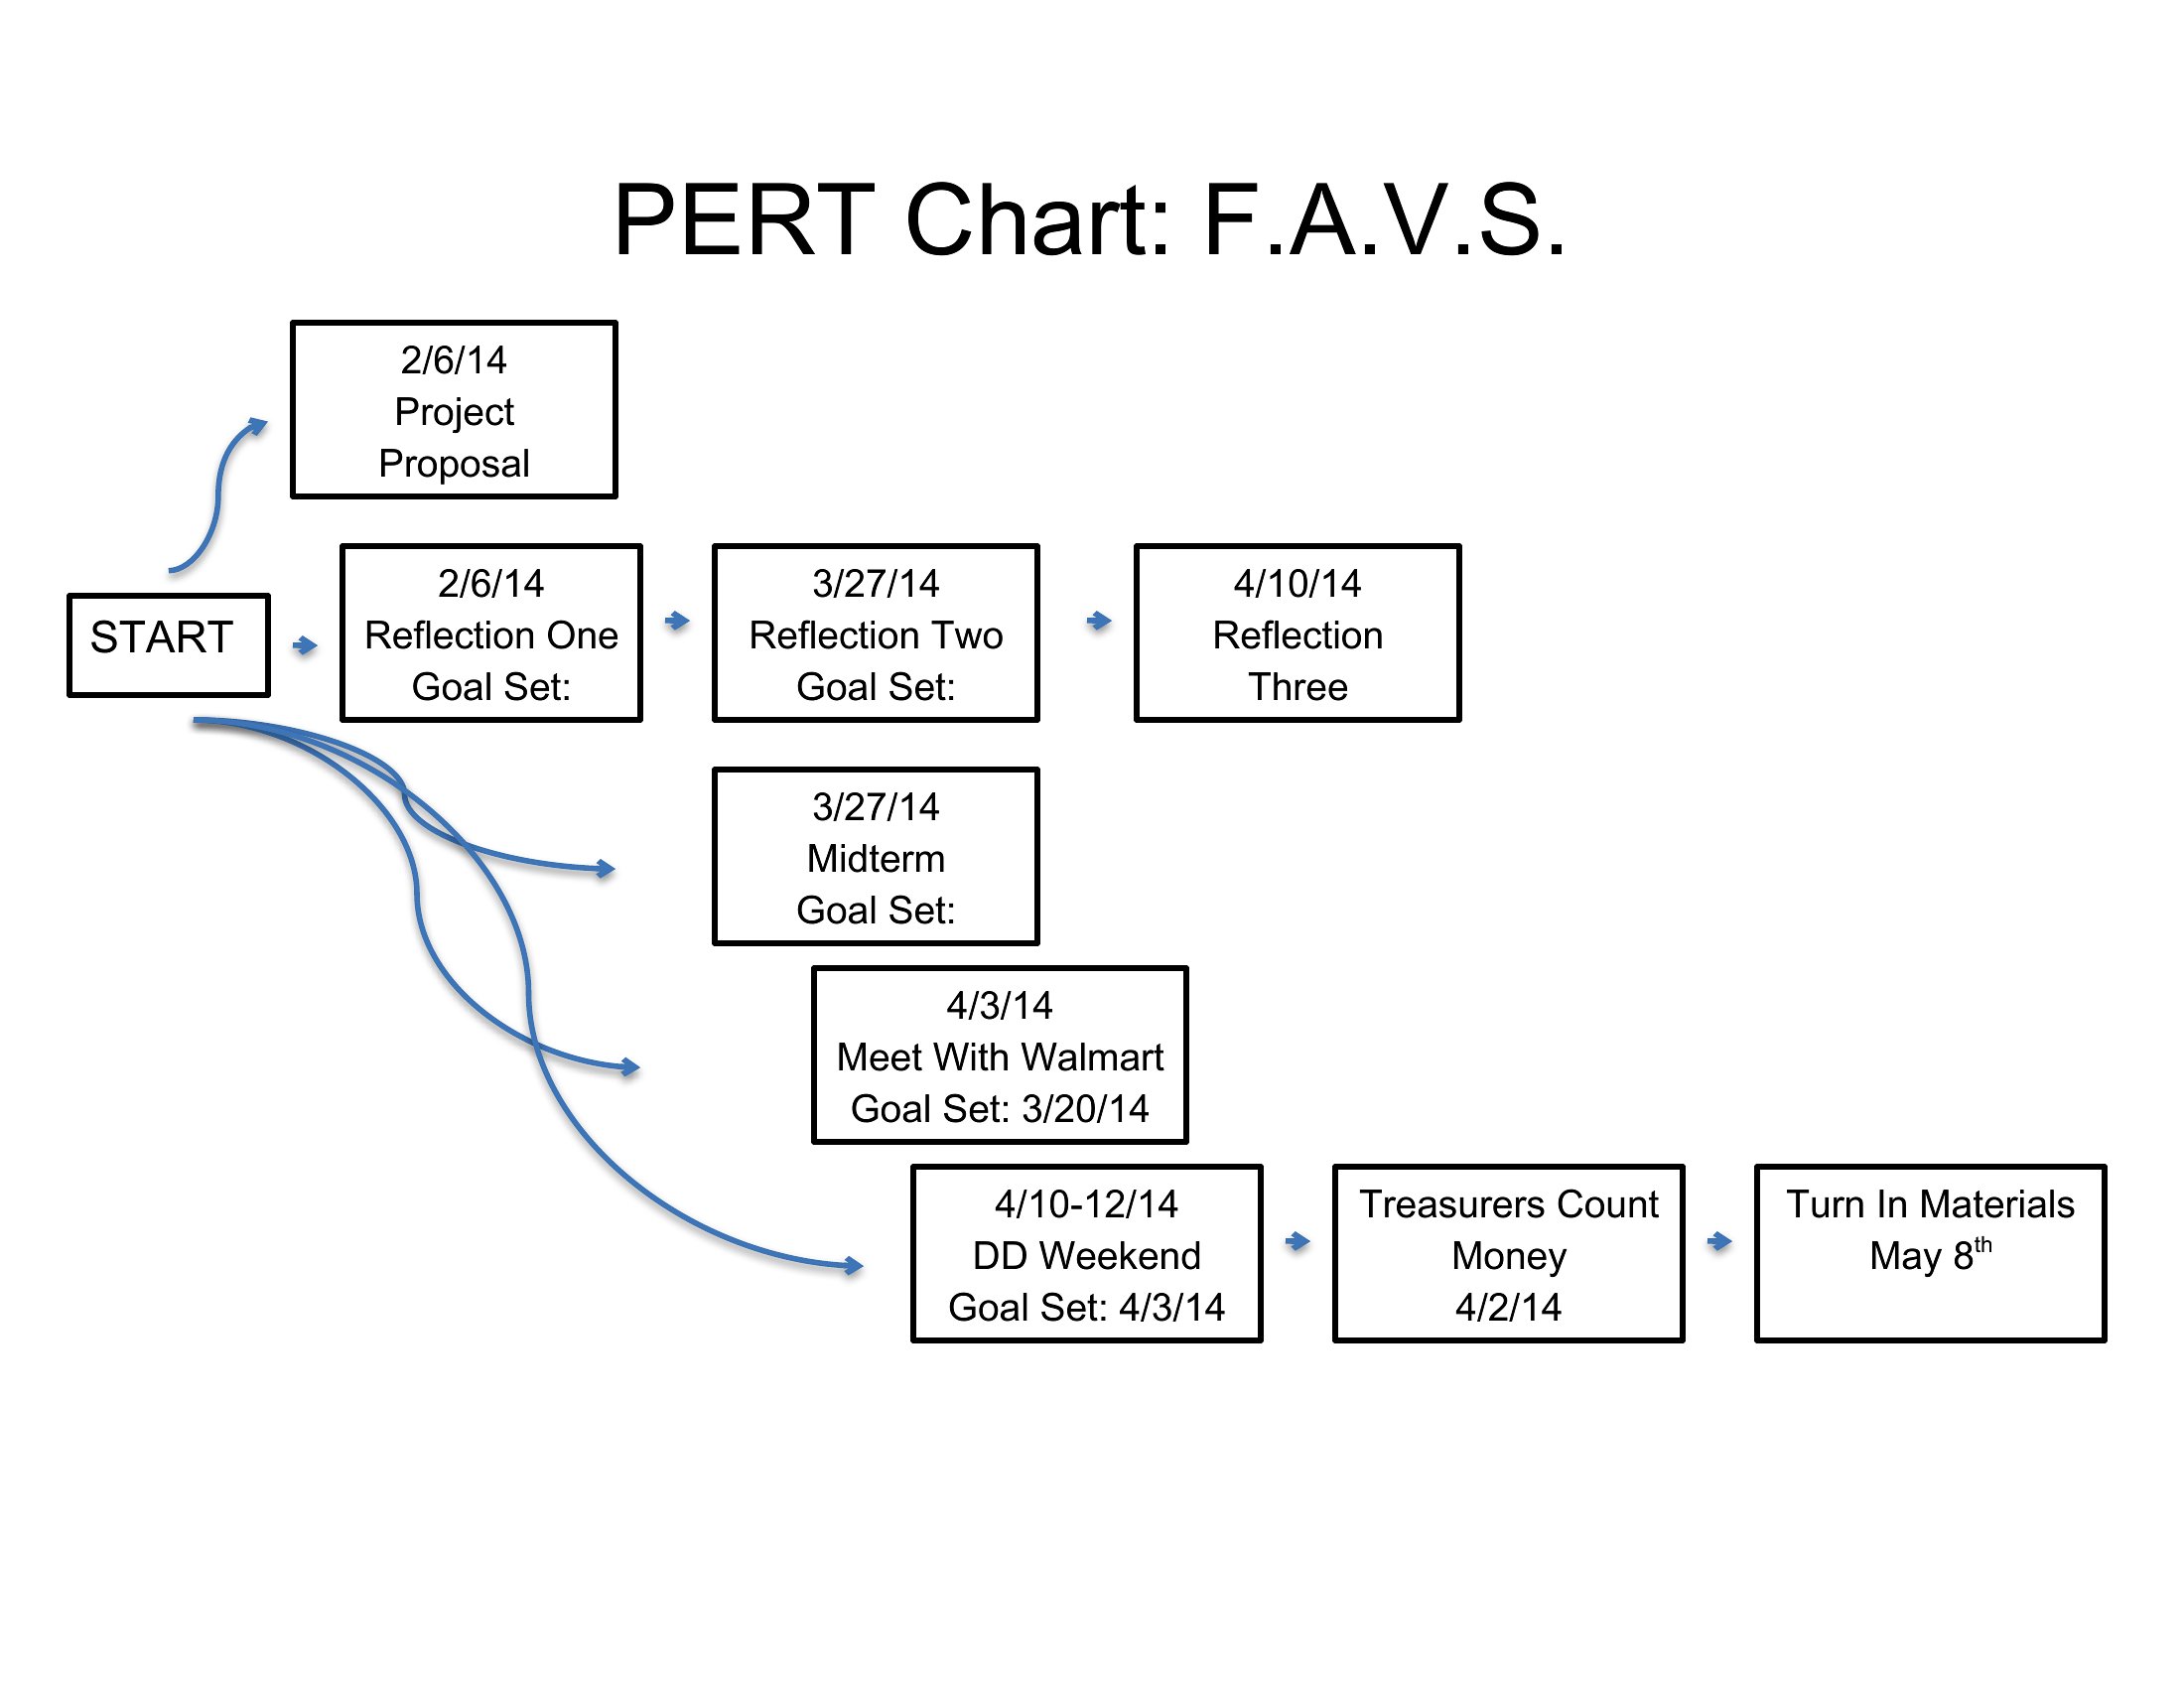
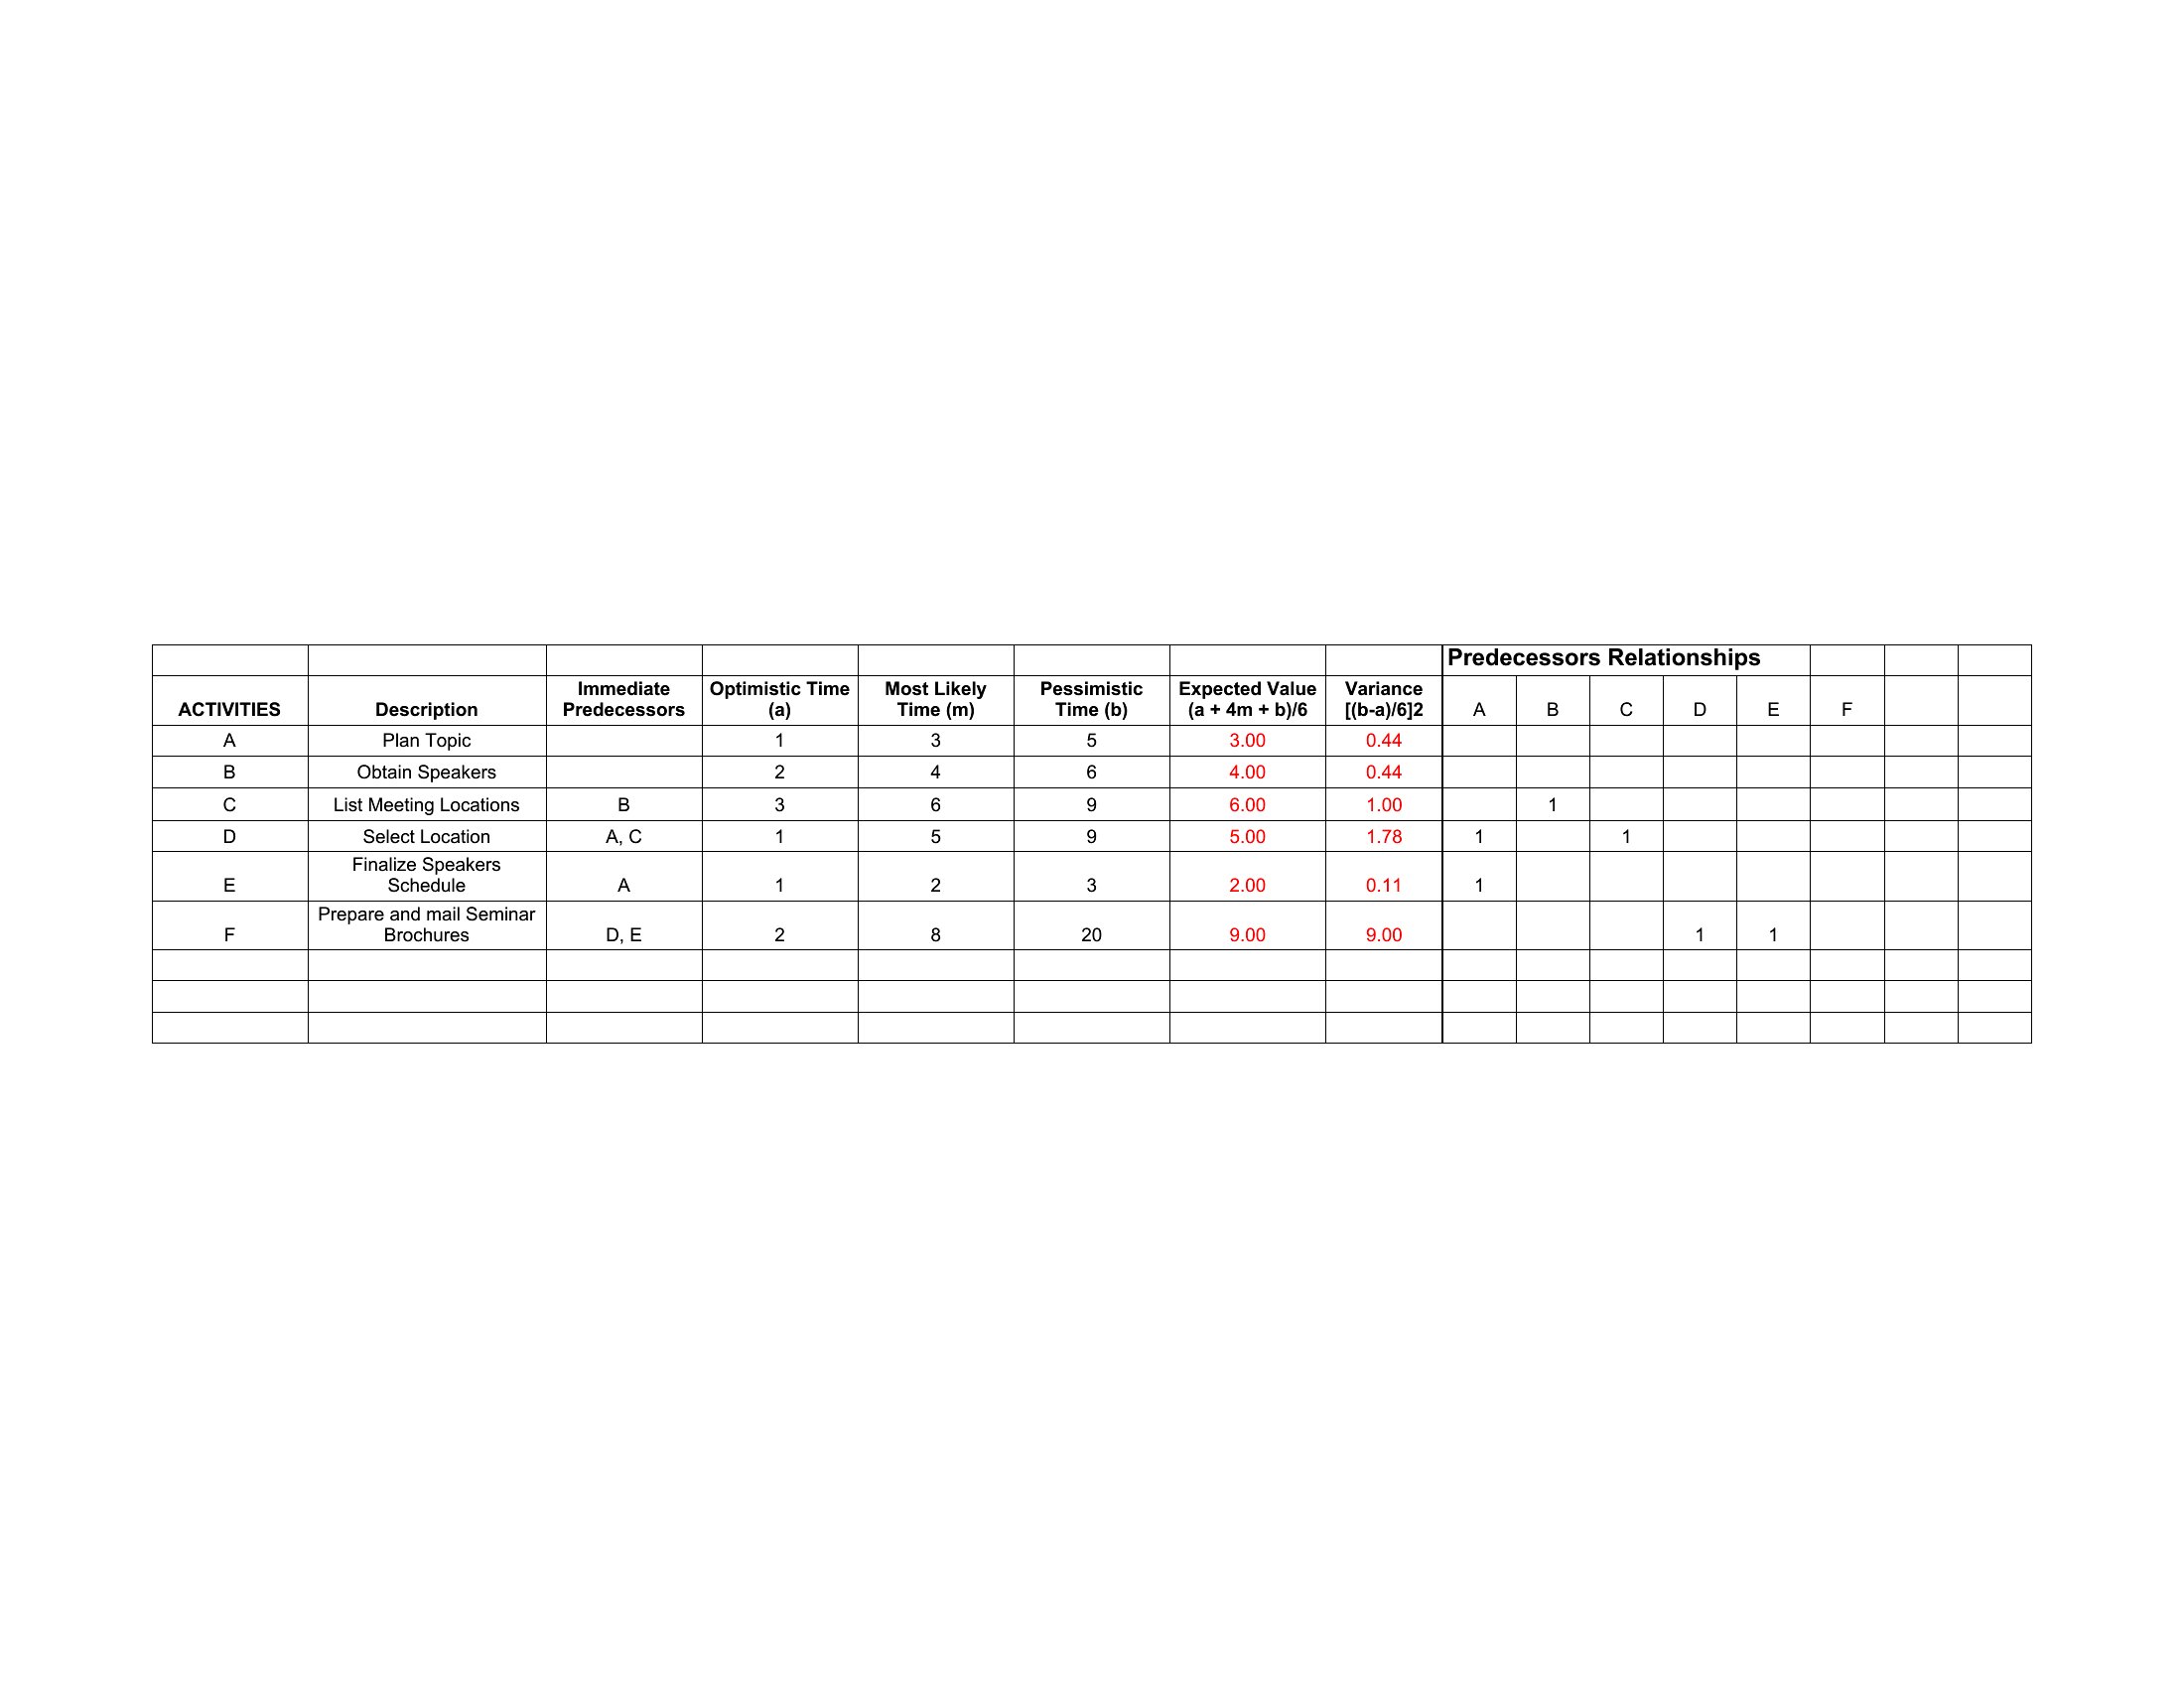
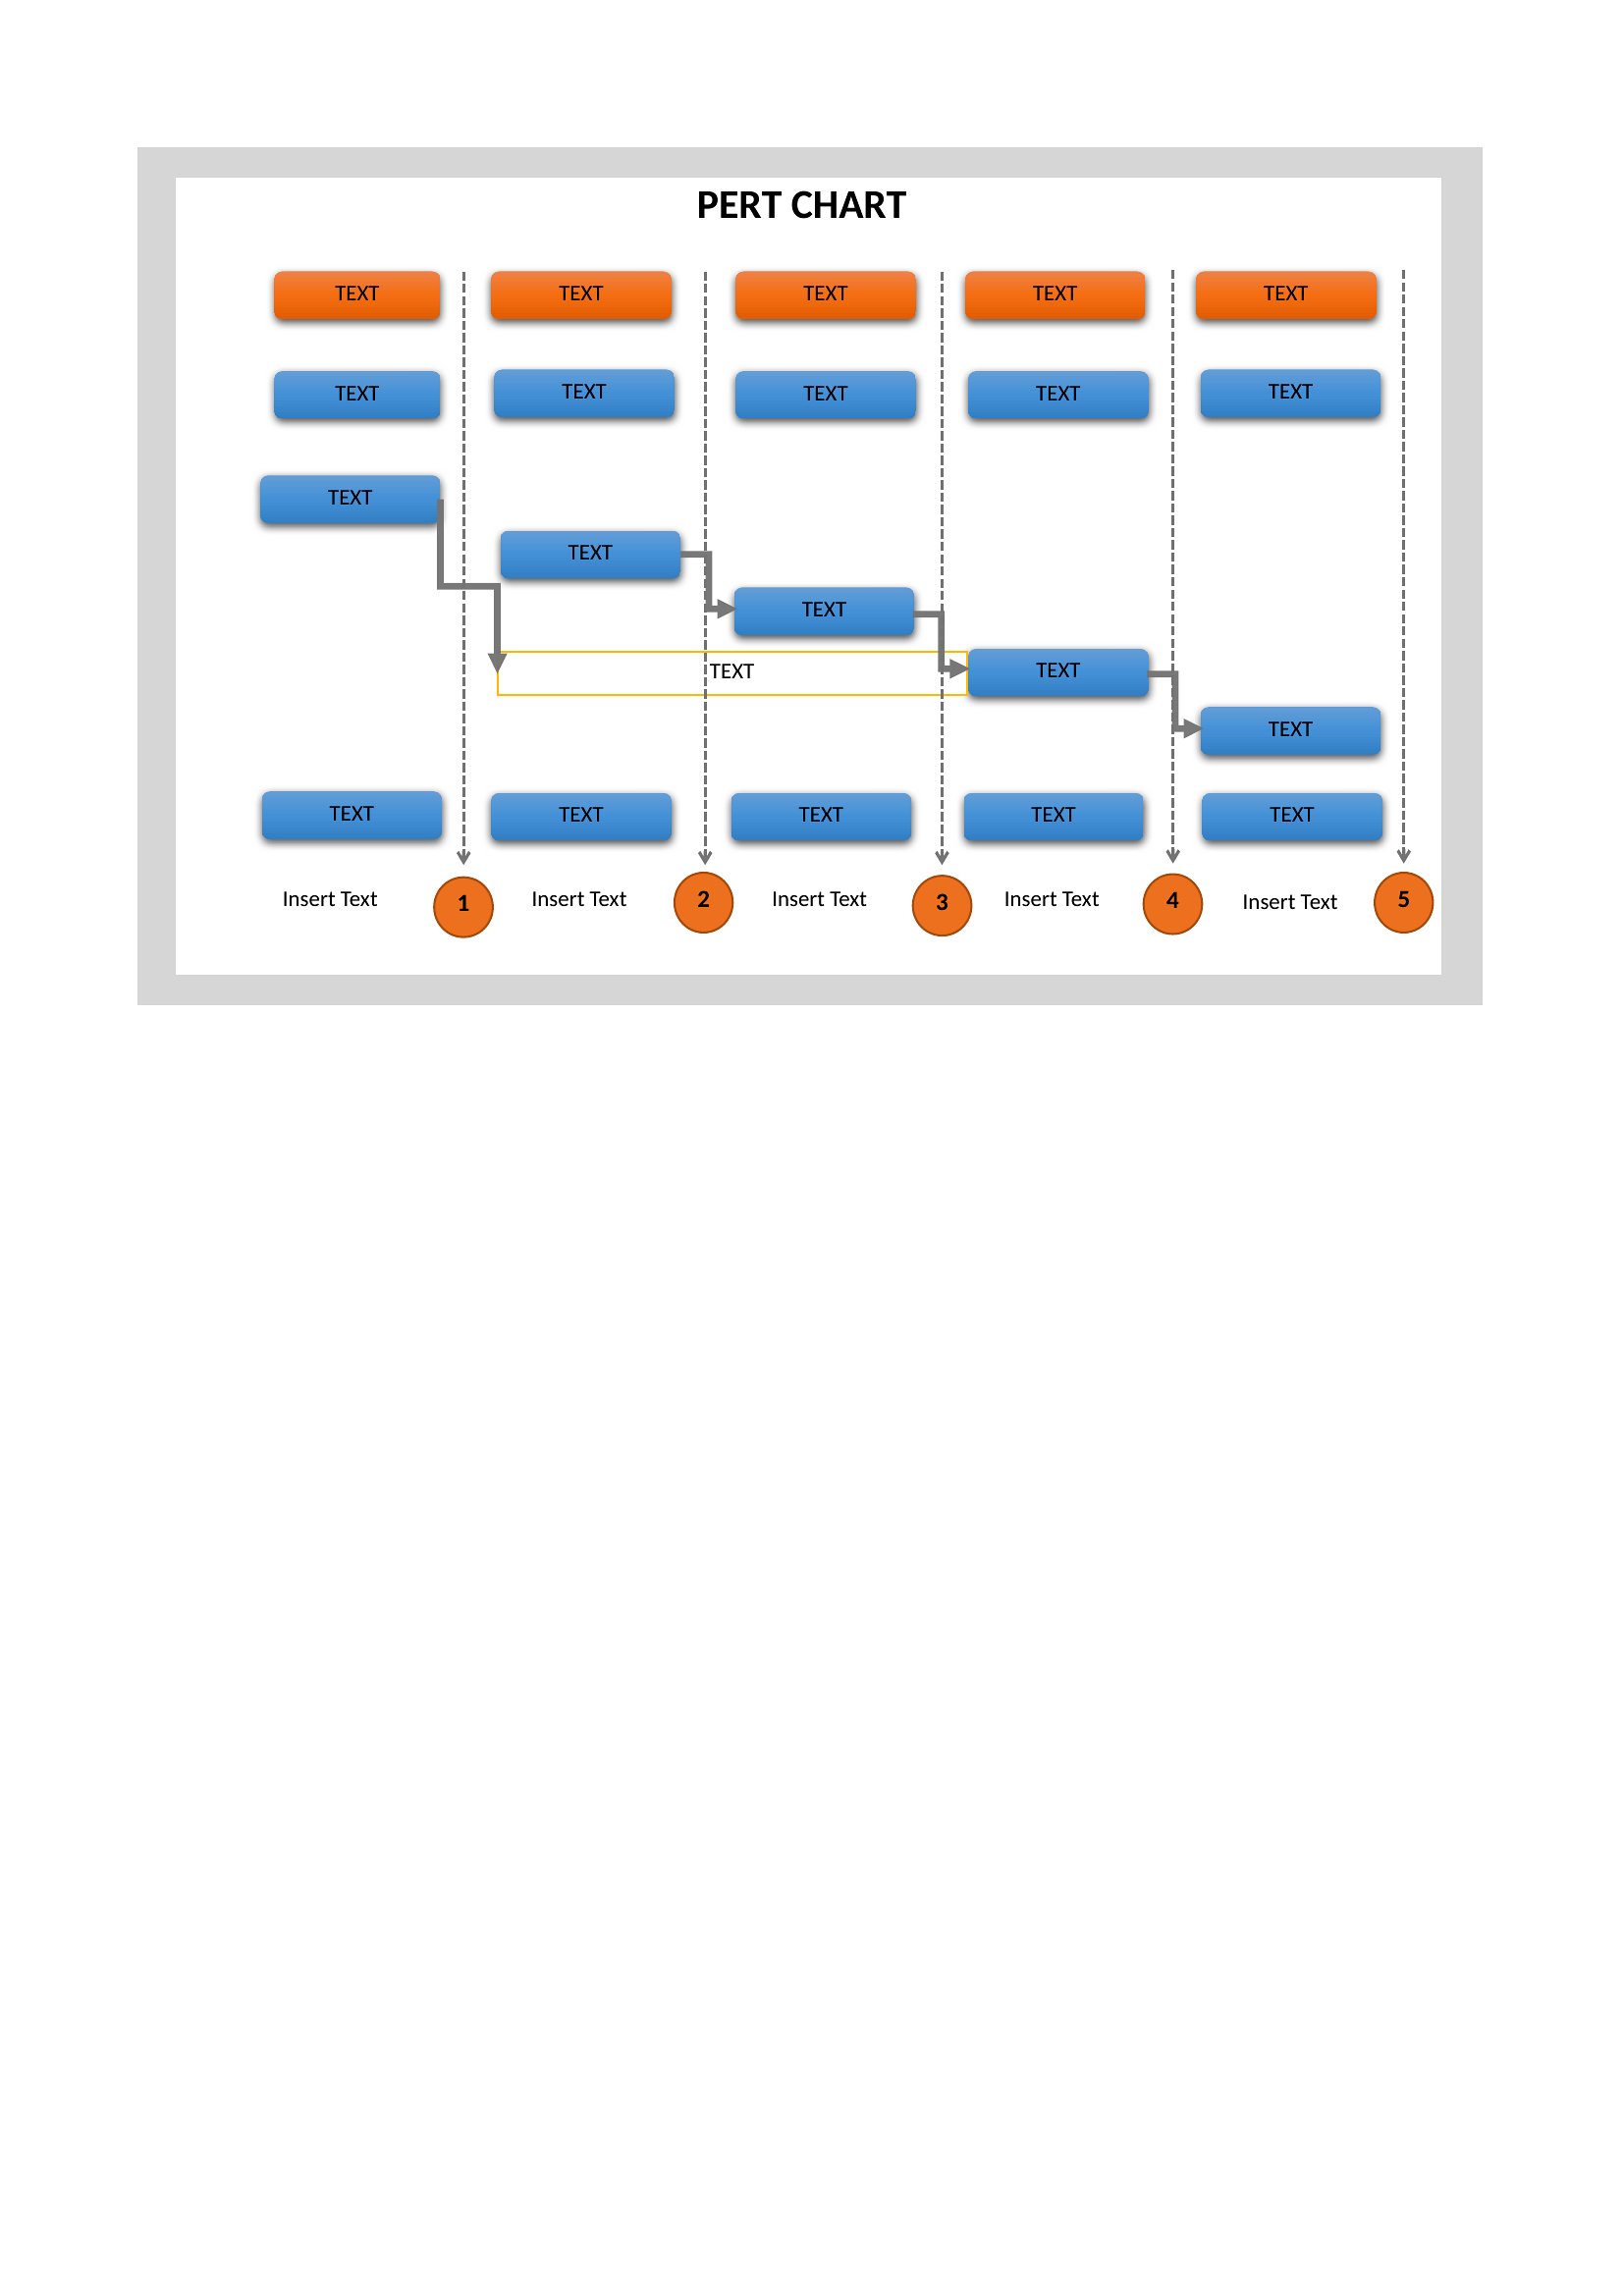
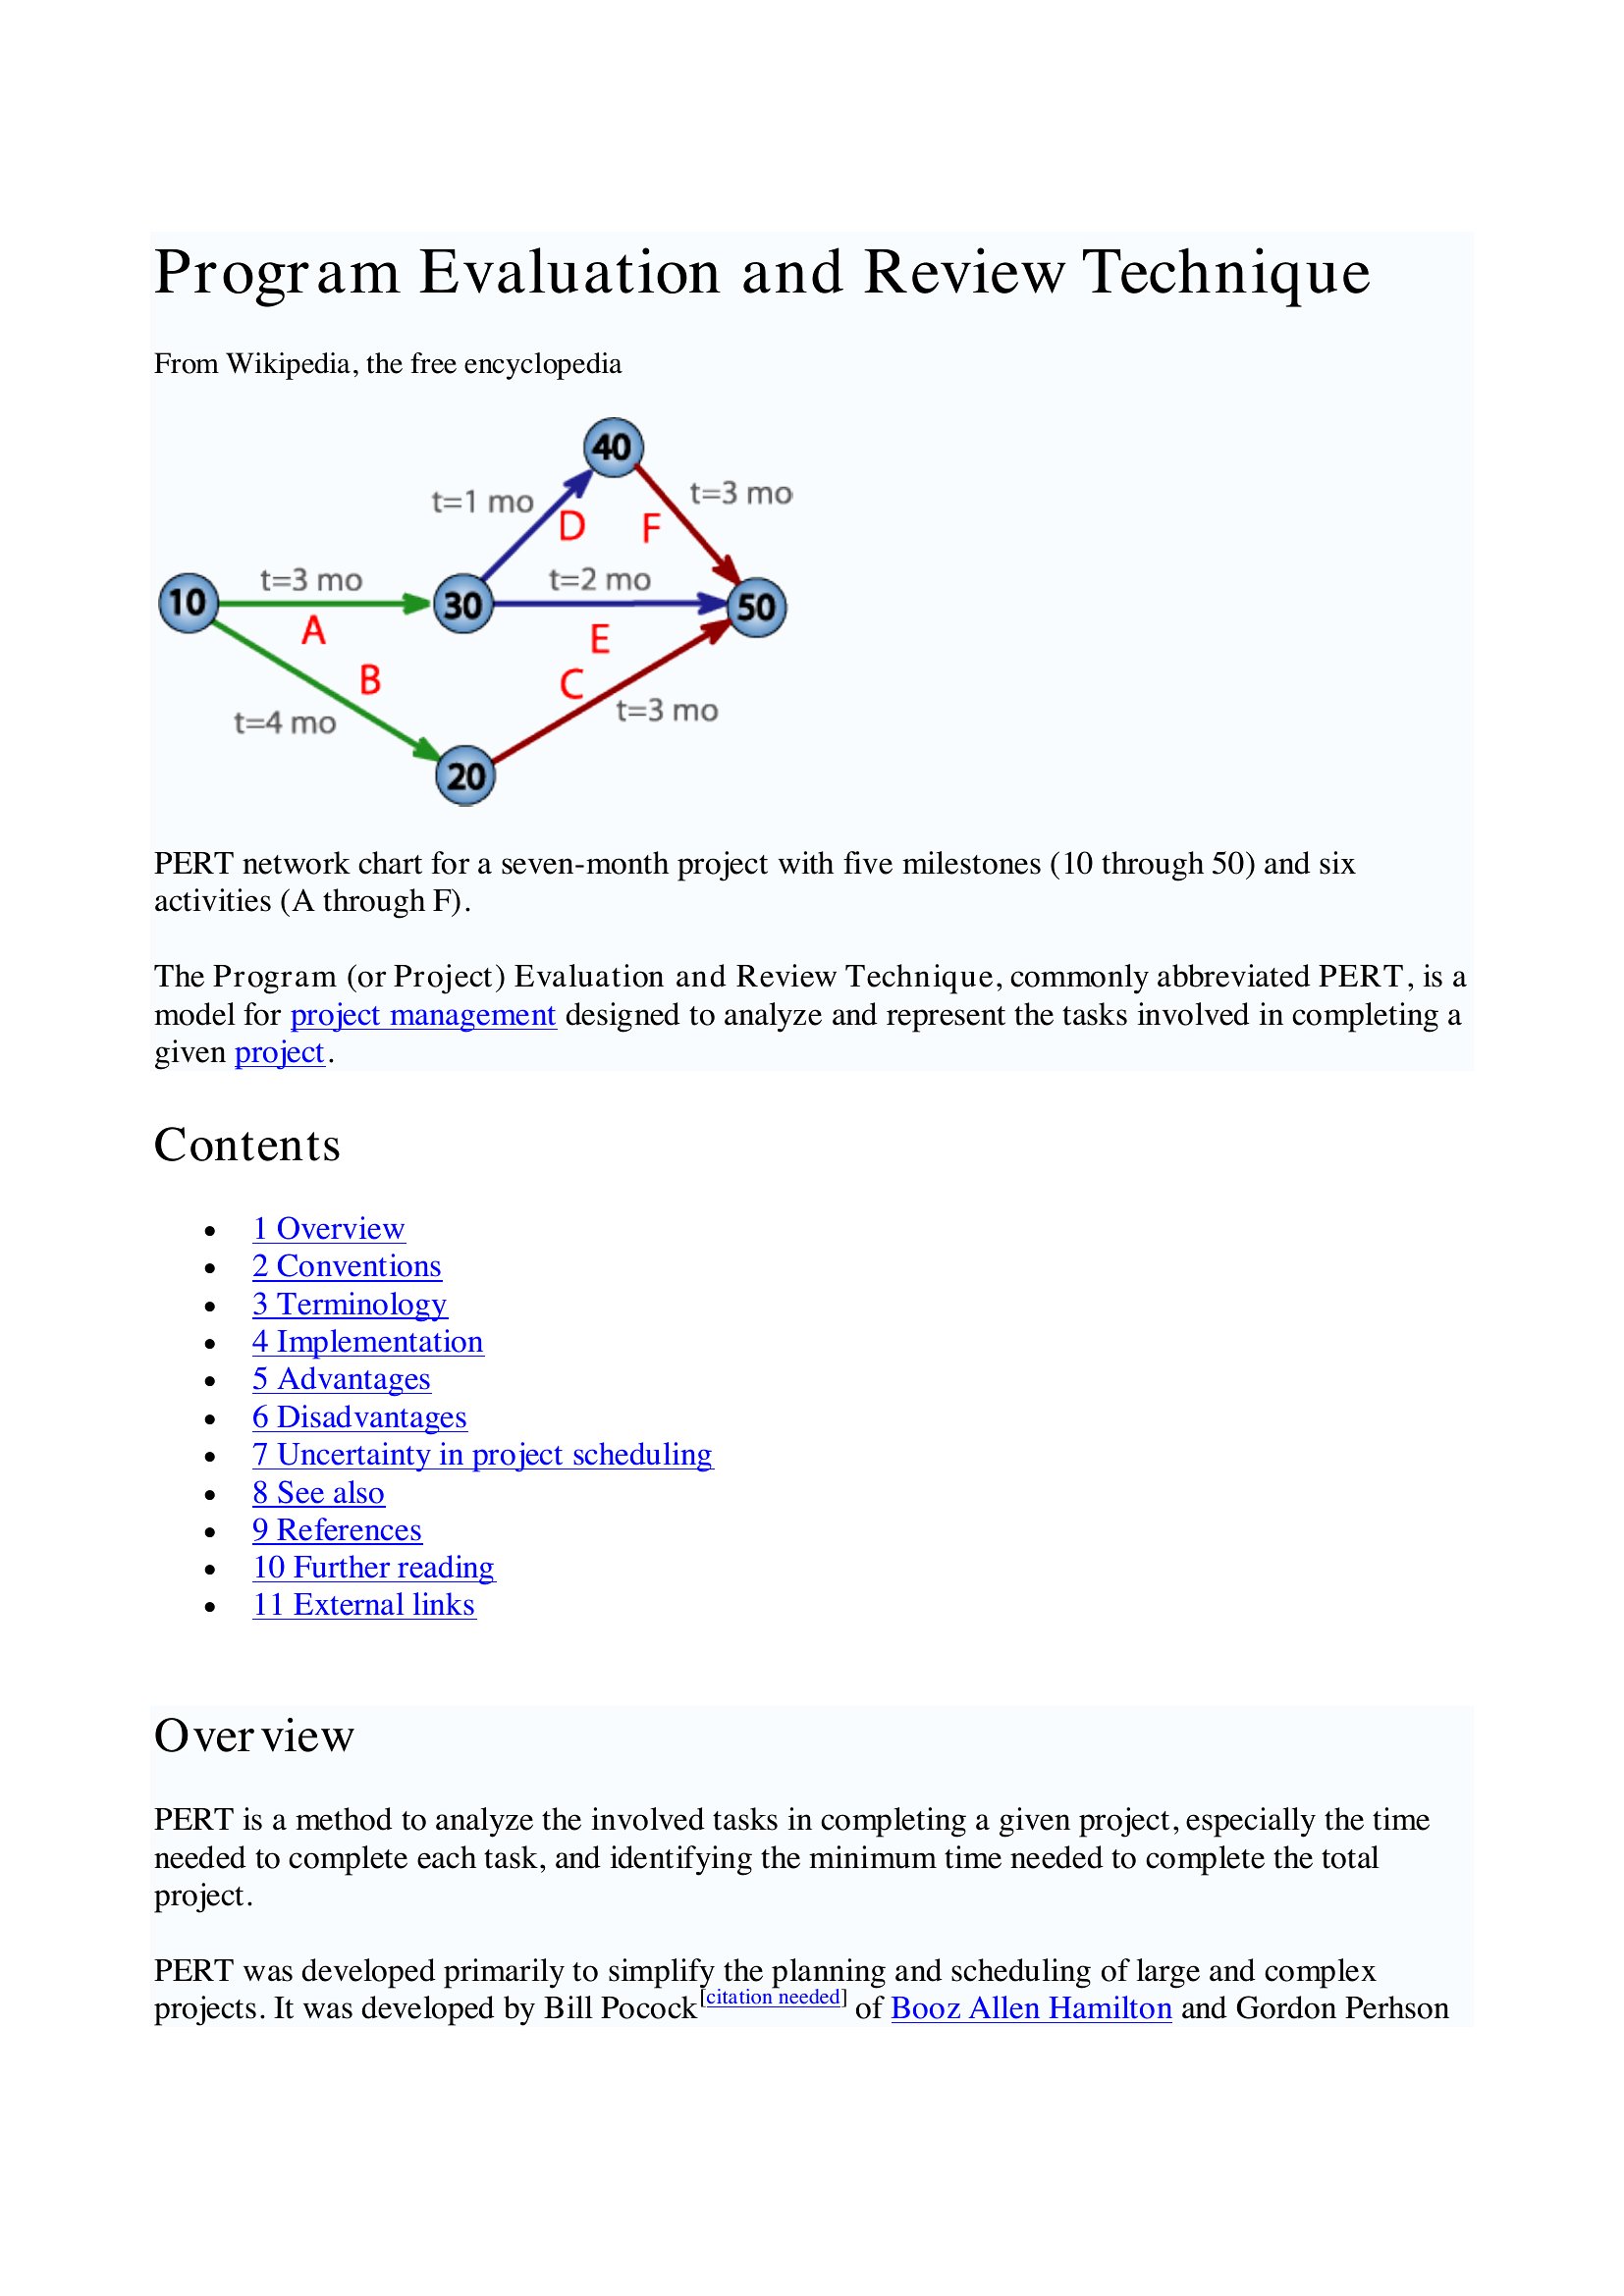
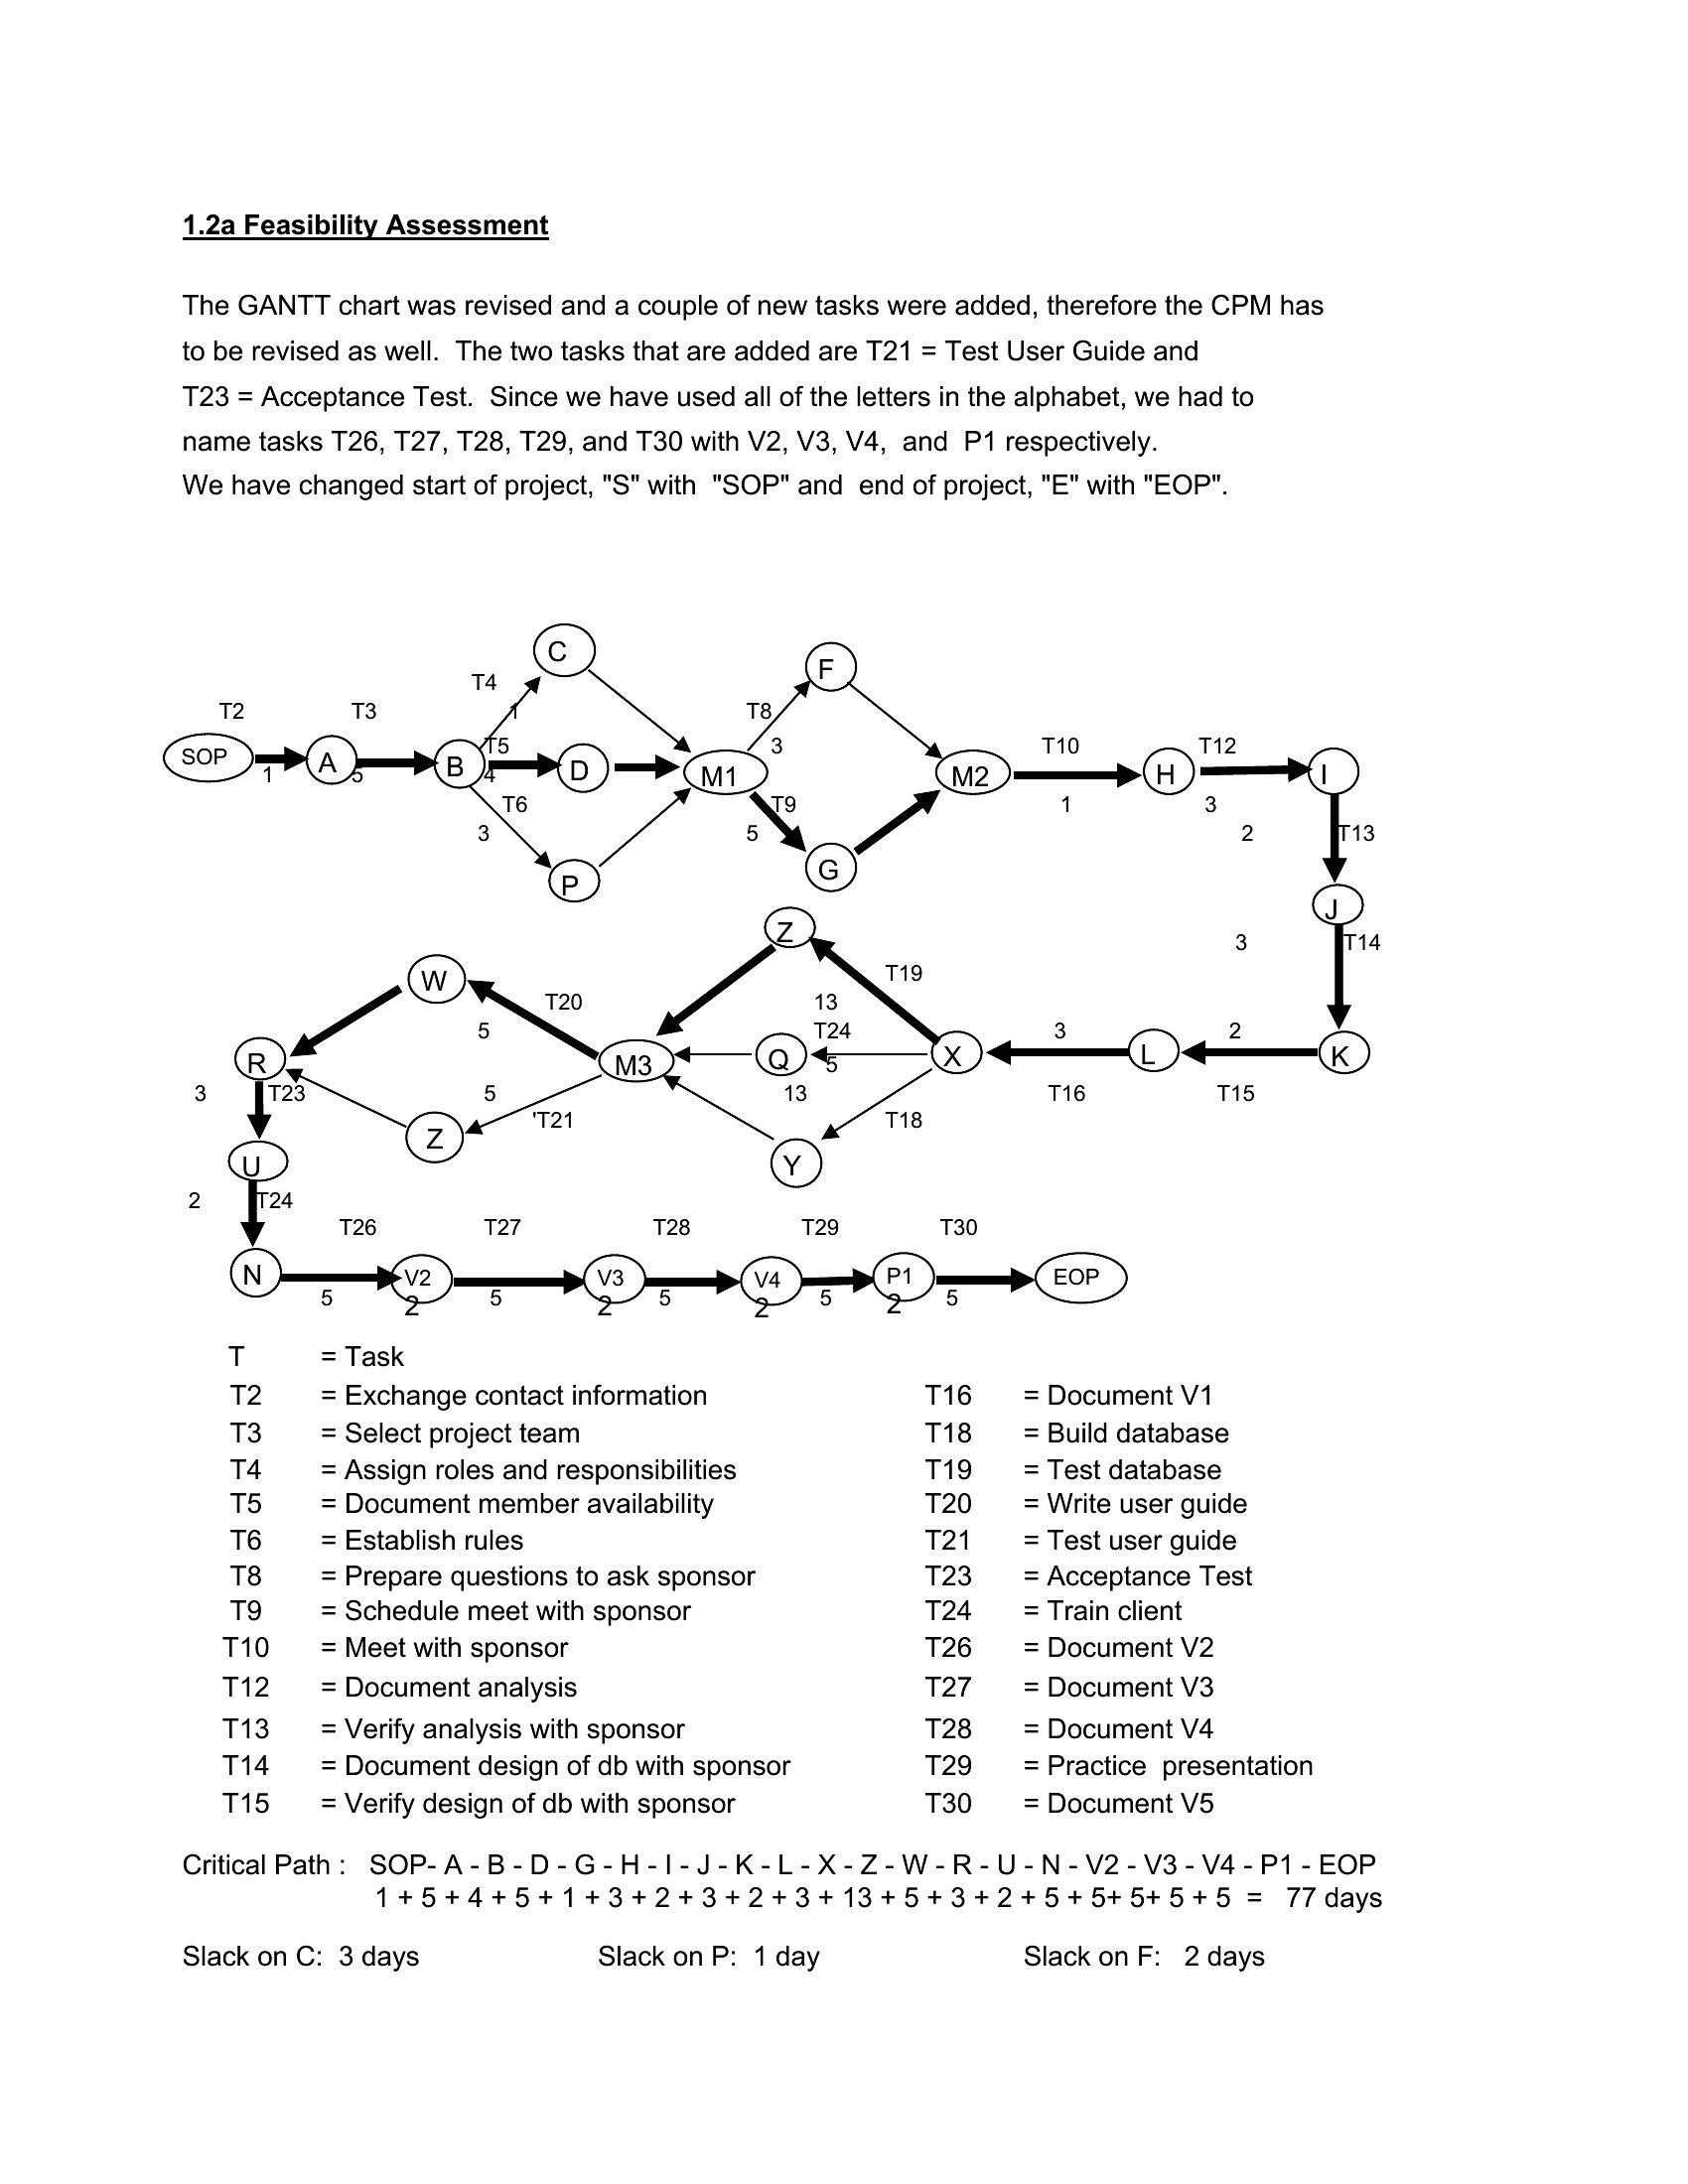
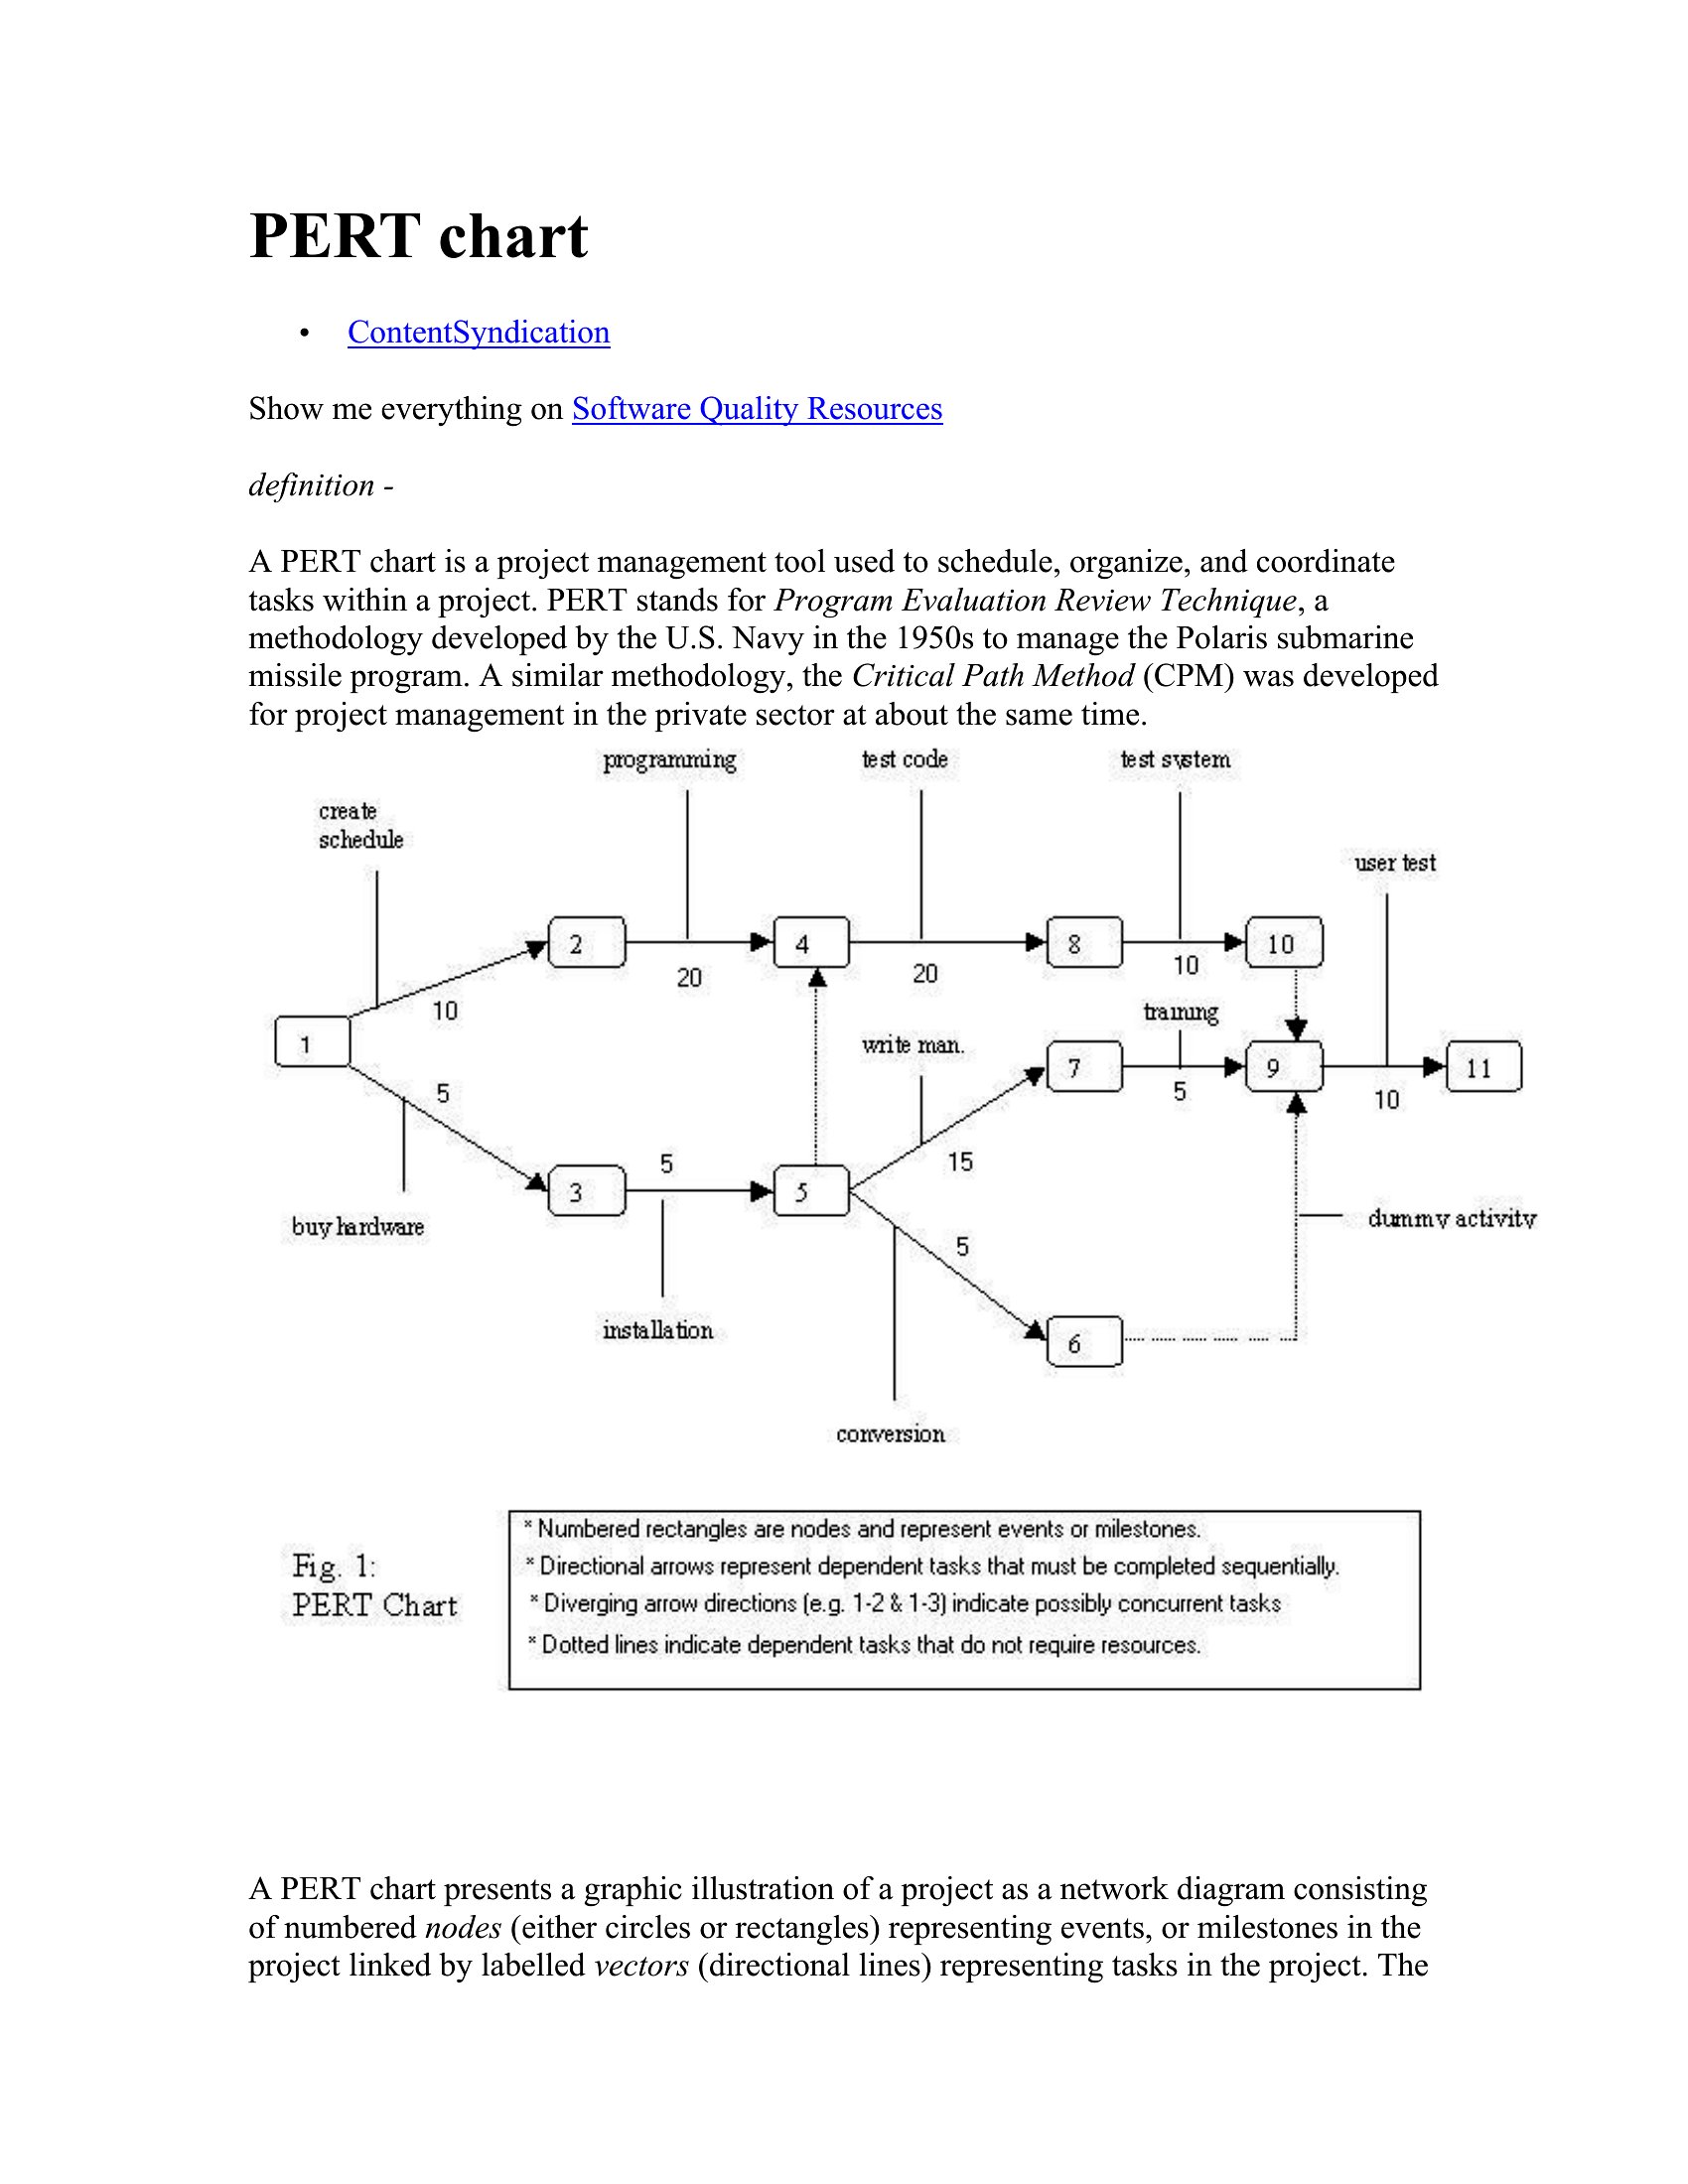
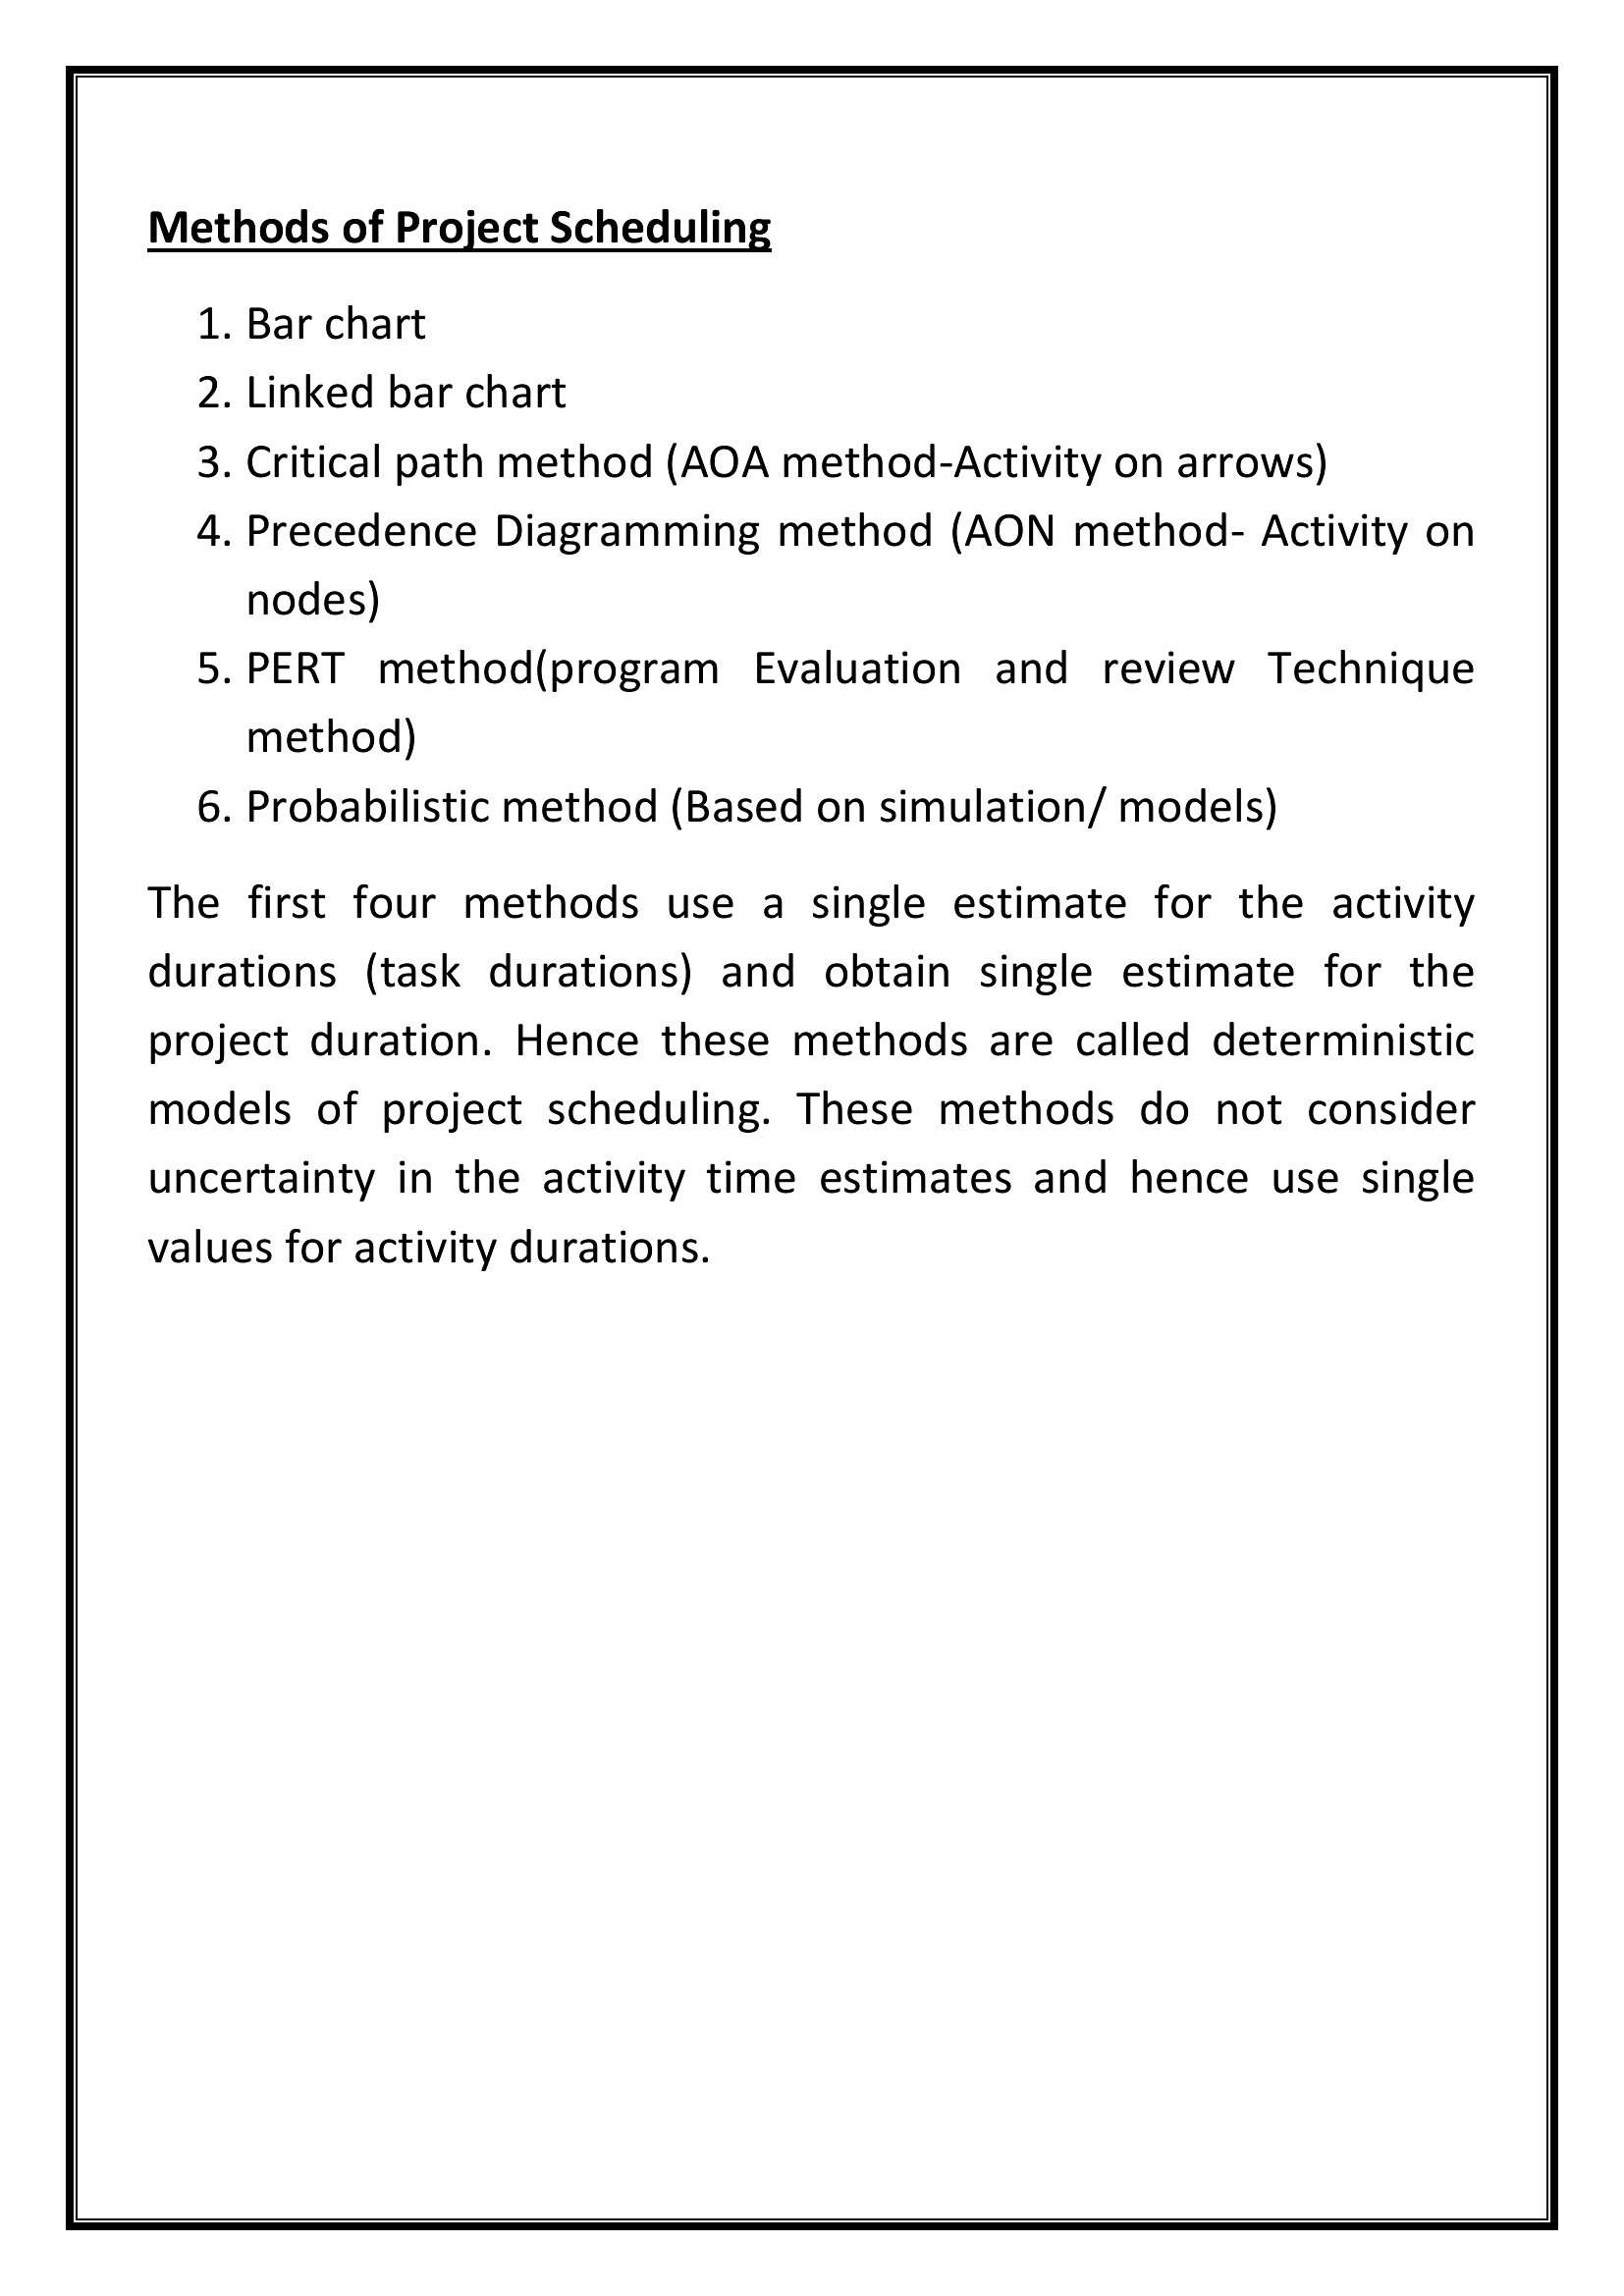
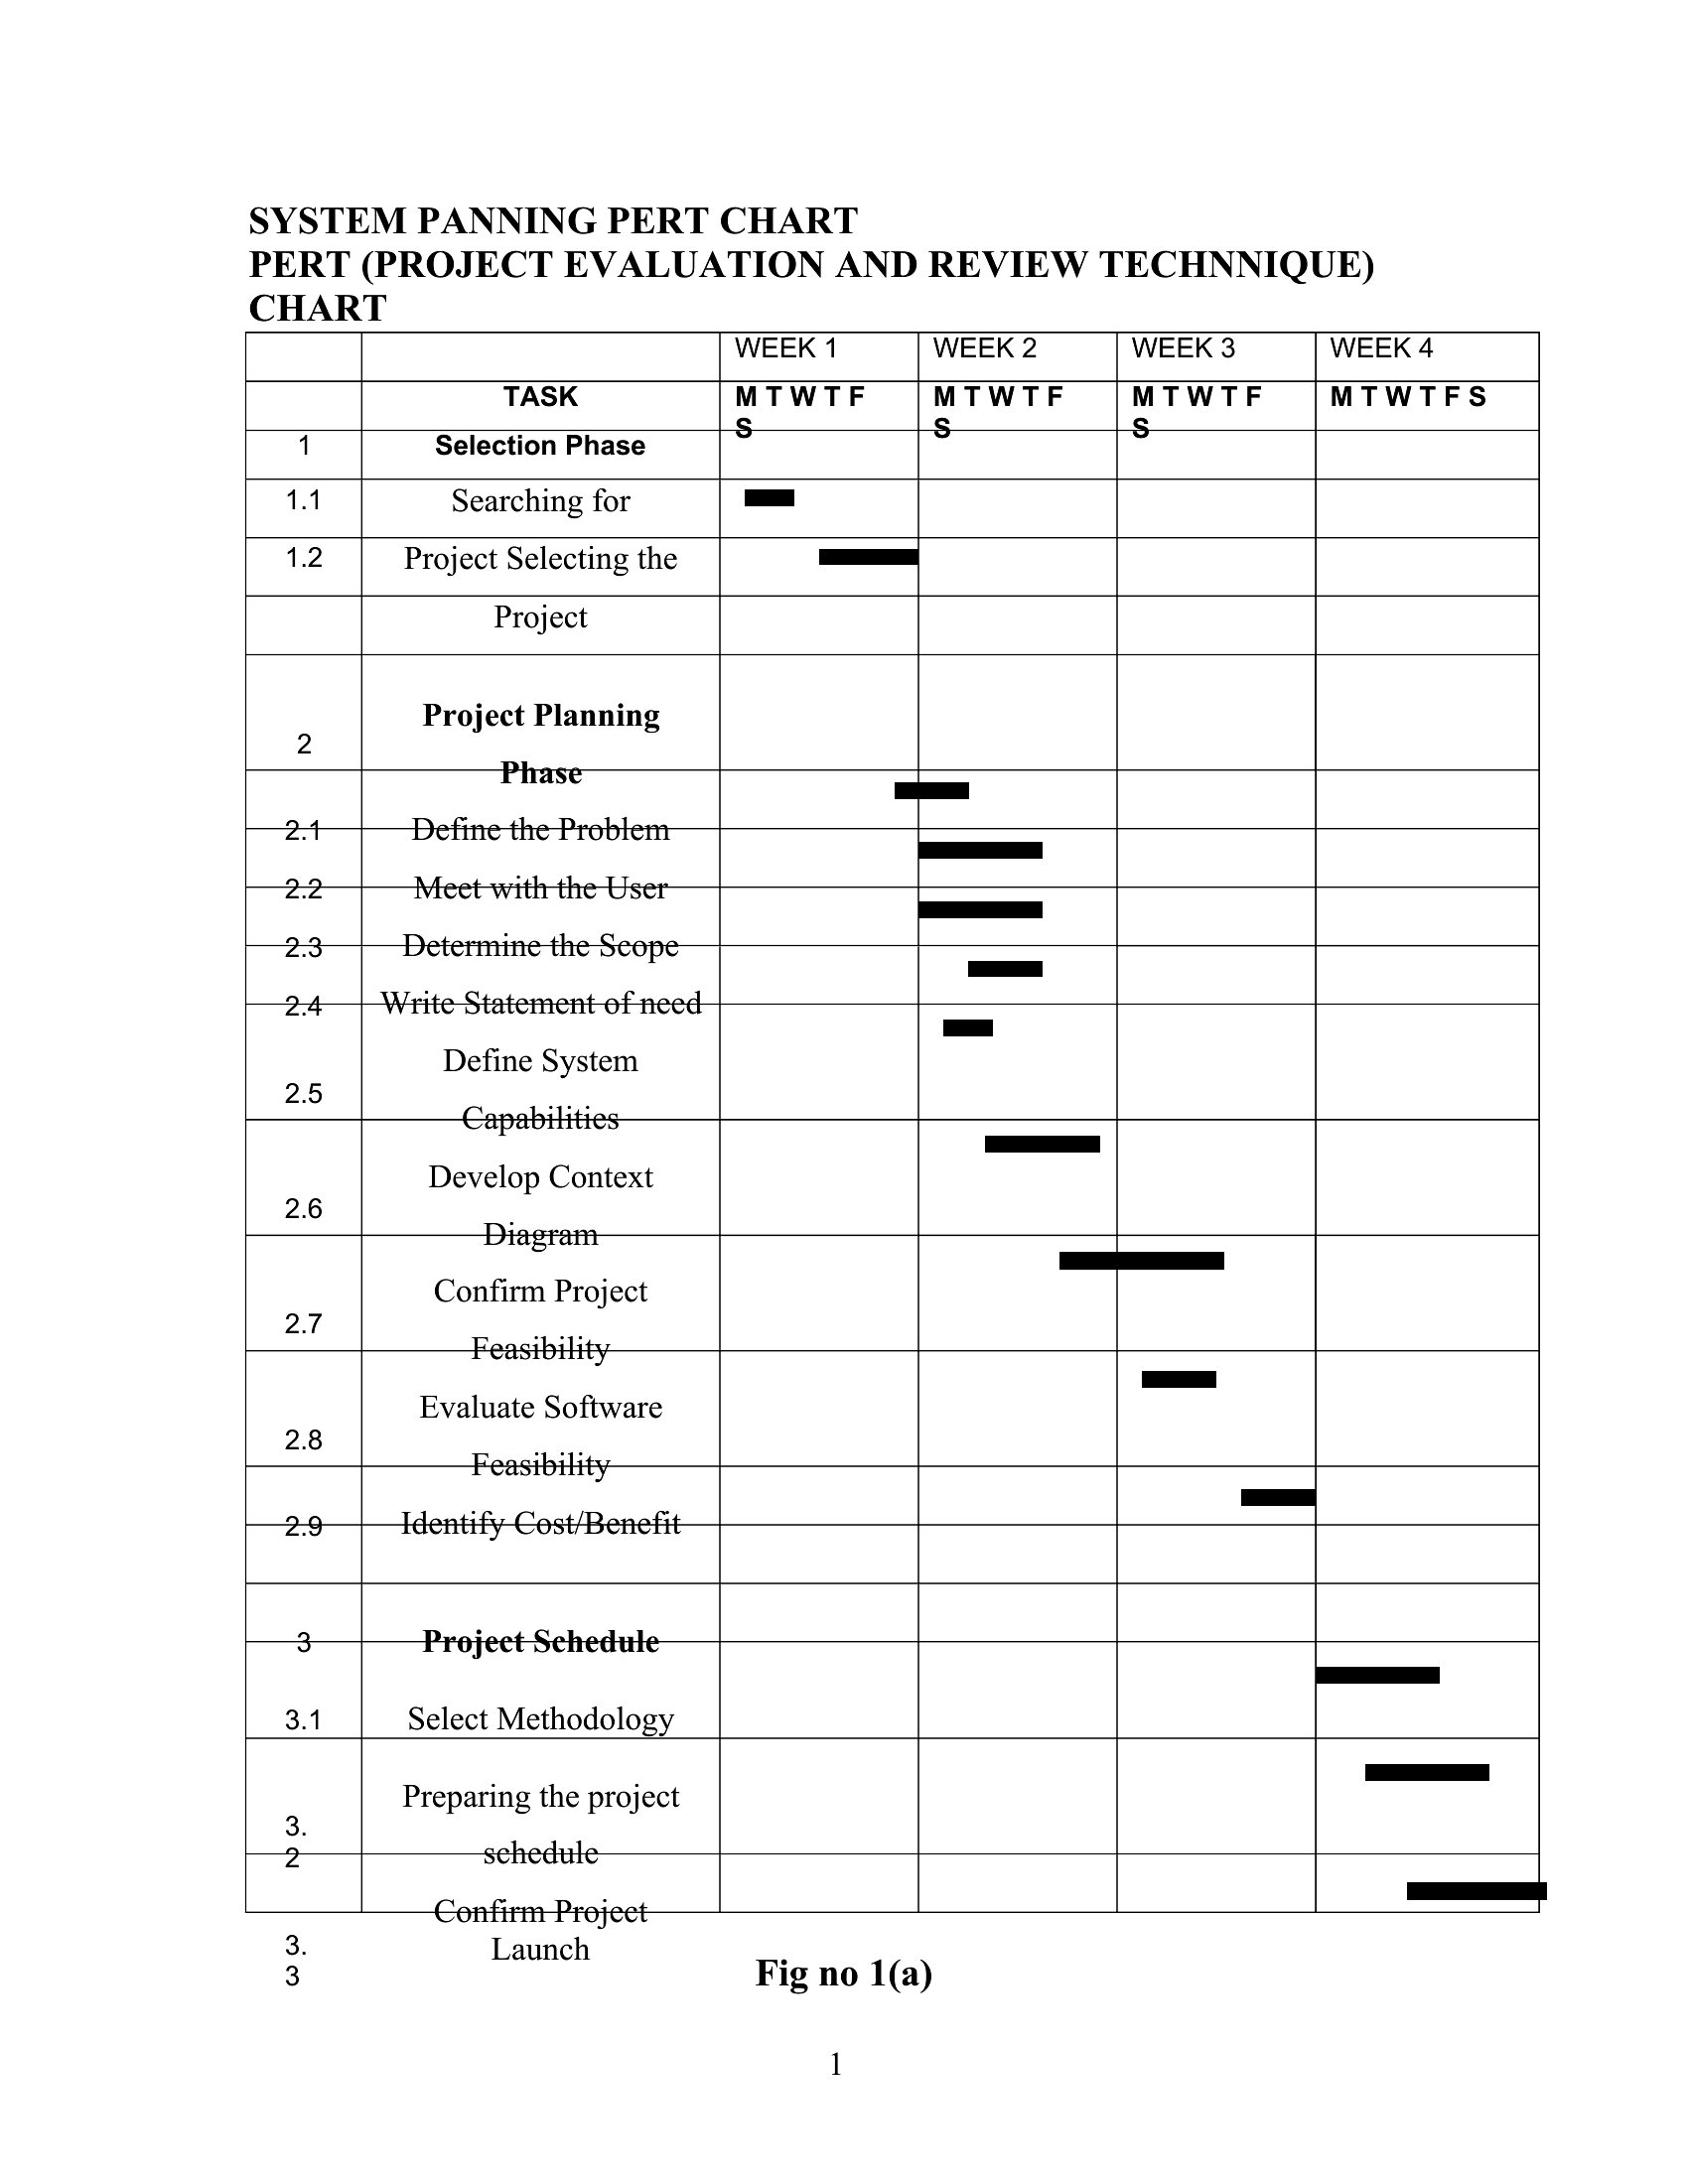
Blank Pert Chart
Frequently Asked Questions about PERT Chart Templates
Are these PERT Chart templates free to download?
Yes. Every PERT Chart template in this collection is free to download from TemplateSpark. Just open the template you need, download it, and start editing right away — no subscription required to get started.
What file formats are available for PERT Chart templates?
These PERT Chart templates are available in Word, Excel, and PDF. Pick the format that matches your workflow — each download keeps the original layout so it looks right whether you open, print, or share it.
Can I edit these PERT Chart templates?
Yes. The editable files open in Microsoft Word (and compatible apps like Google Docs or LibreOffice), so you can change the text, colors, and layout to fit your needs, then save or export the finished PERT Chart document.
How many PERT Chart templates can I choose from?
This page collects 26 PERT Chart templates so you can compare styles and layouts in one place. Browse the options, open the one that fits your purpose best, and download it in your preferred format.
Can I use PERT Chart templates for commercial purposes?
In most cases, yes — these PERT Chart templates are intended for both personal and business use. Check the license note on the template before redistributing or reselling, and avoid sharing the source files as your own product.
What is a PERT chart?
A PERT chart maps the tasks in a project and shows how they depend on one another. By laying out activities, durations, and sequences, it helps you visualize the order of work and identify the critical path, making it easier to plan schedules and manage timelines.
What is the critical path on a PERT chart?
The critical path is the longest sequence of dependent tasks that determines the shortest possible project duration. Tasks on it have no slack, so any delay pushes the whole project back. Identifying it helps managers focus attention on the activities that most affect the deadline.
What is the difference between a PERT chart and a Gantt chart?
A PERT chart shows tasks as nodes connected by arrows to emphasize dependencies and sequence, useful for planning. A Gantt chart displays tasks as horizontal bars along a calendar to show timing and overlap. PERT highlights relationships, while Gantt highlights schedule and progress over time.
Comments
Join the conversation
Sign in to share your thoughts and leave a comment on this resource.