
Free Break-Even Analysis Templates (Word, Excel, PDF)
Analysis by nadislavaskidan
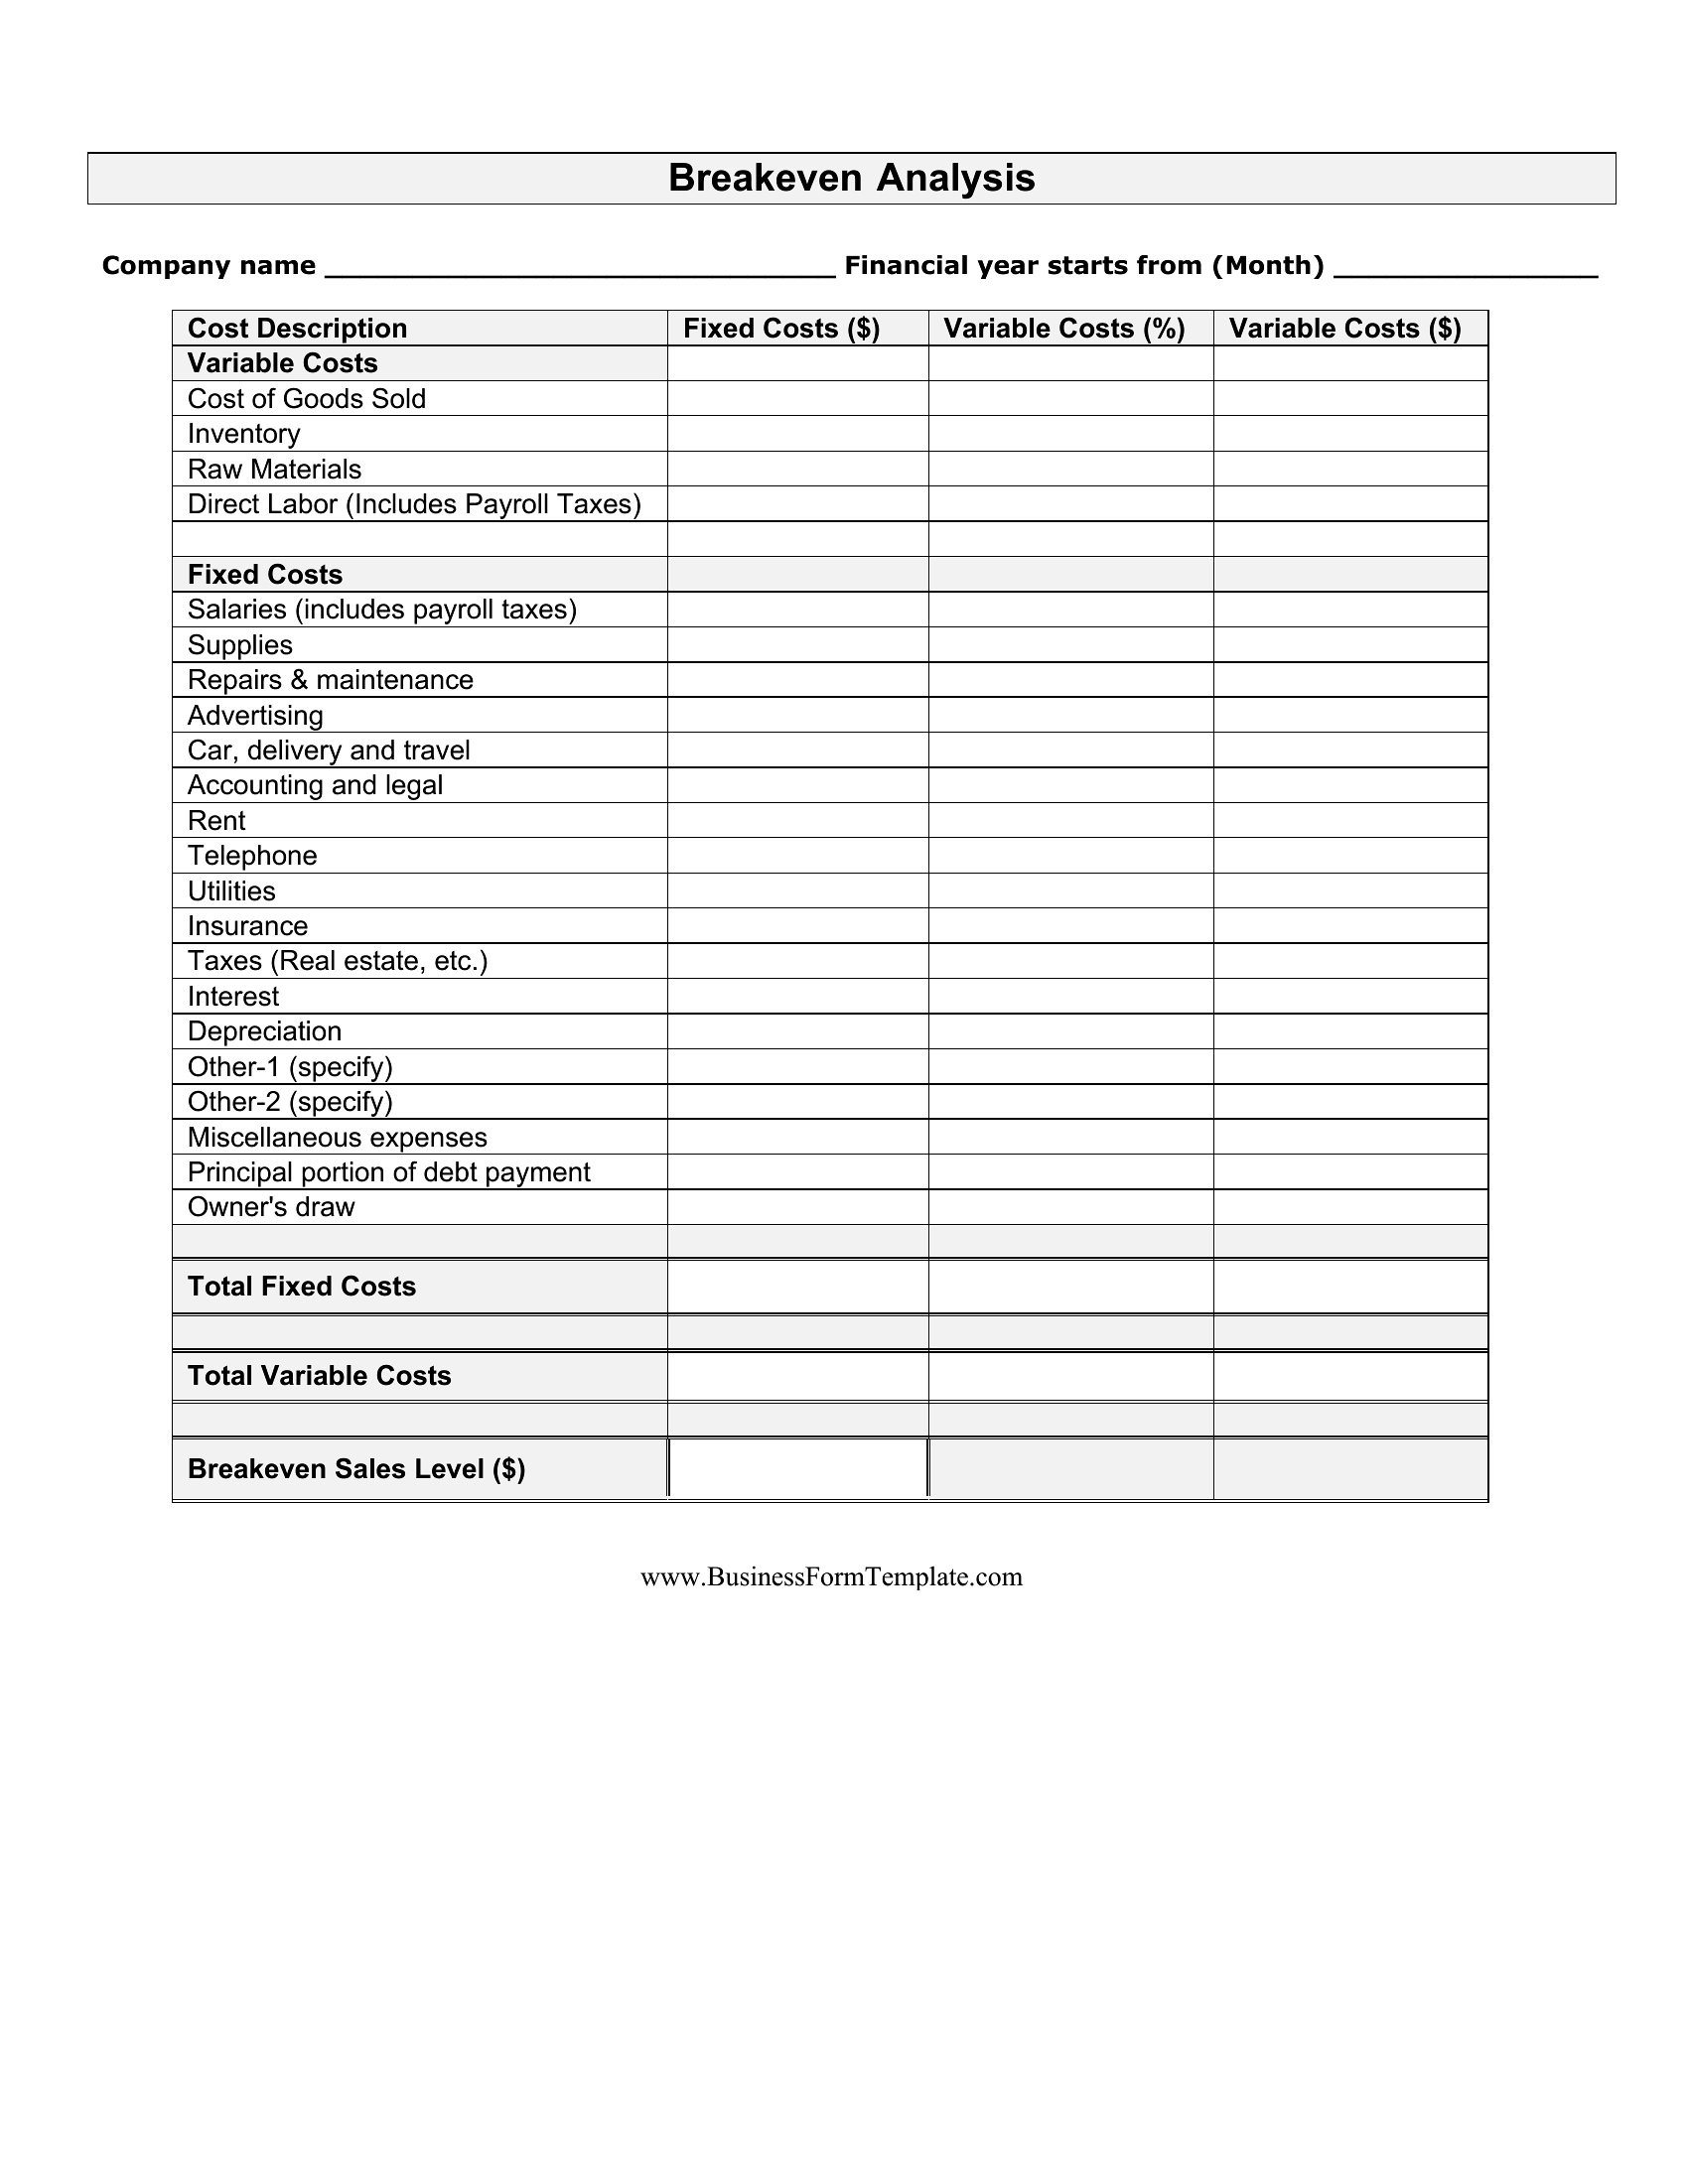
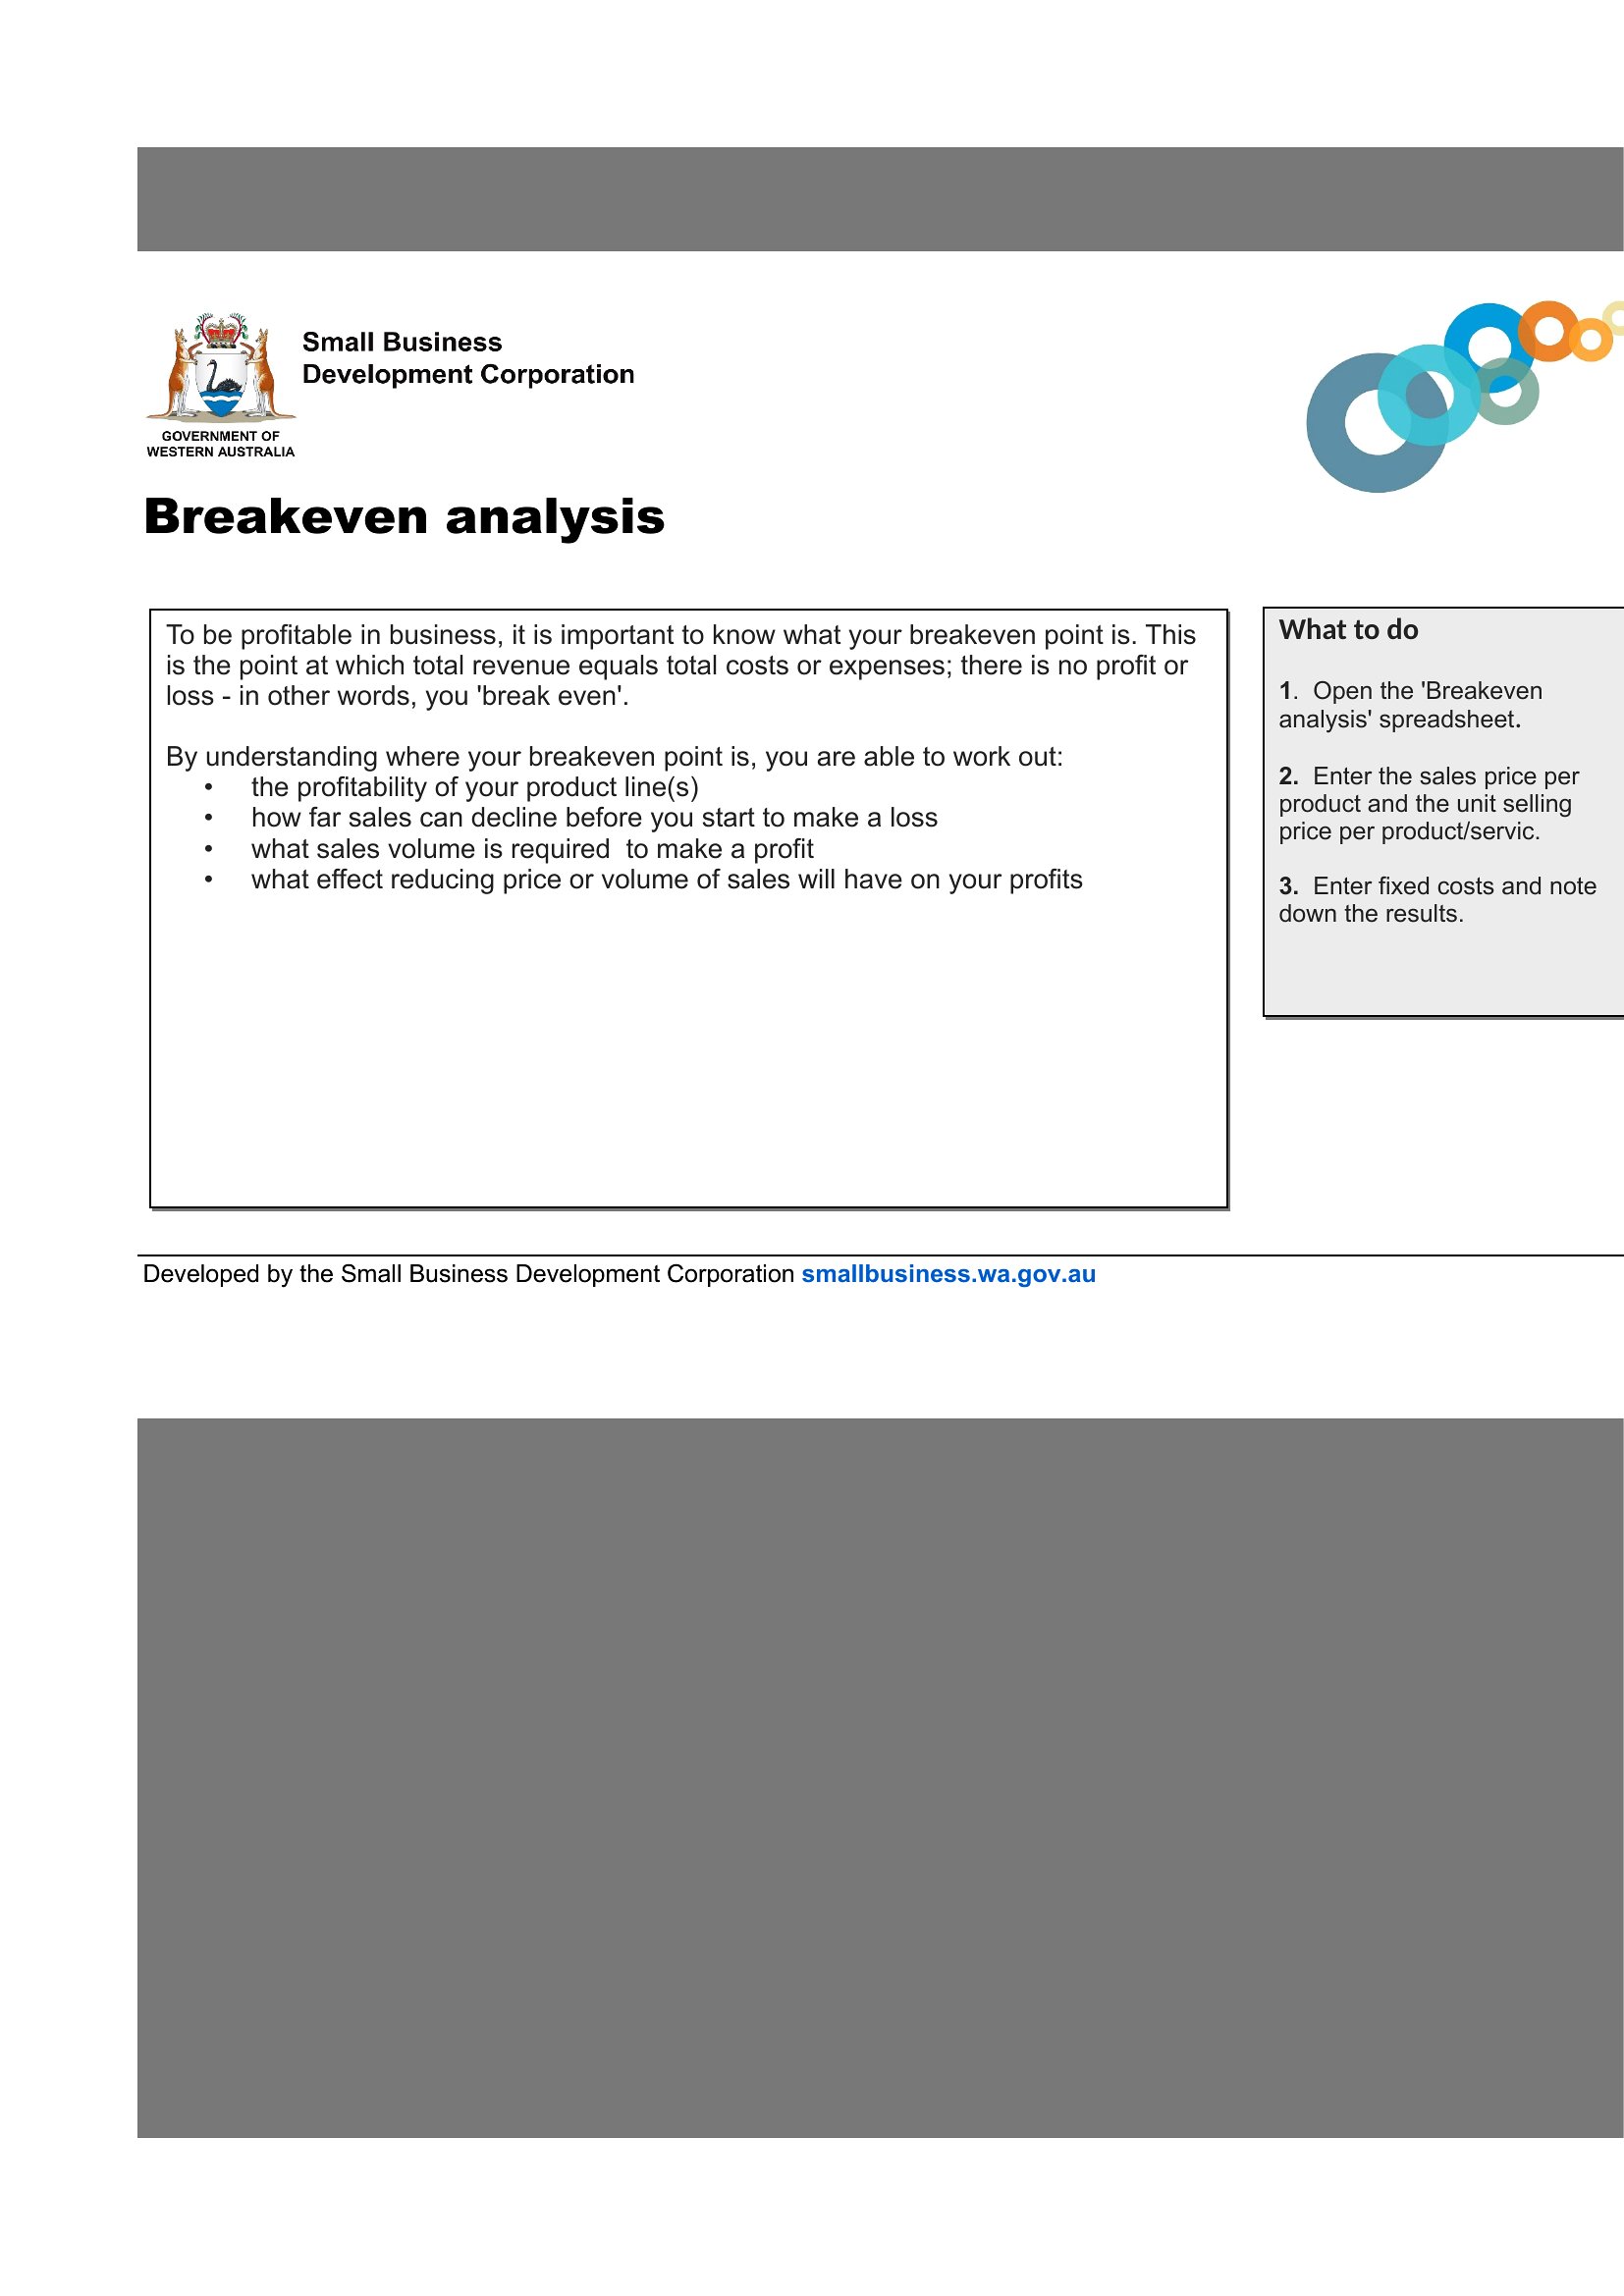
Knowing how many units you have to sell before you start making money is one of the first questions any business should answer. This collection of 45 break-even analysis templates helps founders, students, and small-business owners weigh fixed costs, variable costs, and pricing to find that tipping point. Some are simple calculators, while others chart the break-even point so it's easy to see and explain.
Excel versions do the math as you adjust your numbers, while Word and PDF layouts work well in a business plan or report. Plug in your costs, set a price, and watch where revenue overtakes expenses. Treat the results as planning estimates, then download the template that fits your business and run the numbers.
When to use this Break-Even Analysis template
- A startup founder assessing whether a new product line can cover its $30,000 monthly rent and $15,000 in payroll before launching a marketing campaign—these templates let them test different price points and volume targets.
- A small-business owner reviewing a seasonal product (like holiday candles) to determine if selling 500 units at $25 each will offset the $7,000 upfront mold cost before inventory arrives.
- A student writing a finance paper comparing break-even points for two competing fast-food chains, using visual graphs to illustrate how menu pricing and ingredient costs differ.
- A nonprofit executive calculating how many sponsorships or memberships are needed before a new community center program covers its $12,000 monthly utilities and staffing costs.
Which format should I download?
Choose Word if you need to embed the break-even analysis within a longer business plan or investor pitch deck, where editable text and explanations matter. Excel is ideal for dynamic calculations—use it when testing dozens of scenarios with variable costs or sales volumes. Stick with PDF if you’re distributing a polished, finalized report to stakeholders who shouldn’t modify the data. For teams collaborating, Excel’s shared-workbook feature ensures real-time updates.
Choose from 45 Break-Even Analysis Templates
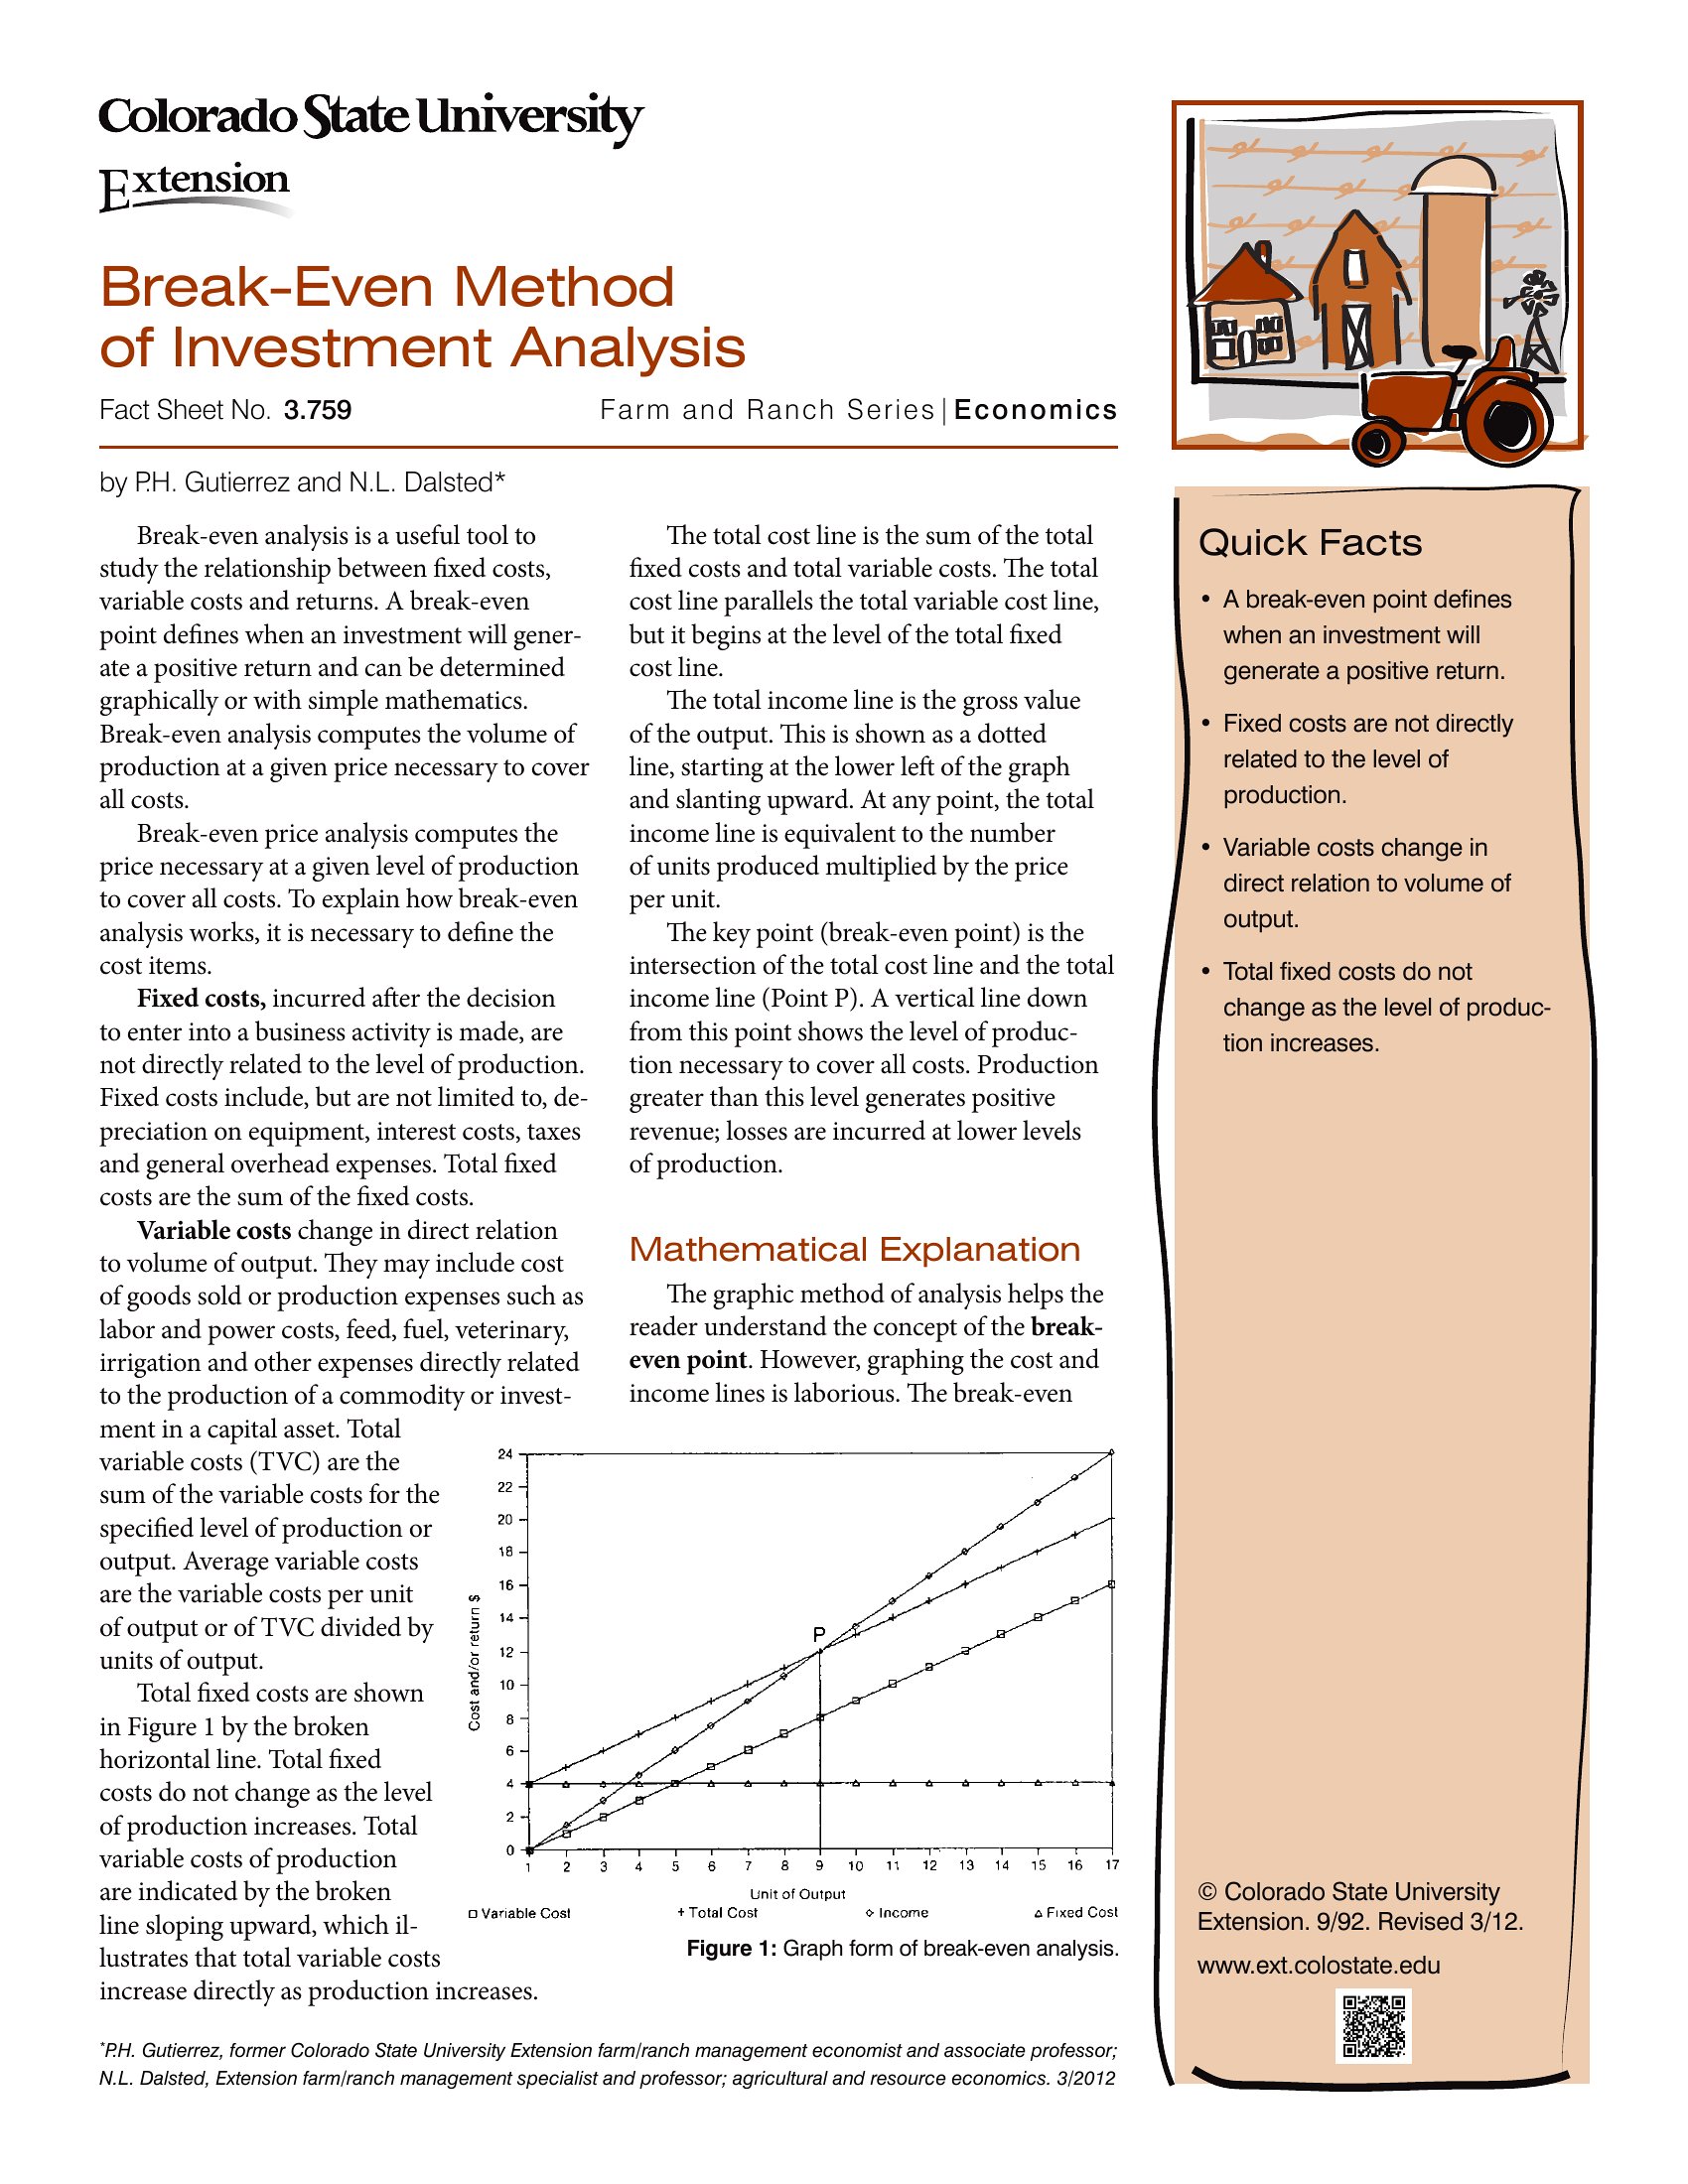
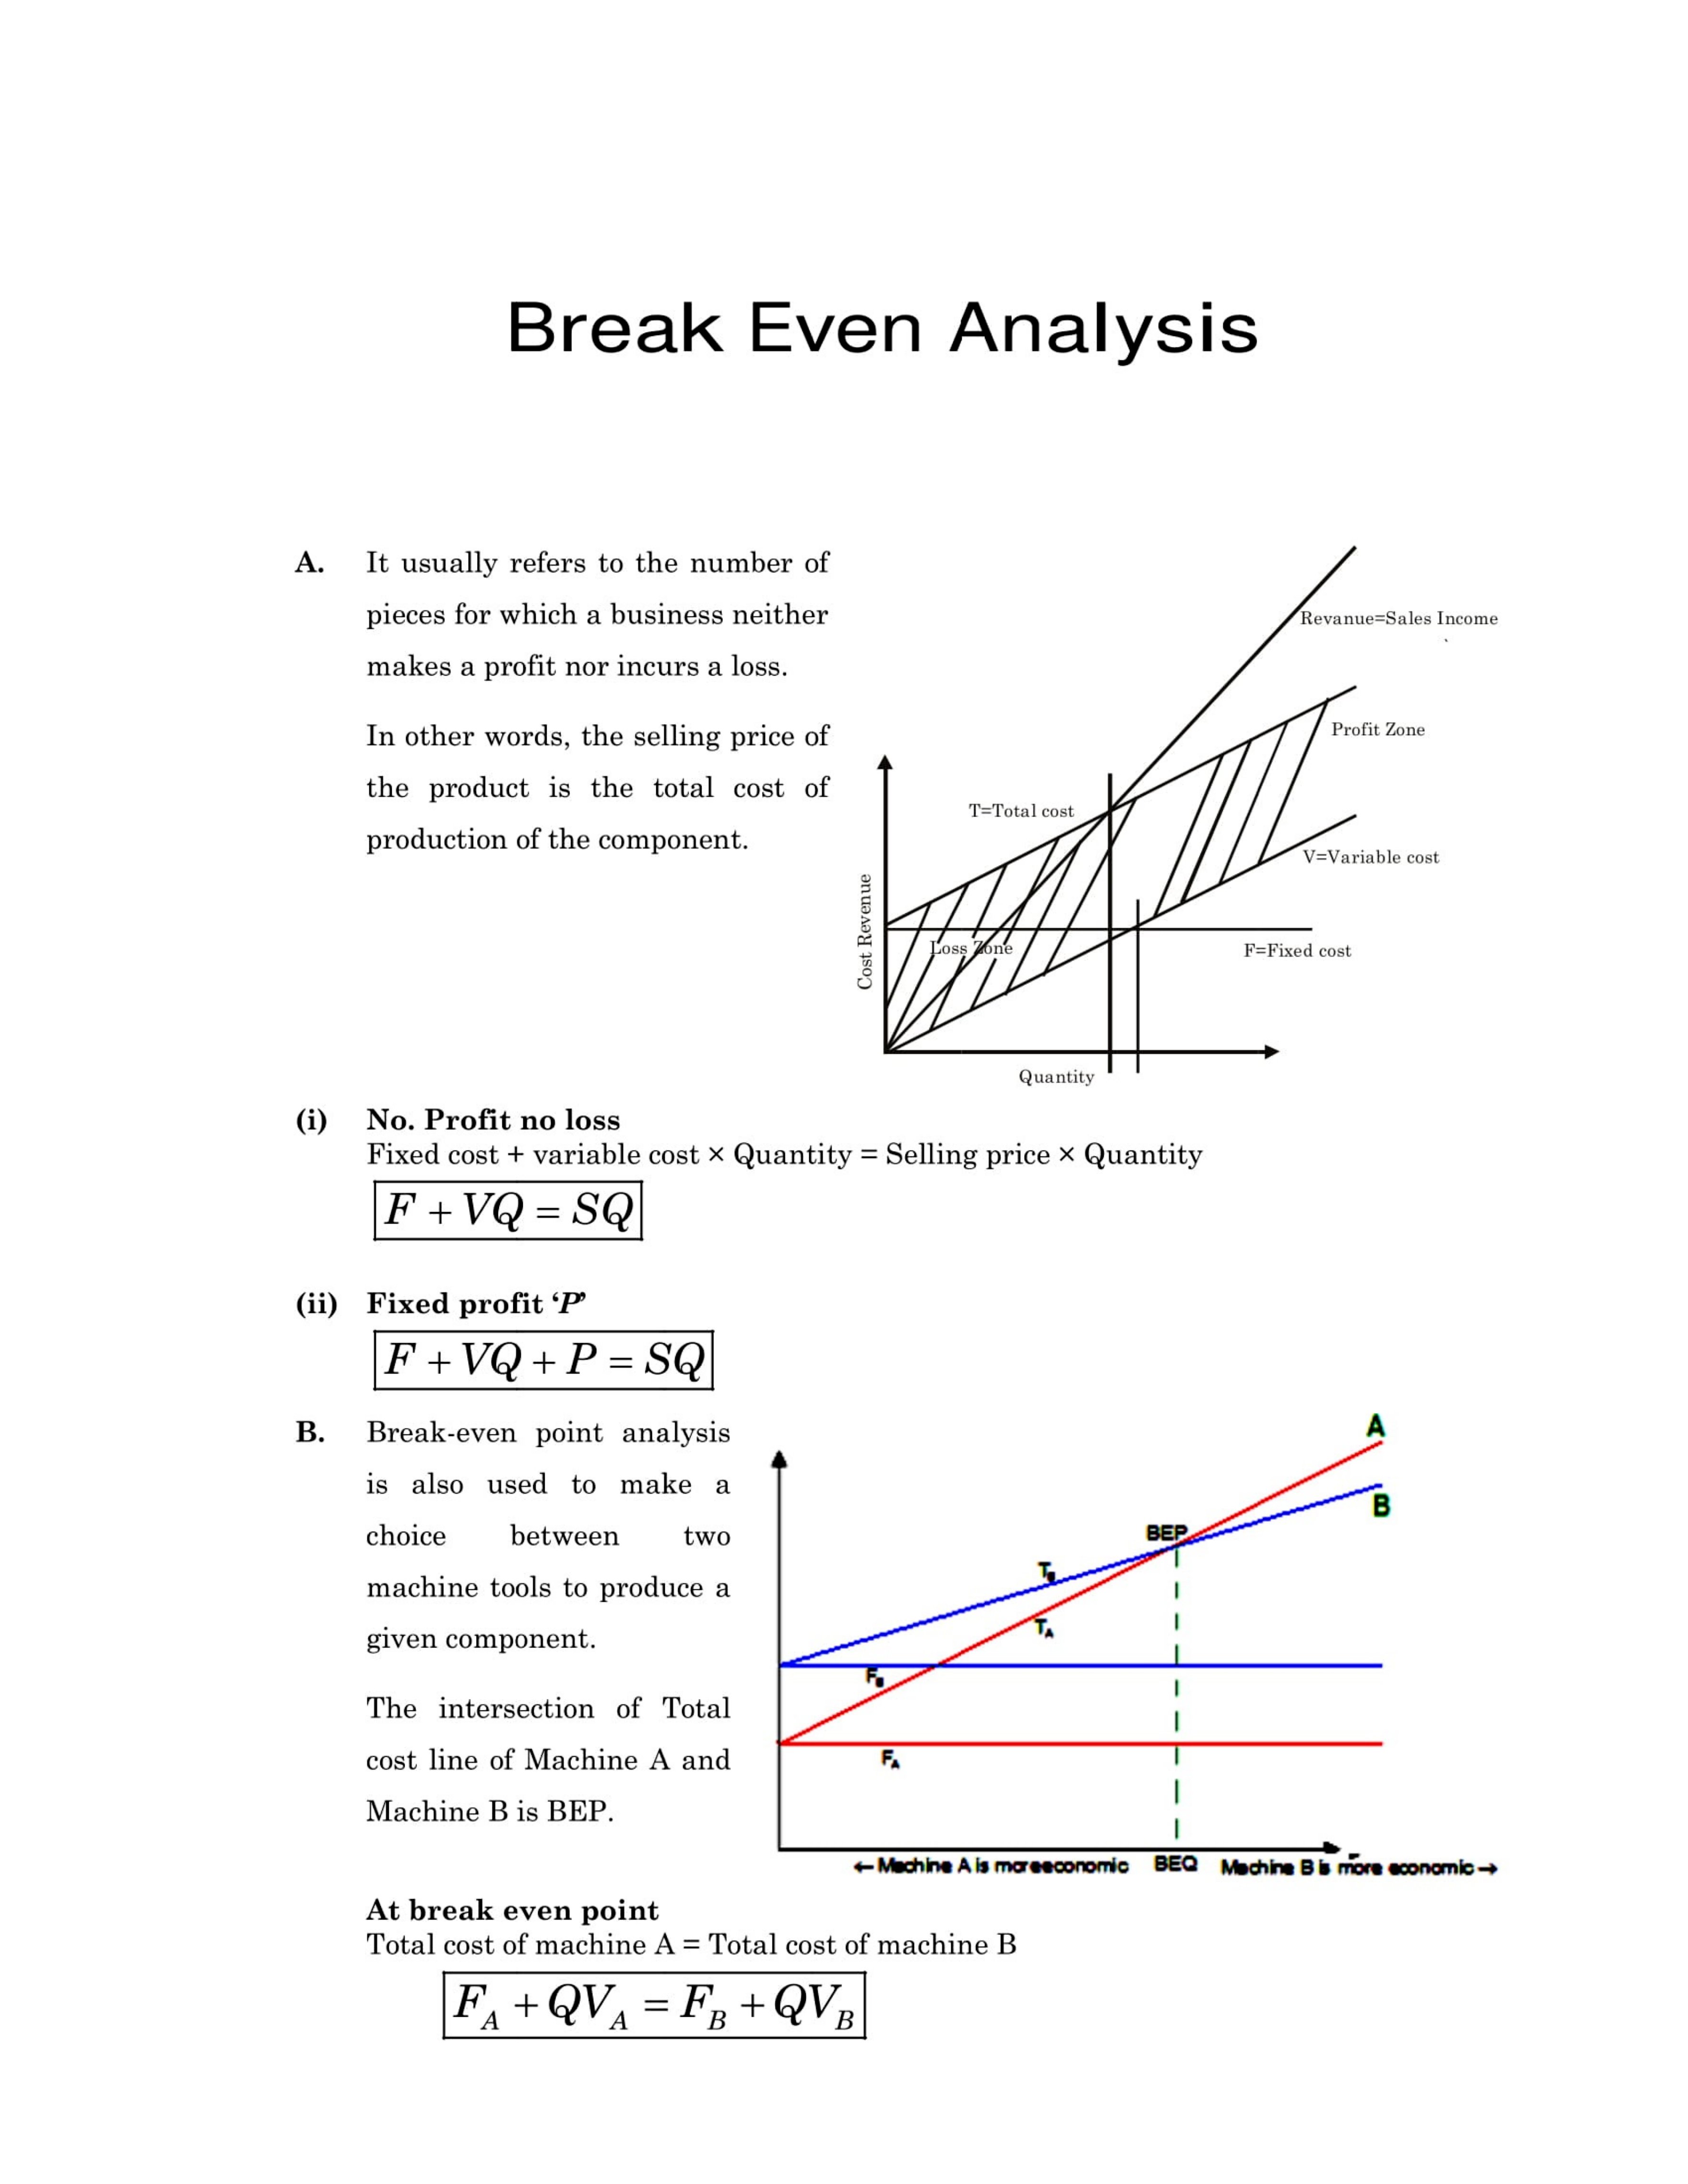
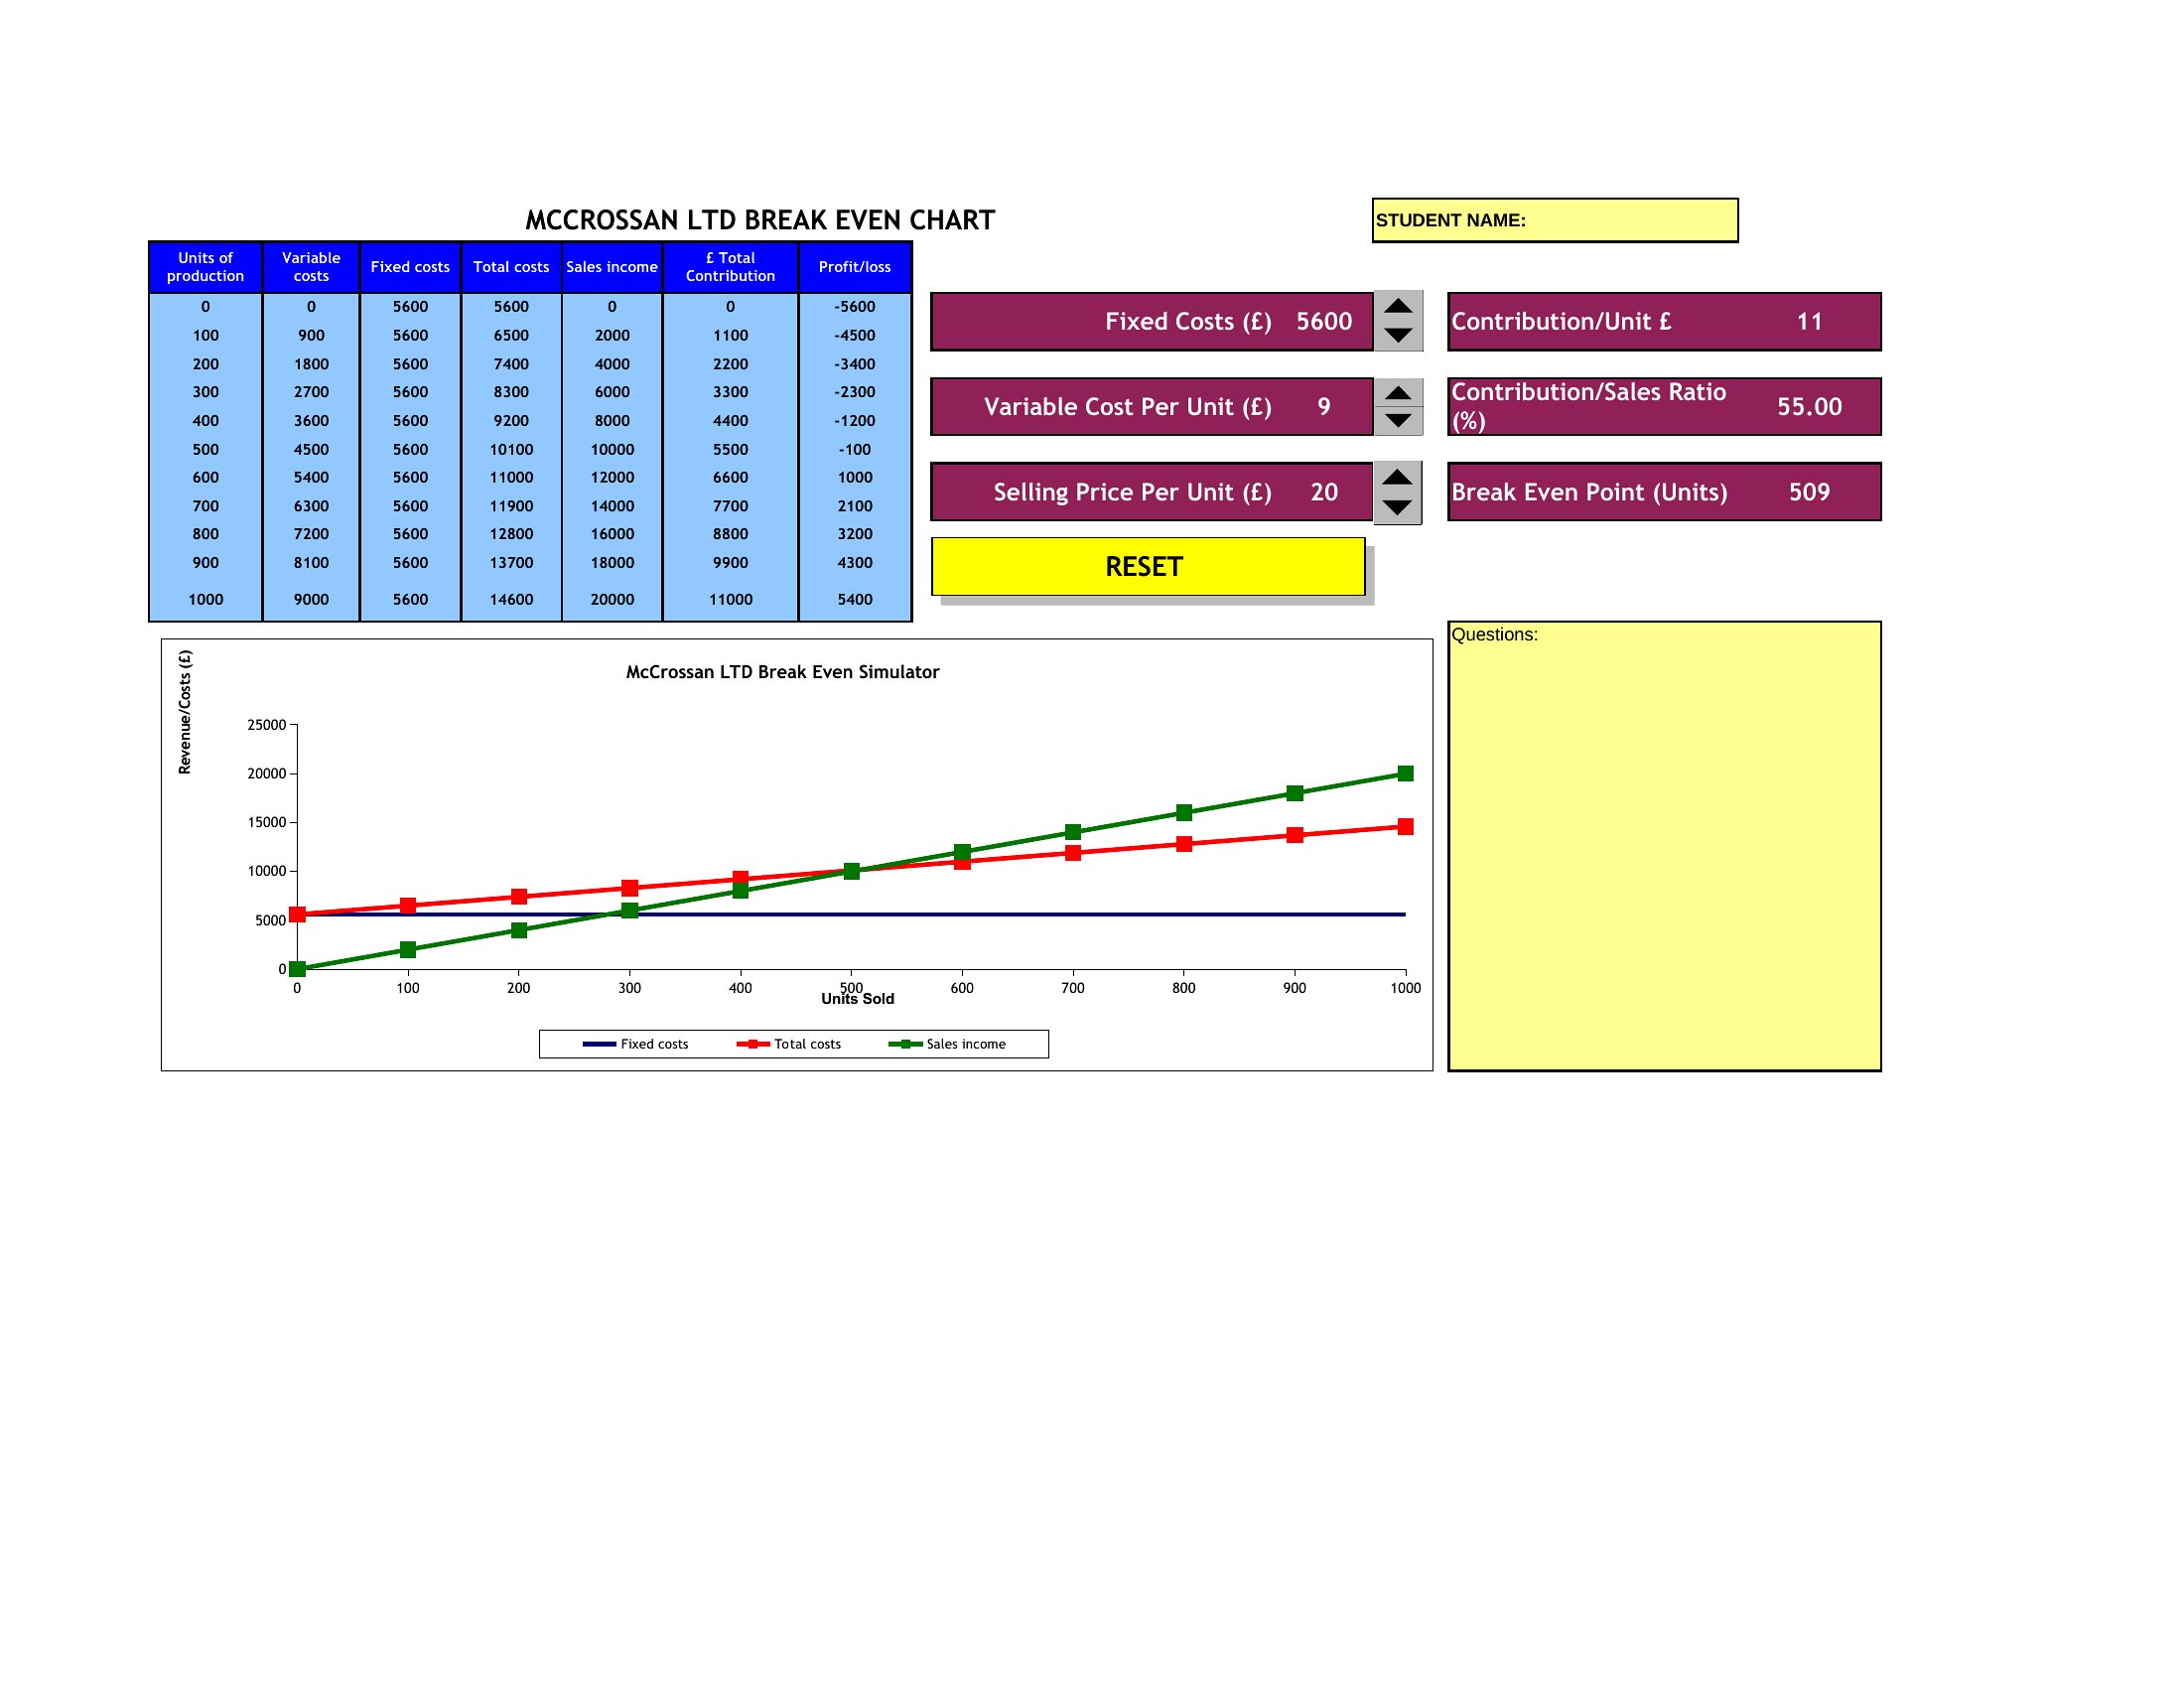
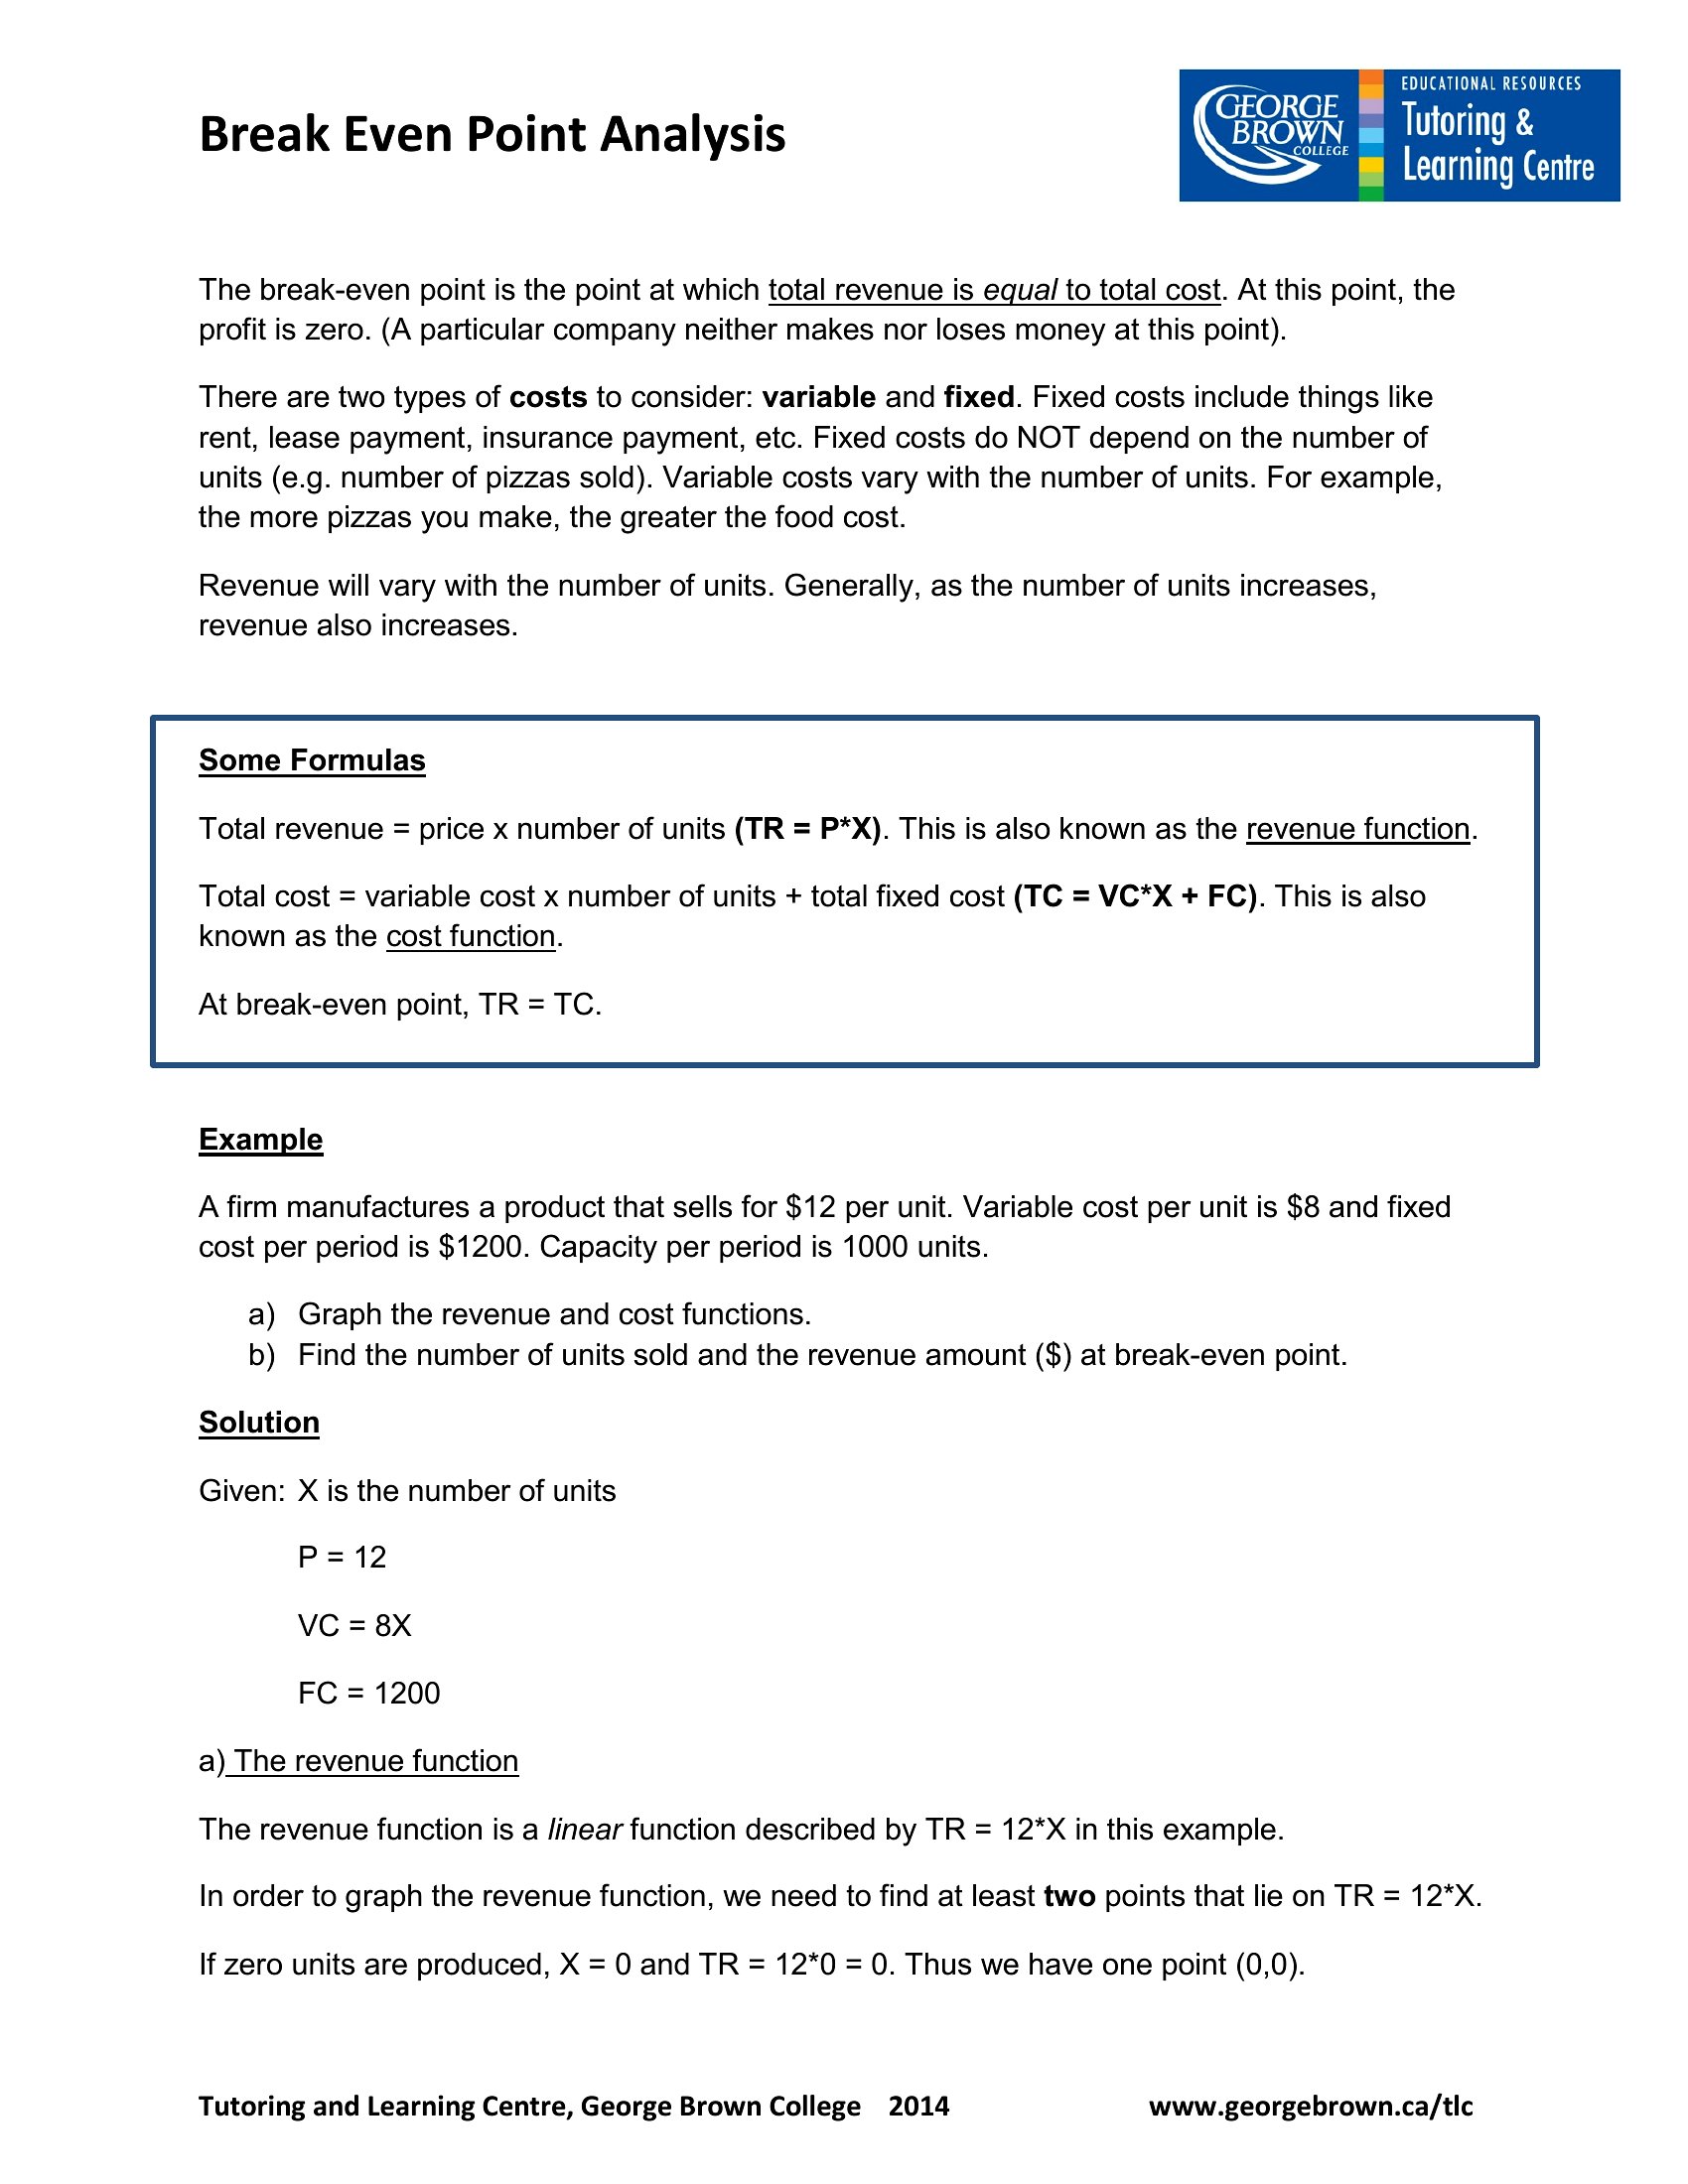
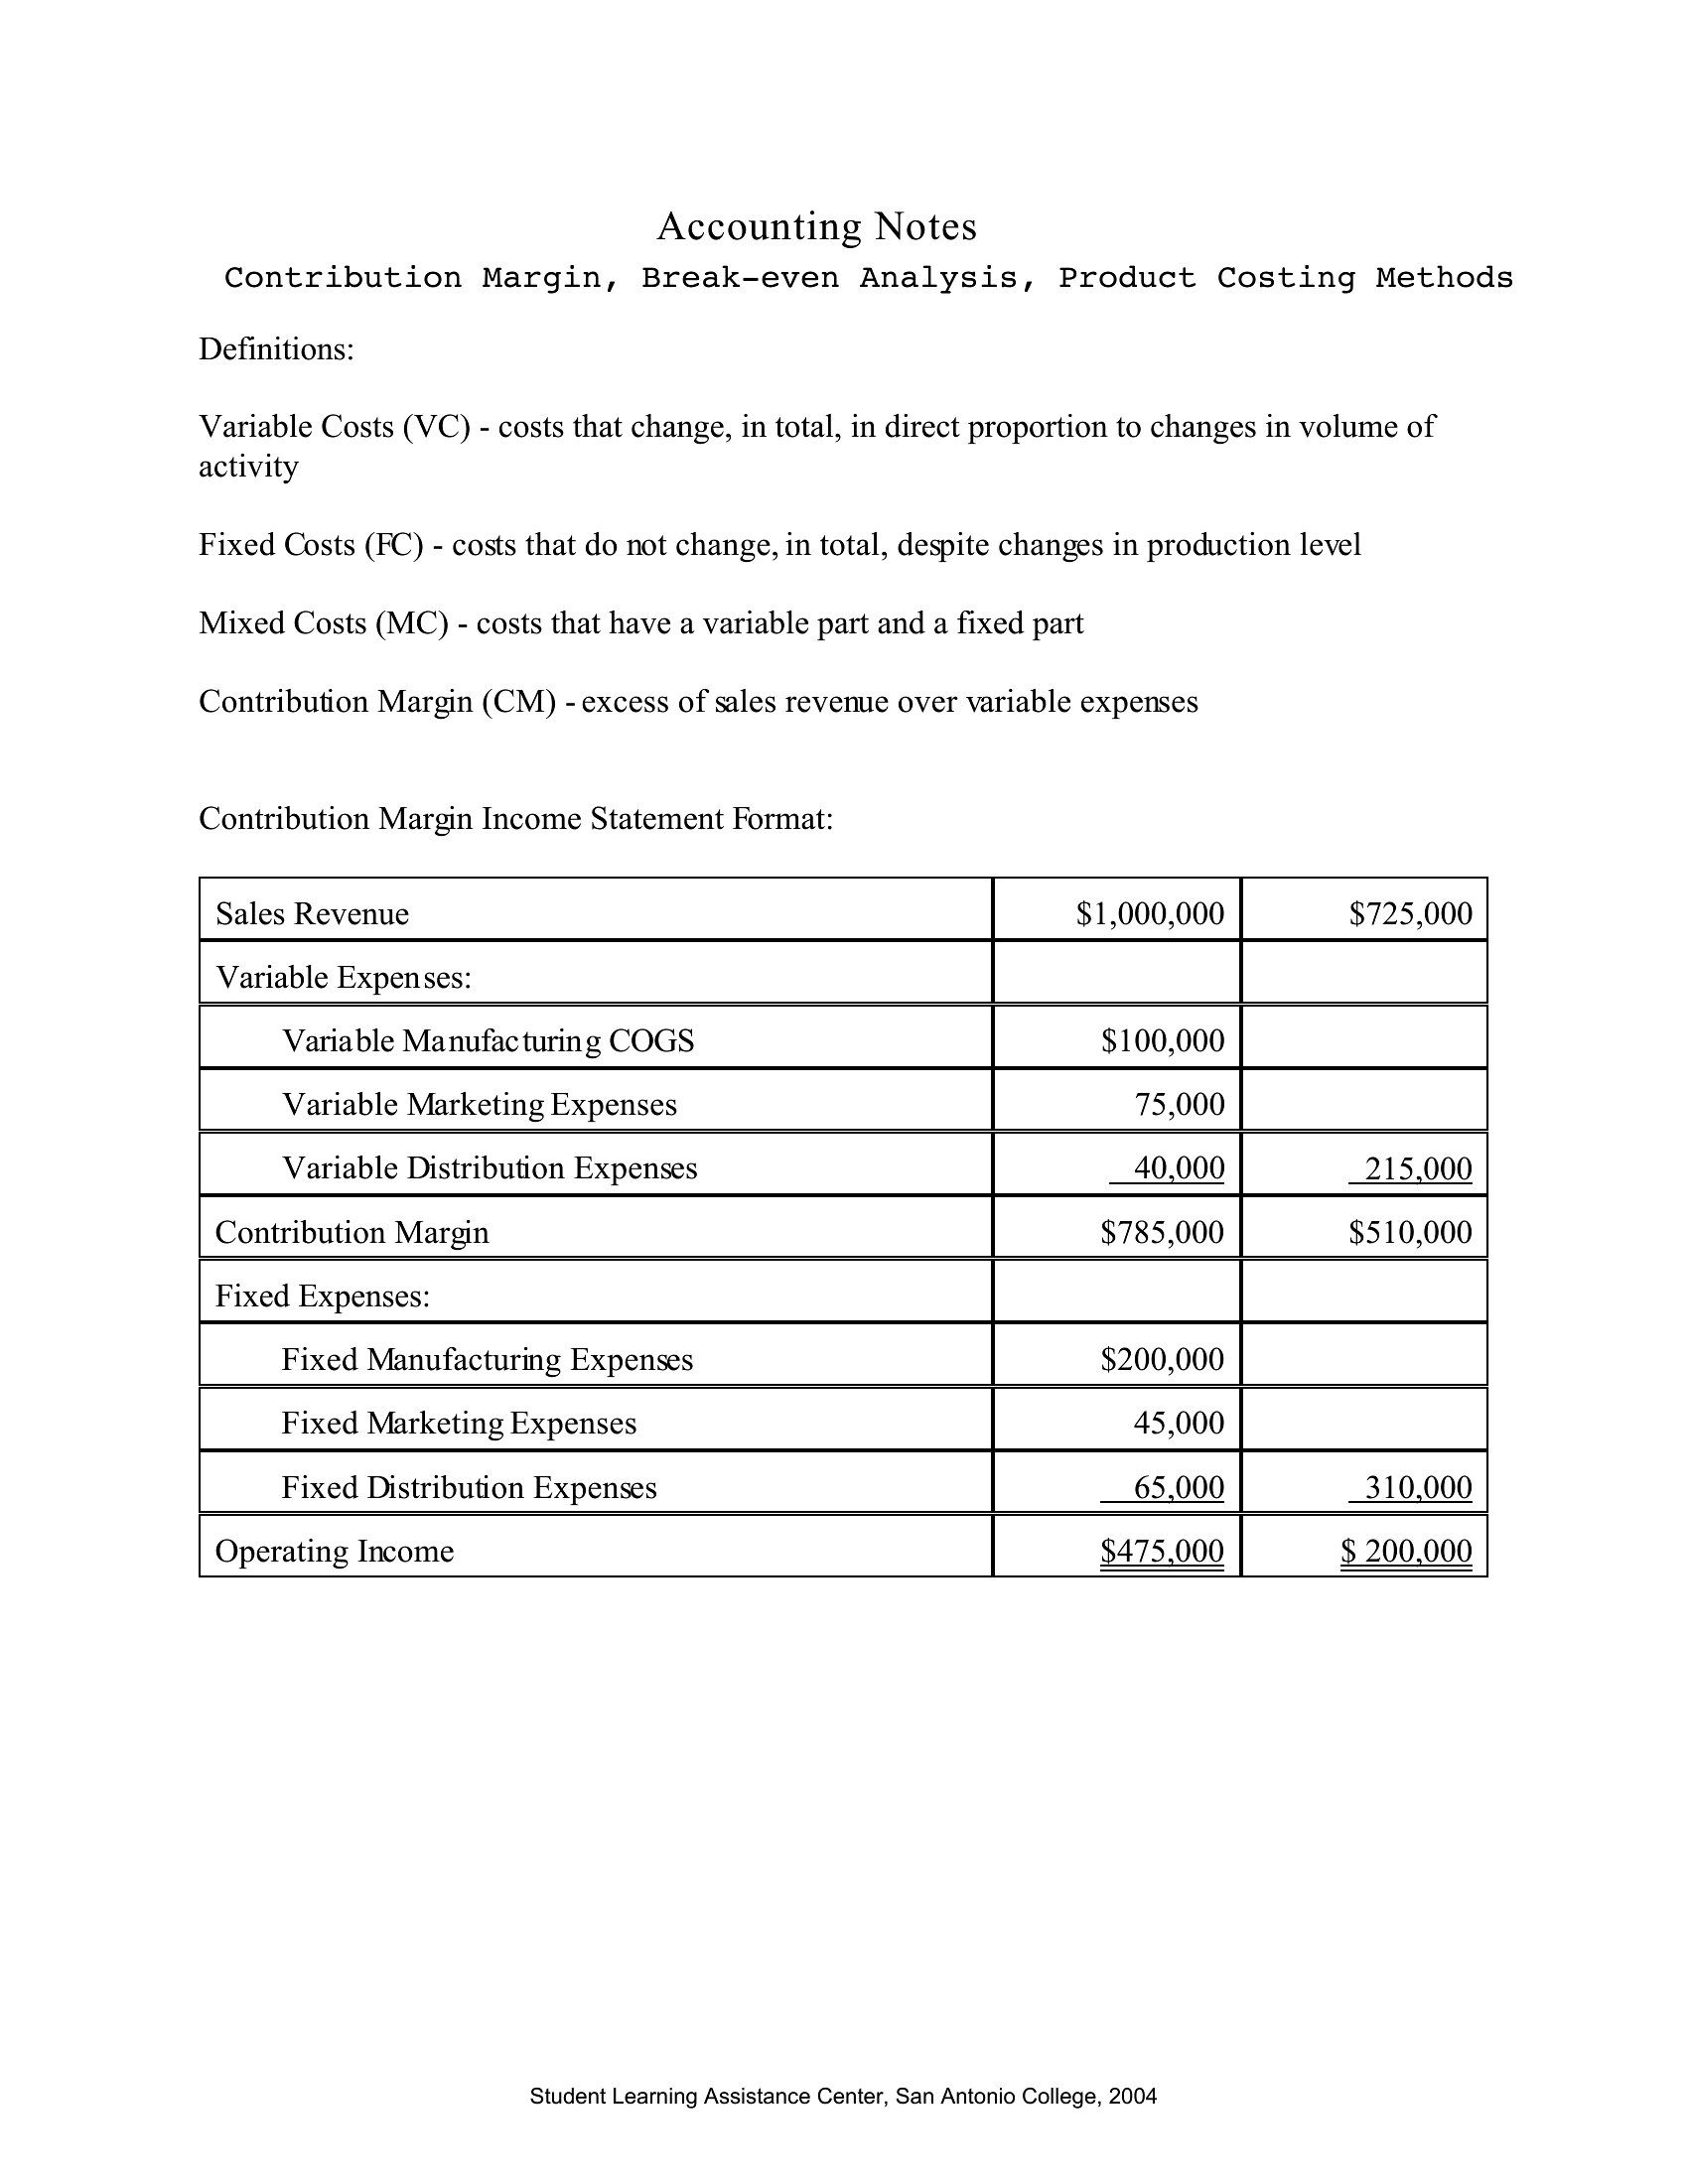
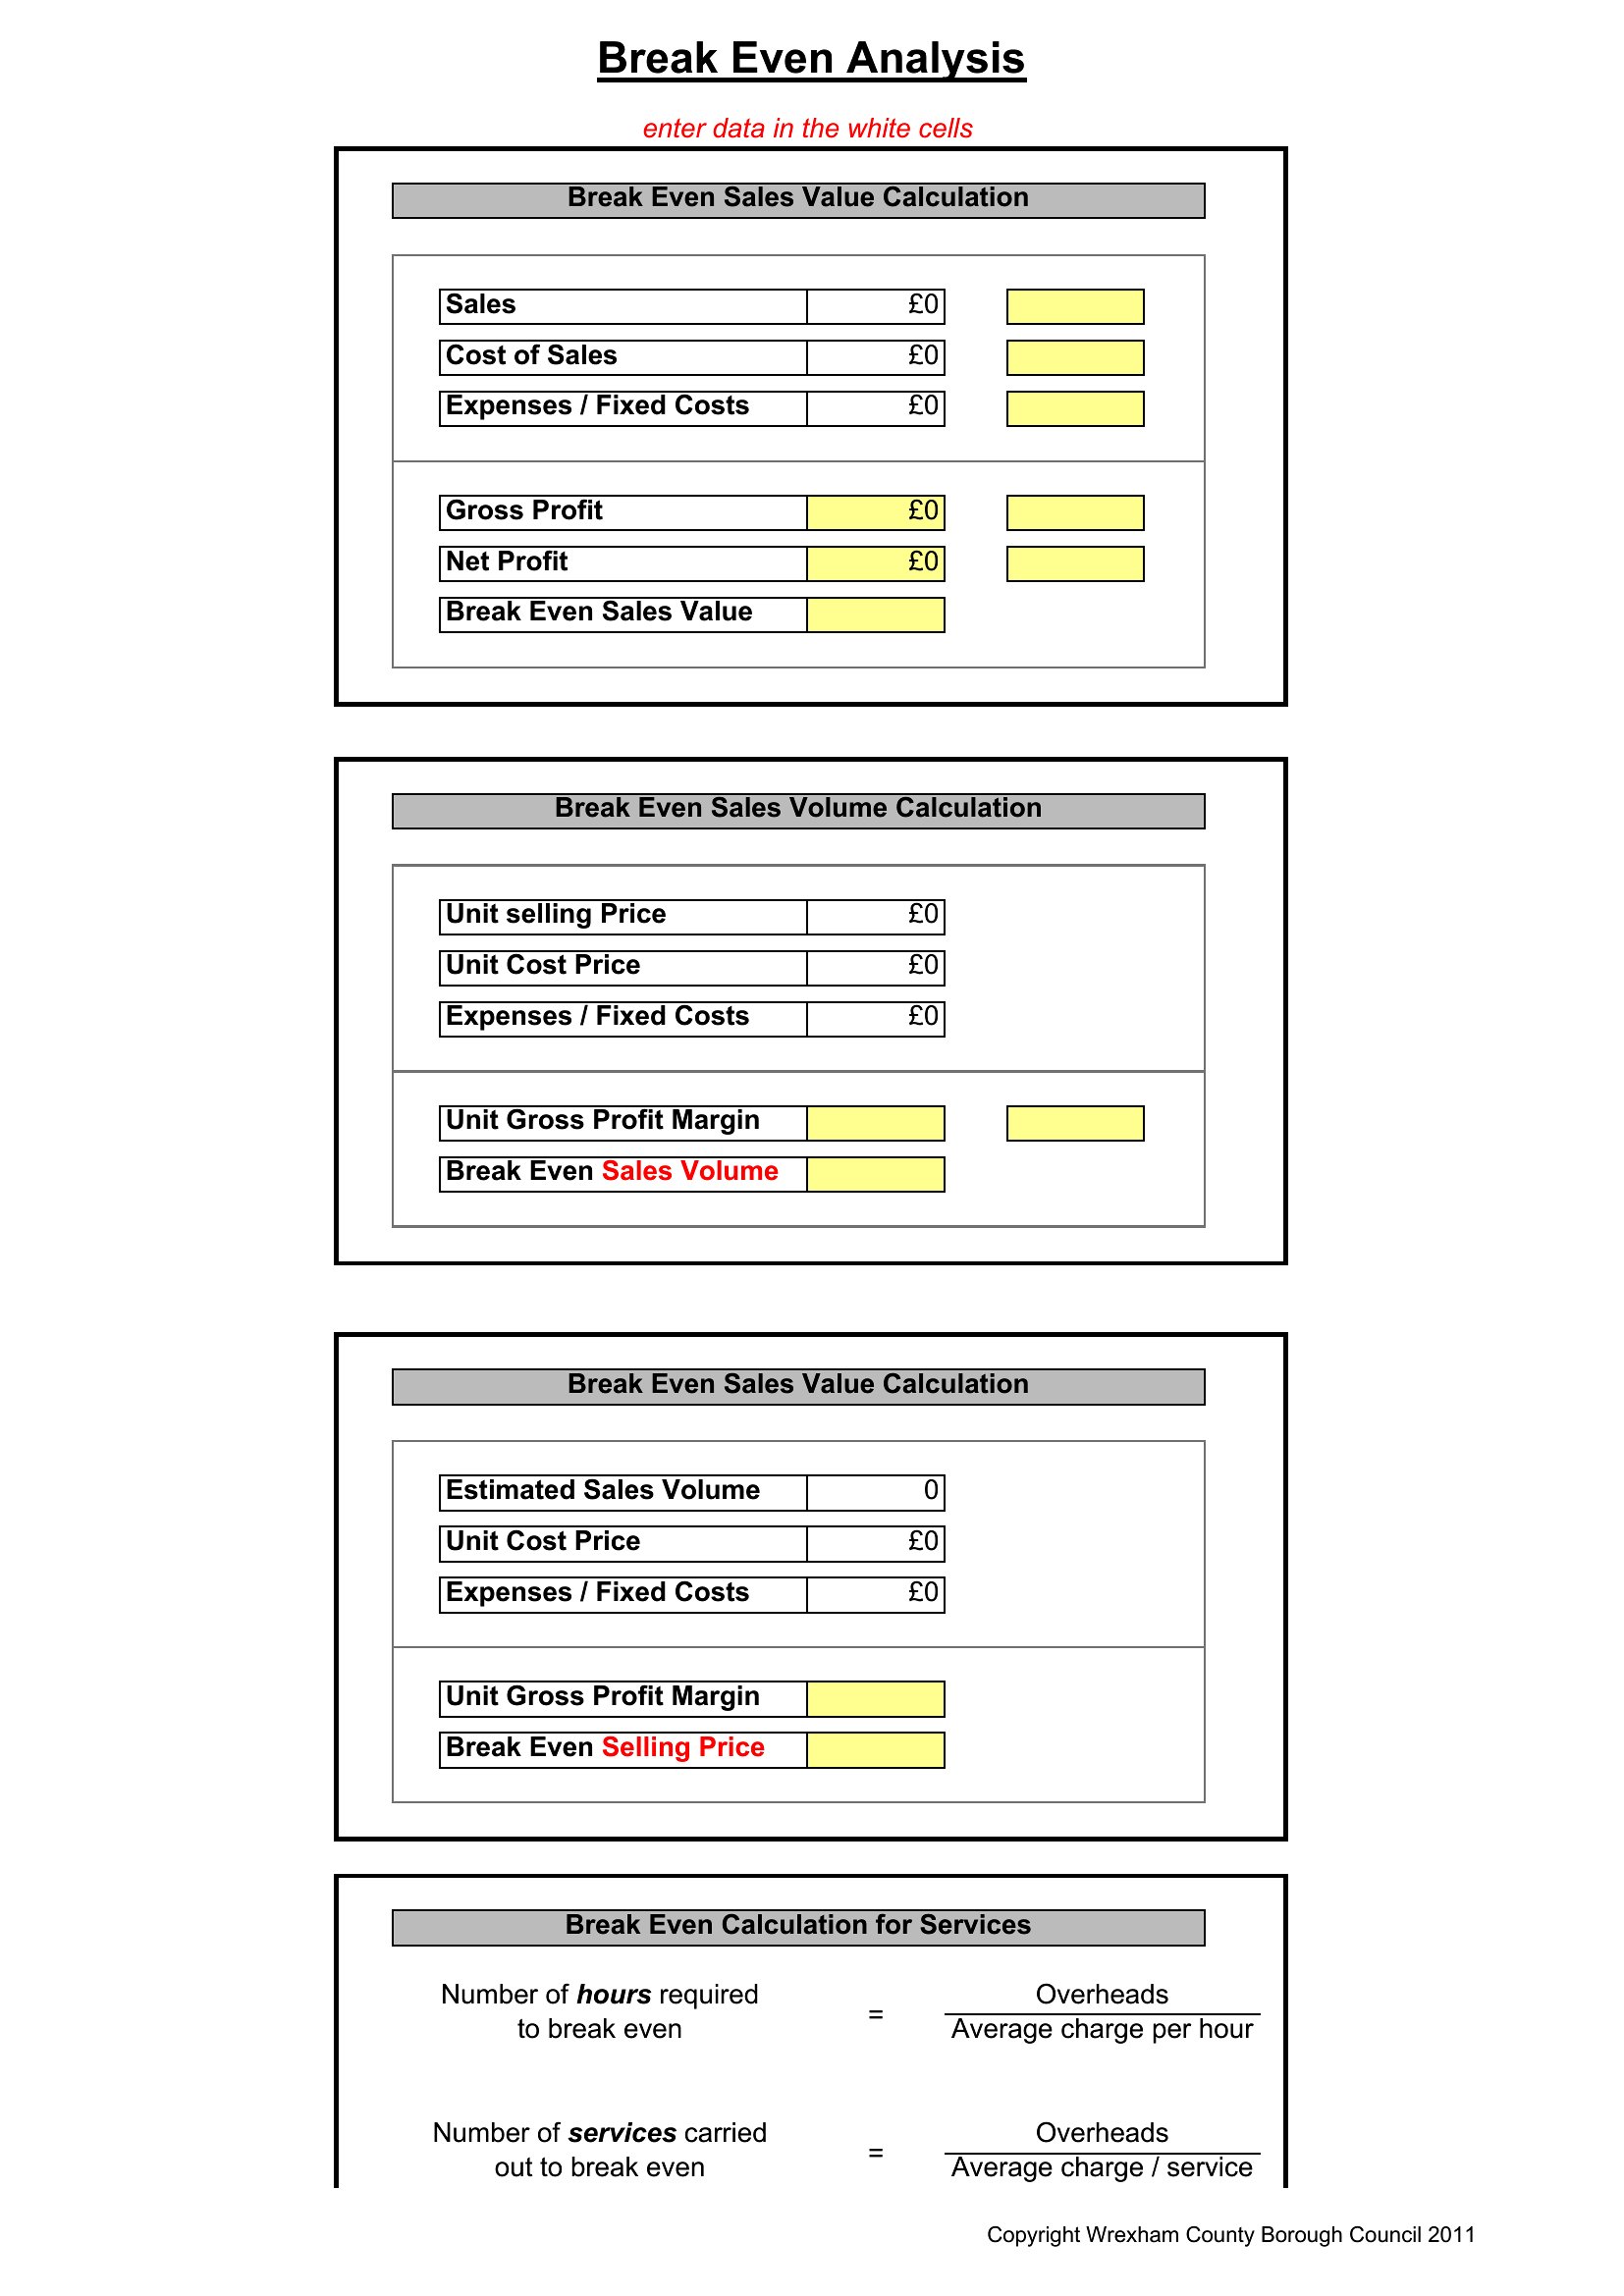
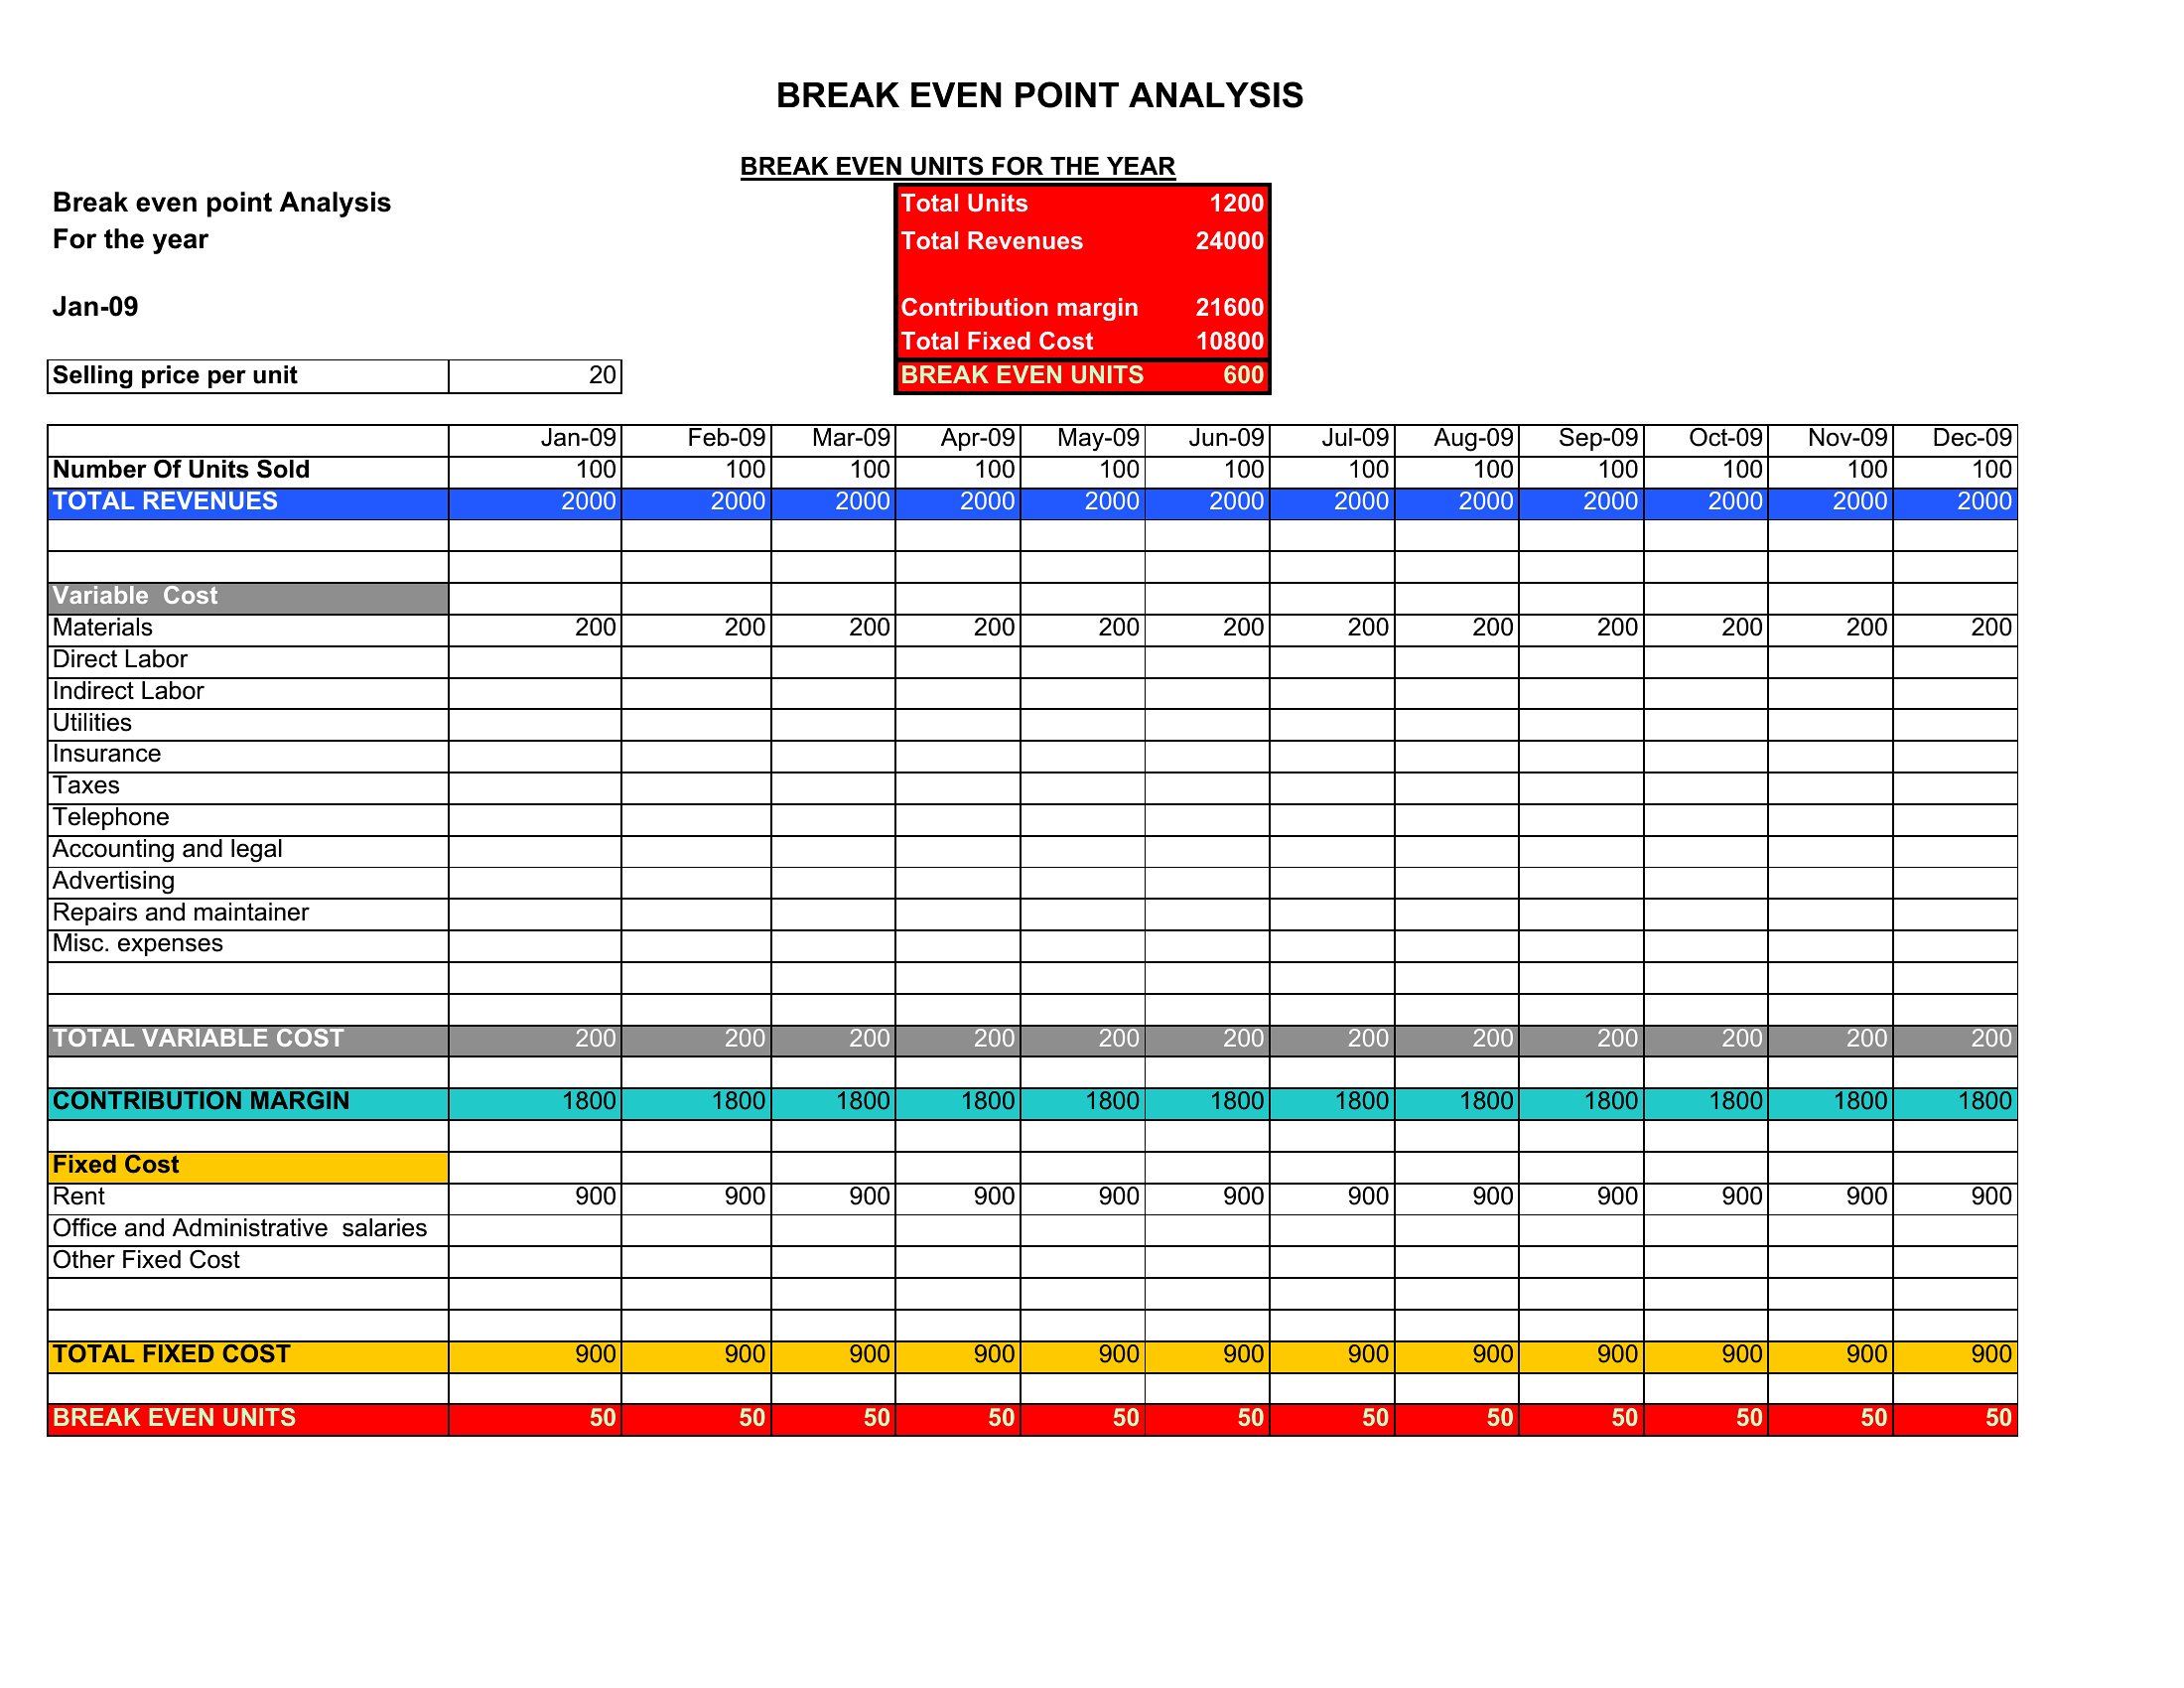
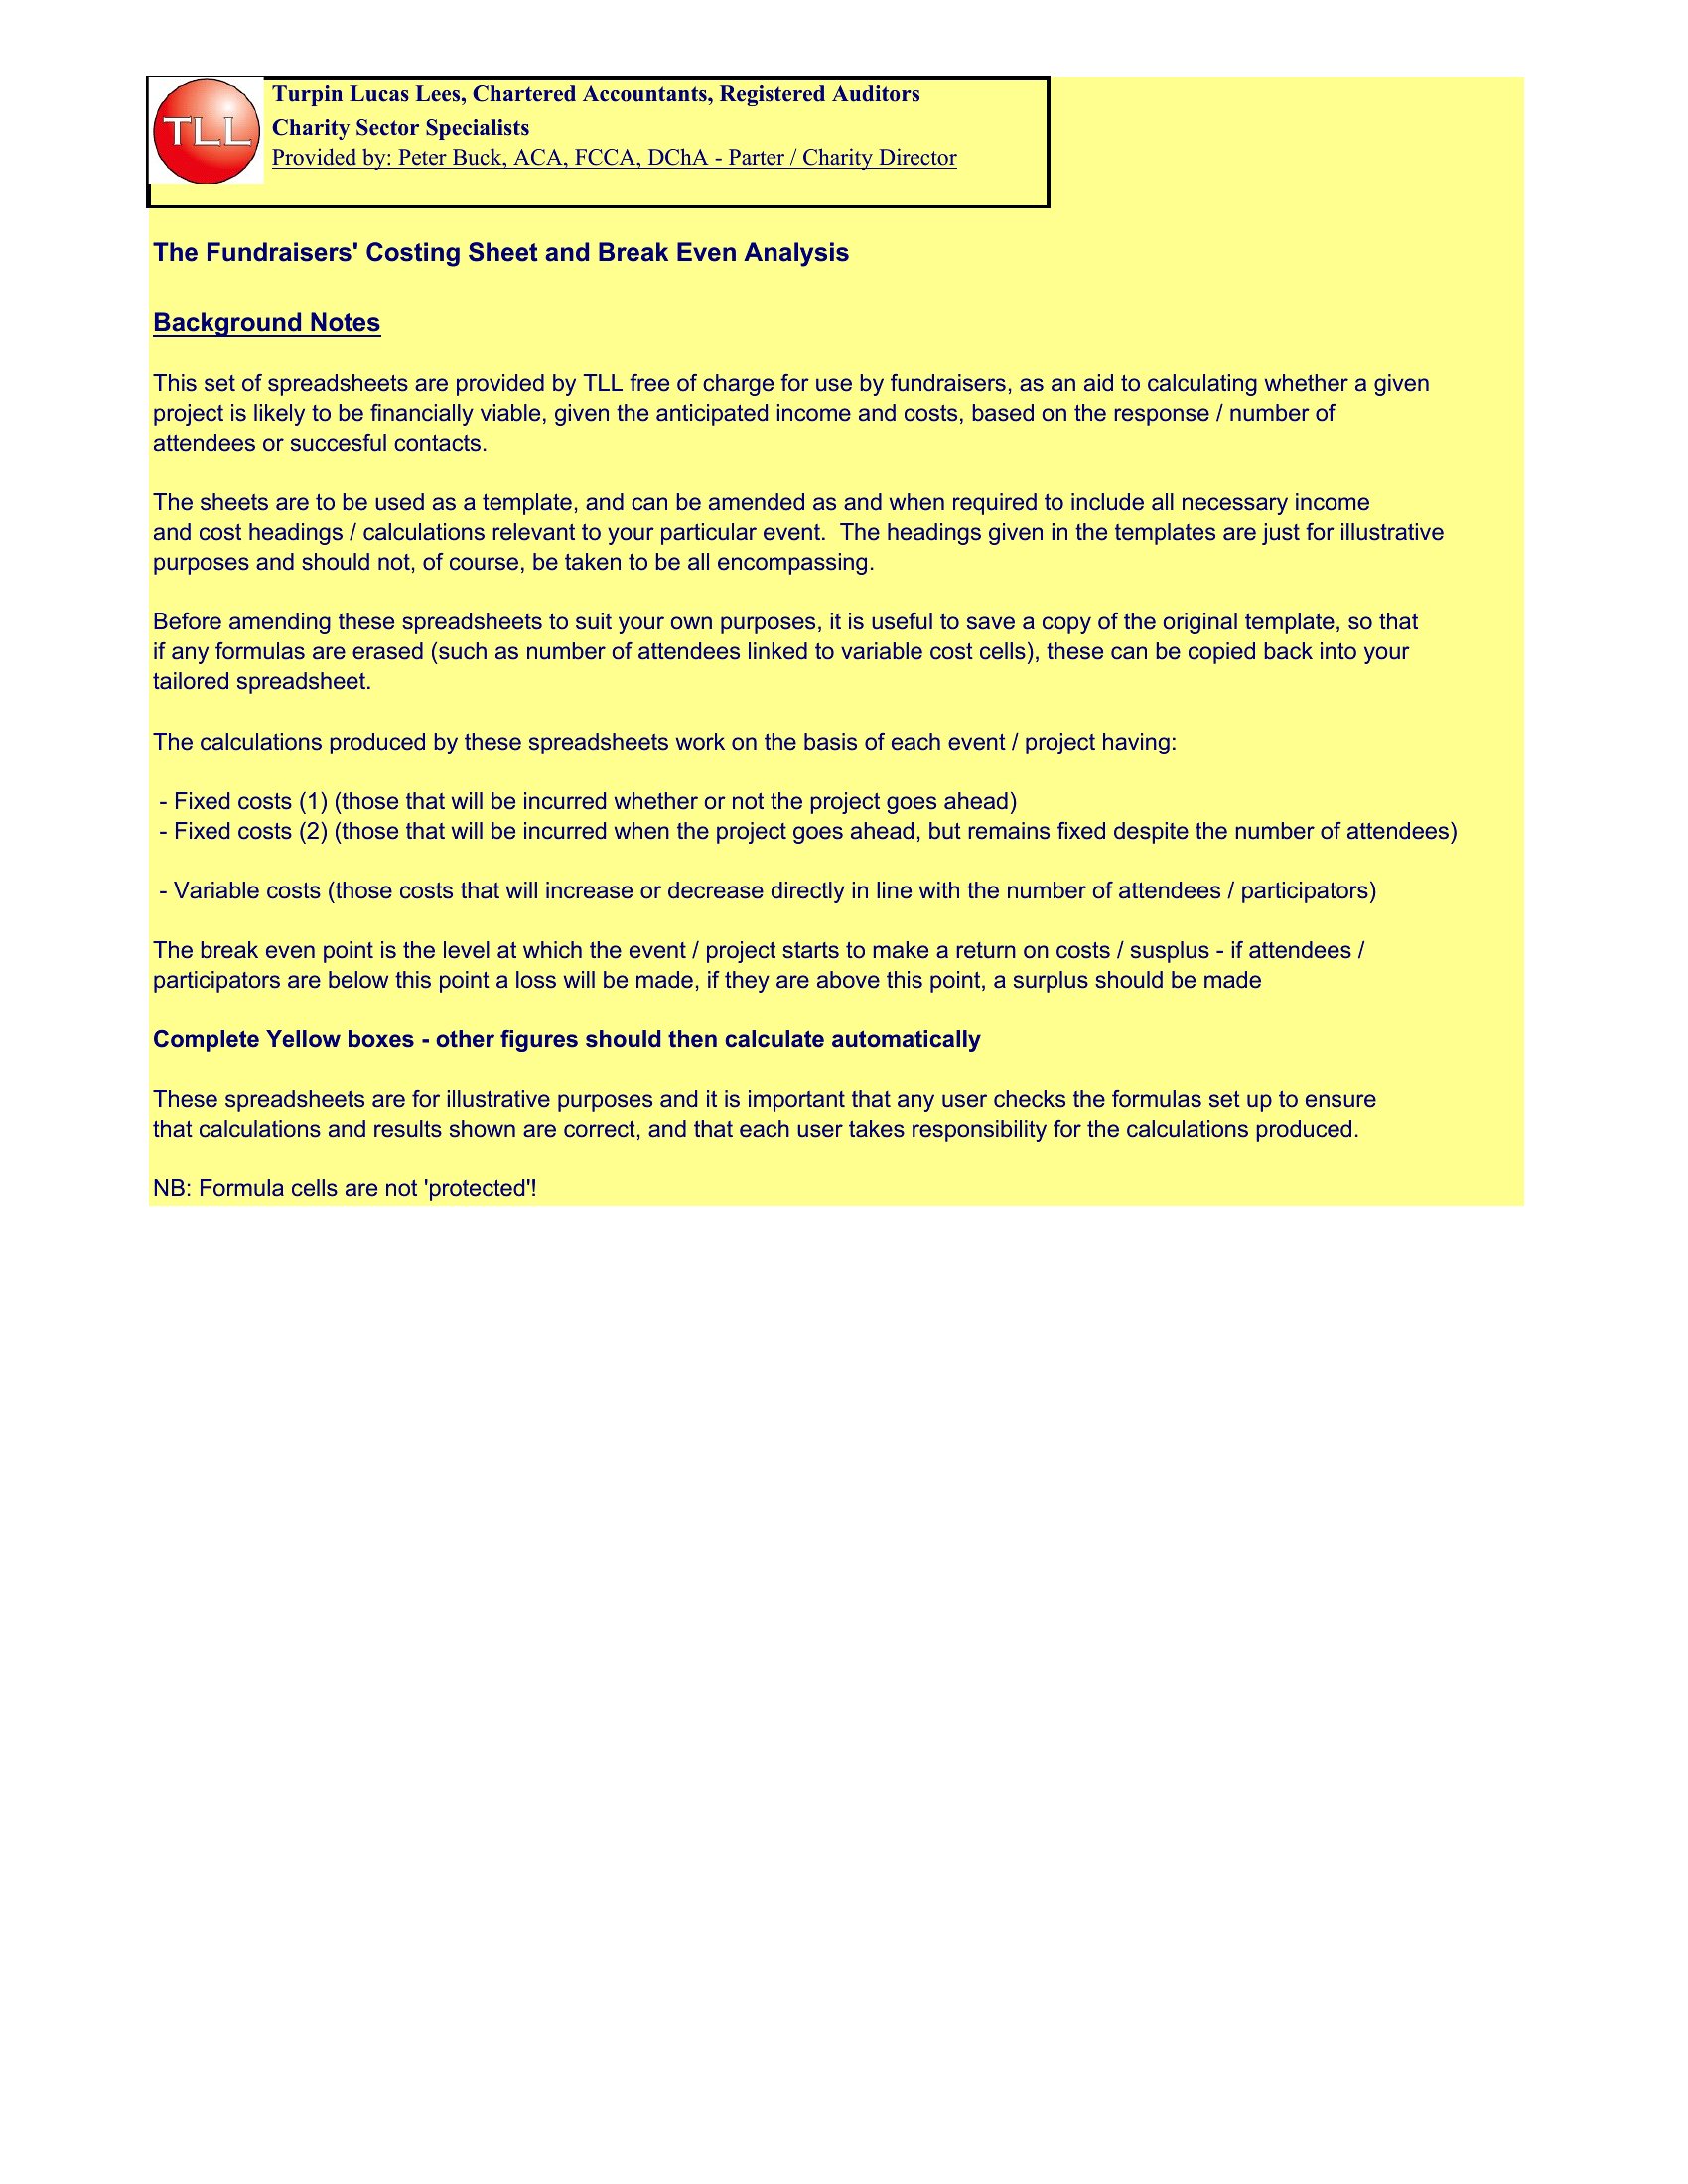
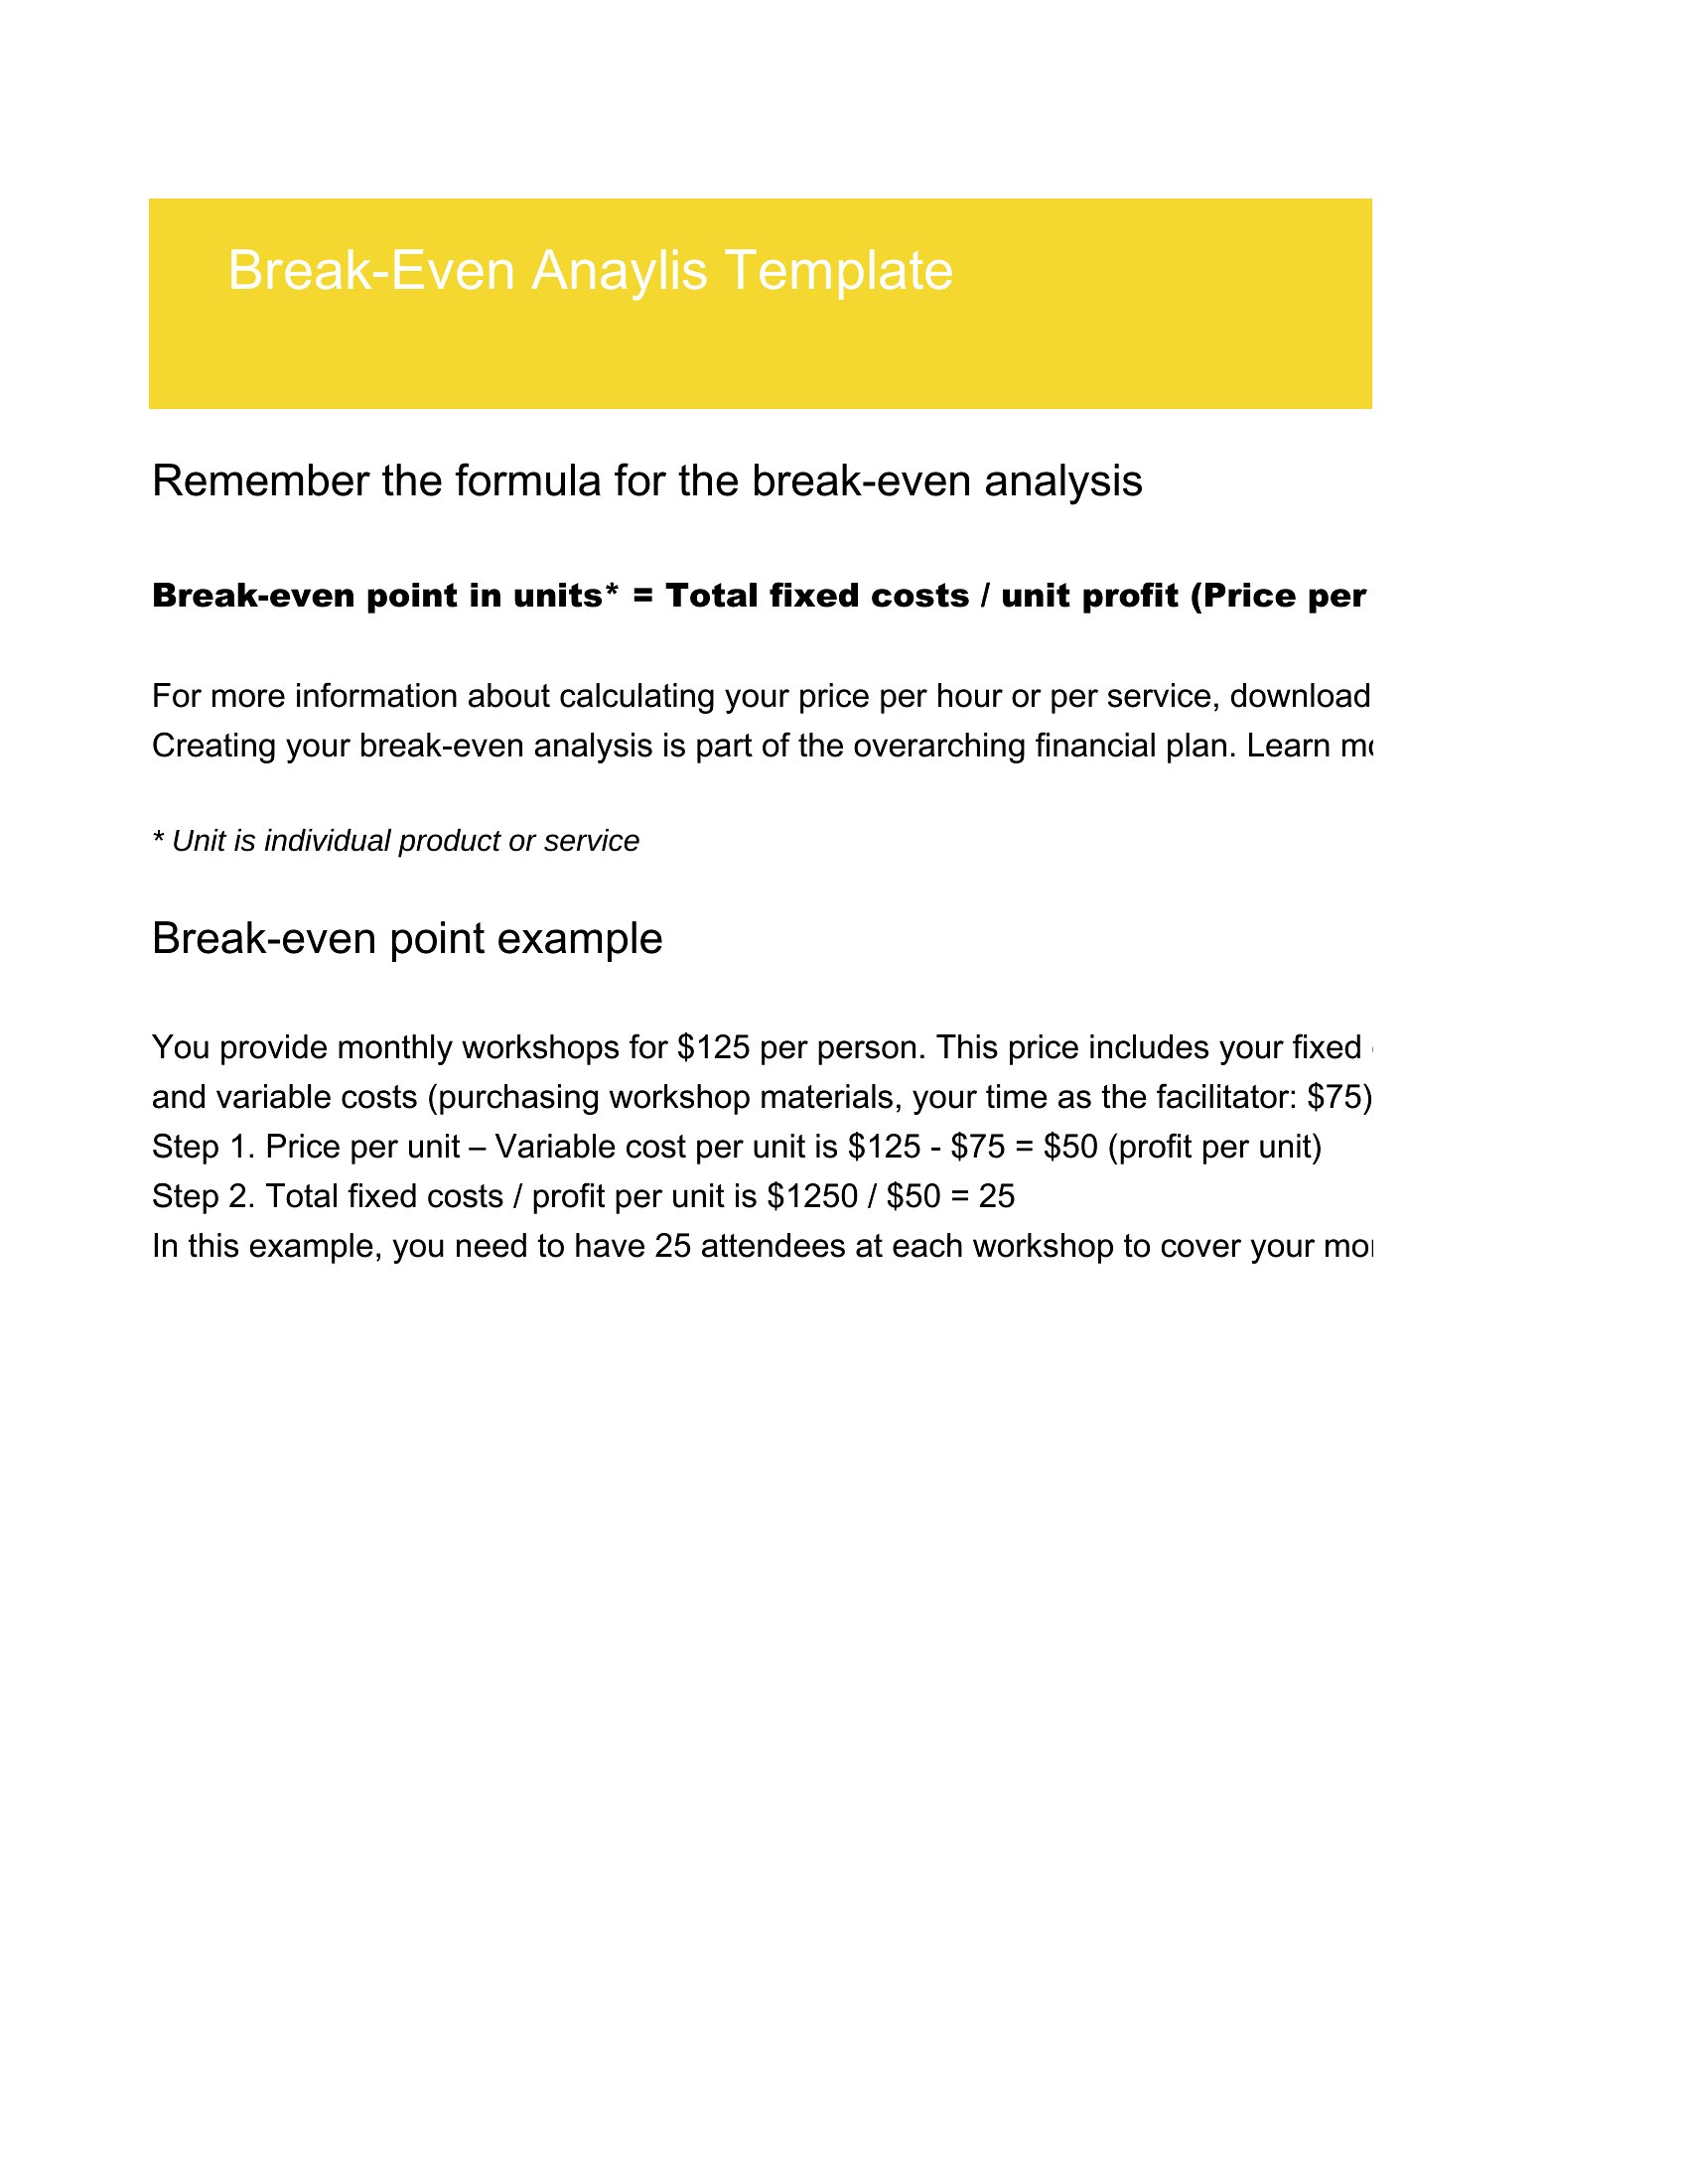

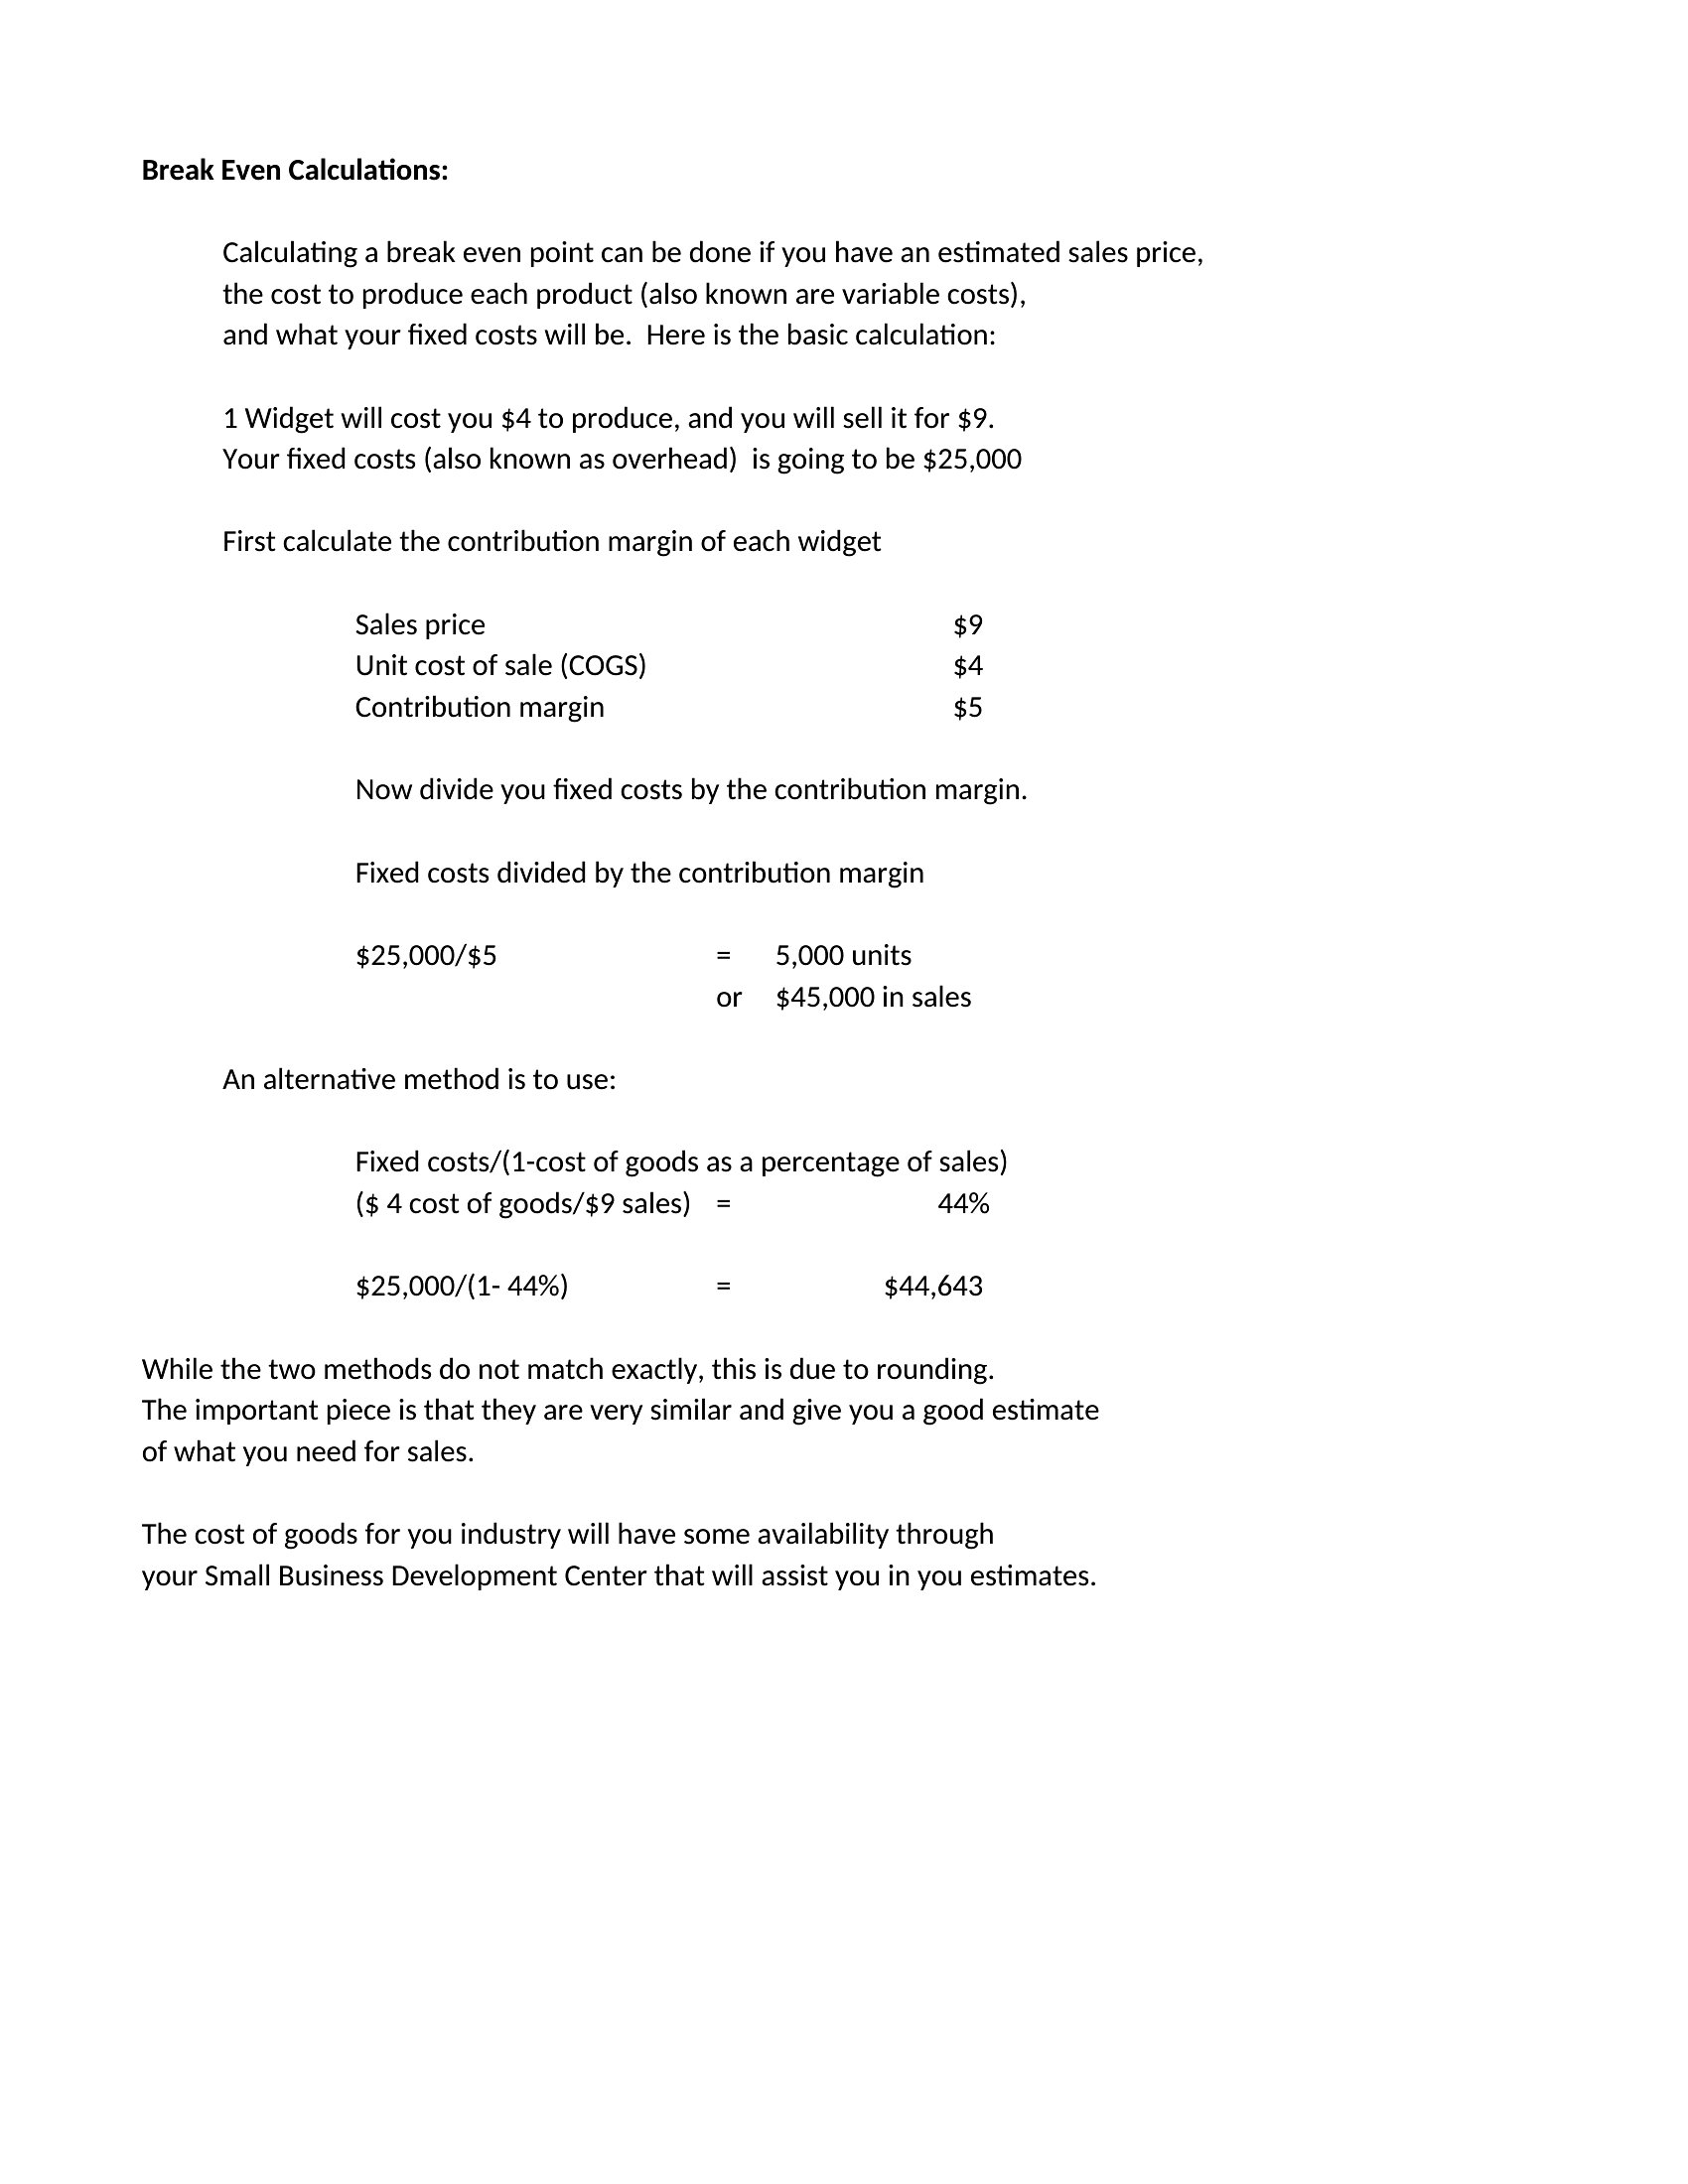
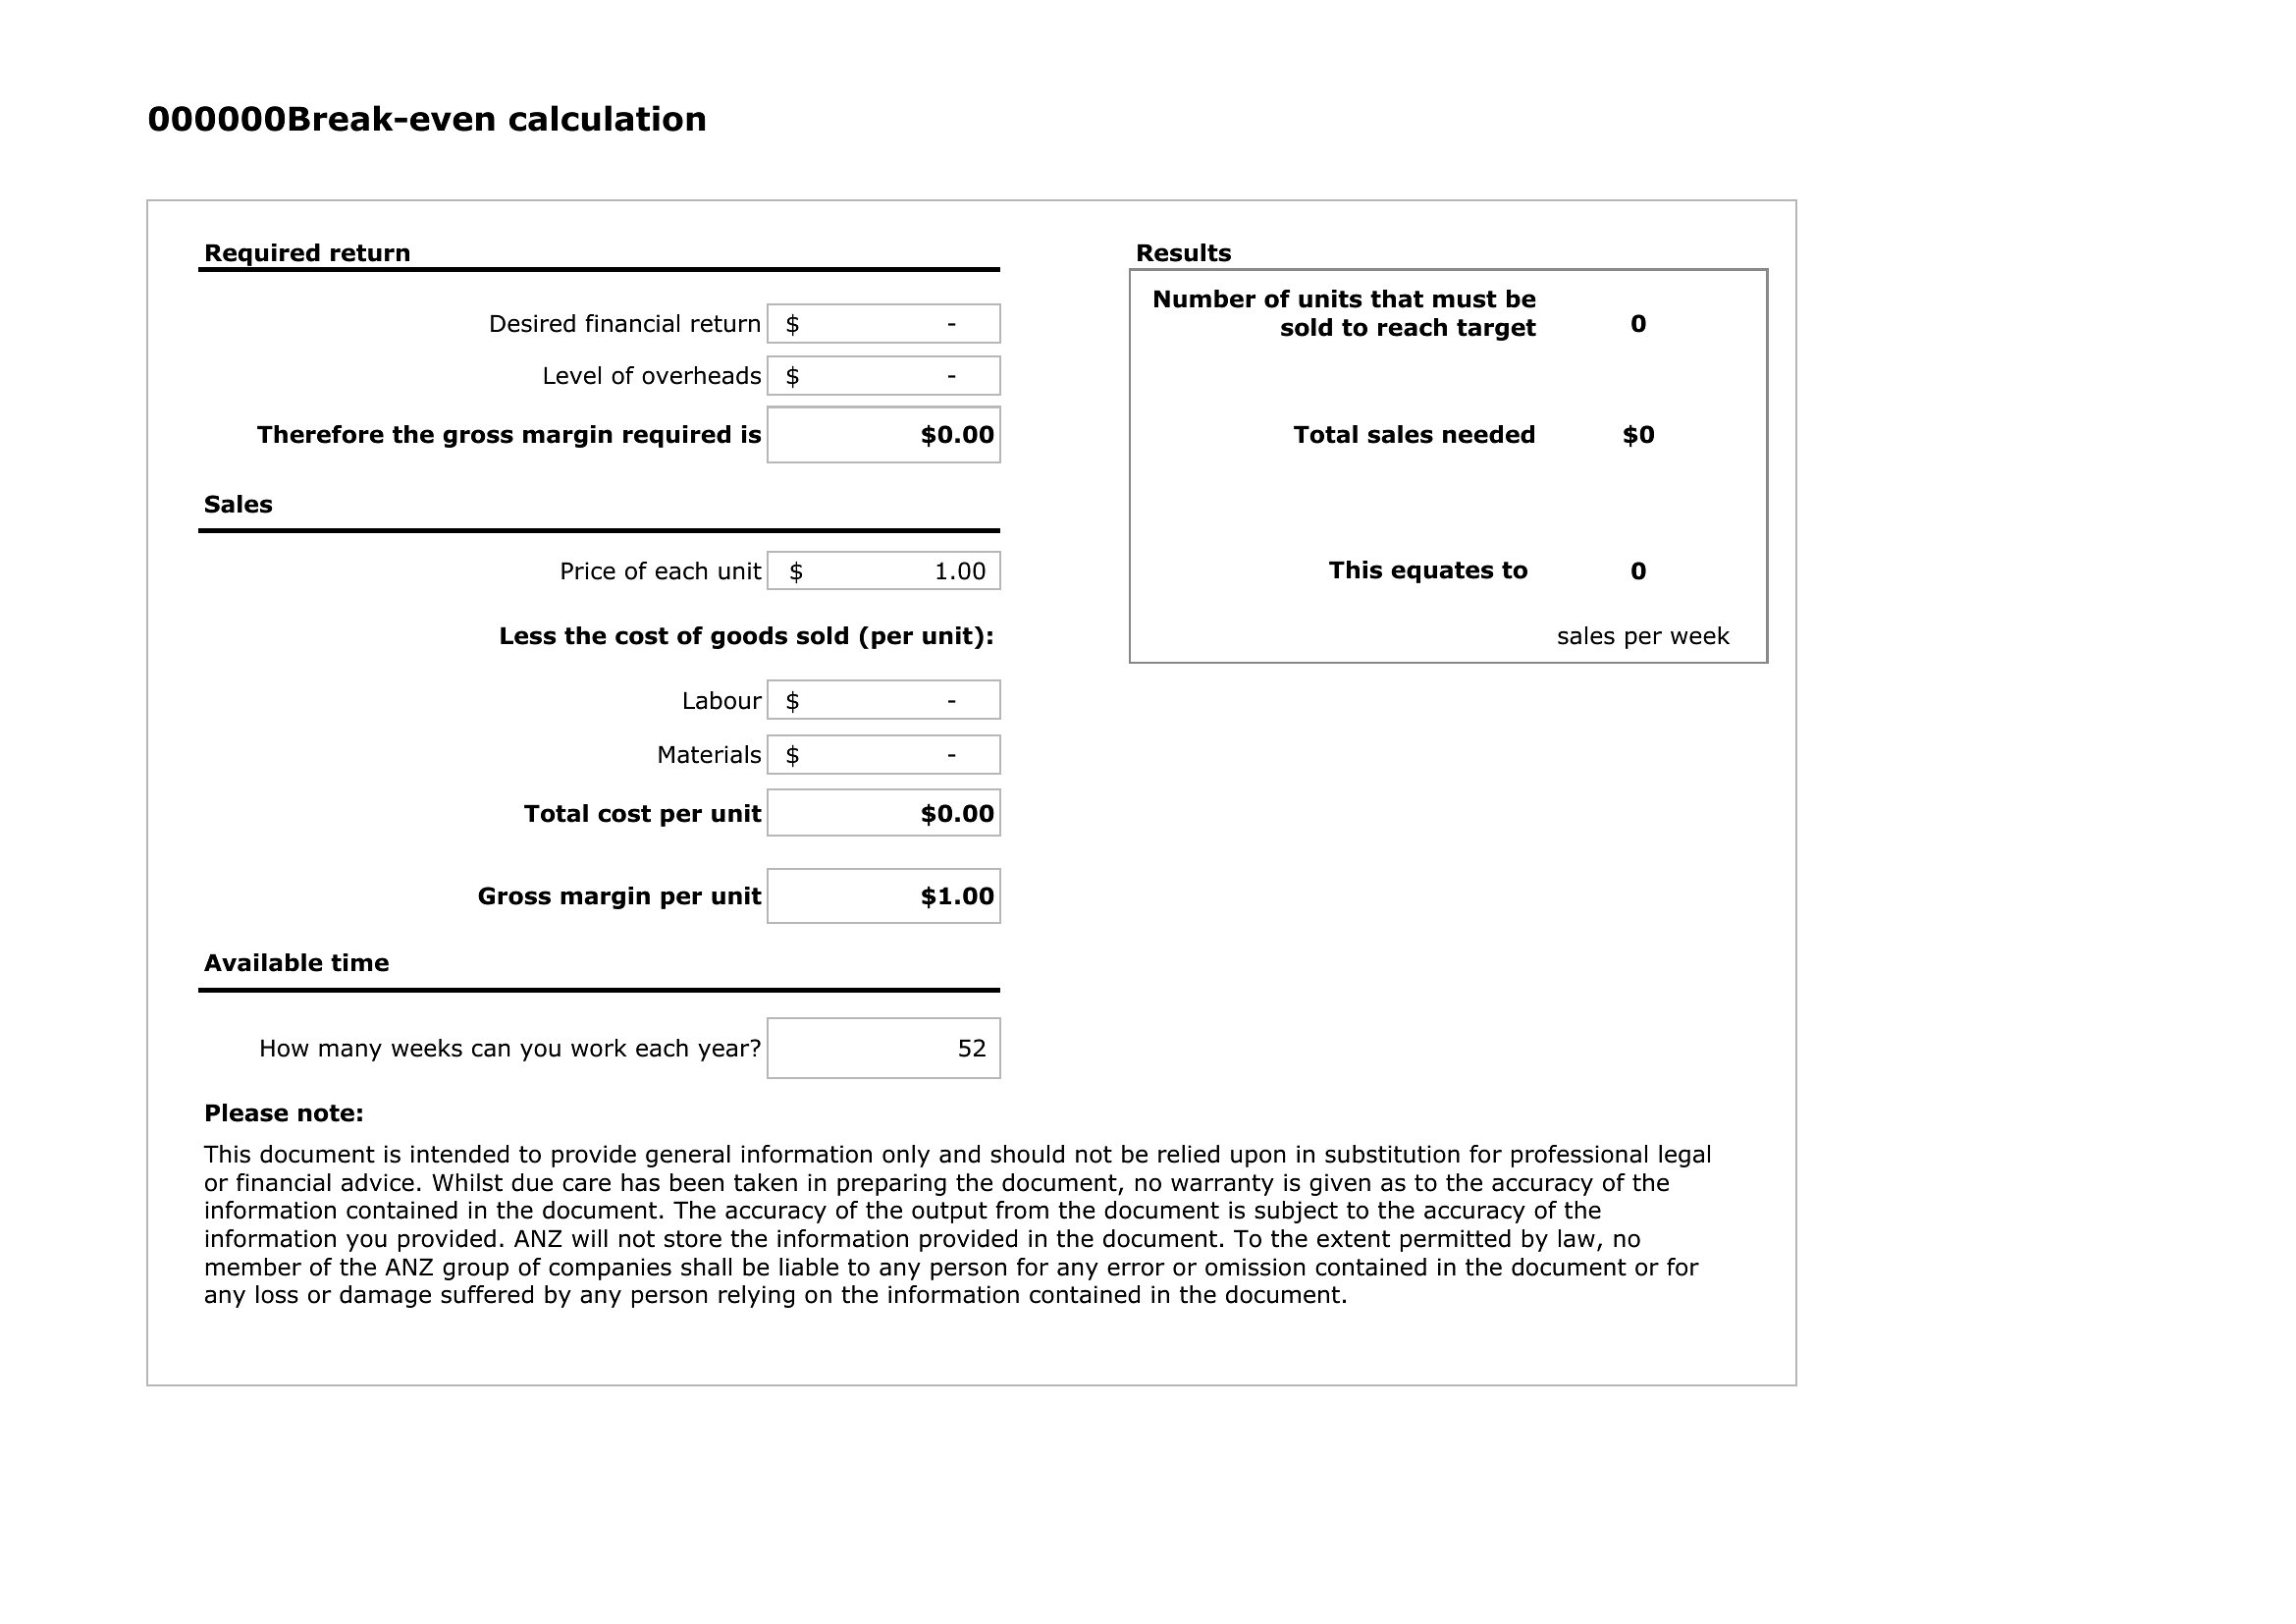

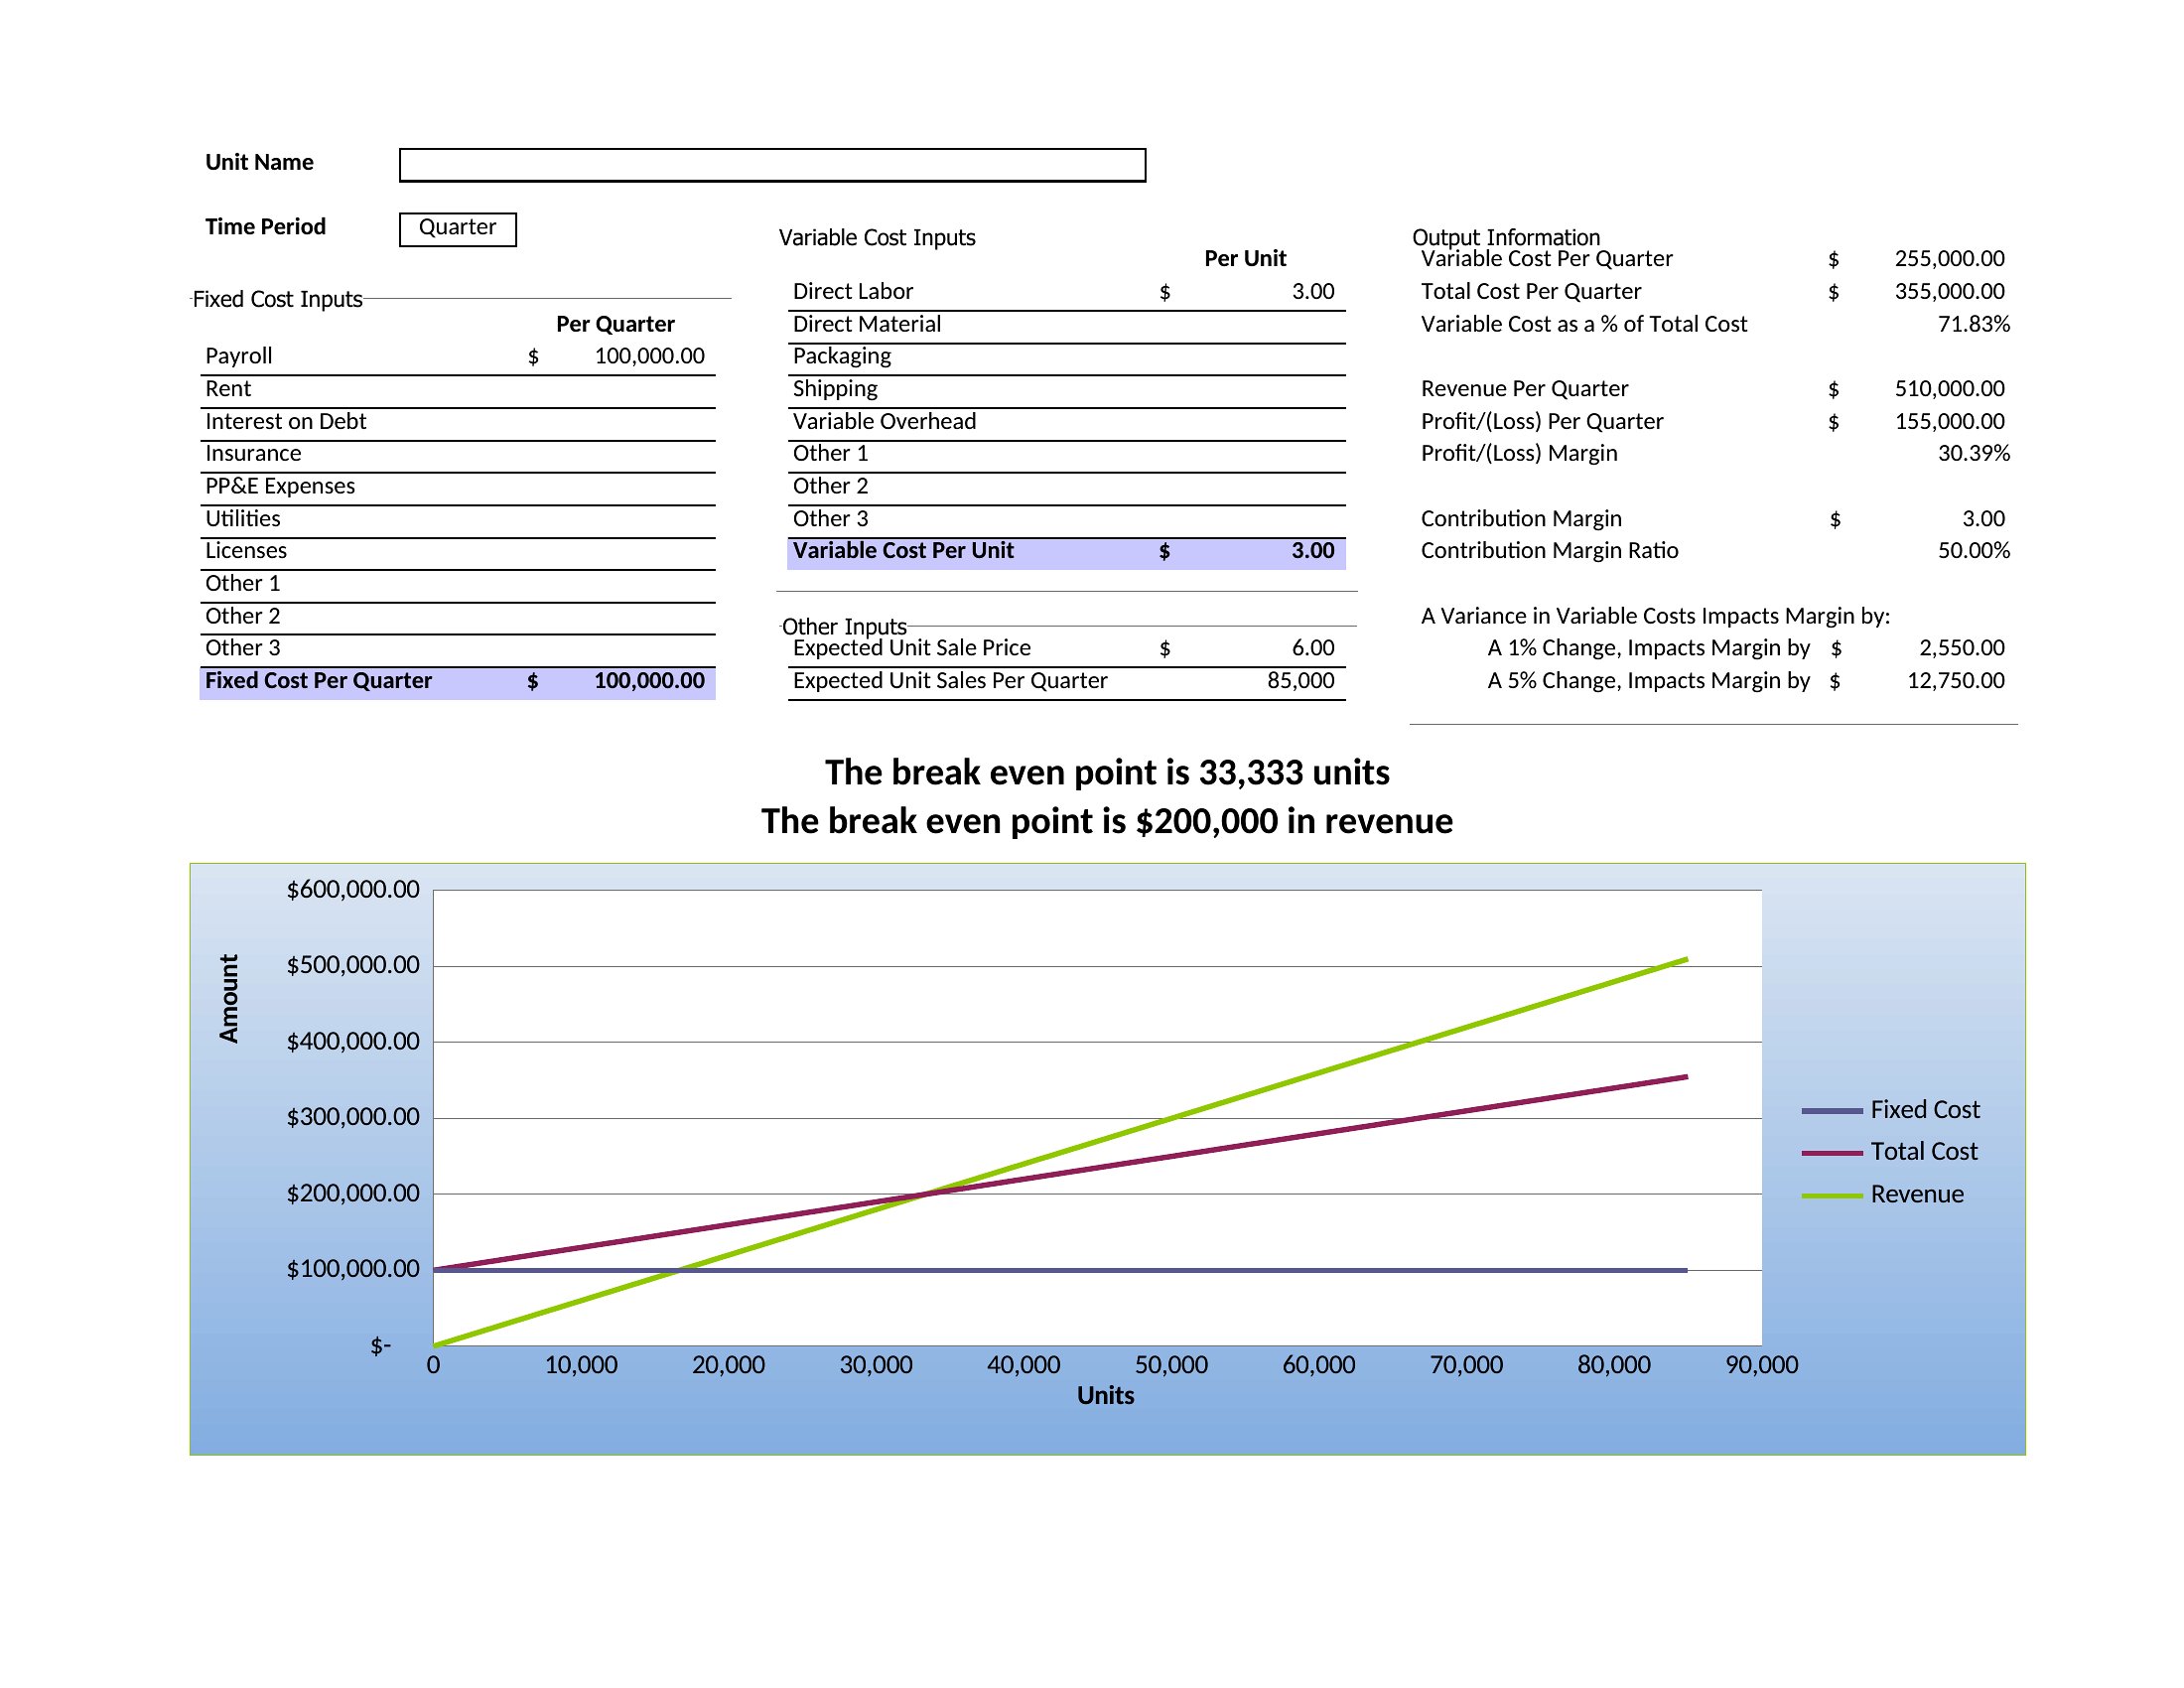
How to use this Break-Even Analysis template
Can these templates account for multiple revenue streams or product lines?
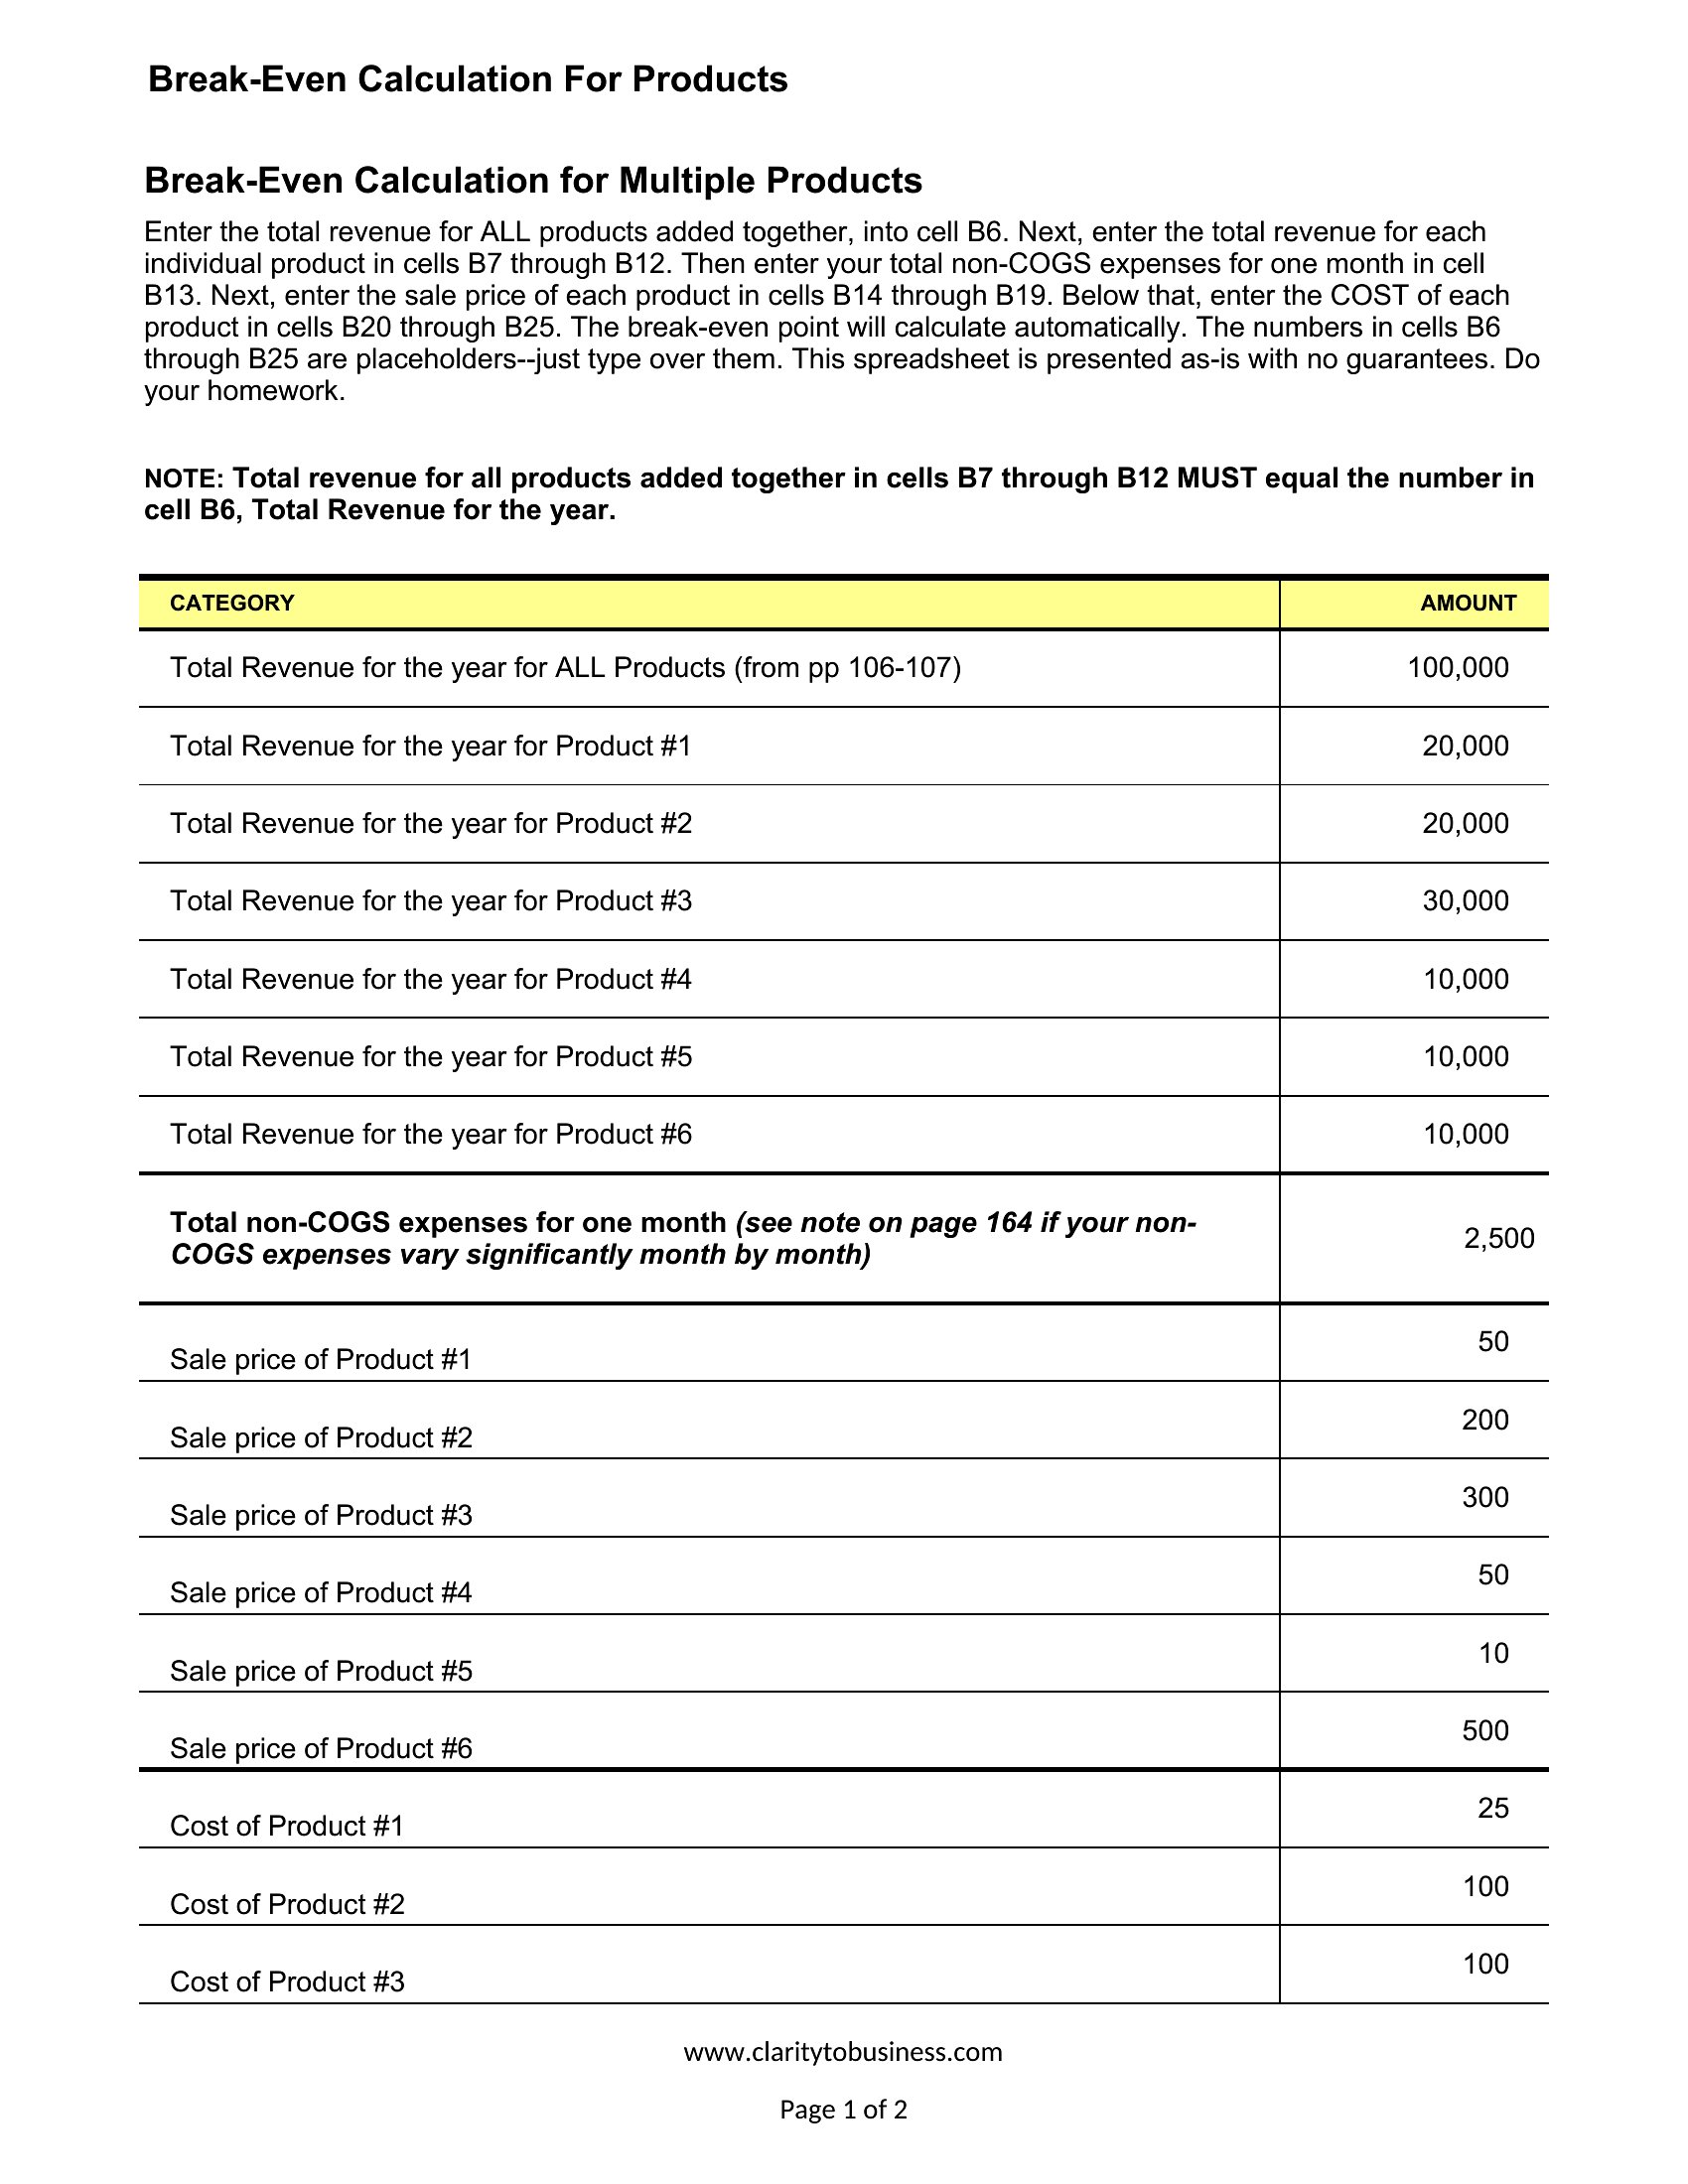
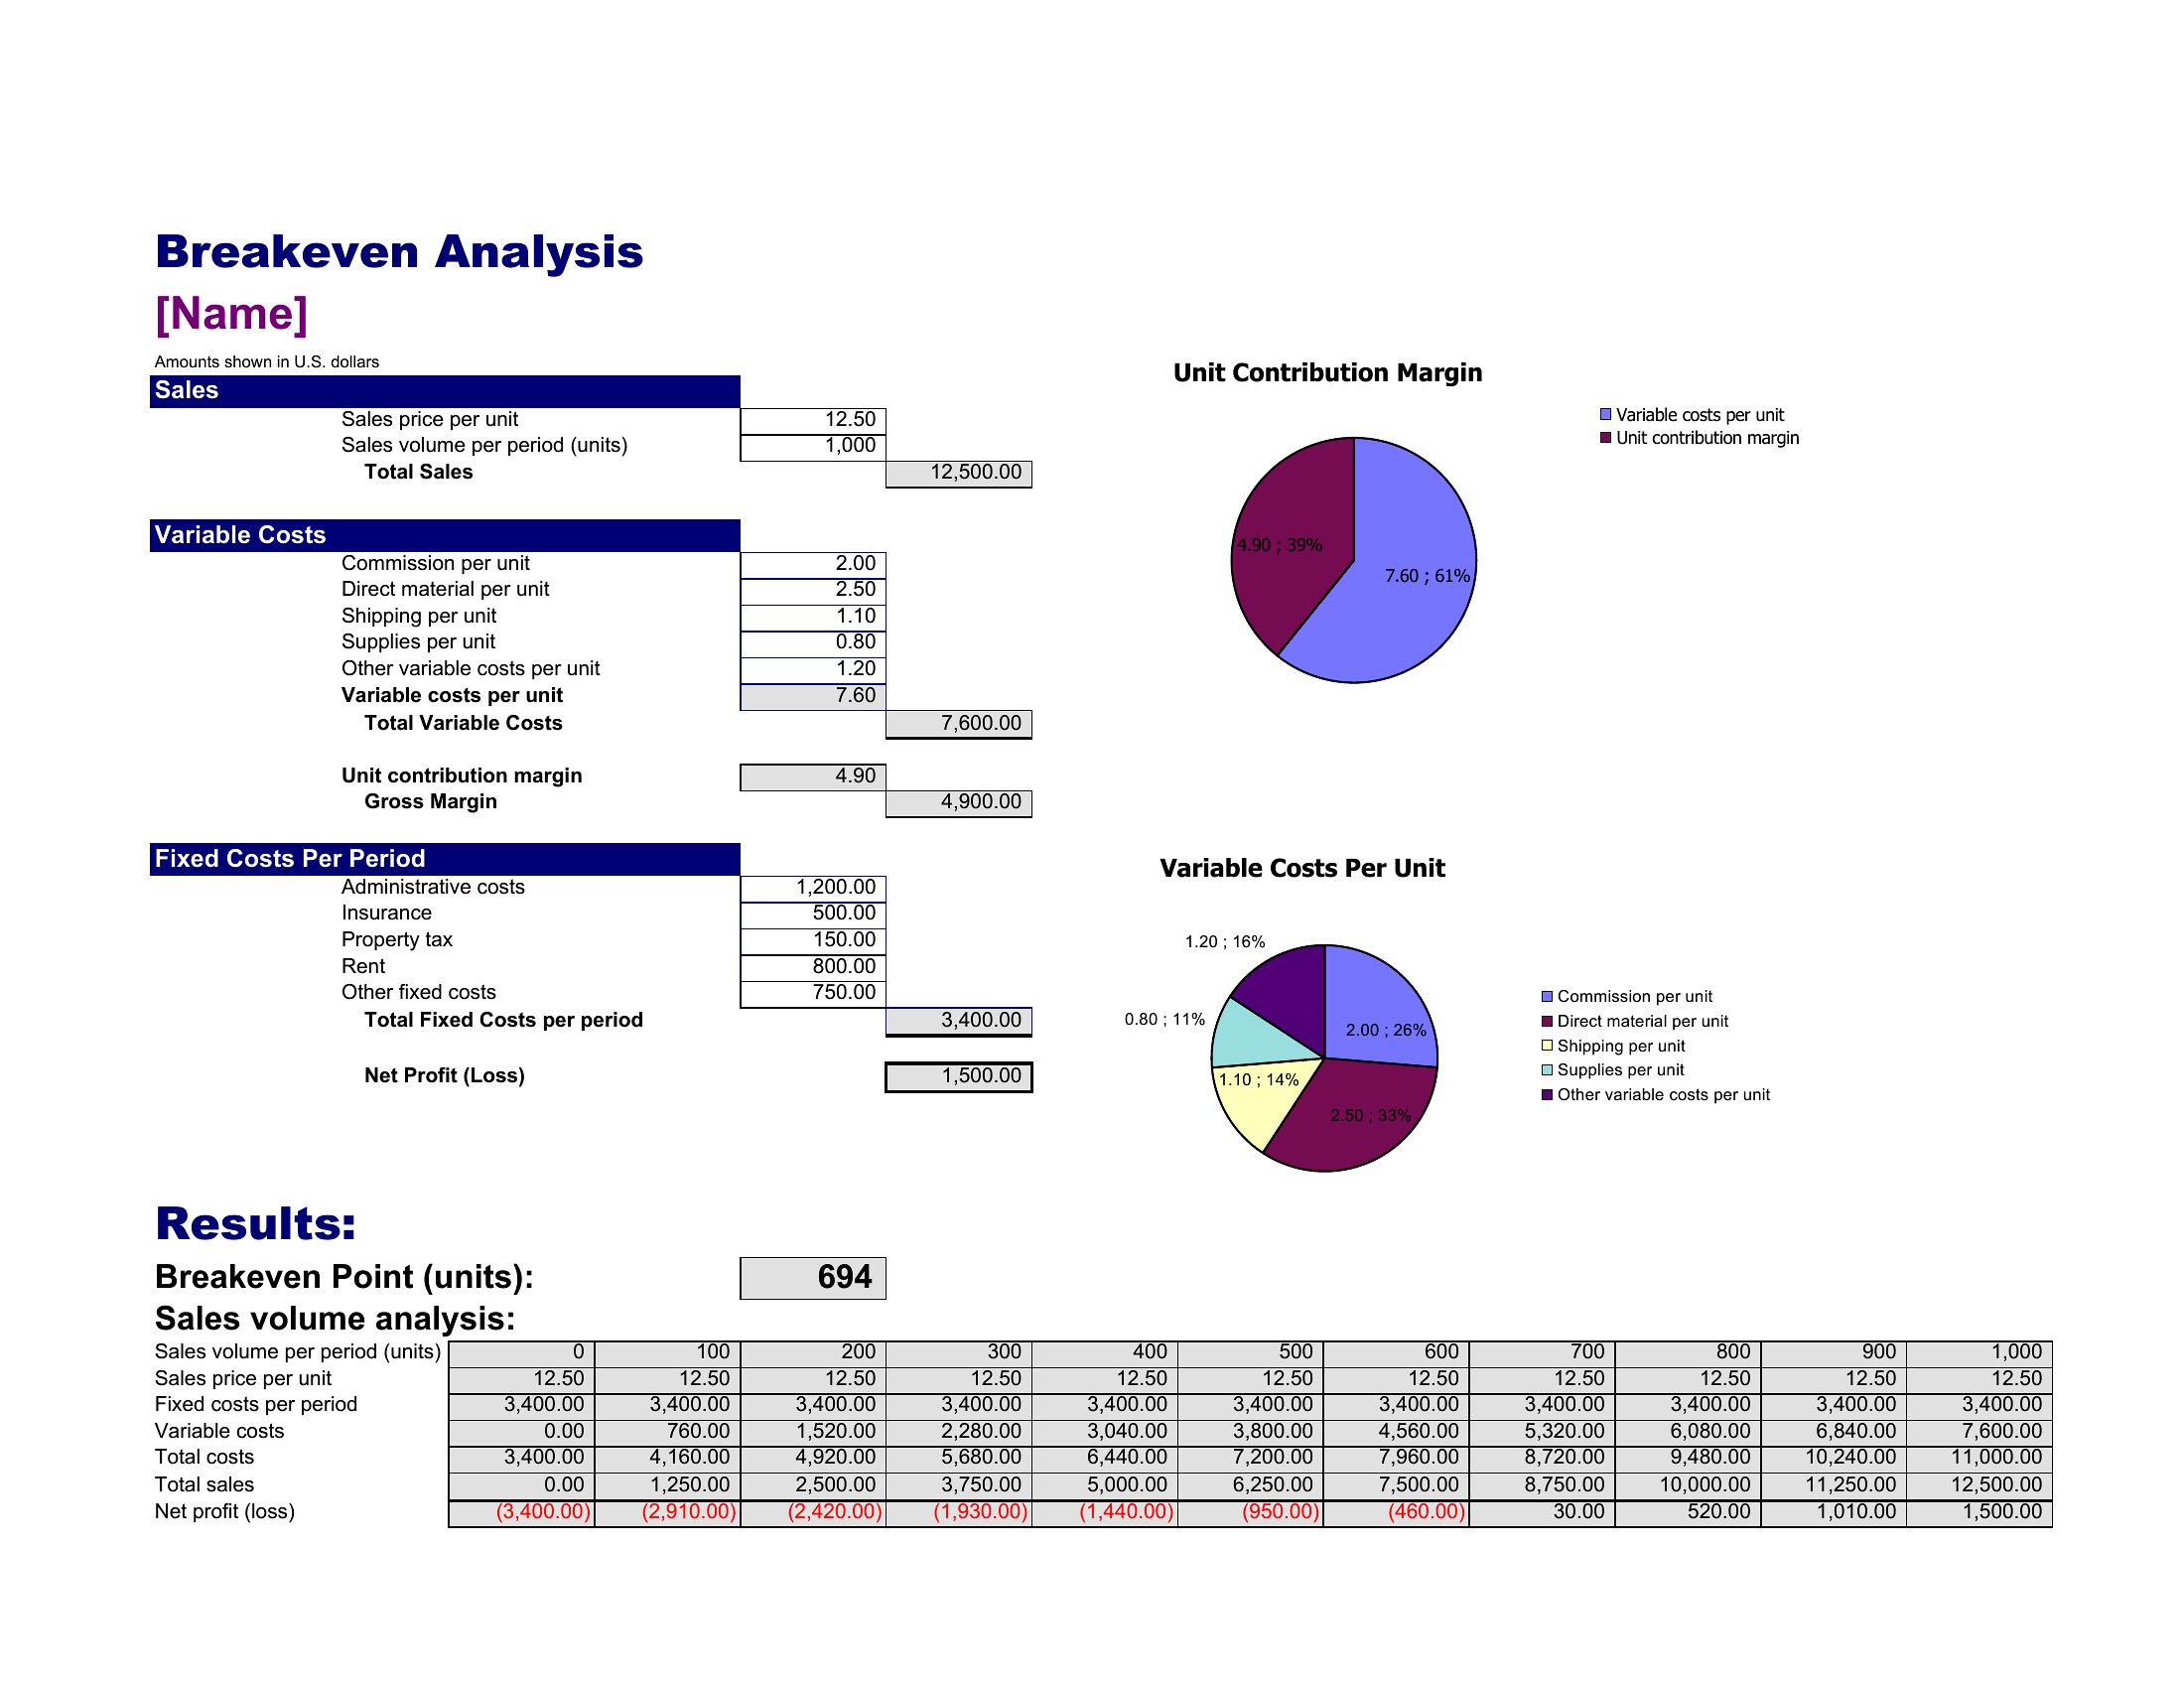
Yes, several templates in this collection—like *Multi Product Break Even Analysis*—are designed to factor in different pricing, costs, and sales volumes for each product. Input your data for each line, and the template calculates the combined break-even point. This is particularly useful for e-commerce stores or manufacturers selling diverse inventory.
How do I adjust the template if my fixed or variable costs change monthly?
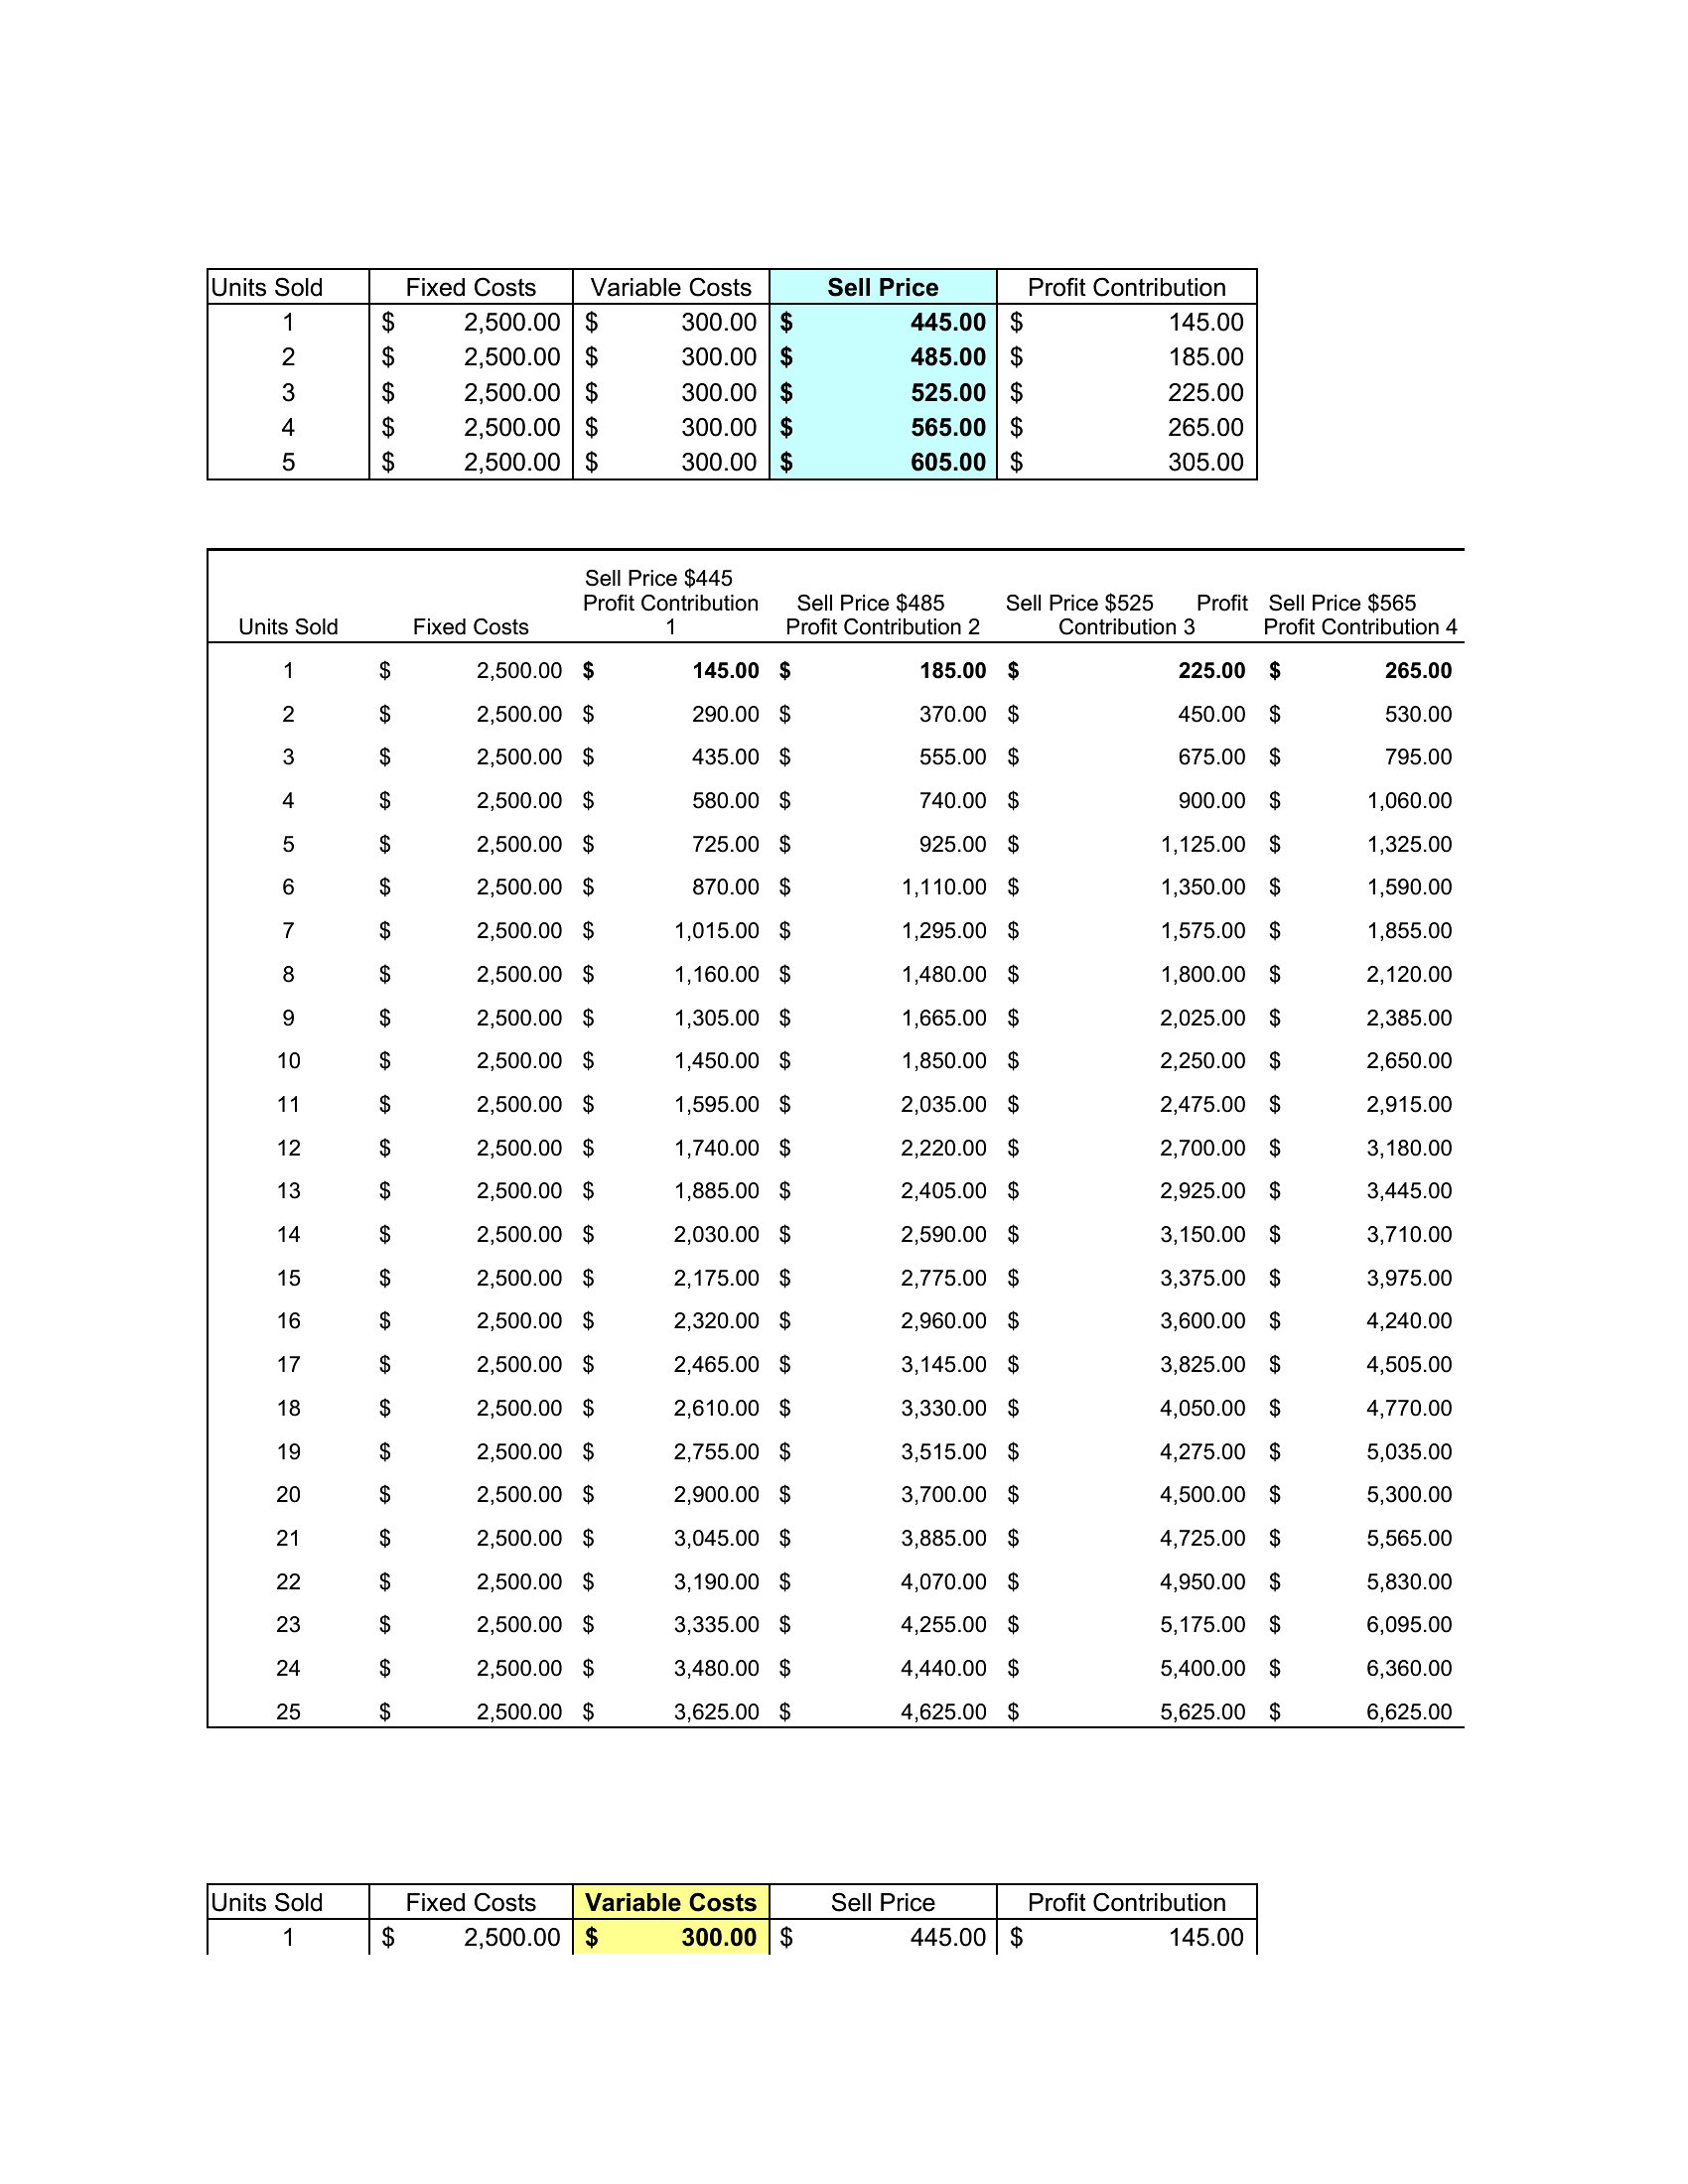
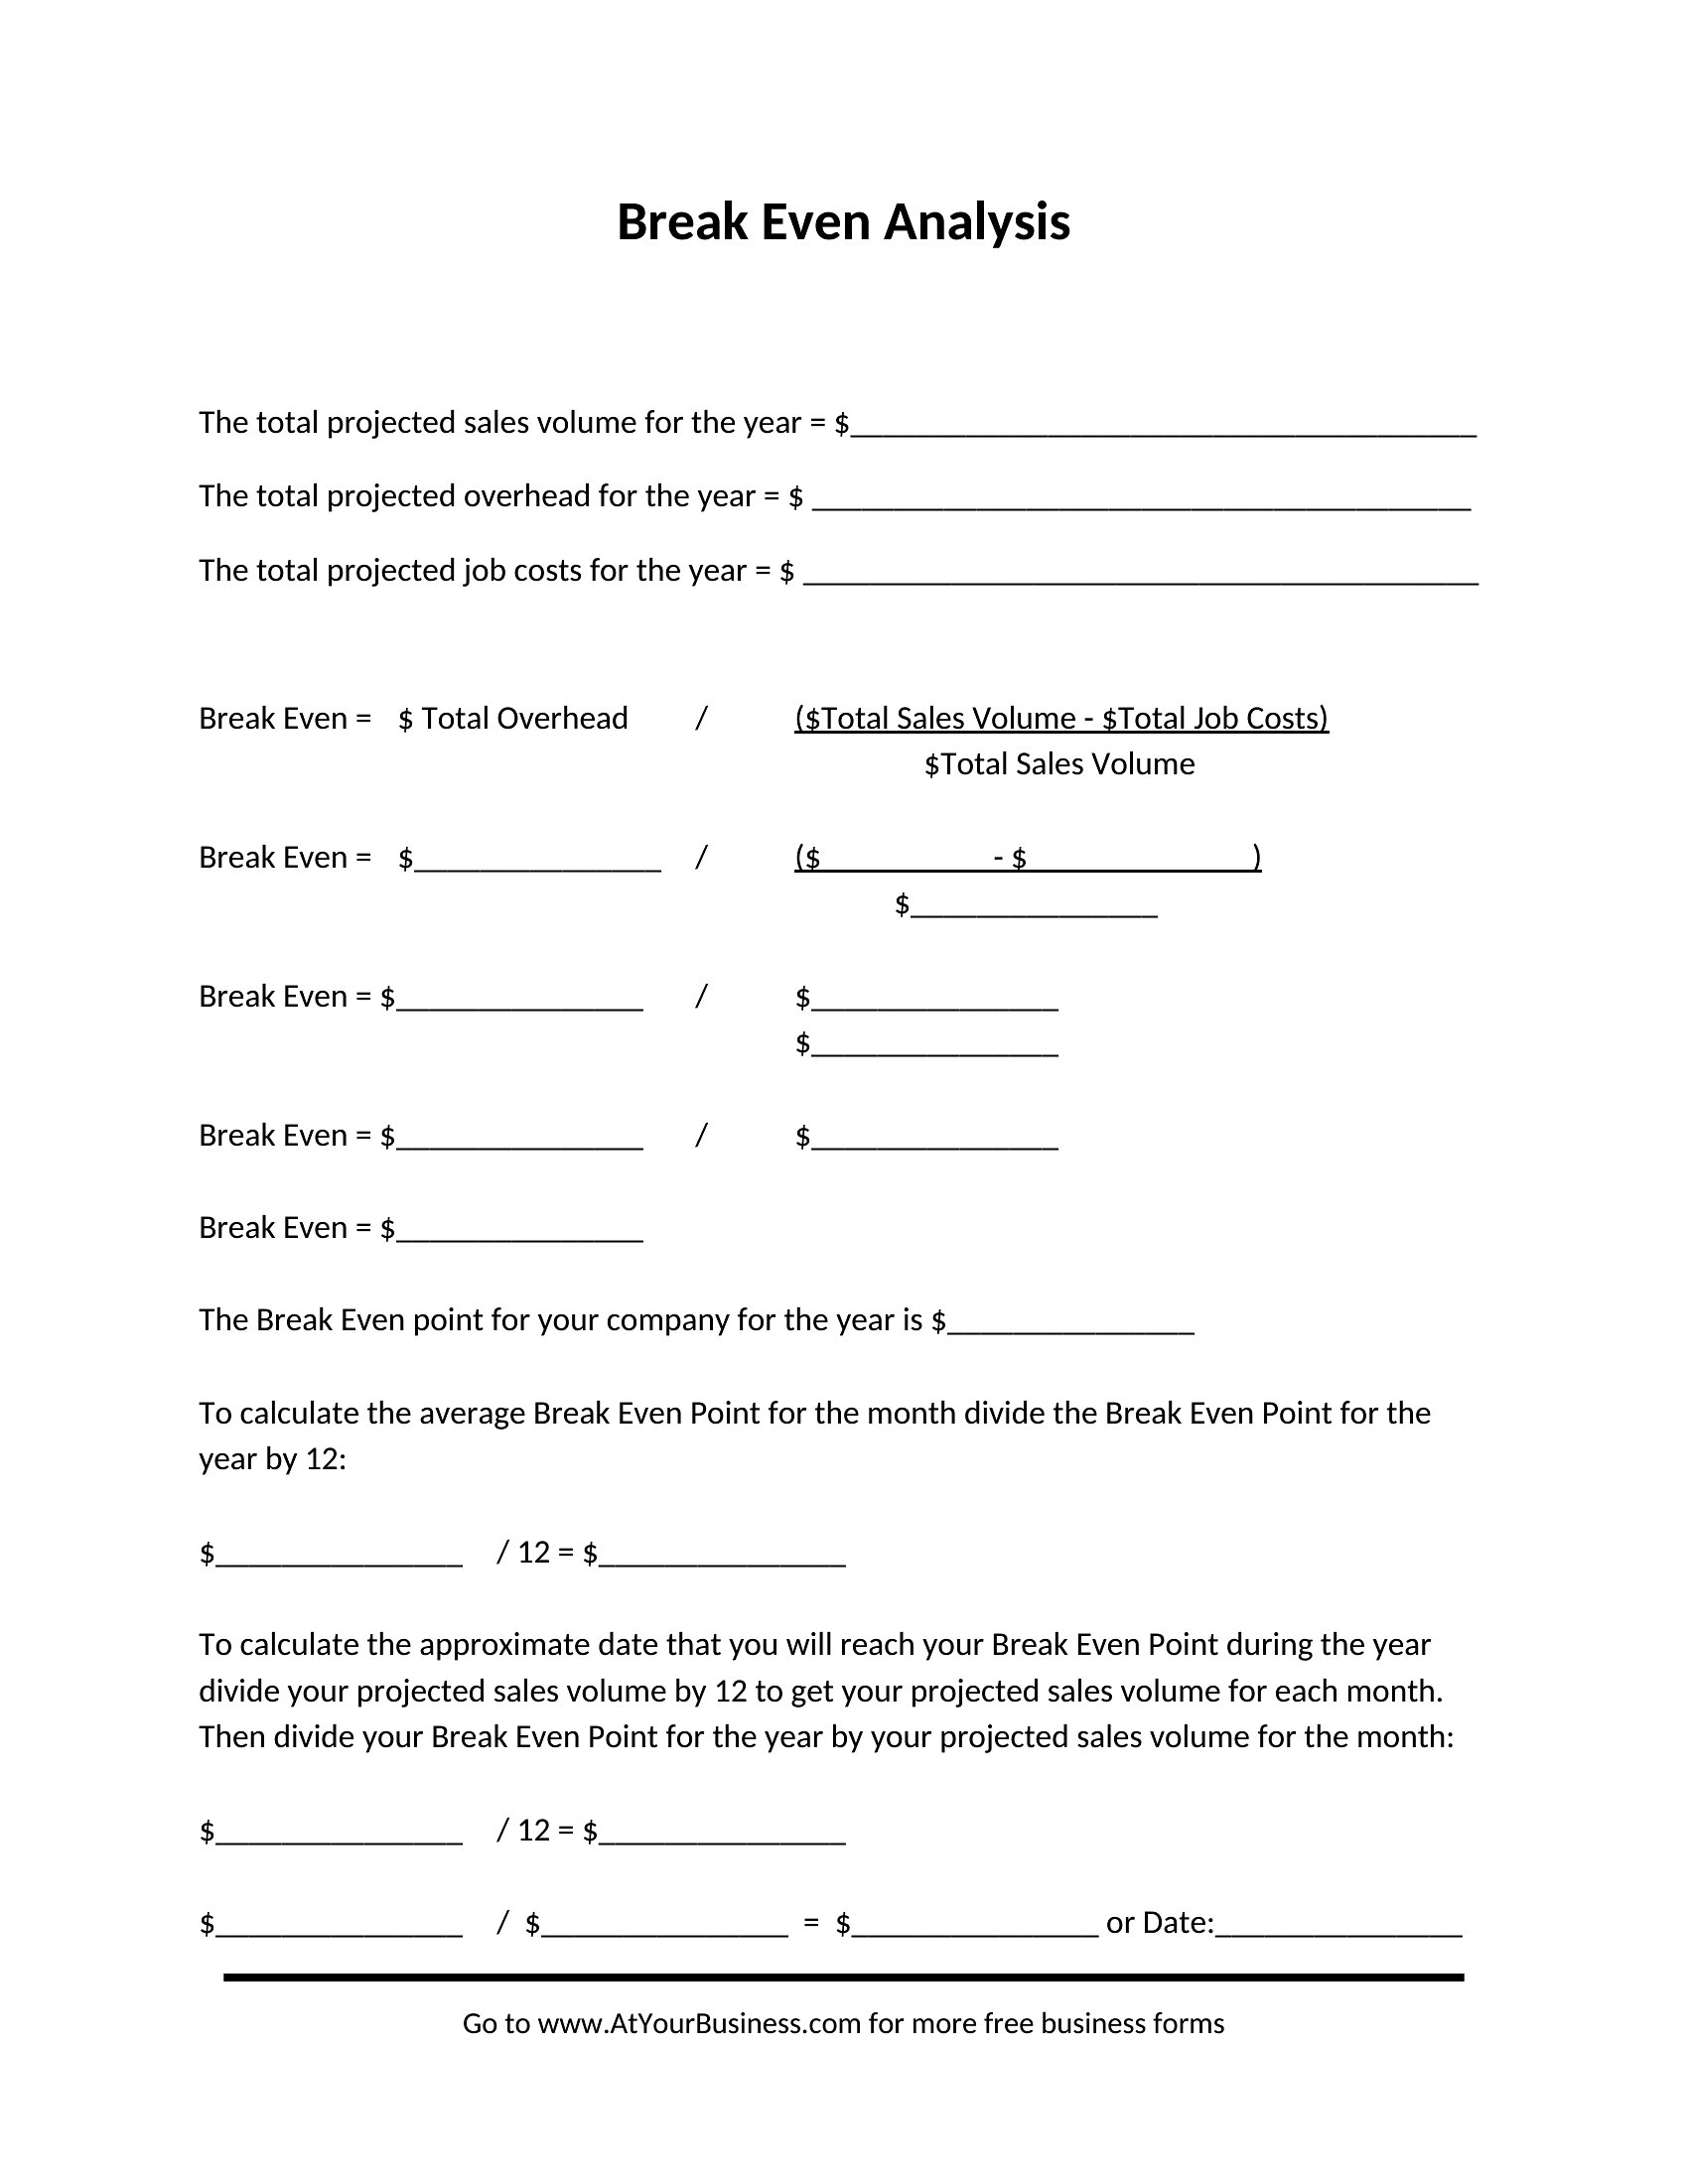
Most Excel-based templates include adjustable cells labeled for fixed costs (e.g., rent, salaries) and variable costs (e.g., materials, commissions). Simply update those figures, and the break-even point or profit graphs will recalculate automatically. Word templates require manual adjustments, but the formulas remain the same. For recurring reviews, save the Excel version and reuse it.
What’s the difference between a break-even analysis calculator and a graph-based template?
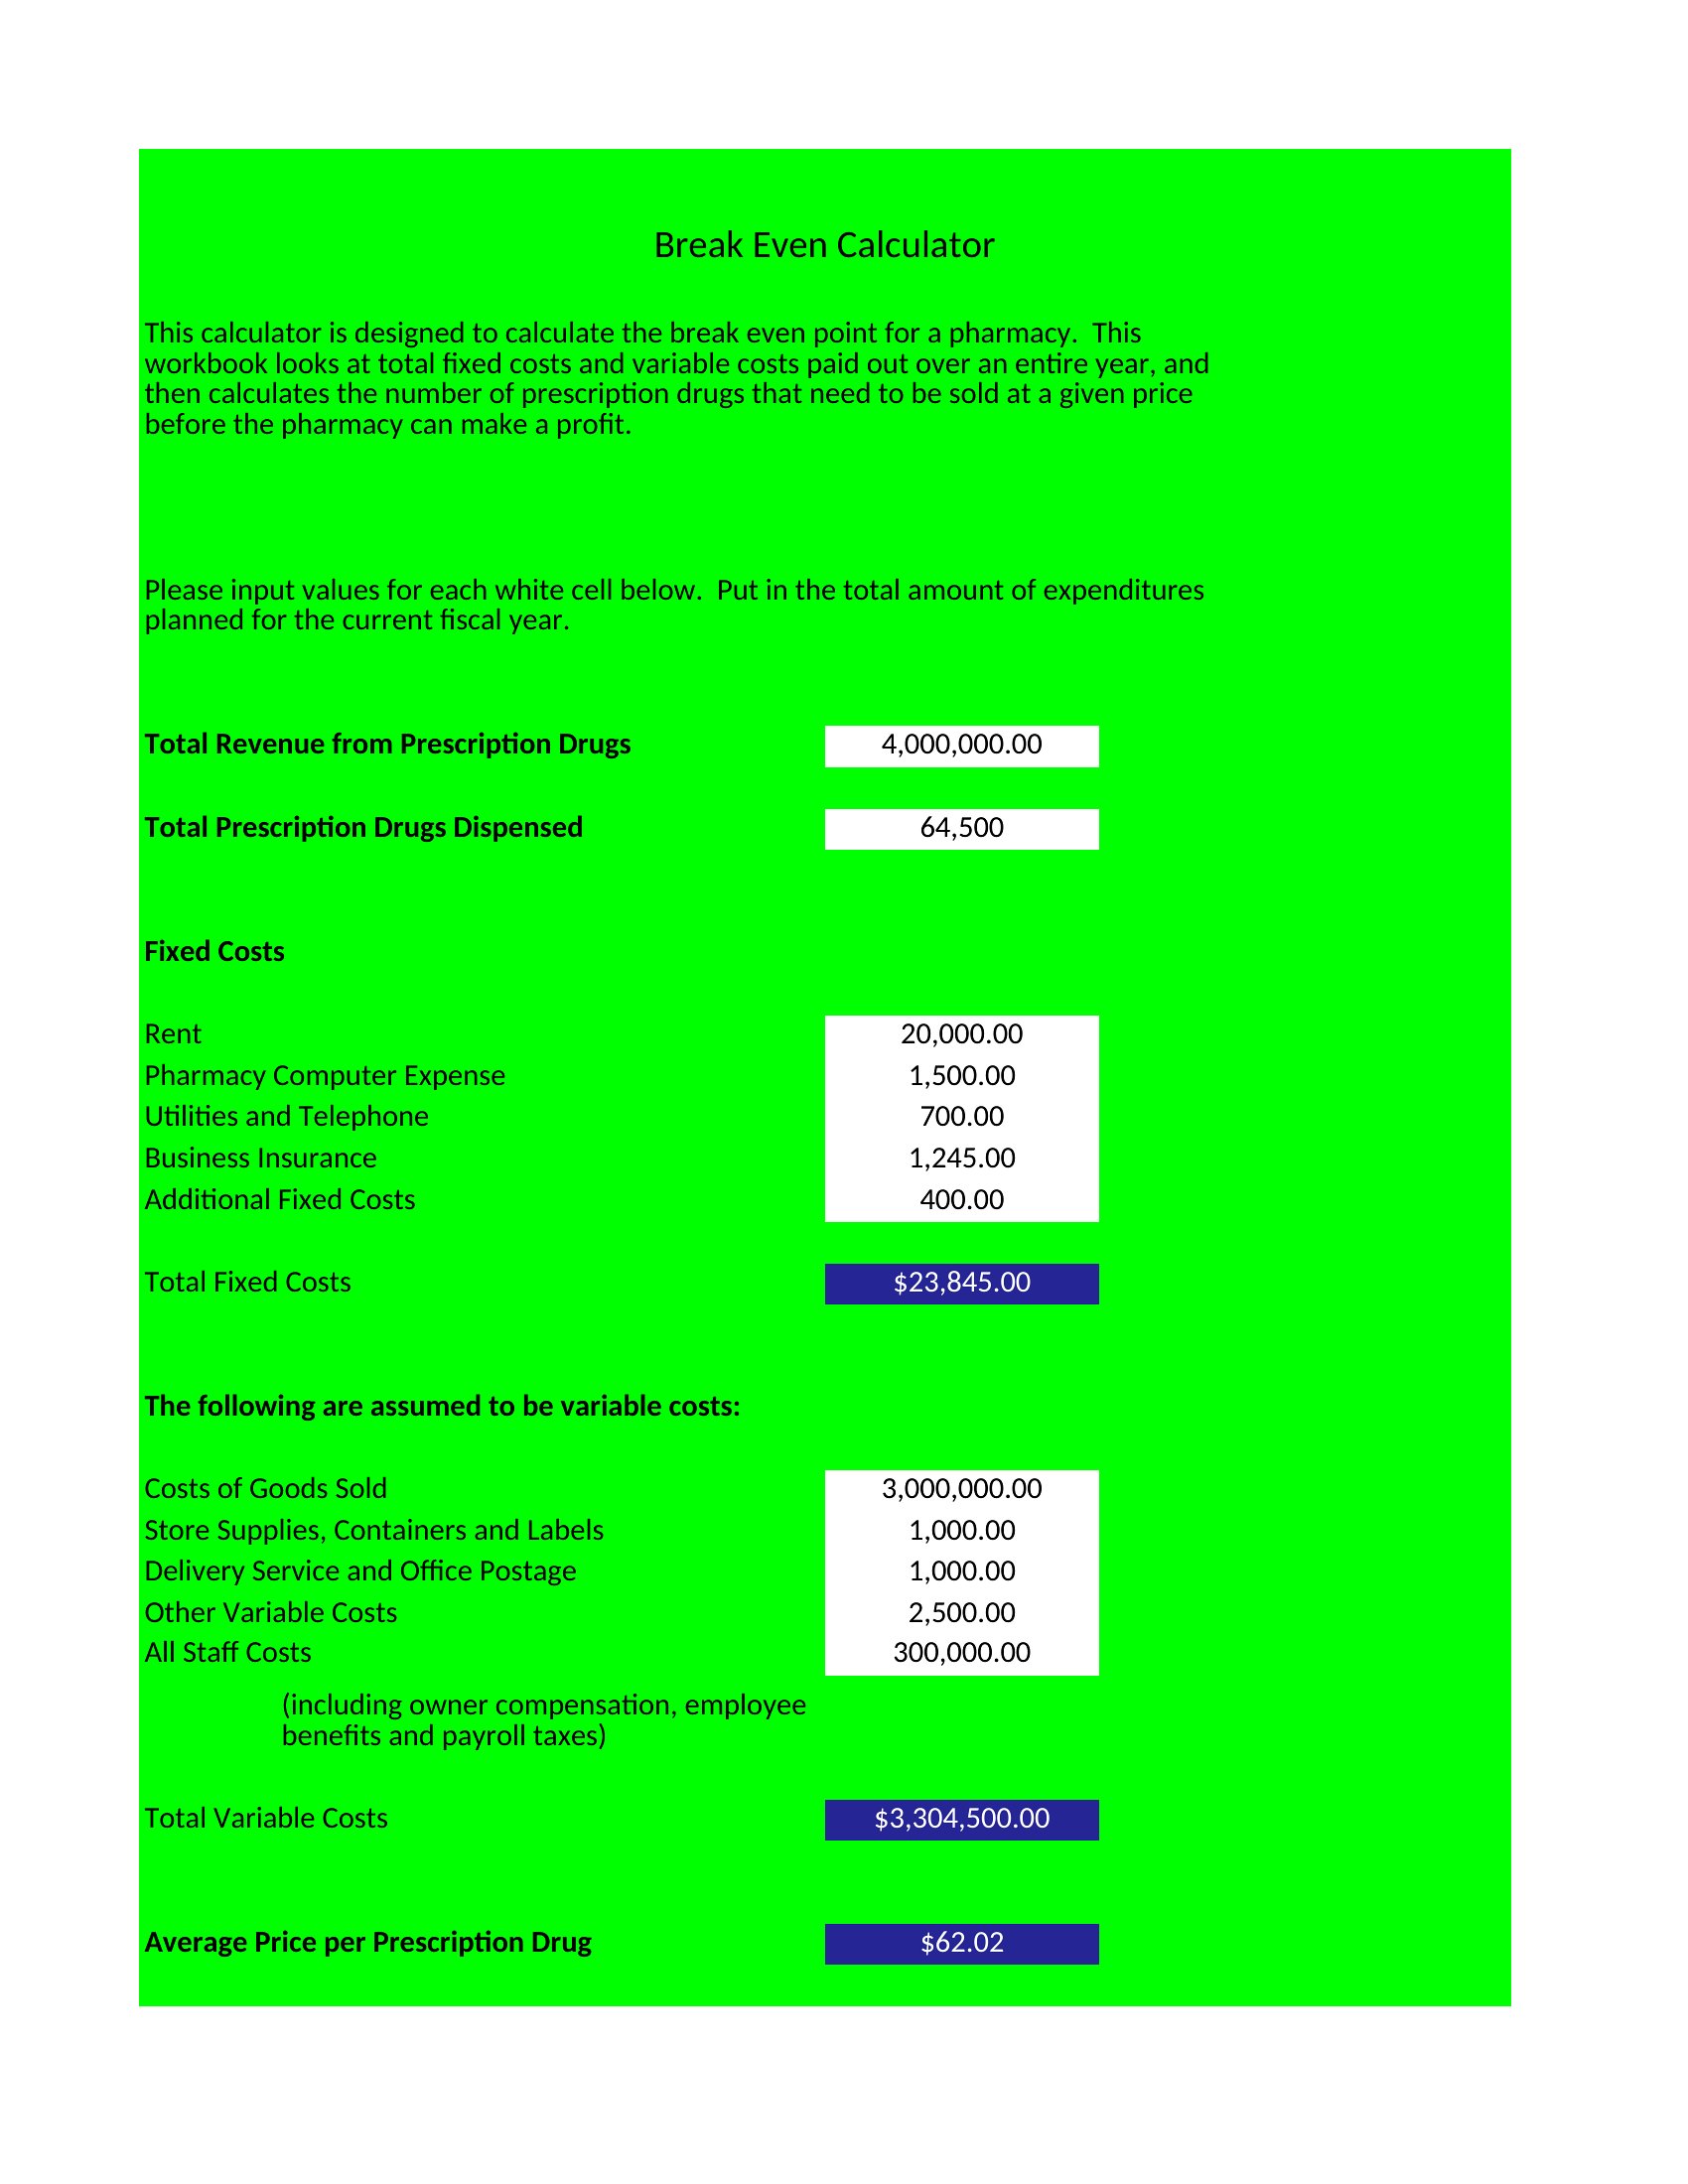
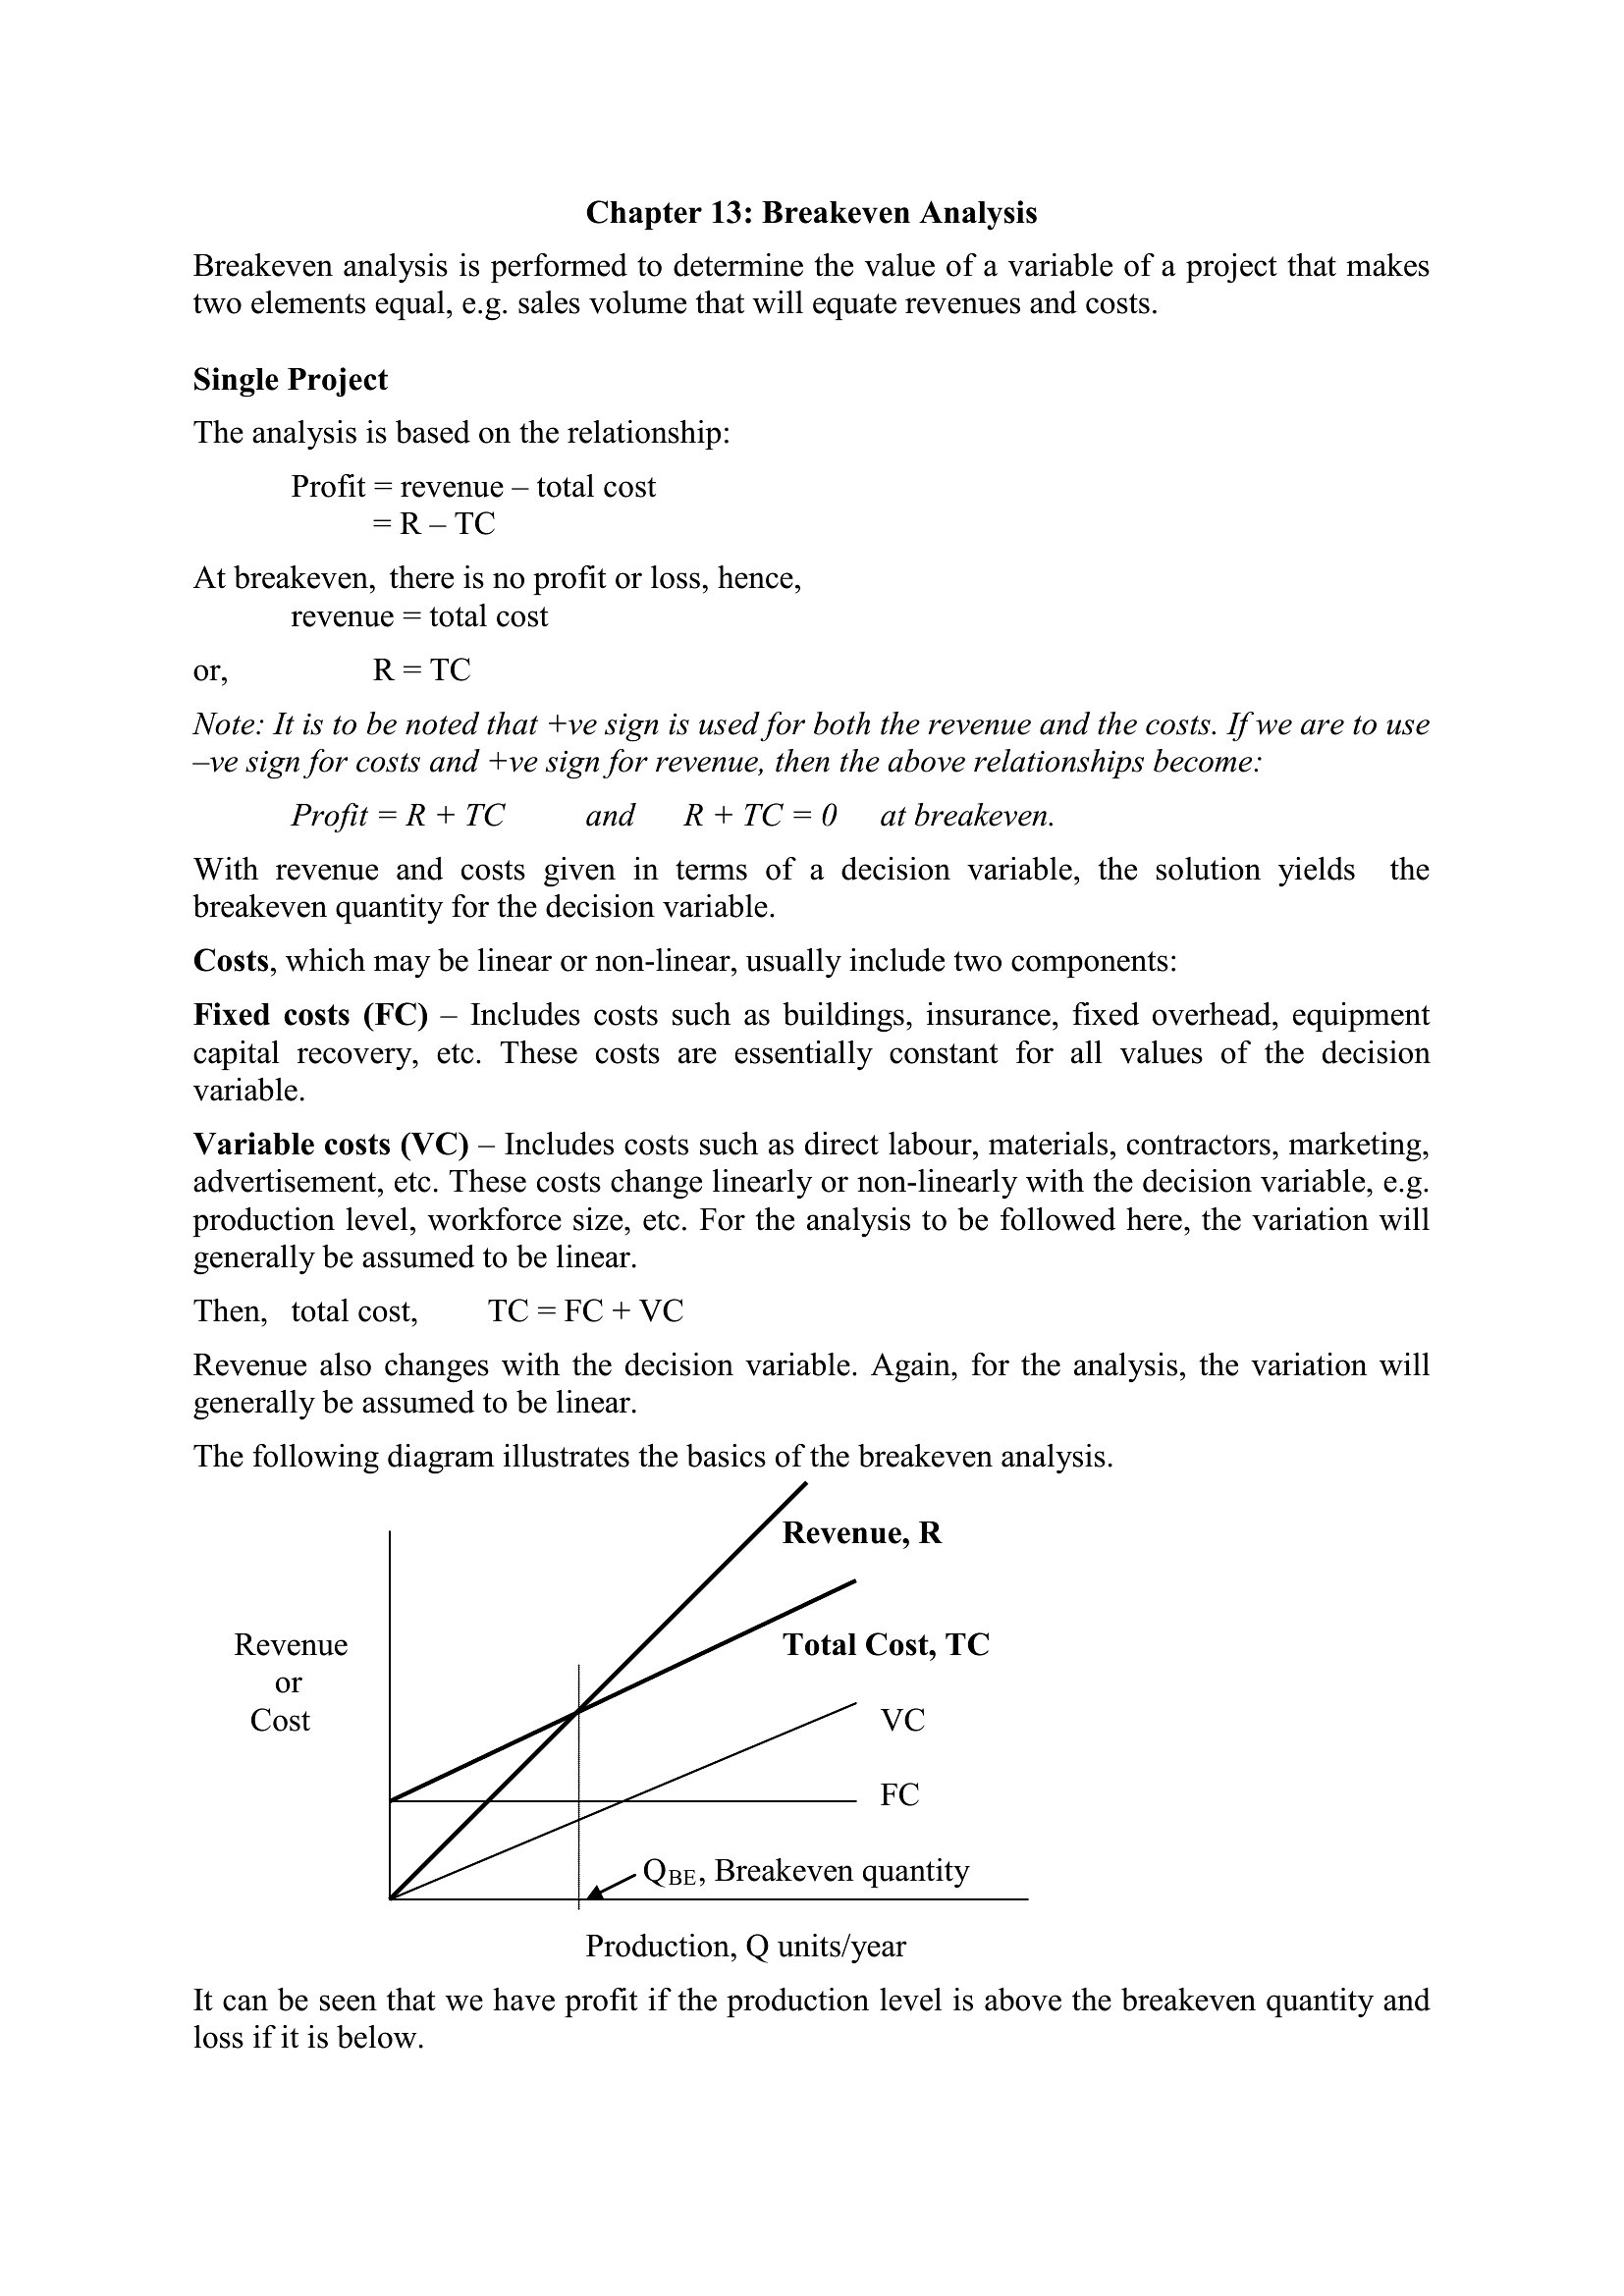
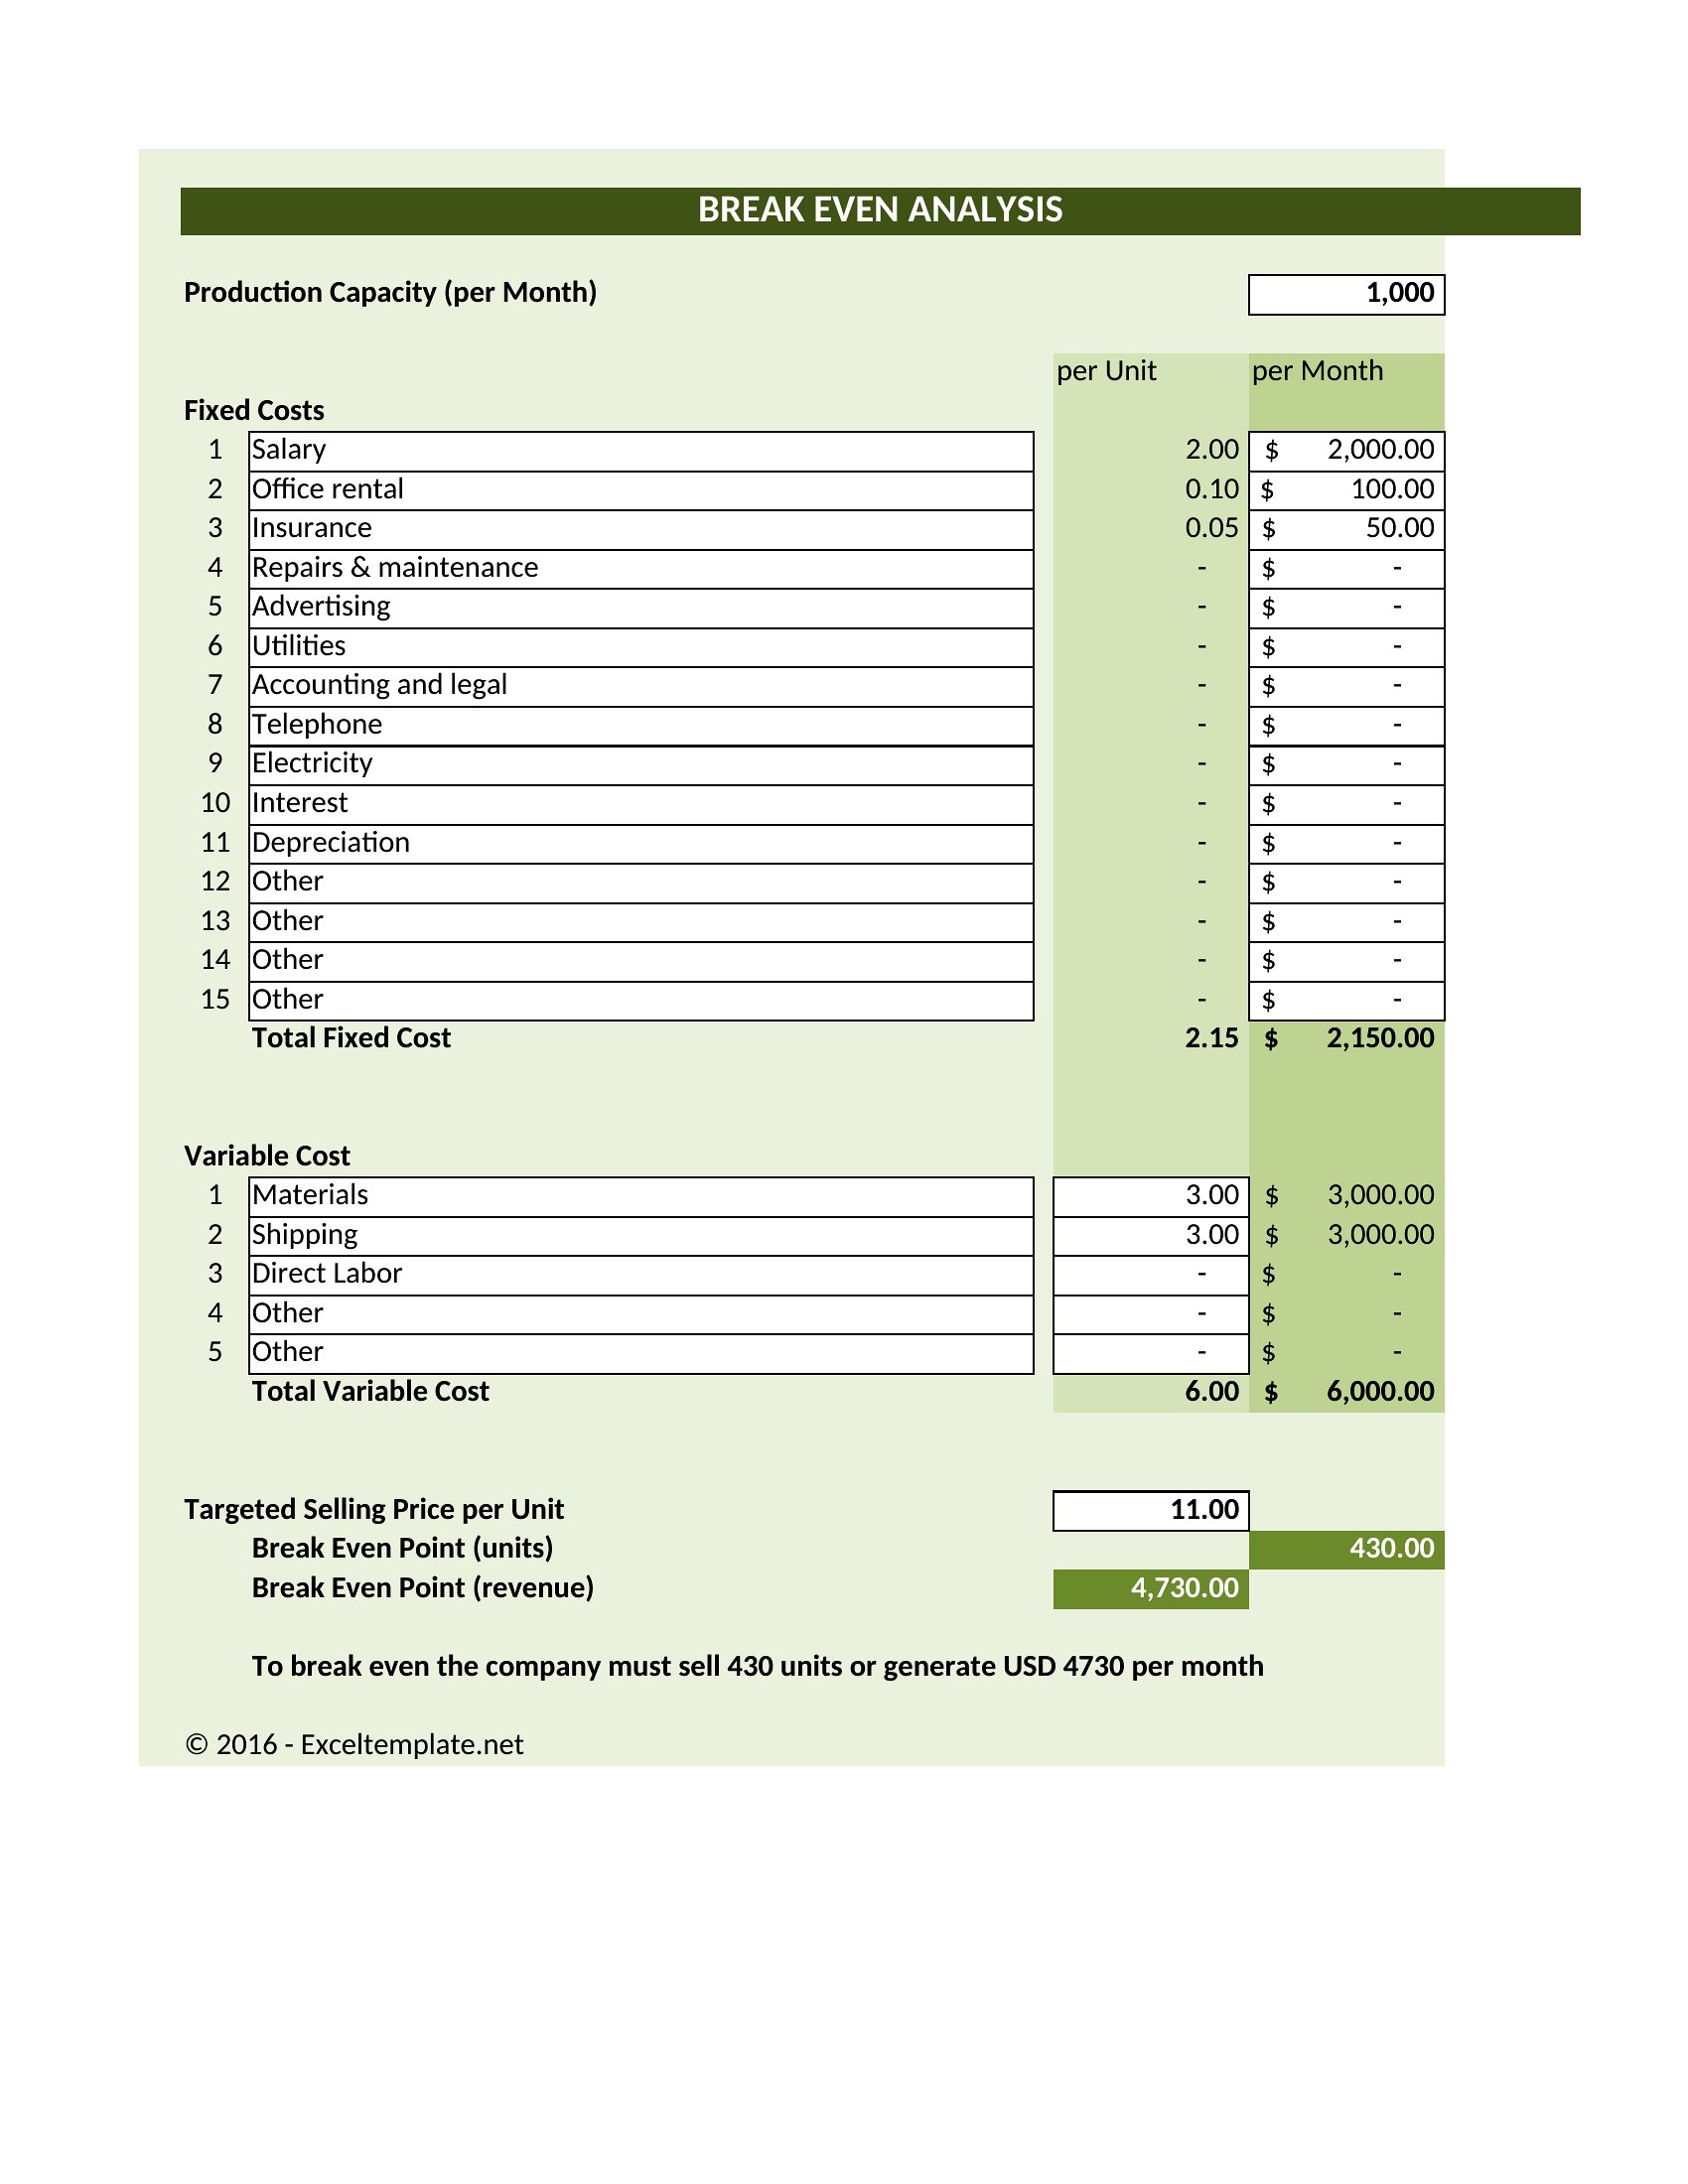
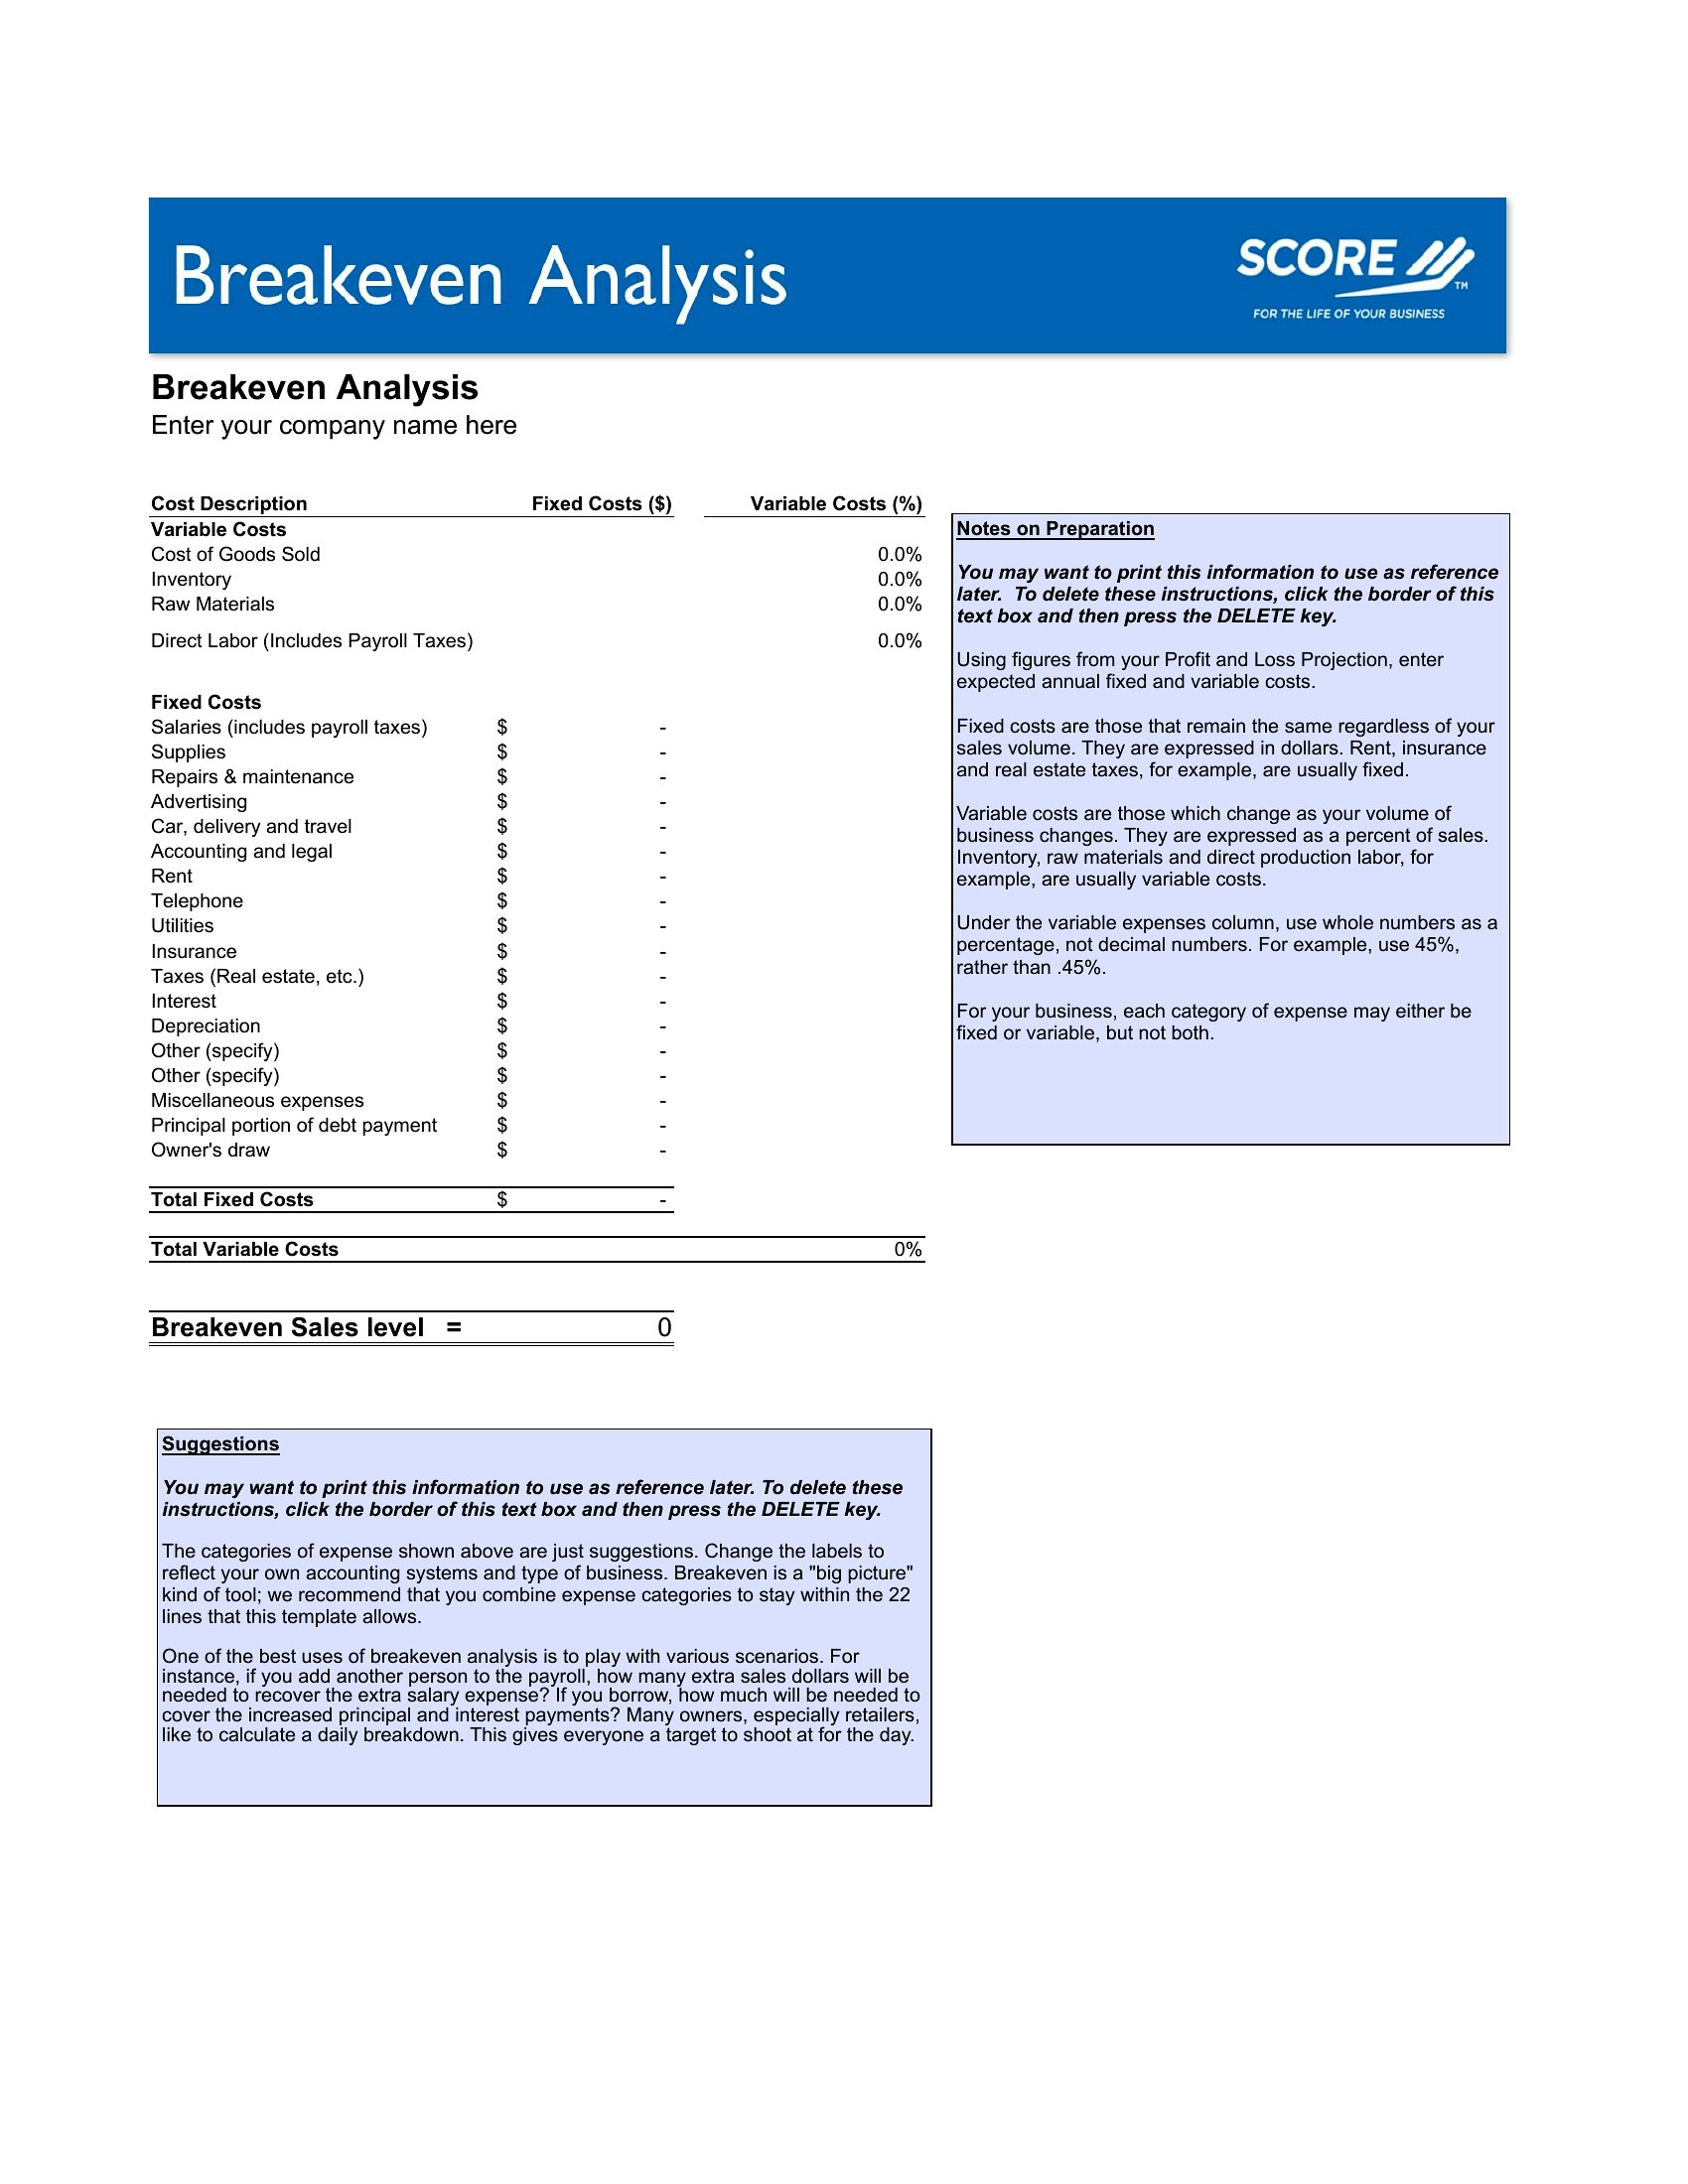
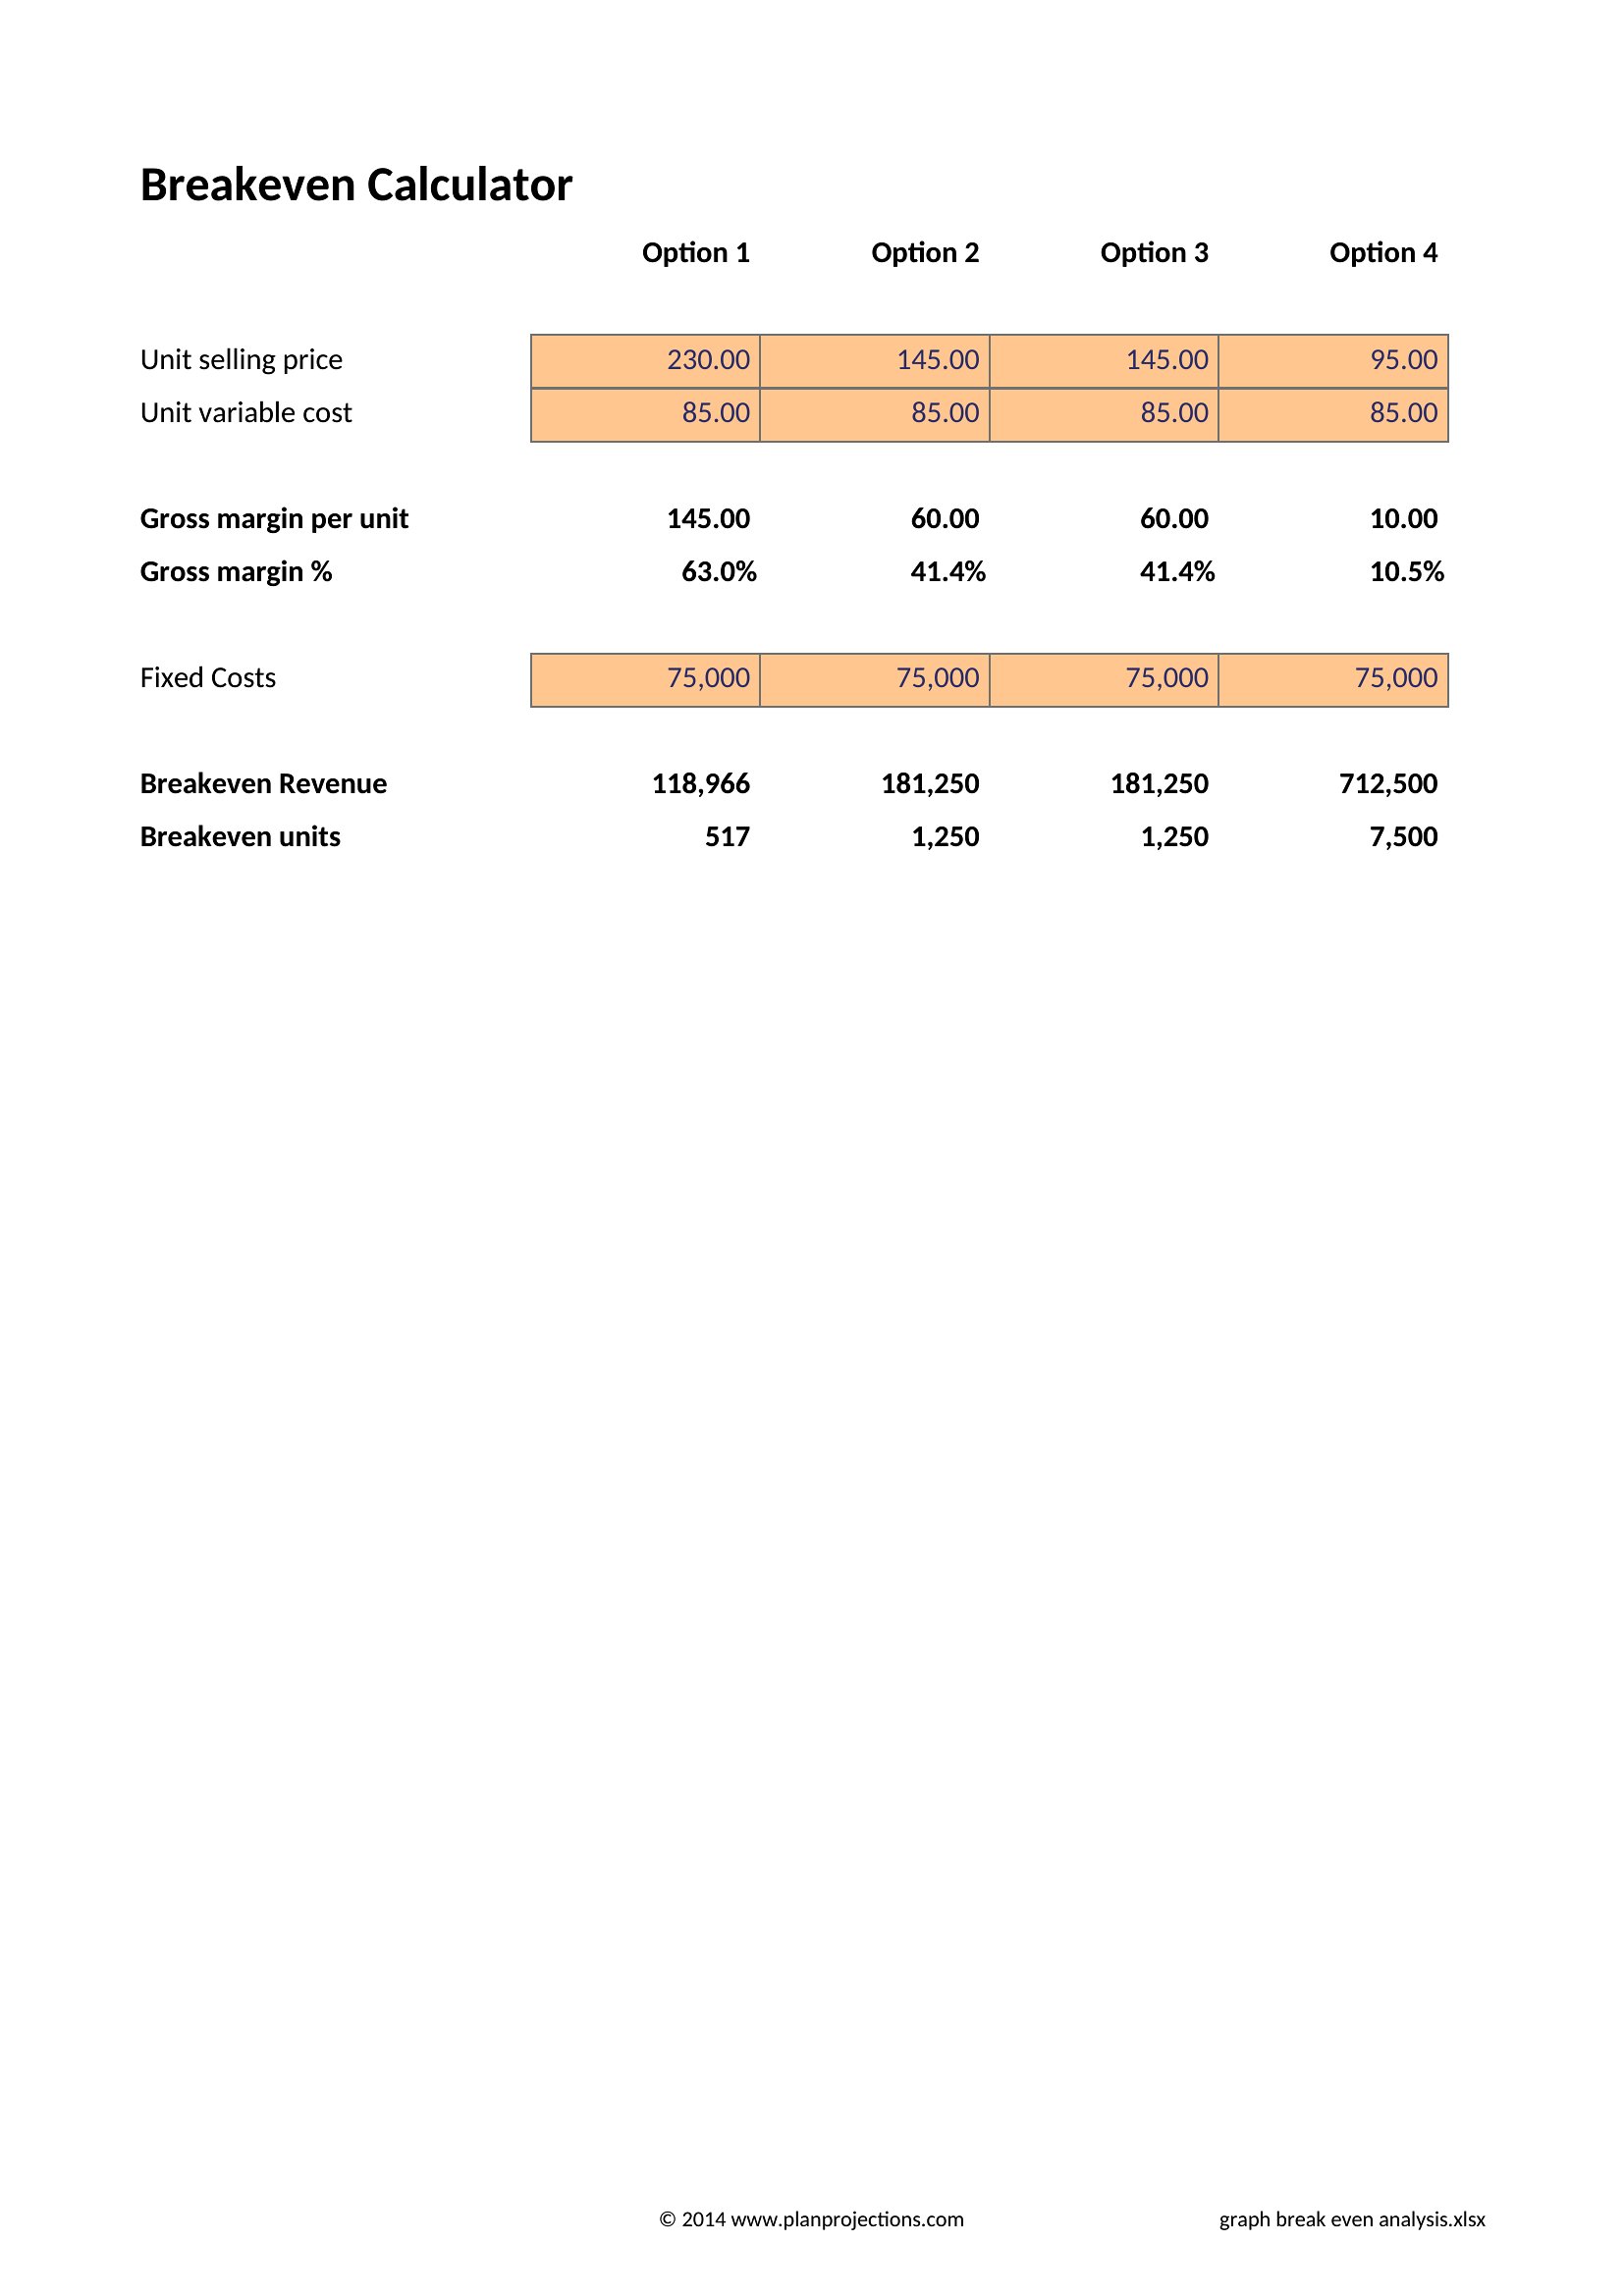
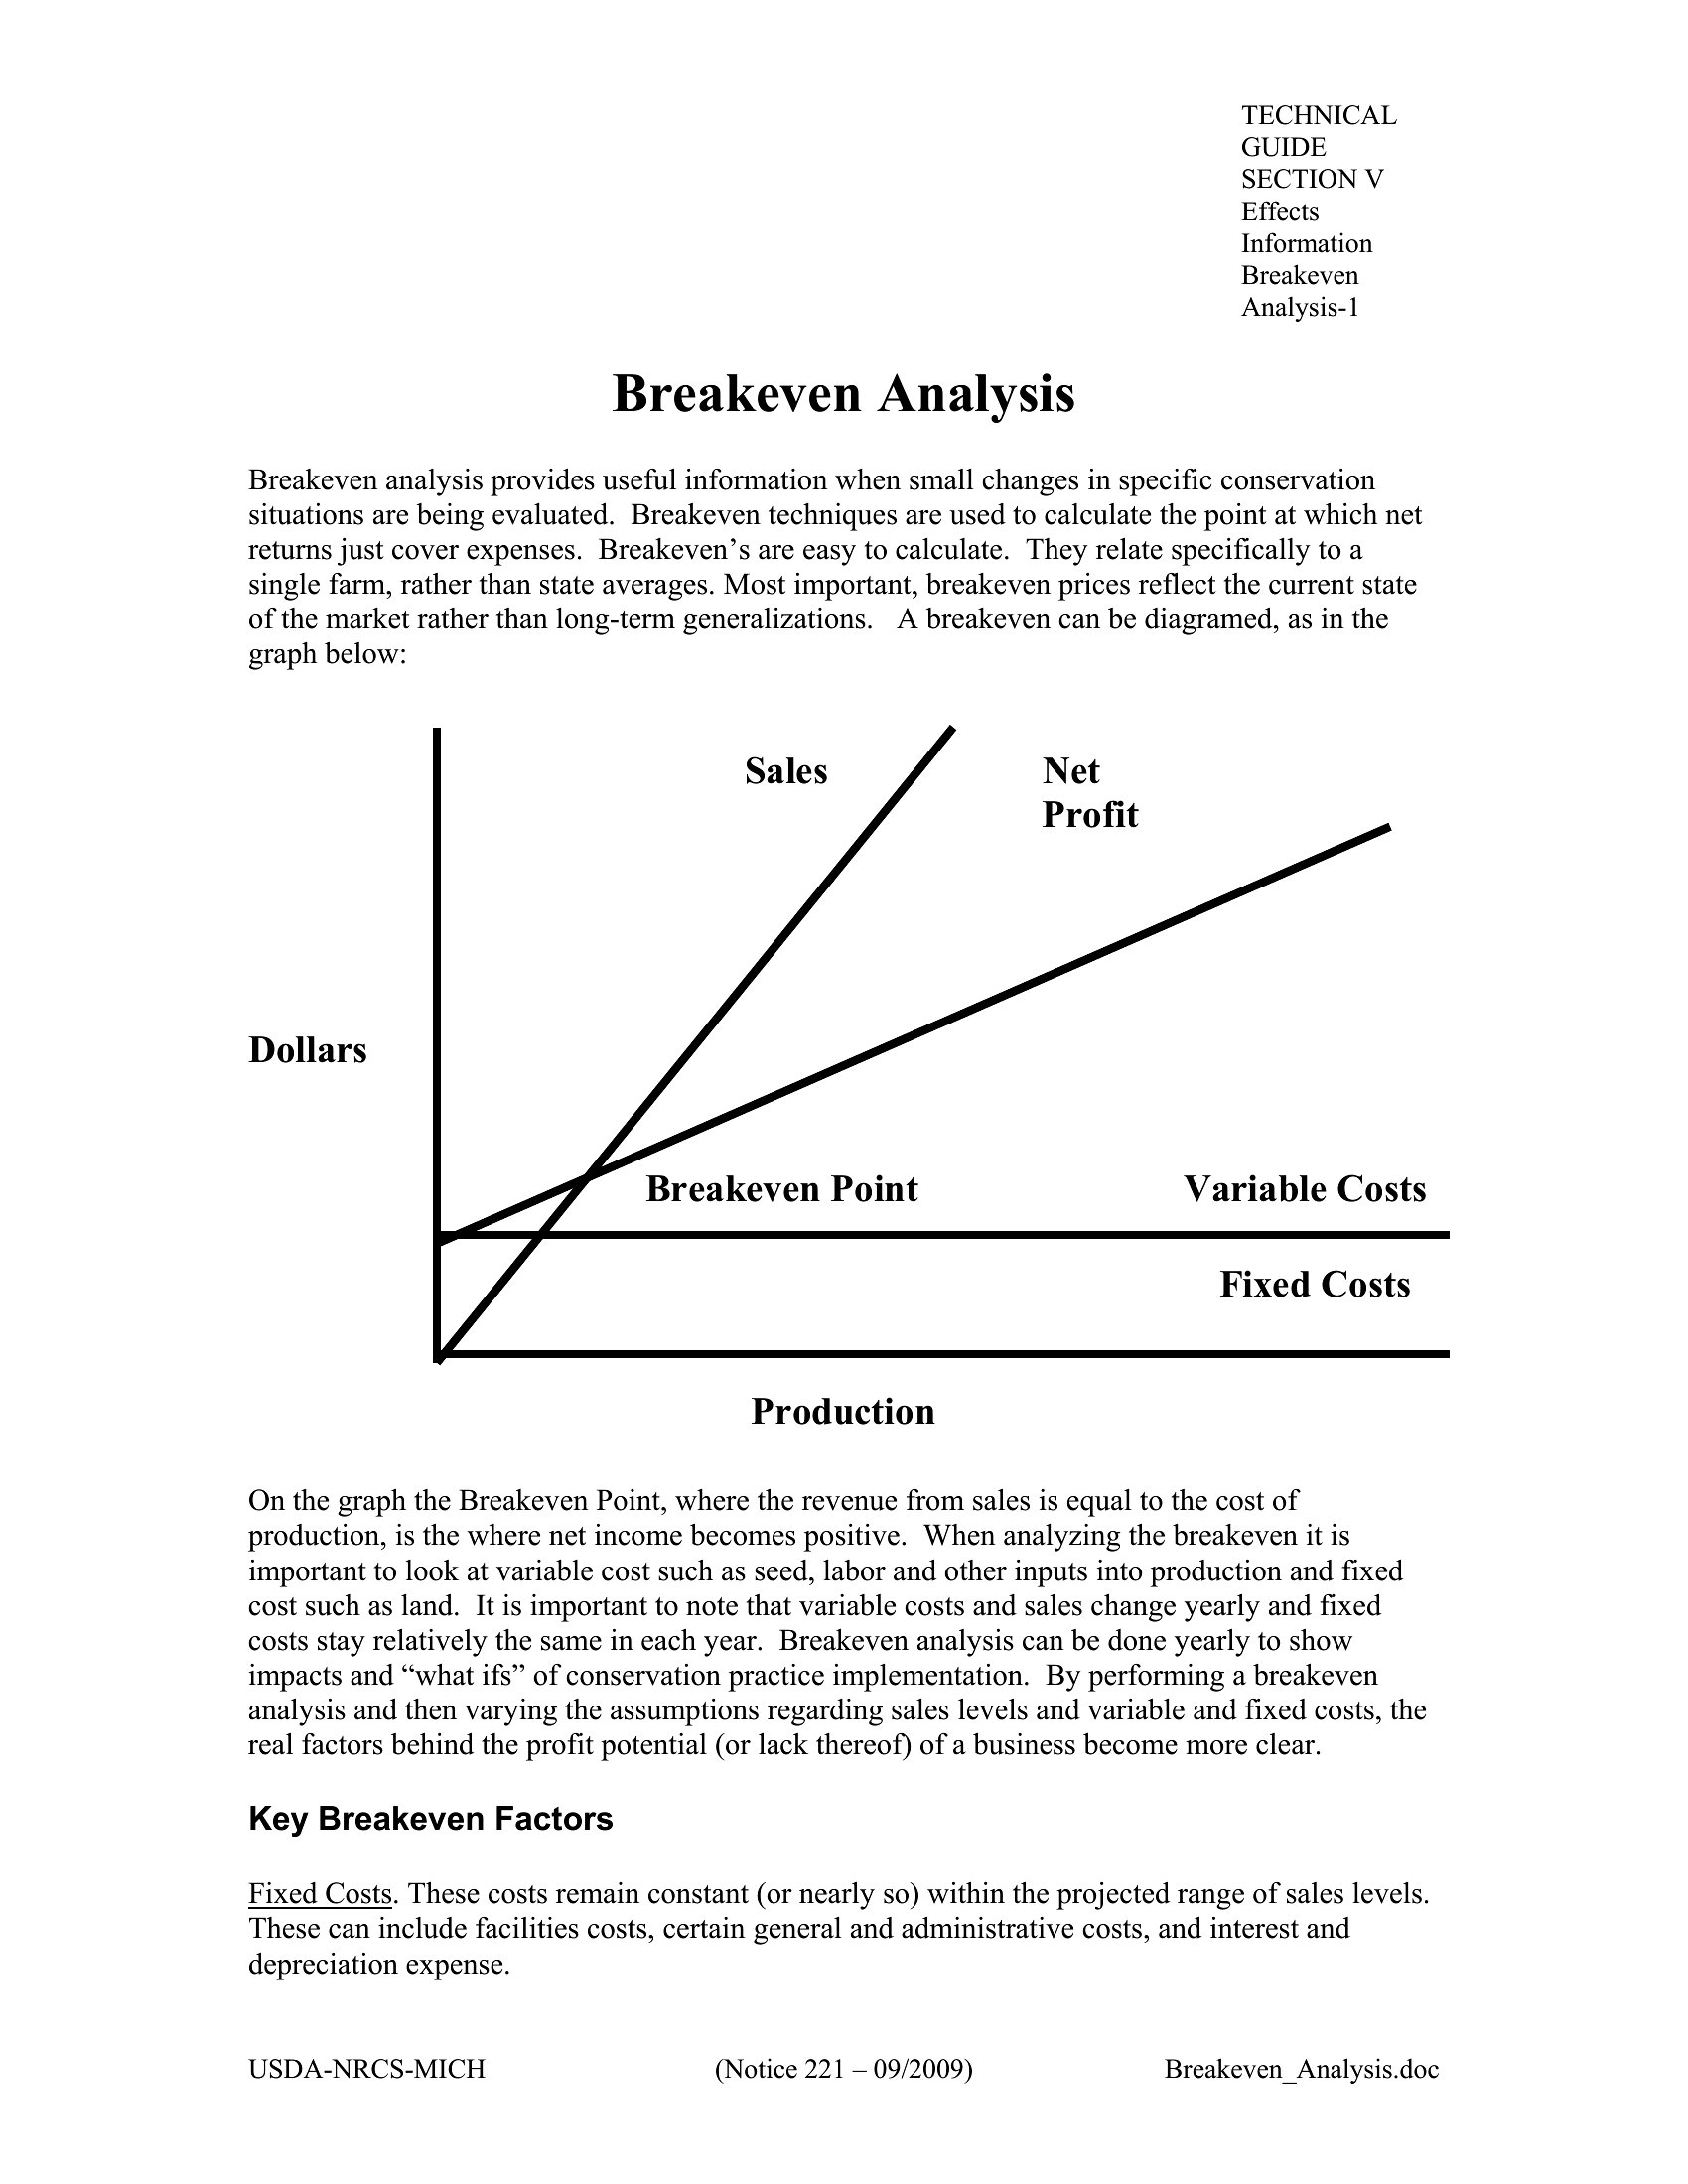
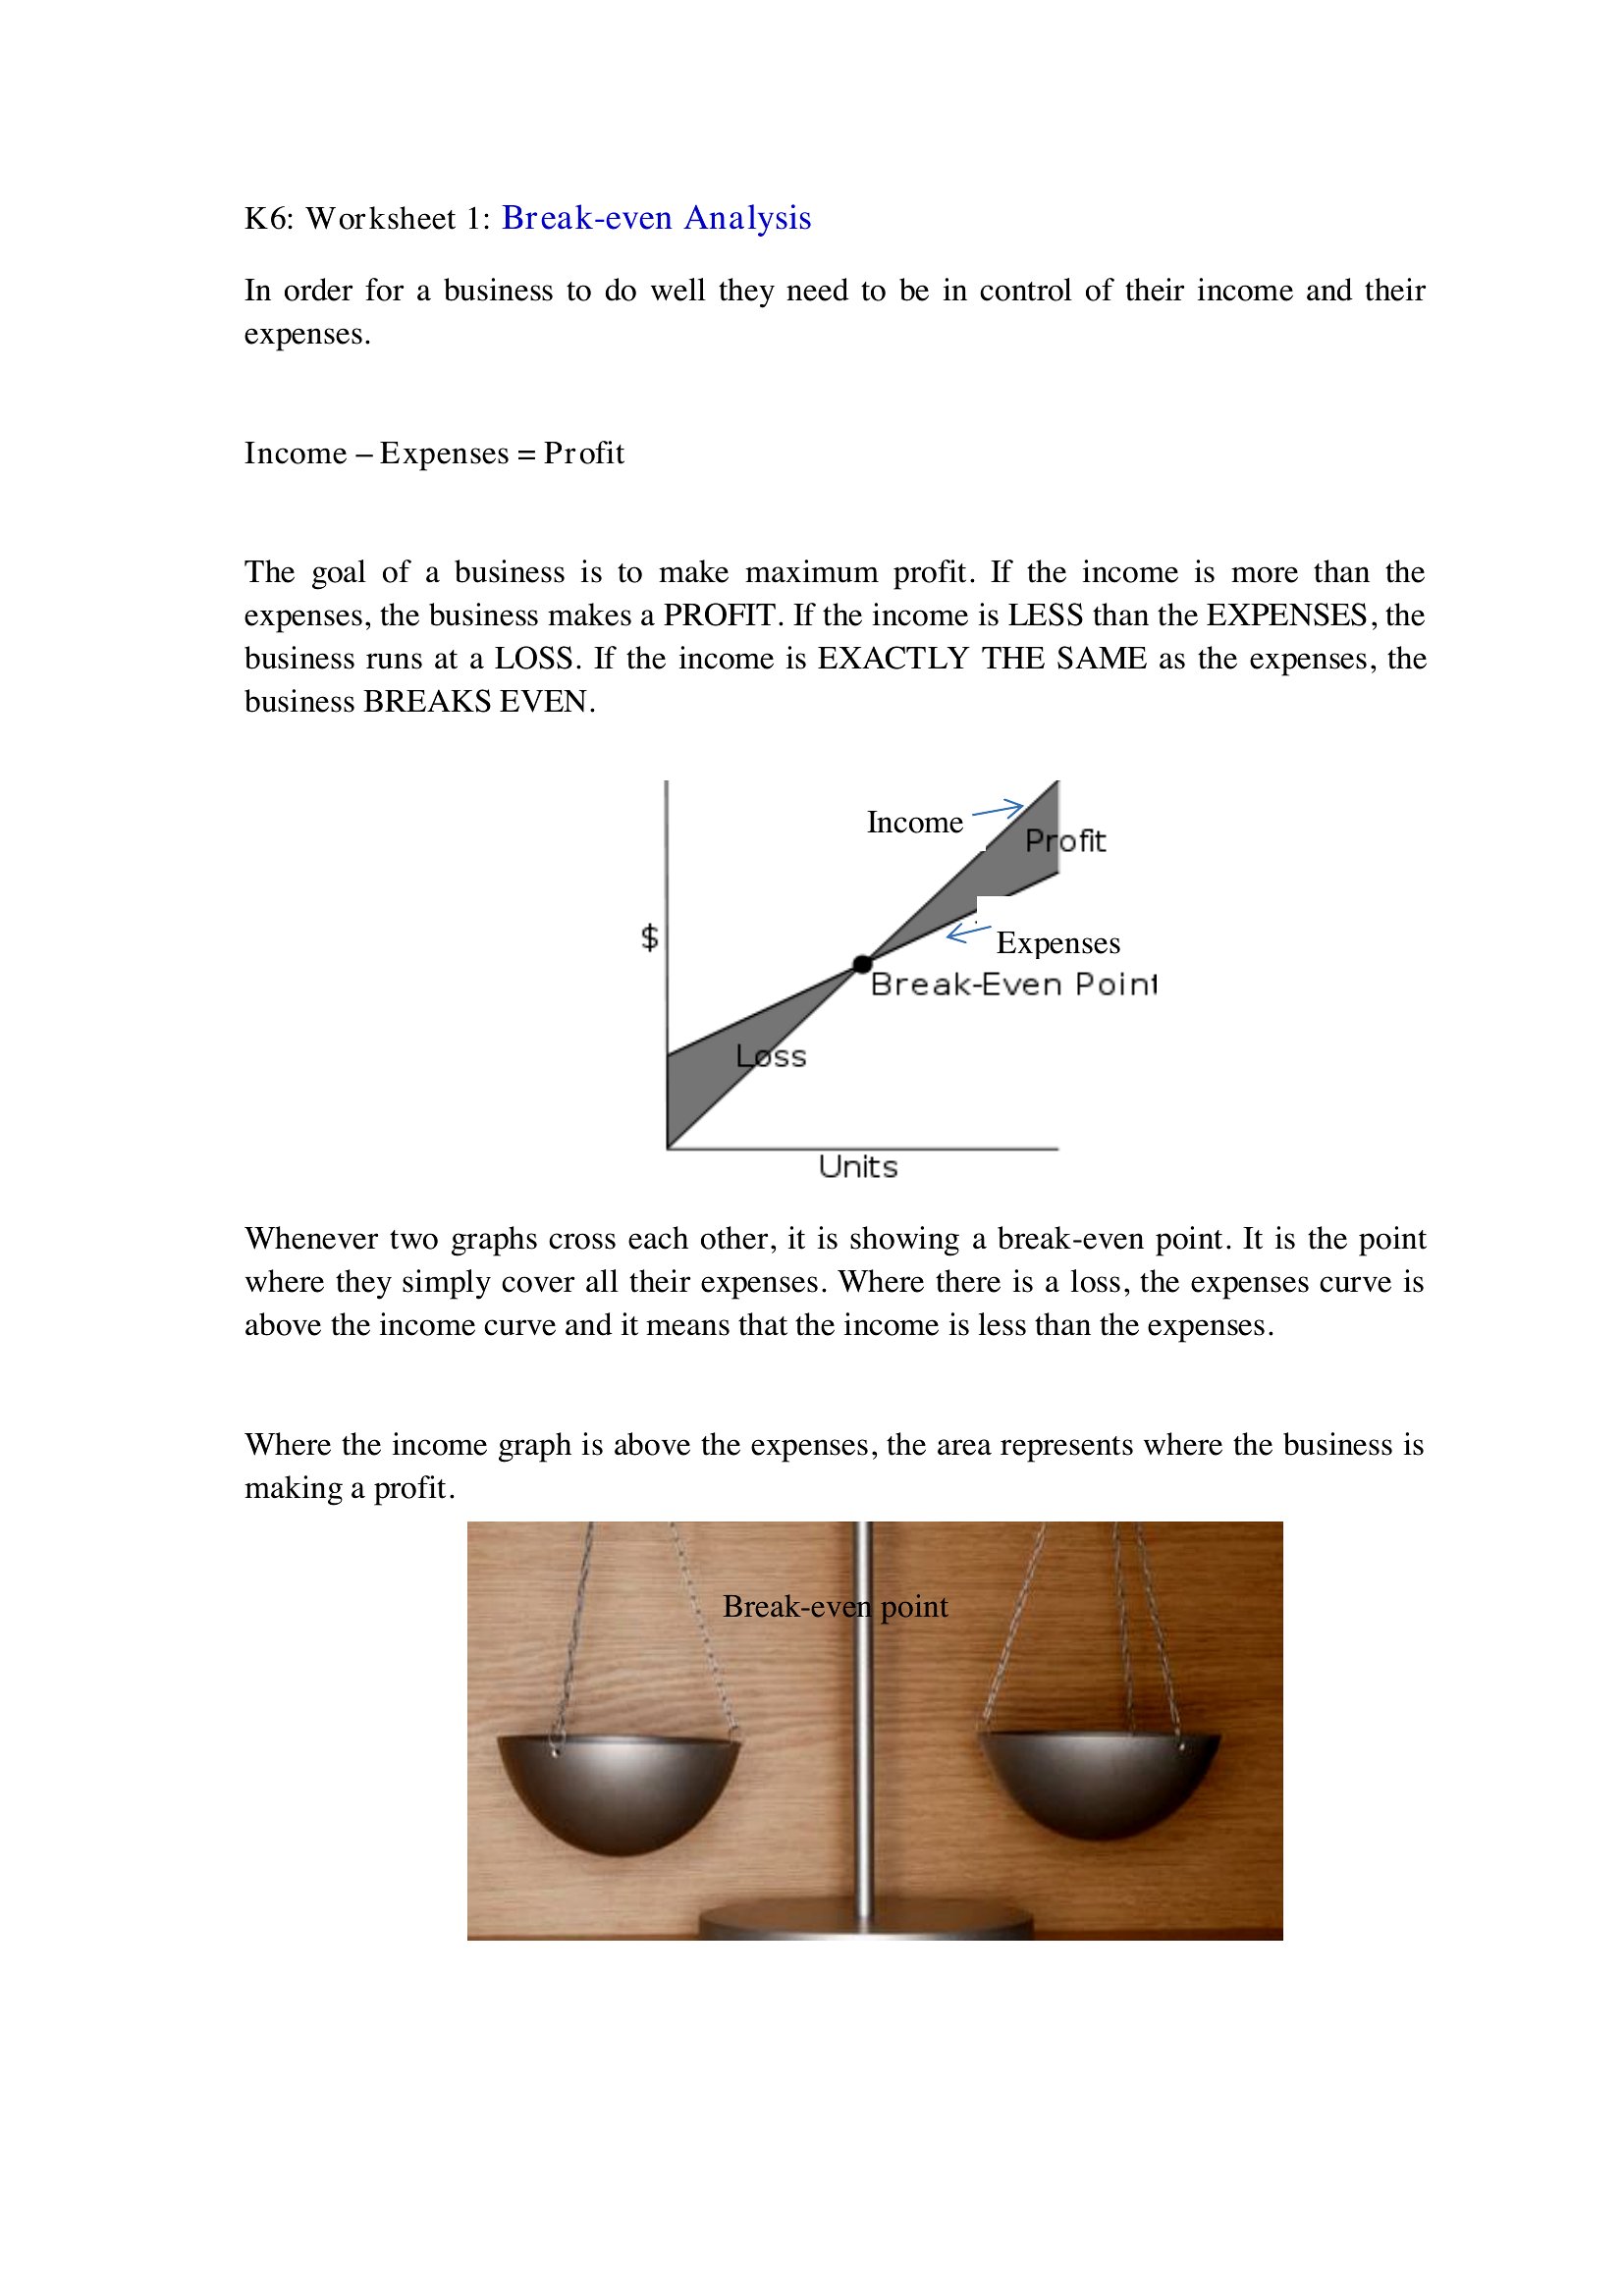
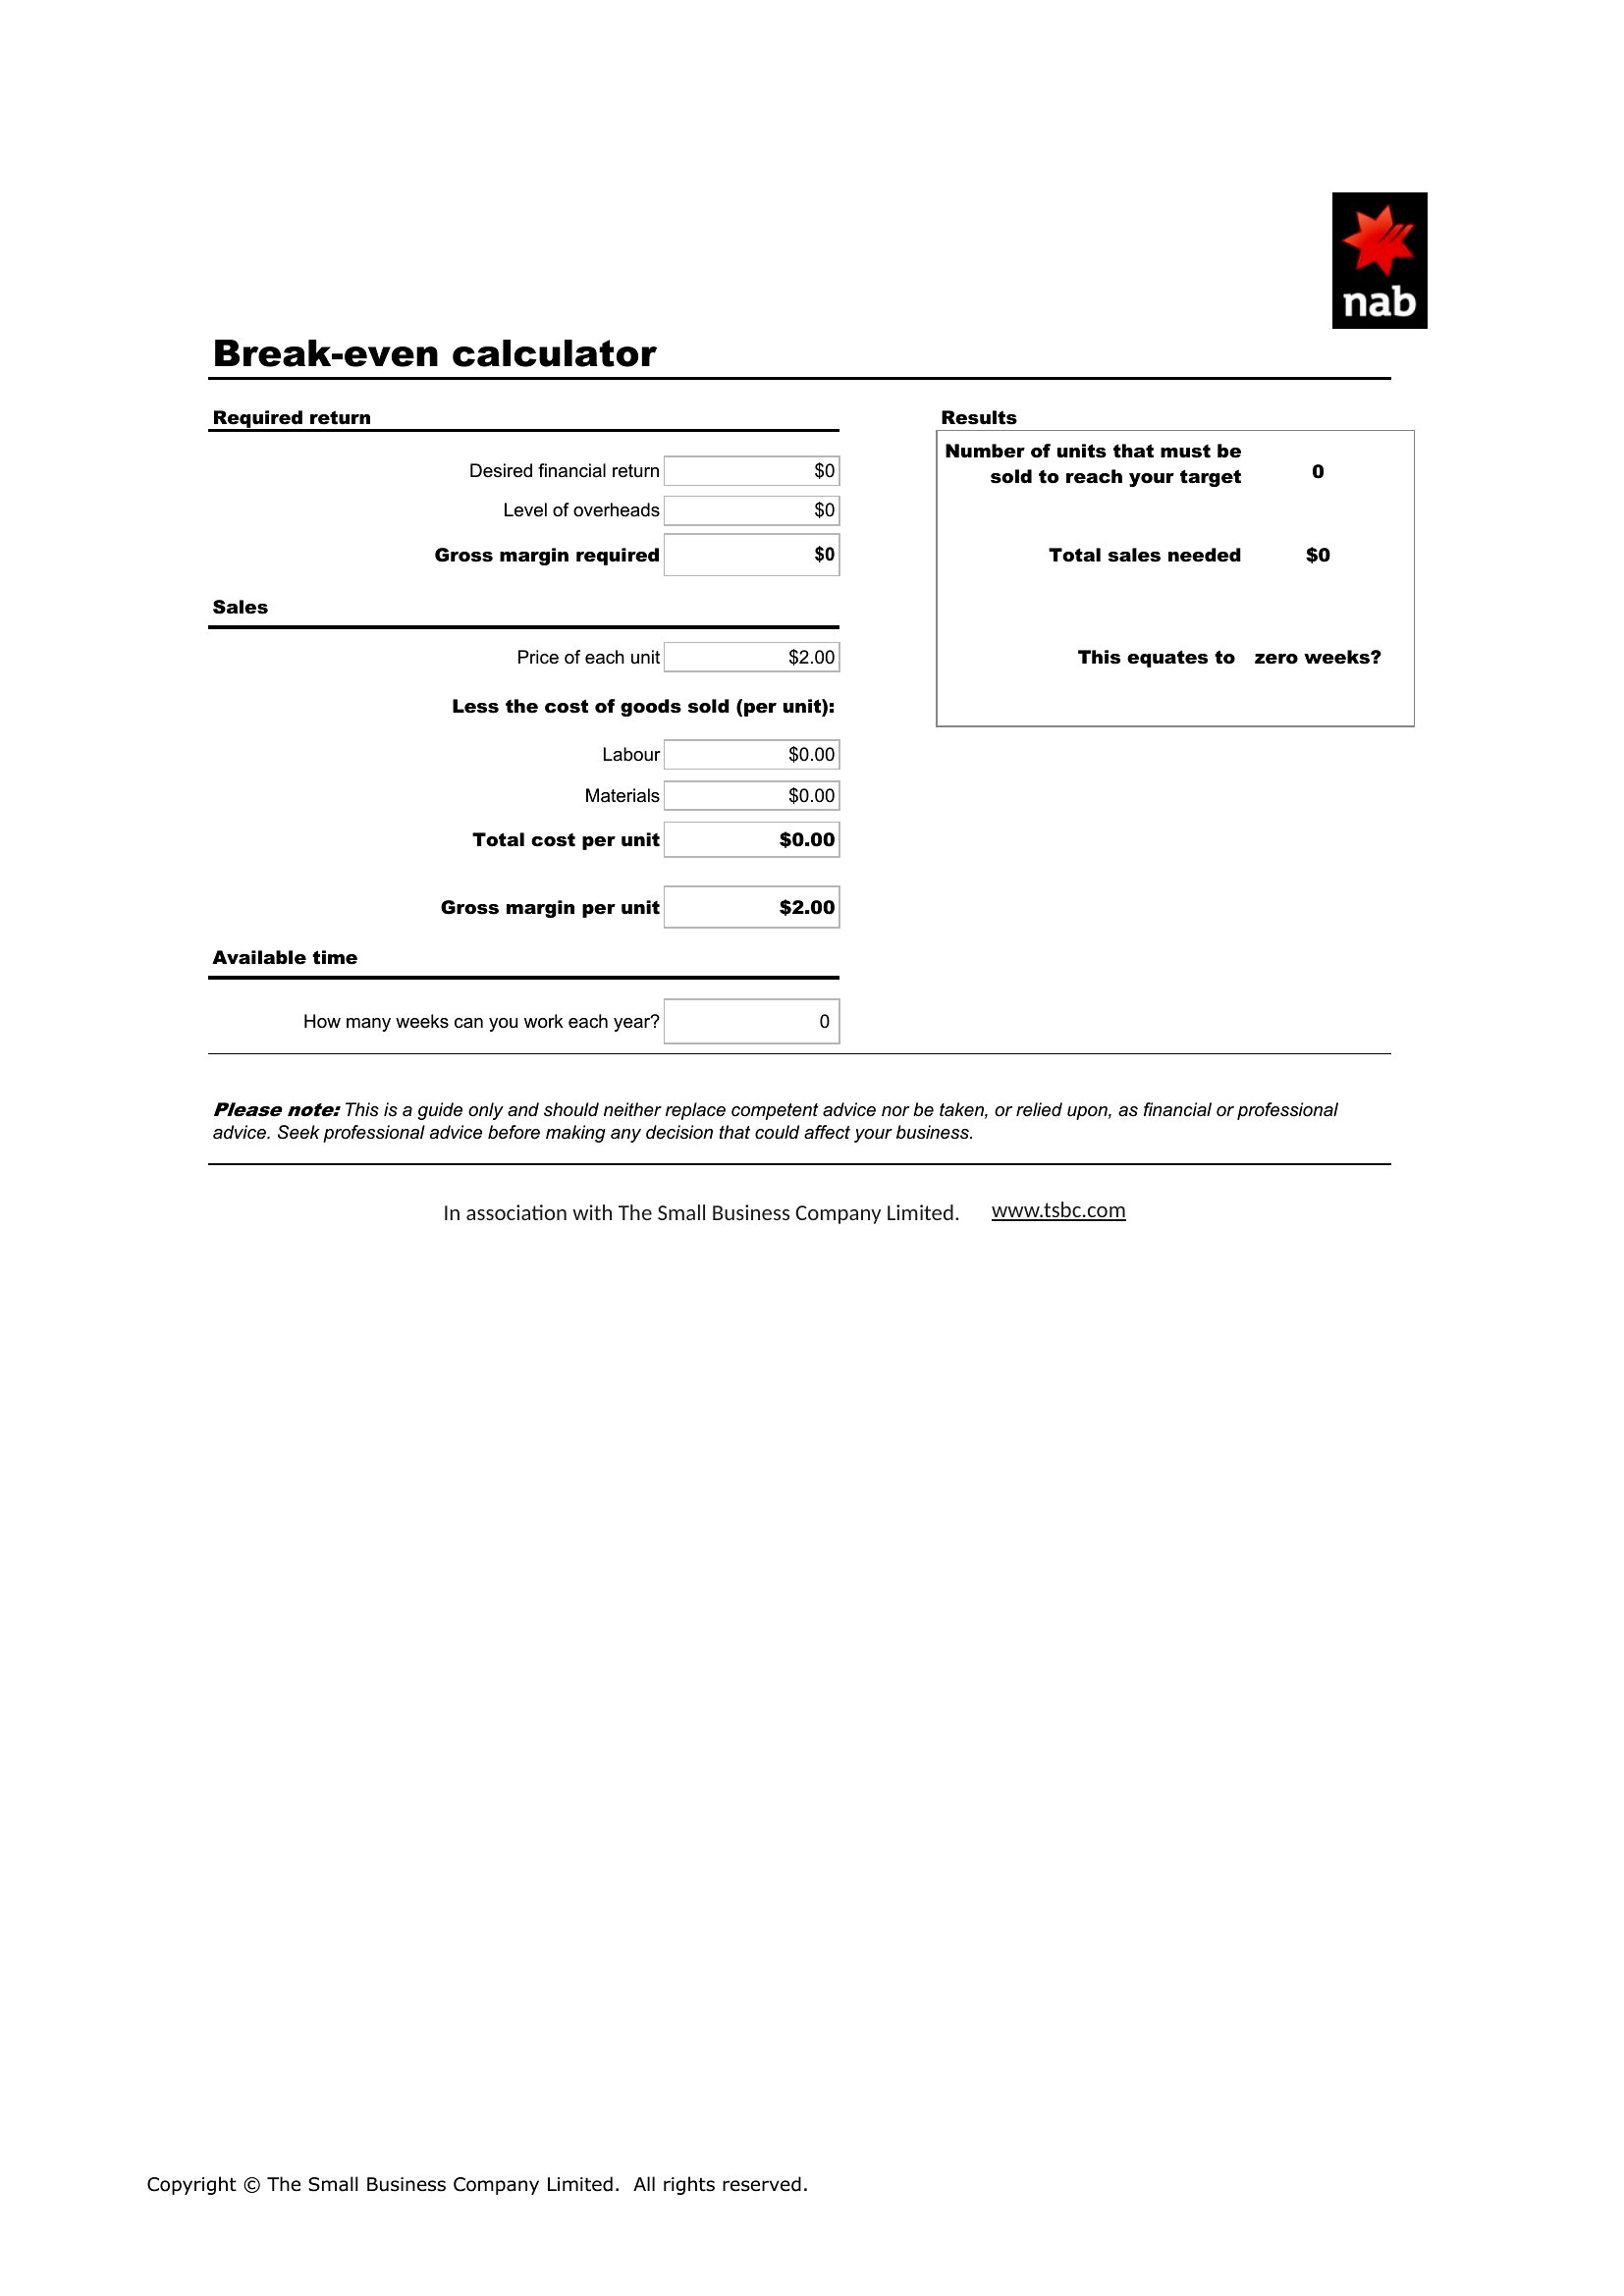
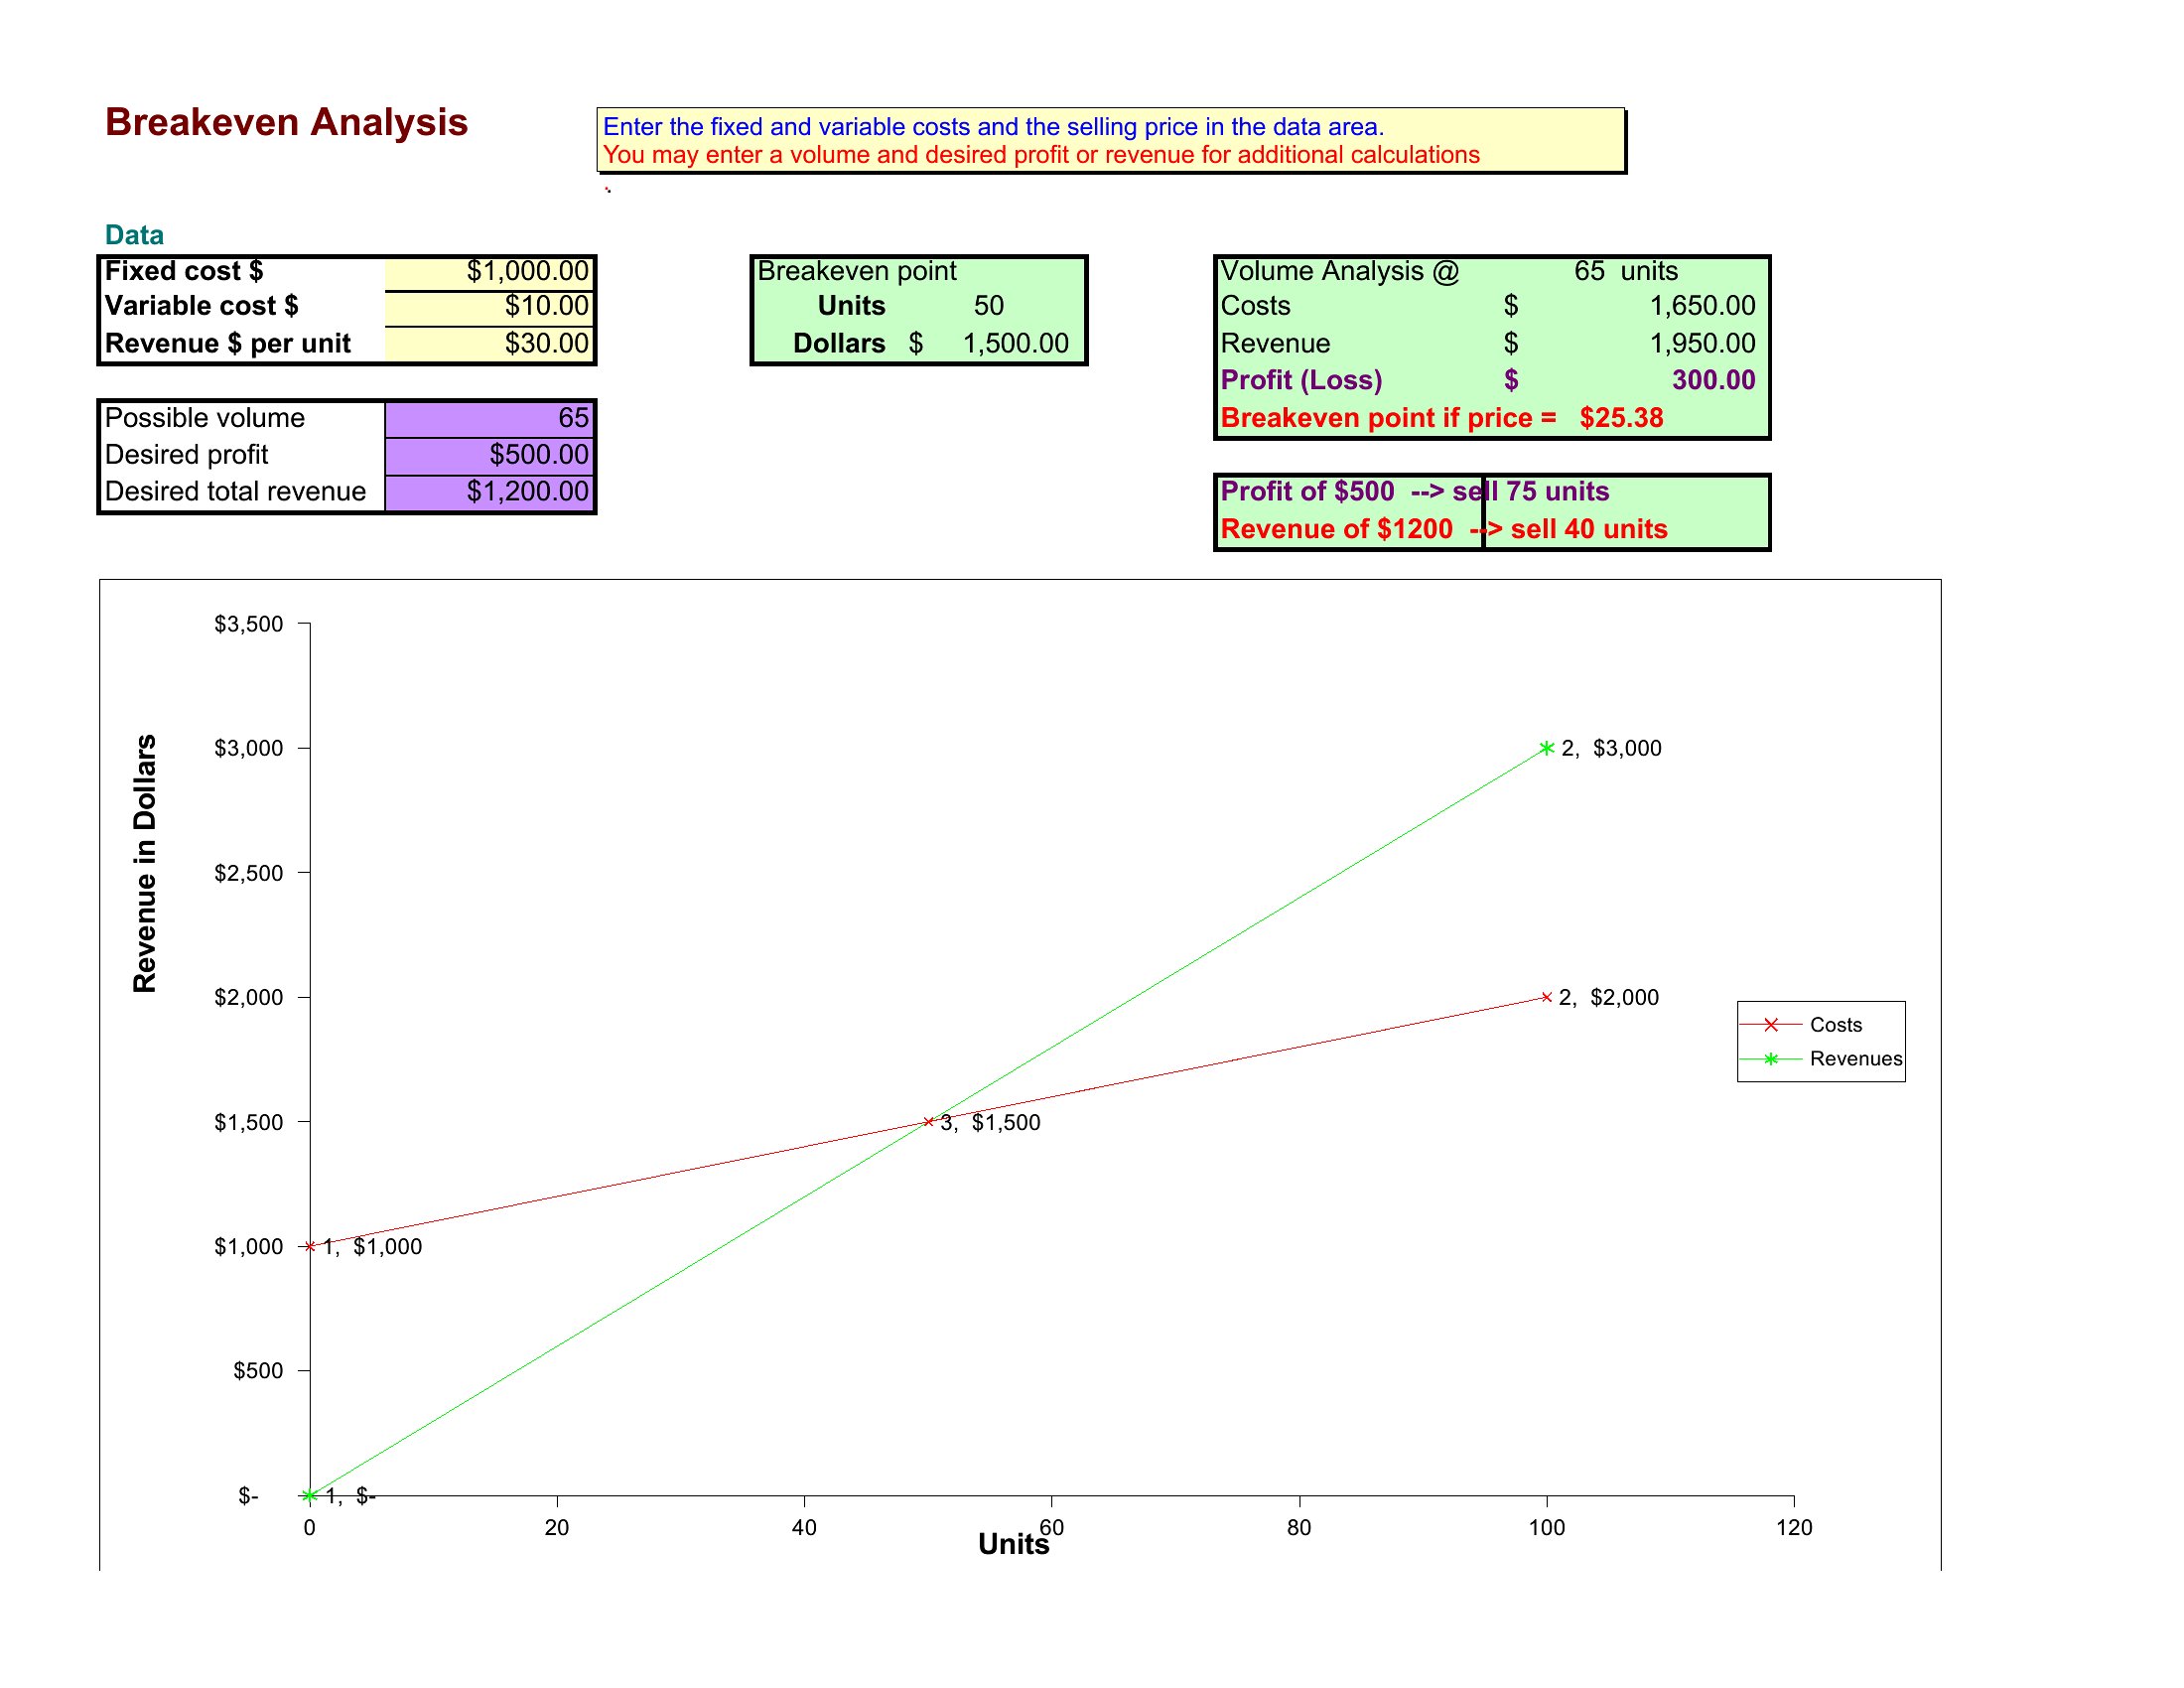
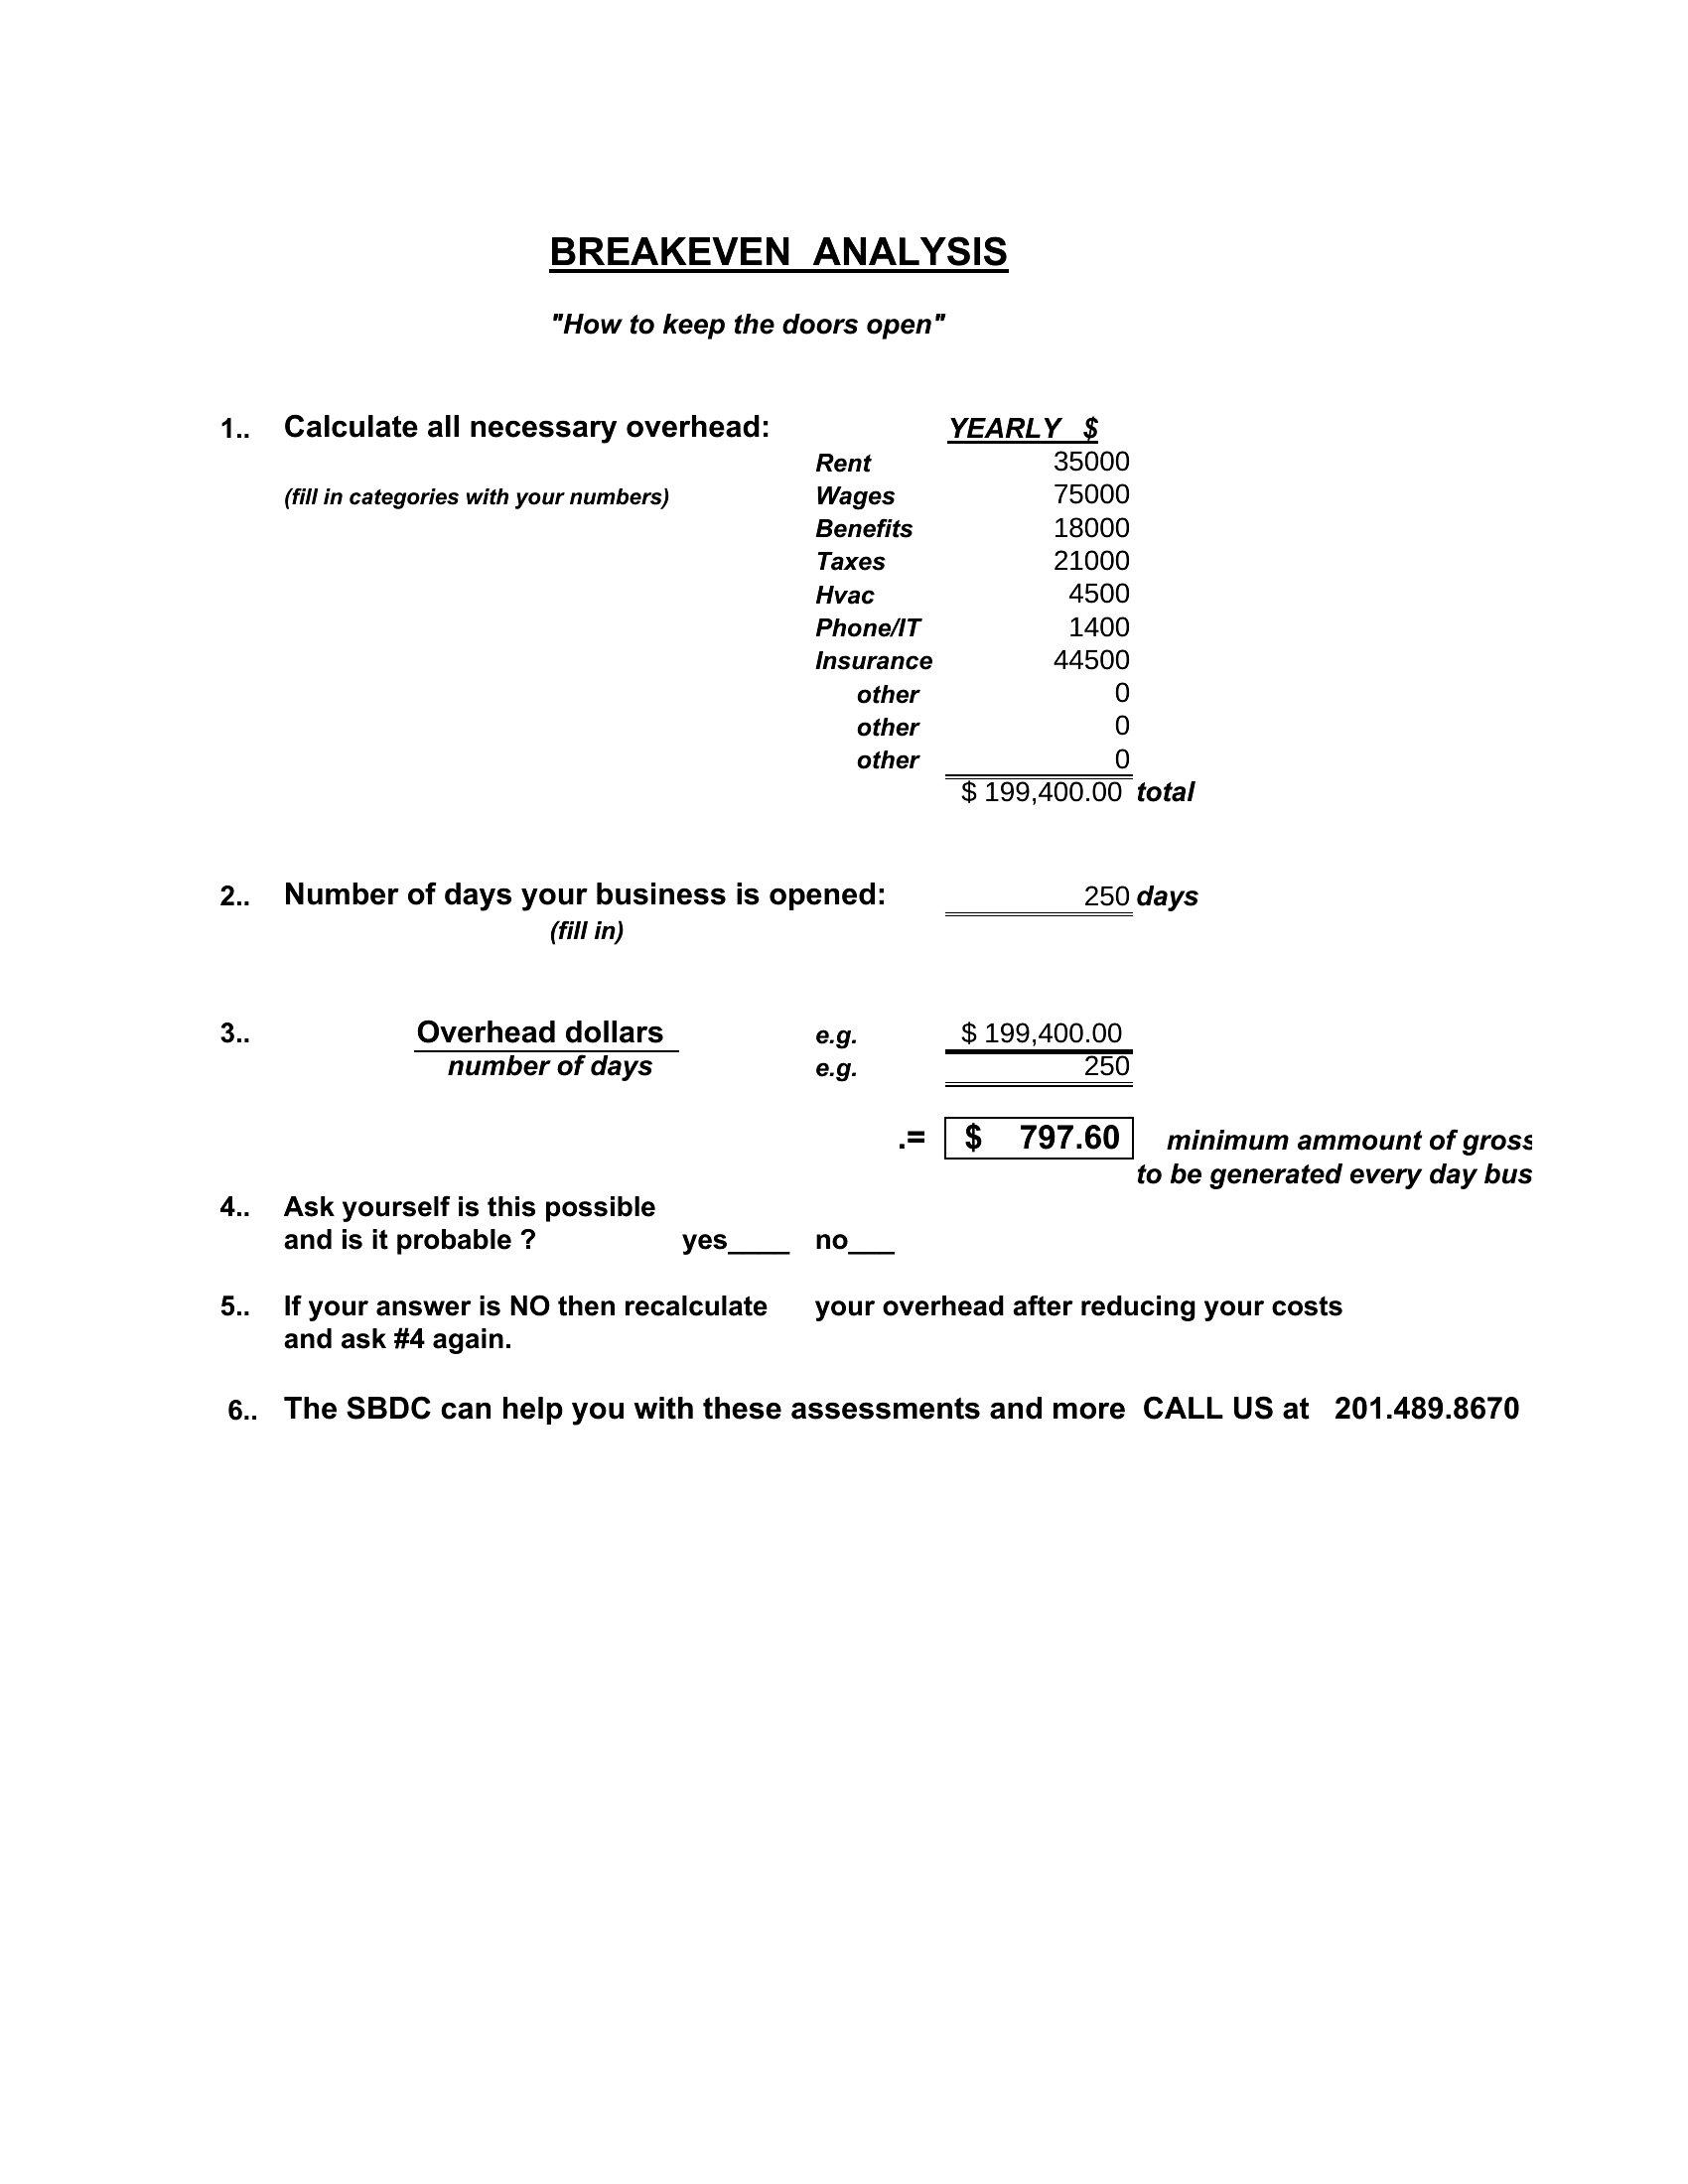
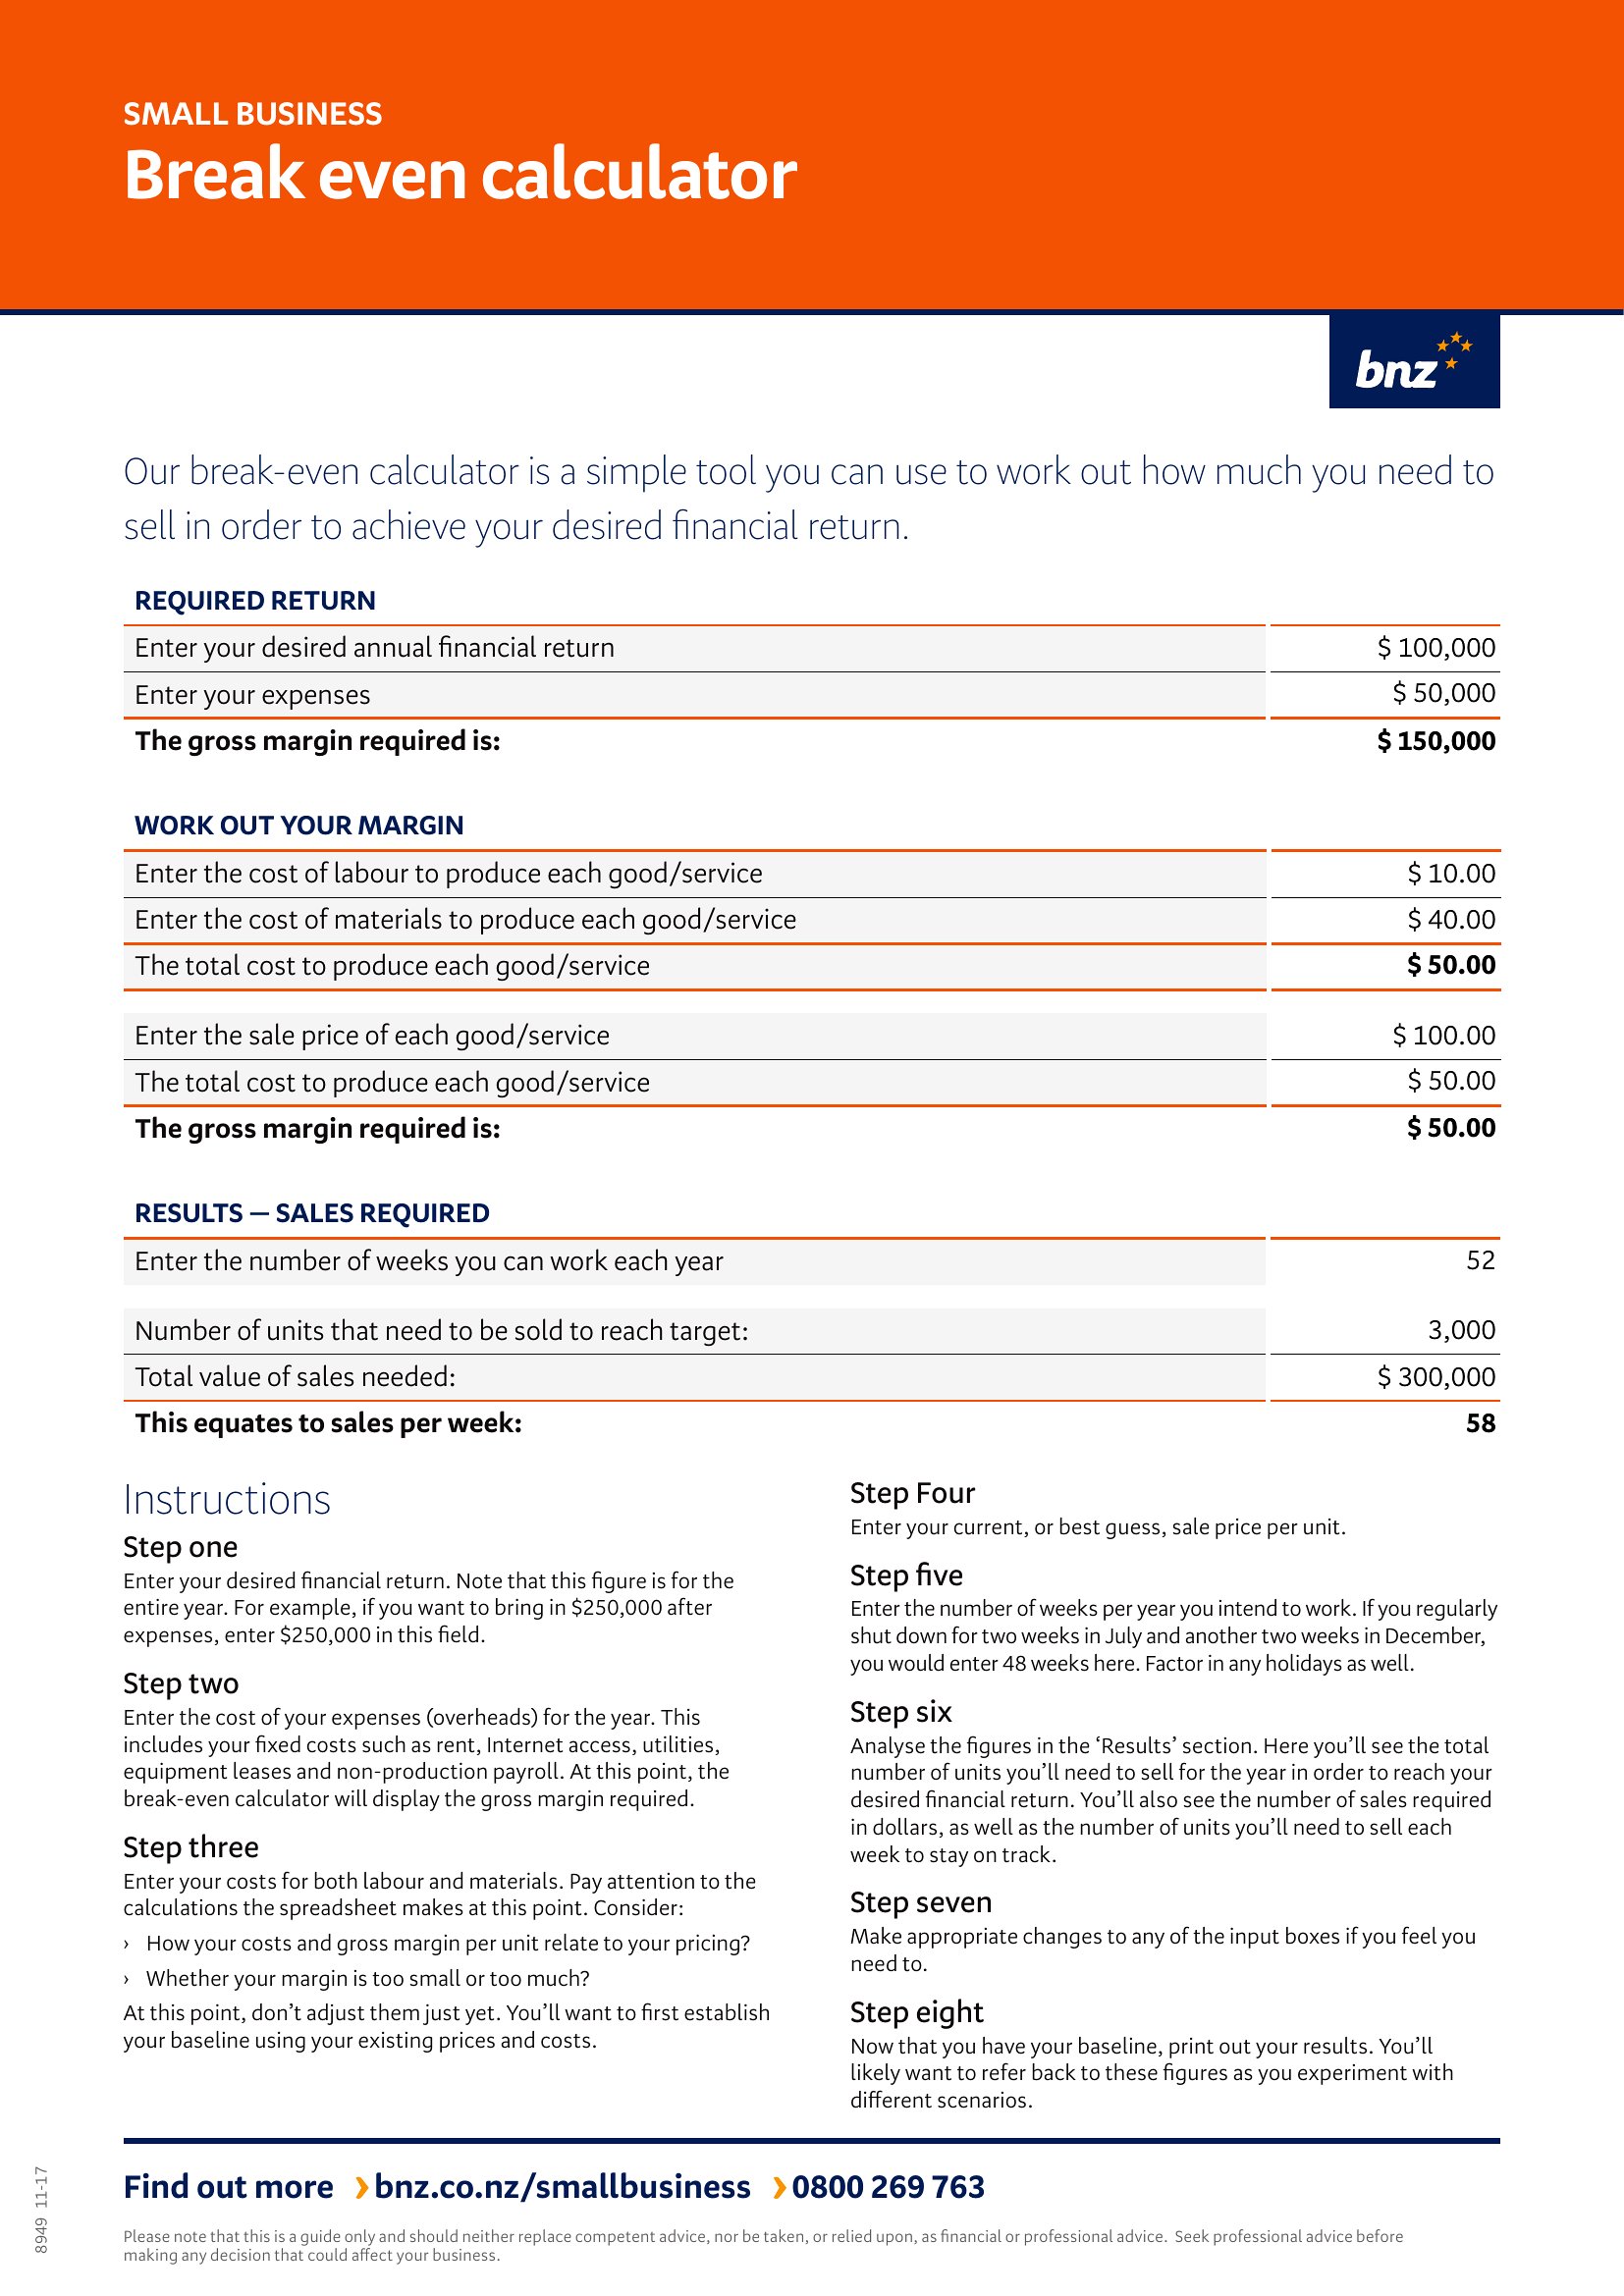
A calculator (like *Break Even Analysis Calculator Excel*) provides a numerical answer to how many units you need to sell, while graph-based templates (*Break Even Analysis Graph*) visually plot your costs, revenue, and break-even point on a chart. Use calculators for quick internal checks, and graphs when presenting to investors or teams who benefit from seeing trends at a glance.
Comments
Join the conversation
Sign in to share your thoughts and leave a comment on this resource.